
Hypermetabolism and Substrate Utilization Rates in Pheochromocytoma and Functional Paraganglioma

 , , , , ,
Abstract
:1. Introduction
2. Materials and Methods
2.1. Energy Metabolism and Body Fat Mass Measurement
2.2. Statistical Analysis
3. Results
4. Discussion
5. Conclusions
Supplementary Materials
Author Contributions
Funding
Institutional Review Board Statement
Informed Consent Statement
Data Availability Statement
Conflicts of Interest
References
- Lenders, J.W.; Eisenhofer, G.; Mannelli, M.; Pacak, K. Phaeochromocytoma. Lancet 2005, 366, 665–675. [Google Scholar] [CrossRef]
- Pacak, K.; Tella, S. Pheochromocytoma and paraganglioma. In Endotext; Feingold, K.R., Anawalt, B., Boyce, A., Chrousos, G., Dungan, K., Grossman, A., Hershman, J.M., Kaltsas, G., Koch, C., Kopp, P., et al., Eds.; South MDText.com, Inc.: Dartmouth, MA, USA, 2018. Available online: https://www.ncbi.nlm.nih.gov/books/NBK481899/ (accessed on 1 June 2022).
- Petrak, O.; Haluzikova, D.; Kavalkova, P.; Strauch, B.; Rosa, J.; Holaj, R.; Brabcova Vrankova, A.; Michalsky, D.; Haluzik, M.; Zelinka, T.; et al. Changes in energy metabolism in pheochromocytoma. J. Clin. Endocrinol. Metab. 2013, 98, 1651–1658. [Google Scholar] [CrossRef]
- Erlic, Z.; Beuschlein, F. Metabolic Alterations in Patients with Pheochromocytoma. Exp. Clin. Endocrinol. Diabetes 2019, 127, 129–136. [Google Scholar] [CrossRef]
- Barth, E.; Albuszies, G.; Baumgart, K.; Matejovic, M.; Wachter, U.; Vogt, J.; Radermacher, P.; Calzia, E. Glucose metabolism and catecholamines. Crit. Care Med. 2007, 35, S508–S518. [Google Scholar] [CrossRef]
- Gjedsted, J.; Buhl, M.; Nielsen, S.; Schmitz, O.; Vestergaard, E.T.; Tonnesen, E.; Moller, N. Effects of adrenaline on lactate, glucose, lipid and protein metabolism in the placebo controlled bilaterally perfused human leg. Acta Physiol. 2011, 202, 641–648. [Google Scholar] [CrossRef]
- De Glisezinski, I.; Larrouy, D.; Bajzova, M.; Koppo, K.; Polak, J.; Berlan, M.; Bulow, J.; Langin, D.; Marques, M.A.; Crampes, F.; et al. Adrenaline but not noradrenaline is a determinant of exercise-induced lipid mobilization in human subcutaneous adipose tissue. J. Physiol. 2009, 587, 3393–3404. [Google Scholar] [CrossRef]
- Petrák, O.; Rosa, J.; Holaj, R.; Štrauch, B.; Krátká, Z.; Kvasnička, J.; Klímová, J.; Waldauf, P.; Hamplová, B.; Markvartová, A.; et al. Blood Pressure Profile, Catecholamine Phenotype, and Target Organ Damage in Pheochromocytoma/Paraganglioma. J. Clin. Endocrinol. Metab. 2019, 104, 5170–5180. [Google Scholar] [CrossRef]
- Eisenhofer, G.; Lenders, J.W.; Goldstein, D.S.; Mannelli, M.; Csako, G.; Walther, M.M.; Brouwers, F.M.; Pacak, K. Pheochromocytoma catecholamine phenotypes and prediction of tumor size and location by use of plasma free metanephrines. Clin. Chem. 2005, 51, 735–744. [Google Scholar] [CrossRef]
- Eisenhofer, G.; Timmers, H.J.; Lenders, J.W.; Bornstein, S.R.; Tiebel, O.; Mannelli, M.; King, K.S.; Vocke, C.D.; Linehan, W.M.; Bratslavsky, G.; et al. Age at diagnosis of pheochromocytoma differs according to catecholamine phenotype and tumor location. J. Clin. Endocrinol. Metab. 2011, 96, 375–384. [Google Scholar] [CrossRef]
- Bechmann, N.; Eisenhofer, G. Hypoxia-inducible Factor 2α: A Key Player in Tumorigenesis and Metastasis of Pheochromocytoma and Paraganglioma? Exp. Clin. Endocrinol. Diabetes 2022, 130, 282–289. [Google Scholar] [CrossRef] [PubMed]
- Hartmann, C.; Radermacher, P.; Wepler, M.; Nussbaum, B. Non-Hemodynamic Effects of Catecholamines. Shock 2017, 48, 390–400. [Google Scholar] [CrossRef] [PubMed]
- Batisse-Lignier, M.; Pereira, B.; Motreff, P.; Pierrard, R.; Burnot, C.; Vorilhon, C.; Maqdasy, S.; Roche, B.; Desbiez, F.; Clerfond, G.; et al. Acute and Chronic Pheochromocytoma-Induced Cardiomyopathies: Different Prognoses?: A Systematic Analytical Review. Medicine 2015, 94, e2198. [Google Scholar] [CrossRef] [PubMed]
- Klímová, J.; Mráz, M.; Kratochvílová, H.; Lacinová, Z.; Novák, K.; Michalský, D.; Kvasnička, J.; Holaj, R.; Haluzíková, D.; Doležalová, R.P.; et al. Gene Profile of Adipose Tissue of Patients with Pheochromocytoma/Paraganglioma. Biomedicines 2022, 10, 586. [Google Scholar] [CrossRef]
- Petrak, O.; Klimova, J.; Mraz, M.; Haluzikova, D.; Dolezalova, R.P.; Kratochvilova, H.; Lacinova, Z.; Novak, K.; Michalsky, D.; Waldauf, P.; et al. Pheochromocytoma With Adrenergic Biochemical Phenotype Shows Decreased GLP-1 Secretion and Impaired Glucose Tolerance. J. Clin. Endocrinol. Metab. 2020, 105, 1878–1887. [Google Scholar] [CrossRef]
- Mifflin, M.D.; St Jeor, S.T.; Hill, L.A.; Scott, B.J.; Daugherty, S.A.; Koh, Y.O. A new predictive equation for resting energy expenditure in healthy individuals. Am. J. Clin. Nutr. 1990, 51, 241–247. [Google Scholar] [CrossRef] [PubMed]
- Westenskow, D.R.; Schipke, C.A.; Raymond, J.L.; Saffle, J.R.; Becker, J.M.; Young, E.W.; Cutler, C.A. Calculation of metabolic expenditure and substrate utilization from gas exchange measurements. JPEN J. Parenter. Enter. Nutr. 1988, 12, 20–24. [Google Scholar] [CrossRef]
- Elia, M.; Ritz, P.; Stubbs, R.J. Total energy expenditure in the elderly. Eur. J. Clin. Nutr. 2000, 54, S92–S103. [Google Scholar] [CrossRef]
- Matthews, D.E.; Pesola, G.; Campbell, R.G. Effect of epinephrine on amino acid and energy metabolism in humans. Am. J. Physiol. 1990, 258, E948–E956. [Google Scholar] [CrossRef]
- Bessey, P.Q.; Watters, J.M.; Aoki, T.T.; Wilmore, D.W. Combined hormonal infusion simulates the metabolic response to injury. Ann. Surg. 1984, 200, 264–281. [Google Scholar] [CrossRef]
- Ratheiser, K.M.; Brillon, D.J.; Campbell, R.G.; Matthews, D.E. Epinephrine produces a prolonged elevation in metabolic rate in humans. Am. J. Clin. Nutr. 1998, 68, 1046–1052. [Google Scholar] [CrossRef]
- Wolfe, R.R.; Shaw, J.H. Effect of epinephrine infusion and adrenergic blockade on glucose oxidation in conscious dogs. Metab. Clin. Exp. 1986, 35, 673–678. [Google Scholar] [CrossRef]
- Ensinger, H.; Weichel, T.; Lindner, K.H.; Grunert, A.; Ahnefeld, F.W. Effects of norepinephrine, epinephrine, and dopamine infusions on oxygen consumption in volunteers. Crit. Care Med. 1993, 21, 1502–1508. [Google Scholar] [CrossRef] [PubMed]
- Watt, M.J.; Howlett, K.F.; Febbraio, M.A.; Spriet, L.L.; Hargreaves, M. Adrenaline increases skeletal muscle glycogenolysis, pyruvate dehydrogenase activation and carbohydrate oxidation during moderate exercise in humans. J. Physiol. 2001, 534, 269–278. [Google Scholar] [CrossRef] [PubMed]
- Hoeks, J.; van Baak, M.A.; Hesselink, M.K.; Hul, G.B.; Vidal, H.; Saris, W.H.; Schrauwen, P. Effect of beta1- and beta2-adrenergic stimulation on energy expenditure, substrate oxidation, and UCP3 expression in humans. Am. J. Physiology. Endocrinol. Metab. 2003, 285, E775–E782. [Google Scholar] [CrossRef]
- Jones, C.T.; Ritchie, J.W. The metabolic and endocrine effects of circulating catecholamines in fetal sheep. J. Physiol. 1978, 285, 395–408. [Google Scholar] [CrossRef]
- Ensinger, H.; Geisser, W.; Brinkmann, A.; Wachter, U.; Vogt, J.; Radermacher, P.; Georgieff, M.; Trager, K. Metabolic effects of norepinephrine and dobutamine in healthy volunteers. Shock 2002, 18, 495–500. [Google Scholar] [CrossRef]
- Carpentier, A.C.; Blondin, D.P.; Virtanen, K.A.; Richard, D.; Haman, F.; Turcotte, E.E. Brown Adipose Tissue Energy Metabolism in Humans. Front. Endocrinol. 2018, 9, 447. [Google Scholar] [CrossRef]
- Heeren, J.; Scheja, L. Brown adipose tissue and lipid metabolism. Curr. Opin. Lipidol. 2018, 29, 180–185. [Google Scholar] [CrossRef]
- Sondergaard, E.; Gormsen, L.C.; Christensen, M.H.; Pedersen, S.B.; Christiansen, P.; Nielsen, S.; Poulsen, P.L.; Jessen, N. Chronic adrenergic stimulation induces brown adipose tissue differentiation in visceral adipose tissue. Diabet Med. 2015, 32, e4–e8. [Google Scholar] [CrossRef]
- Wang, Q.; Zhang, M.; Ning, G.; Gu, W.; Su, T.; Xu, M.; Li, B.; Wang, W. Brown adipose tissue in humans is activated by elevated plasma catecholamines levels and is inversely related to central obesity. PLoS ONE 2011, 6, e21006. [Google Scholar] [CrossRef]
- Fishbein, L.; Leshchiner, I.; Walter, V.; Danilova, L.; Robertson, A.G.; Johnson, A.R.; Lichtenberg, T.M.; Murray, B.A.; Ghayee, H.K.; Else, T.; et al. Comprehensive Molecular Characterization of Pheochromocytoma and Paraganglioma. Cancer Cell 2017, 31, 181–193. [Google Scholar] [CrossRef] [PubMed]
- Tella, S.H.; Taieb, D.; Pacak, K. HIF-2alpha: Achilles’ heel of pseudohypoxic subtype paraganglioma and other related conditions. Eur. J. Cancer 2017, 86, 1–4. [Google Scholar] [CrossRef] [PubMed]
- Kluckova, K.; Tennant, D.A. Metabolic implications of hypoxia and pseudohypoxia in pheochromocytoma and paraganglioma. Cell Tissue Res. 2018, 372, 367–378. [Google Scholar] [CrossRef]
- Warburg, O. On the origin of cancer cells. Science 1956, 123, 309–314. [Google Scholar] [CrossRef]
- Taieb, D.; Pacak, K. New Insights into the Nuclear Imaging Phenotypes of Cluster 1 Pheochromocytoma and Paraganglioma. Trends Endocrinol. Metab. 2017, 28, 807–817. [Google Scholar] [CrossRef] [PubMed]
- van Berkel, A.; Rao, J.U.; Kusters, B.; Demir, T.; Visser, E.; Mensenkamp, A.R.; van der Laak, J.A.; Oosterwijk, E.; Lenders, J.W.; Sweep, F.C.; et al. Correlation between in vivo 18F-FDG PET and immunohistochemical markers of glucose uptake and metabolism in pheochromocytoma and paraganglioma. J. Nucl. Med. 2014, 55, 1253–1259. [Google Scholar] [CrossRef] [PubMed]
- Hayashi, Y.; Yokota, A.; Harada, H.; Huang, G. Hypoxia/pseudohypoxia-mediated activation of hypoxia-inducible factor-1alpha in cancer. Cancer Sci. 2019, 110, 1510–1517. [Google Scholar] [CrossRef] [PubMed]
- Diamanti-Kandarakis, E.; Zapanti, E.; Peridis, M.H.; Ntavos, P.; Mastorakos, G. Insulin resistance in pheochromocytoma improves more by surgical rather than by medical treatment. Hormones 2003, 2, 61–66. [Google Scholar] [CrossRef]


| Subjects’ Characteristic | PPGL | Control | p |
|---|---|---|---|
| Subjects, n (females) | 108 (57) | 70 (38) | 0.97 * |
| Age, y | 51 ± 14 | 49 ± 15 | 0.40 |
| Weight, kg | 77 ± 20 | 75 ± 15 | 0.50 |
| Height, cm | 171 ± 10 | 171 ± 9 | 0.88 |
| BMI, kg/m2 | 26.3 ± 5.5 | 25.7 ± 4.2 | 0.45 |
| Waist, cm | 90 ± 16 | 89 ± 13 | 0.54 |
| Hip, cm | 103 ± 11 | 103 ± 7 | 0.99 |
| WHR | 0.87 ± 0.10 | 0.86 ± 0.10 | 0.41 |
| Body fat percentage, % | 32 ± 9 | 29 ± 8 | 0.06 |
| Creatinine, umol/L | 71 ± 17 | 74 ± 15 | 0.27 |
| Type 2 DM, n (%) | 31 (29) | - | - |
| FBG, mmol/L | 6.0 ± 1.6 | 5.0 ± 0.6 | <0.001 |
| HbA1c, mmol/mol | 43 ± 10 | 36 ± 5 | <0.001 |
| Total cholesterol, mmol/L | 4.7 ± 1.1 | 4.8 ± 0.9 | 0.59 |
| Triglycerides, mmol/L | 1.3 ± 0.8 | 1.6 ± 1.4 | 0.10 |
| TSH, uIU/L | 1.837 ± 1.079 | 2.212 ± 1.150 | 0.20 |
| P_Metanephrine, mmol/L | 3.0 (0.5; 9.6) | 0.2 (0.1; 0.2) | <0.001 |
| Levels above URR | 5 (0.9; 18) | 0.3 (0.2; 0.4) | <0.001 |
| P_Normetanephrine, mmol/L | 9.1 (4.0; 21.2) | 0.3 (0.2; 0.5) | <0.001 |
| Levels above URR | 12 (5; 27) | 0.4 (0.3; 0.6) | <0.001 |
| Current Smoker, n (%) | 30 (28) | 9 (13) | <0.05 |
| Art.hypertension, n (%) | 73 (68) | - | - |
| Alpha blockers, n (%) | 100 (93) | - | - |
| Dose of Doxazosine, mg | 3 (2; 6) | - | - |
| Beta blockers, n (%) | 35 (32) | - | - |
| Statin, n (%) | 29 (27) | 7 (10) | <0.01 |
| Calorimetry Parameters | PPGL | Control | p |
|---|---|---|---|
| VO2, L/min | 0.249 ± 0.051 | 0.215 ± 0.038 | <0.001 |
| VCO2, L/min | 0.205 ± 0.045 | 0.181 ± 0.038 | <0.001 |
| RQ | 0.83 ± 0.08 | 0.84 ± 0.07 | 0.28 |
| Measured REE, kcal/day | 1734 ± 357 | 1515 ± 284 | <0.001 |
| Predicted REE, kcal/day | 1503 ± 301 | 1493 ± 236 | 0.80 |
| REE ratio, % | 116 ± 13 | 101 ± 9 | <0.001 |
| REE/BSA, kcal/m2 | 918 ± 114 | 808 ± 92 | <0.001 |
| REE/kg, kcal/kg | 23 ± 4 | 20 ± 2 | <0.001 |
| REE/FFM, kcal/kg | 34 ± 5 | 29 ± 3 | <0.001 |
| Hypermetabolism, n (%) | 76 (70) | 11 (16) | <0.001 |
| Normometabolism, n (%) | 30 (28) | 53 (76) | <0.001 |
| Hypometabolism, n (%) | 2 (2) | 6 (8) | 0.08 |
| Subjects’ Characteristics | Normo PPGL | Hyper PPGL | p |
|---|---|---|---|
| Subjects, n (females) | 32 (17) | 76 (40) | 0.87 * |
| Age, y | 46 ± 14 | 53 ± 14 | 0.02 |
| Weight, kg | 78 ± 21 | 77 ± 19 | 0.71 |
| Height, cm | 171 ± 10 | 170 ± 10 | 0.54 |
| BMI, kg/m2 | 26.4 ± 5.9 | 26.3 ± 5.4 | 0.93 |
| Waist, cm | 90 ± 17 | 91 ± 16 | 0.75 |
| Hip, cm | 105 ± 12 | 103 ± 10 | 0.39 |
| WHR | 0.85 ± 0.10 | 0.88 ± 0.09 | 0.17 |
| Body fat percentage, % | 32 ± 9 | 32 ± 9 | 0.91 |
| Creatinine, umol/L | 76 ± 18 | 69 ± 16 | 0.08 |
| Type 2 DM, n (%) | 5 (16) | 26 (34) | 0.05 |
| FBG, mmol/L | 5.4 ± 0.8 | 6.3 ± 1.8 | <0.01 |
| HbA1c, mmol/mol | 40 ± 8 | 44 ± 11 | <0.05 |
| Total cholesterol, mmol/L | 4.8 ± 1.0 | 4.7 ± 1.1 | 0.71 |
| Triglycerides, mmol/L | 1.4 ± 1.1 | 1.2 ± 0.6 | 0.49 |
| TSH, uIU/L | 2.015 ± 1.032 | 1.764 ± 1.097 | 0.22 |
| P_Metanephrine above URR | 4.6 (0.8; 14.7) | 5.9 (0.9; 21.0) | 0.61 |
| P_Normetanephrine above URR | 12.8 (4.6; 23.5) | 11.2 (5.1; 28.9) | 0.79 |
| P_Epinephrine above URR | 2.2 (0.5; 4.4) | 1.8 (0.5; 6.3) | 0.93 |
| P_Norepinephrine above URR | 1.5 (1.0; 6.3) | 3.7 (1.2; 6.8) | 0.17 |
| P_Dopamine above URR | 0.5 (0.3; 0.8) | 0.5 (0.3; 0.7) | 0.50 |
| U_Epinephrine above URR | 1.2 (0.2; 4.0) | 3.1 (0.4; 15.2) | 0.11 |
| U_Norepinephrine above URR | 2.1 (0.8; 10.8) | 2.9 (1.1; 9.1) | 0.84 |
| U_Dopamine above URR | 0.7 (0.5; 1.0) | 0.8 (0.7; 1.3) | 0.74 |
| Current Smoker, n (%) | 10 (31) | 20 (26) | 0.77 |
| Art.hypertension, n (%) | 16 (50) | 57 (75) | <0.05 |
| Alpha blockers, n (%) | 28 (88) | 72(95) | 0.36 |
| Dose of doxazosin, mg | 2 (2; 4) | 4 (2; 6) | 0.06 |
| Beta blockers, n (%) | 12 (38) | 33 (43) | 0.72 |
| Statin, n (%) | 6 (19) | 23 (30) | 0.20 |
| Calorimetry Parameters | Normo PPGL | Hyper PPGL | p |
|---|---|---|---|
| VO2, L/min | 0.222 ± 0.044 | 0.260 ± 0.050 | <0.001 |
| VCO2, L/min | 0.186 ± 0.036 | 0.213 ± 0.047 | <0.01 |
| RQ | 0.84 ± 0.08 | 0.82 ± 0.08 | 0.15 |
| Measured REE, kcal/day | 1552 ± 299 | 1811 ± 353 | <0.001 |
| Predicted REE, kcal/day | 1542 ± 300 | 1487 ± 302 | <0.001 |
| REE ratio, % | 101 ± 6 | 122 ± 10 | <0.001 |
| REE/BSA, kcal/m2 | 815 ± 72 | 962 ± 100 | <0.001 |
| REE/kg, kcal/kg | 20 ± 3 | 24 ± 3 | <0.001 |
| REE/FFM, kcal/kg | 30 ± 4 | 36 ± 4 | <0.001 |
| UUN, g/day | 13 ± 6 | 12 ± 4 | 0.16 |
| np-RQ | 0.86 ± 0.11 | 0.82 ± 0.10 | <0.01 |
| Carbohydrates, kcal/d | 574 ± 334 | 605 ± 454 | 0.72 |
| Lipids, kcal/d | 624 ± 375 | 891 ± 450 | <0.01 |
| Proteins, kcal/d | 351 ± 152 | 311 ± 118 | 0.15 |
| Subjects’ Characteristics | NOR | ADR | p |
|---|---|---|---|
| Subjects, n (females) | 27 (19) | 49 (38) | 0.68 * |
| Age, y | 47 ± 15 | 56 ± 11 | <0.01 |
| Weight, kg | 78 ± 22 | 76 ± 18 | 0.55 |
| Height, cm | 173 ± 11 | 169 ± 9 | 0.07 |
| BMI, kg/m2 | 25.9 ± 5.1 | 26.5 ± 5.5 | 0.65 |
| Waist, cm | 89 ± 17 | 92 ± 16 | 0.59 |
| Hip, cm | 102 ± 9 | 103 ± 11 | 0.74 |
| WHR | 0.87 ± 0.11 | 0.89 ± 0.09 | 0.53 |
| Body fat percentage, % | 30 ± 7 | 32 ± 10 | 0.30 |
| Creatinine, umol/L | 71 ± 14 | 68 ± 17 | 0.42 |
| Type 2 DM, n (%) | 7 (26) | 17 (35) | 0.60 |
| FBG, mmol/L | 6.3 ±.2.1 | 6.3 ± 1.5 | 0.96 |
| HbA1c, mmol/mol | 42 ± 9 | 46 ± 12 | 0.22 |
| Total cholesterol, mmol/L | 4.3 ± 0.7 | 4.9 ± 1.2 | <0.05 |
| Triglycerides, mmol/L | 1.2 ± 0.6 | 1.3 ± 0.6 | 0.42 |
| TSH, uIU/L | 1.40 ± 0.83 | 1.97 ± 1.18 | <0.01 |
| P_Metanephrine, mmol/L | 0.4 (0.2; 0.5) | 9.5 (2.7; 14.0) | <0.001 |
| Levels above URR | 0.7 (0.3; 0.9) | 12.0 (5.0; 25.9) | <0.001 |
| P_Normetanephrine, mmol/L | 9.2 (5.6; 26.5) | 8.8 (3.2; 10.5) | 0.35 |
| Levels above URR | 11.7 (7.1; 33.5) | 11.1 (4.1; 25.9) | 0.81 |
| Current Smoker, n (%) | 4 (15) | 16 (33) | 0.16 |
| Alpha blockers, n (%) | 25 (93) | 47 (96) | 0.93 |
| Dose of doxazosin, mg | 4 (1; 6) | 4 (2; 6) | 0.93 |
| Beta blockers, n (%) | 13 (48) | 20 (41) | 0.71 |
| Statin, n (%) | 8 (30) | 15 (31) | 0.86 |
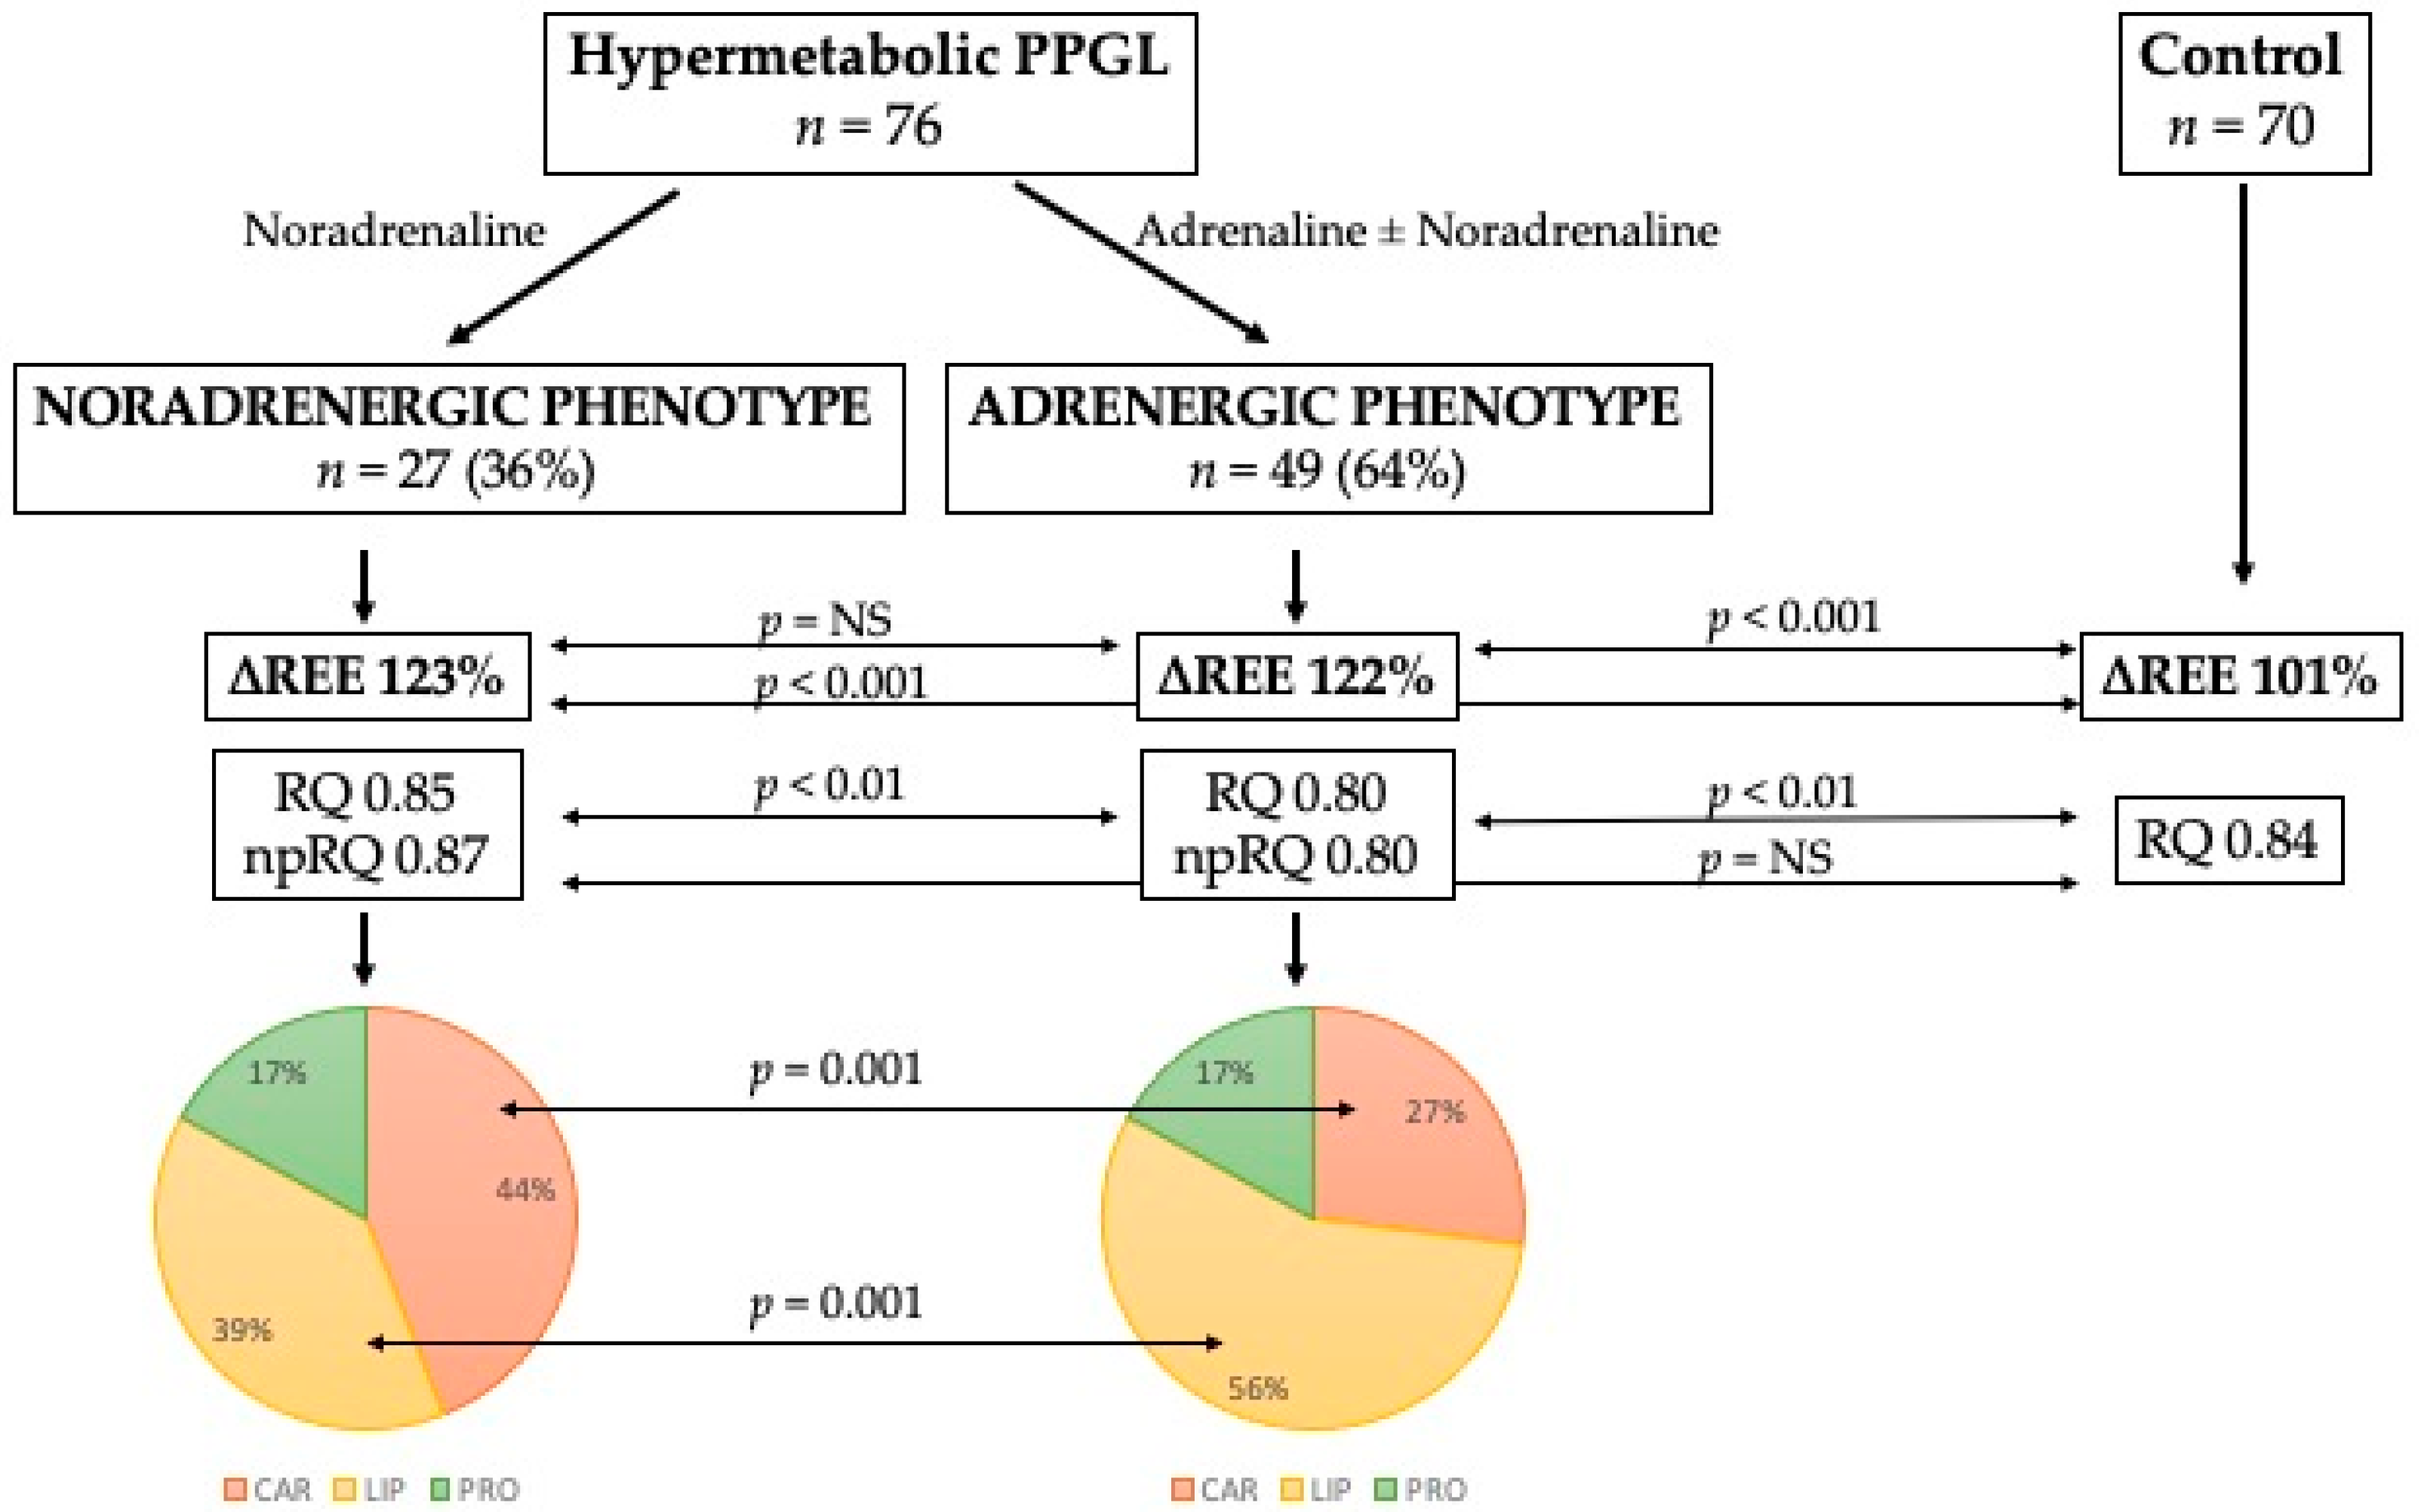
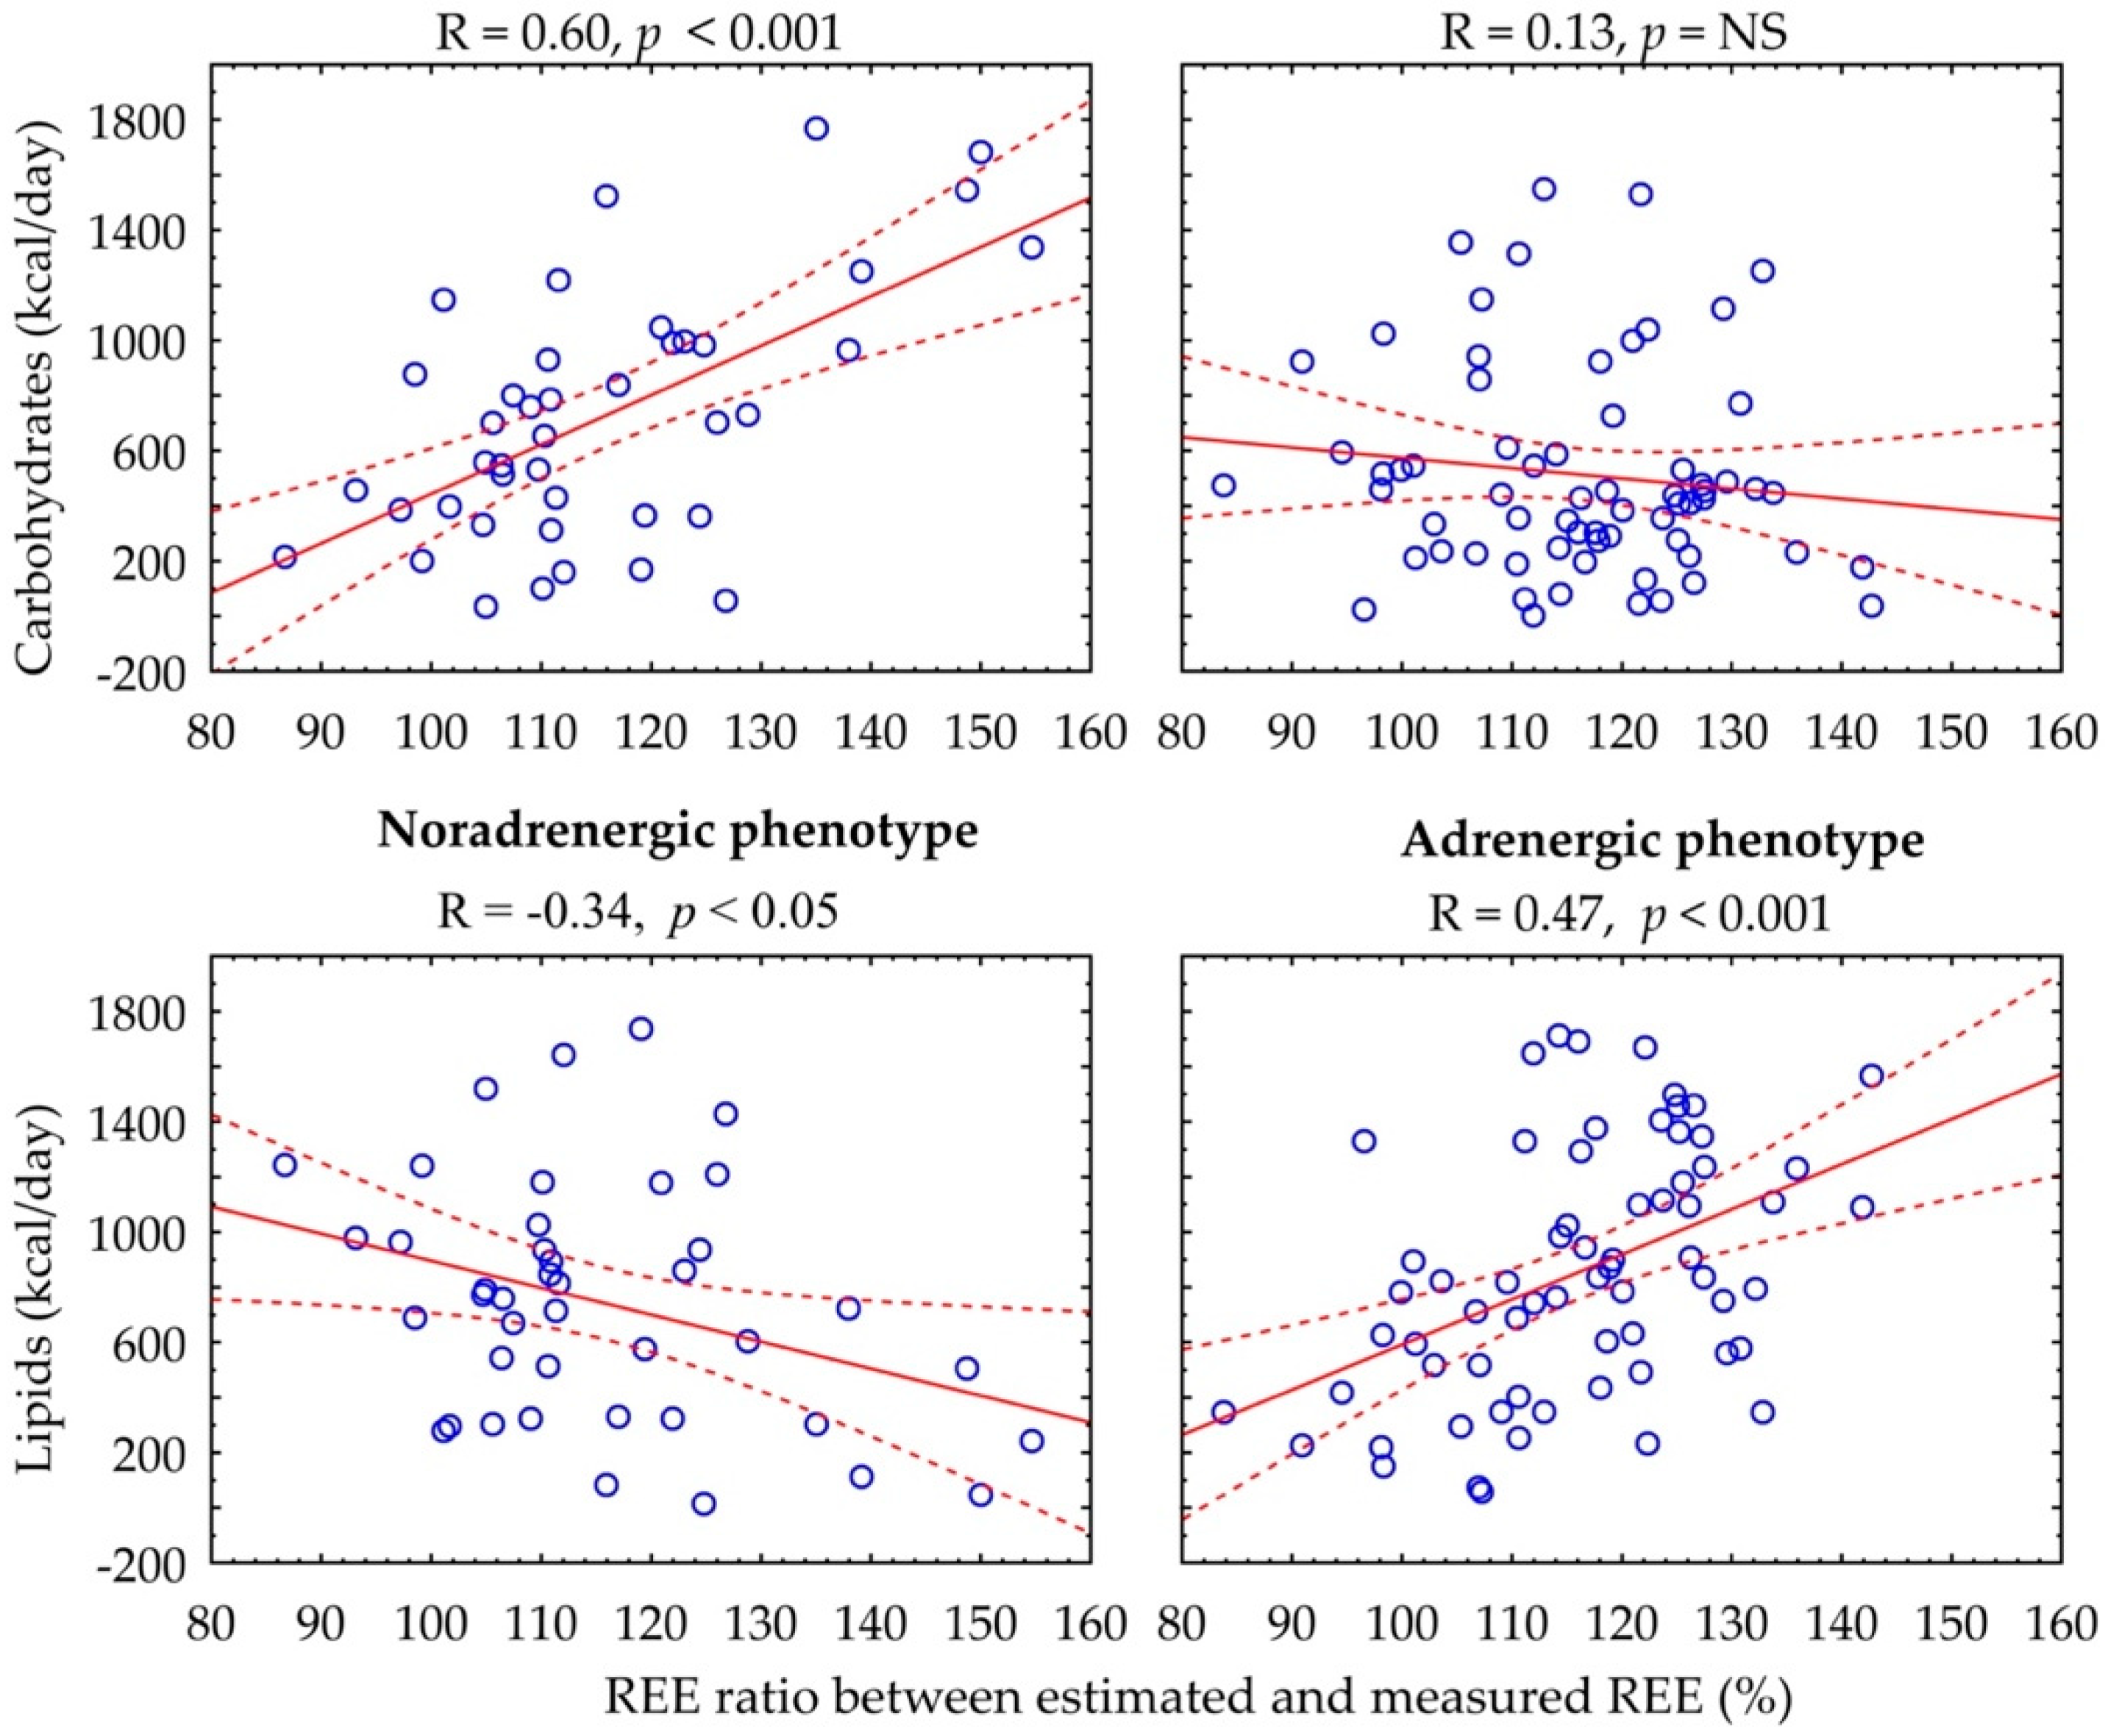
| Calorimetry Parameters | NOR | ADR | p |
|---|---|---|---|
| VO2, L/min | 0.271 ± 0.054 | 0.254 ± 0.047 | 0.14 |
| VCO2, L/min | 0.231 ± 0.049 | 0.203 ± 0.043 | <0.05 |
| RQ | 0.85 ± 0.08 | 0.80 ± 0.08 | <0.01 |
| Measured REE, kcal/day | 1906 ± 377 | 1758 ± 332 | 0.08 |
| Predicted REE, kcal/day | 1558 ± 342 | 1448 ± 273 | 0.13 |
| REE ratio, % | 123 ± 13 | 122 ± 8 | 0.49 |
| UUN, g/day | 12 ± 5 | 11 ± 4 | 0.34 |
| np-RQ | 0.87 ± 0.10 | 0.80 ± 0.10 | <0.01 |
| Carbohydrates, kcal/d | 832 ± 495 | 481 ± 381 | <0.001 |
| Lipids, kcal/d | 734 ± 475 | 977 ± 415 | <0.05 |
| Proteins, kcal/d | 329 ± 128 | 302 ± 113 | 0.35 |
| Carbohydrates (% of REE) | 44 ± 24 | 27 ± 19 | <0.01 |
| Lipids (% of REE) | 39 ± 24 | 56 ± 20 | <0.01 |
| Proteins (% of REE) | 17 ± 6 | 17 ± 6 | 0.97 |
Publisher’s Note: MDPI stays neutral with regard to jurisdictional claims in published maps and institutional affiliations. |
© 2022 by the authors. Licensee MDPI, Basel, Switzerland. This article is an open access article distributed under the terms and conditions of the Creative Commons Attribution (CC BY) license (https://creativecommons.org/licenses/by/4.0/).
Share and Cite
Petrák, O.; Haluzíková, D.; Klímová, J.; Zítek, M.; Holaj, R.; Michalský, D.; Novák, K.; Petráková-Doležalová, R.; Kvasnička, J.; Nguyen, T.M.P.N.; et al. Hypermetabolism and Substrate Utilization Rates in Pheochromocytoma and Functional Paraganglioma. Biomedicines 2022, 10, 1980. https://doi.org/10.3390/biomedicines10081980
Petrák O, Haluzíková D, Klímová J, Zítek M, Holaj R, Michalský D, Novák K, Petráková-Doležalová R, Kvasnička J, Nguyen TMPN, et al. Hypermetabolism and Substrate Utilization Rates in Pheochromocytoma and Functional Paraganglioma. Biomedicines. 2022; 10(8):1980. https://doi.org/10.3390/biomedicines10081980
Chicago/Turabian StylePetrák, Ondřej, Denisa Haluzíková, Judita Klímová, Matěj Zítek, Robert Holaj, David Michalský, Květoslav Novák, Radka Petráková-Doležalová, Jan Kvasnička, Thi Minh Phuong Nikrýnová Nguyen, and et al. 2022. "Hypermetabolism and Substrate Utilization Rates in Pheochromocytoma and Functional Paraganglioma" Biomedicines 10, no. 8: 1980. https://doi.org/10.3390/biomedicines10081980
APA StylePetrák, O., Haluzíková, D., Klímová, J., Zítek, M., Holaj, R., Michalský, D., Novák, K., Petráková-Doležalová, R., Kvasnička, J., Nguyen, T. M. P. N., Krátká, Z., Matoulek, M., Widimský, J., Jr., & Zelinka, T. (2022). Hypermetabolism and Substrate Utilization Rates in Pheochromocytoma and Functional Paraganglioma. Biomedicines, 10(8), 1980. https://doi.org/10.3390/biomedicines10081980