
Progressive Vascular Abnormalities in the Aging 3xTg-AD Mouse Model of Alzheimer’s Disease

 , and
, and 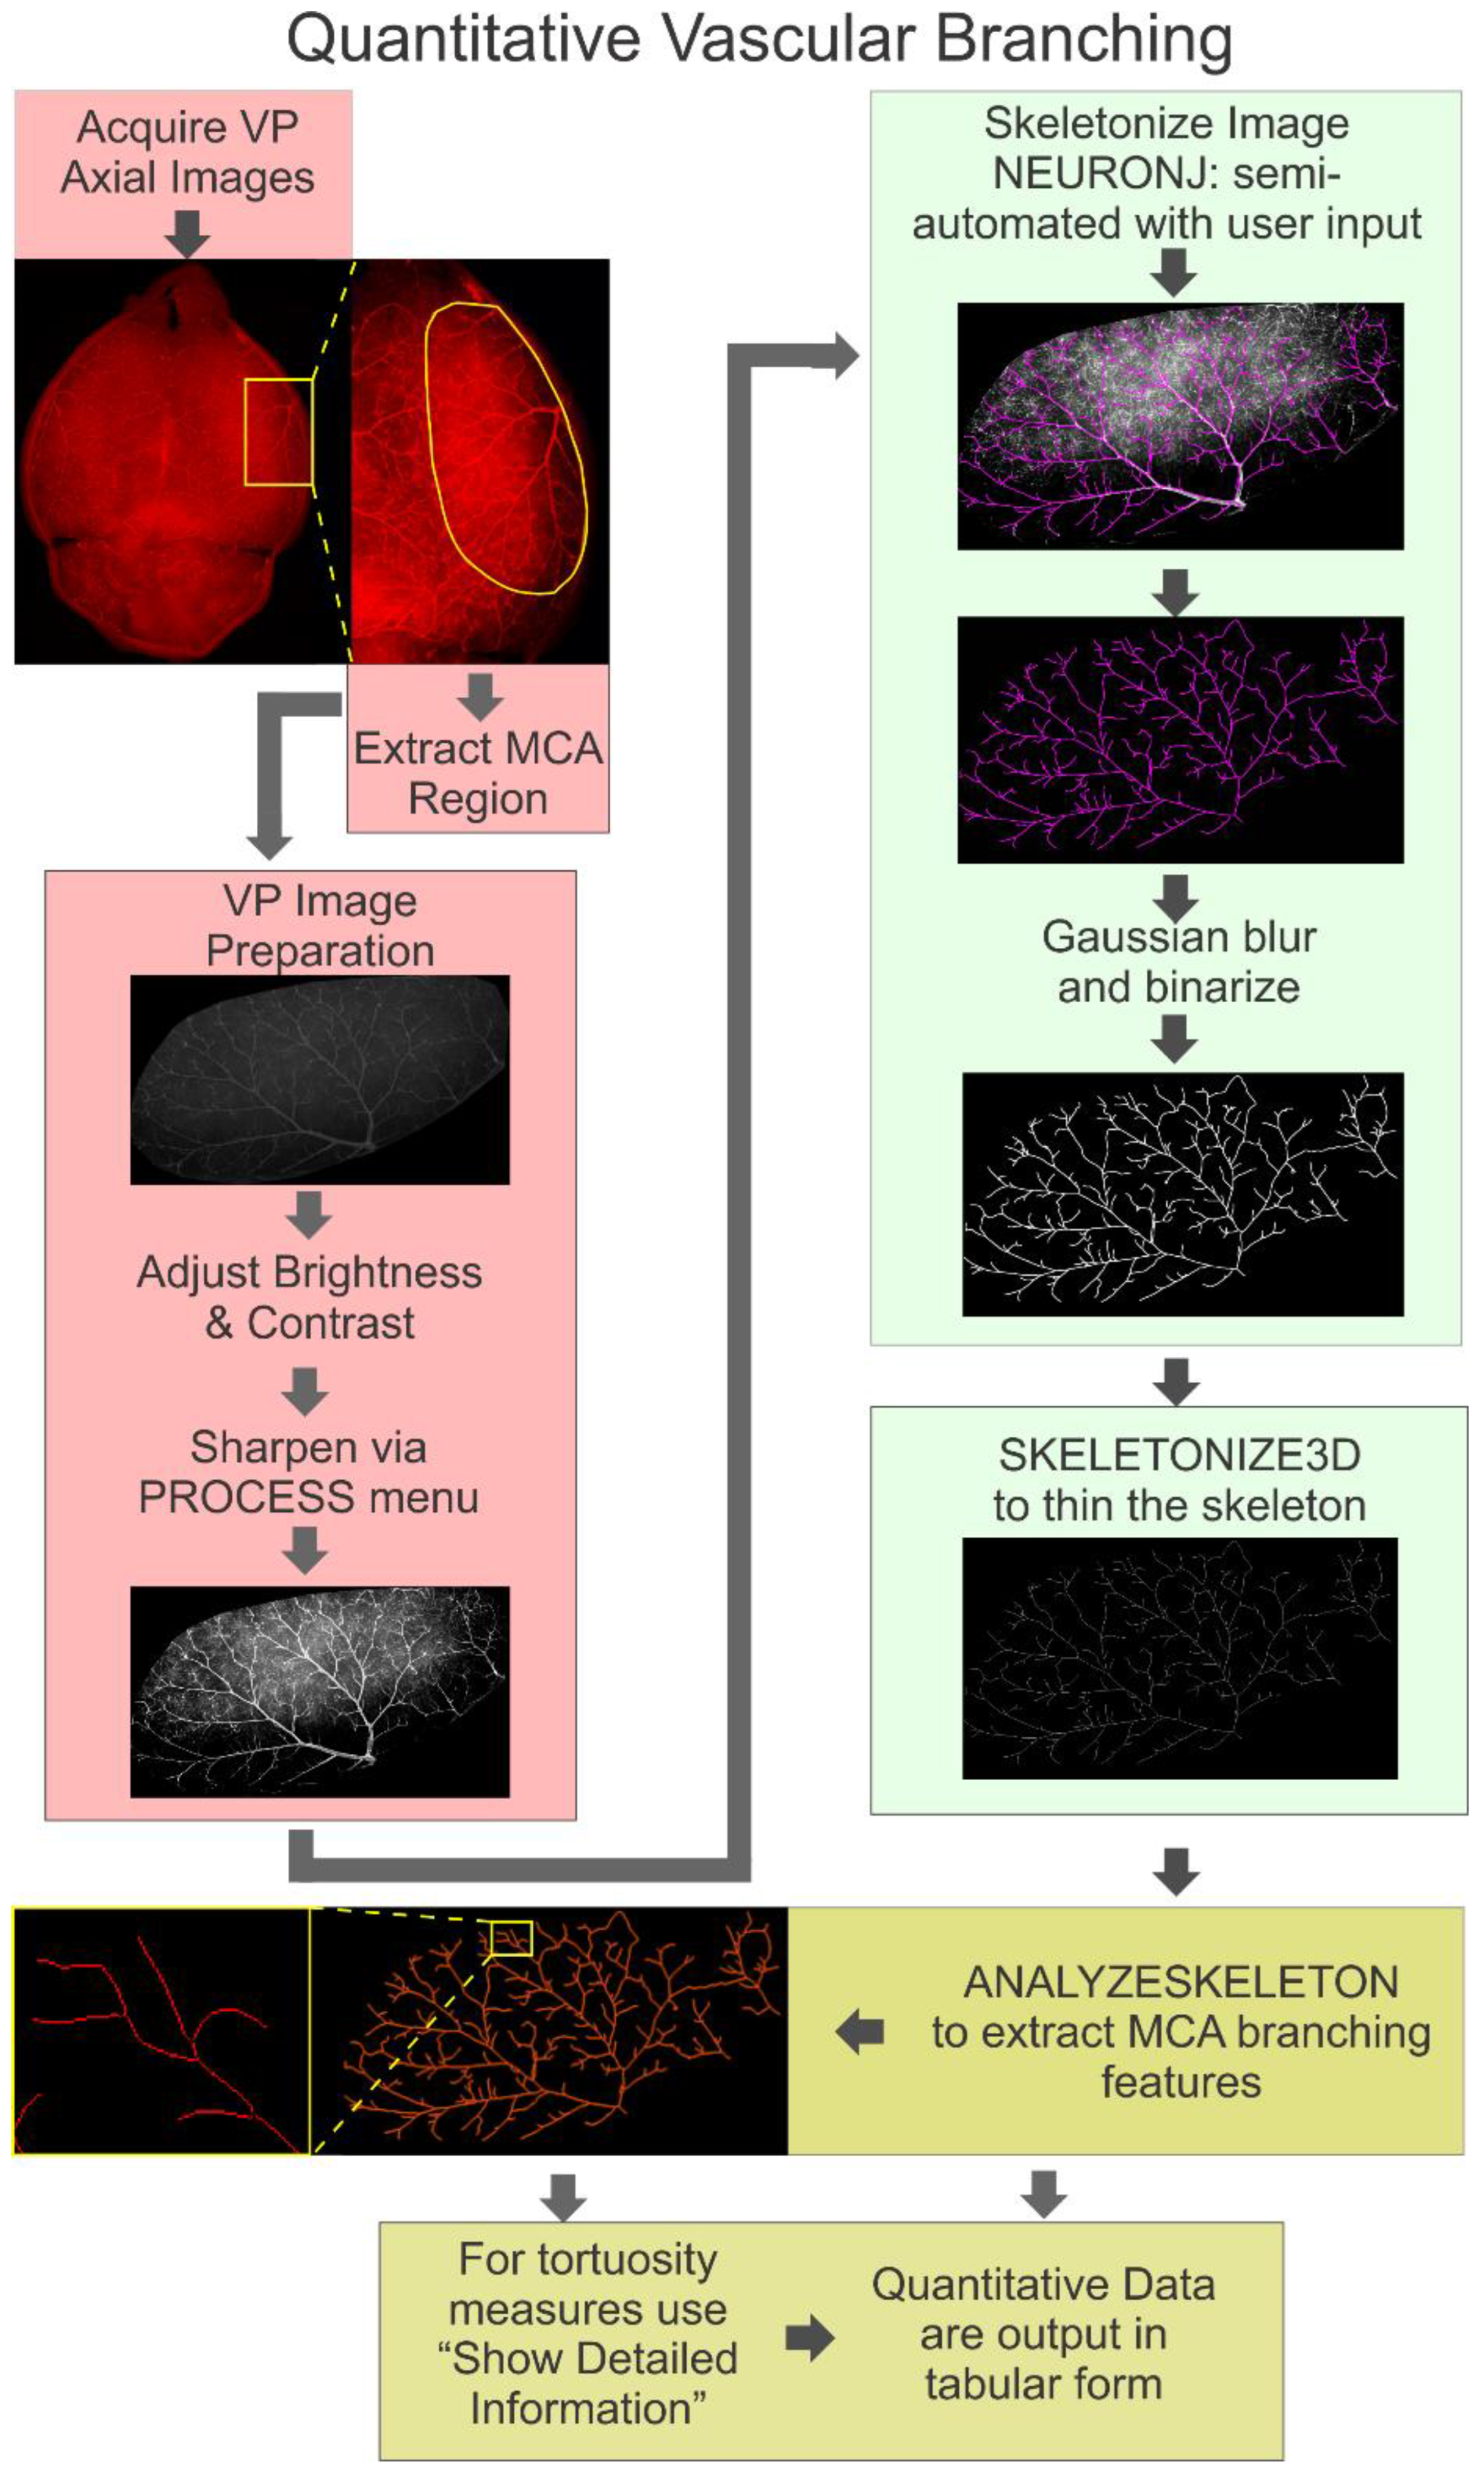
Abstract
1. Introduction
2. Materials and Methods
2.1. 3xTg-AD Mice
2.2. Vessel Painting
2.3. Imaging and Analysis of Vessel Painted Brains
2.4. Branching Analysis of the Middle Cerebral Artery (MCA)
2.4.1. Image Preparation
2.4.2. Skeletonization of the MCA
2.4.3. Quantification of Skeletonized Vascular Tree
2.5. Statistical Analyses
3. Results
3.1. Classical Cortical Vascular Networks of 3xTg-AD Mice Are Subtly Remodeled with Age
3.2. Cortical Vascular Complexity in 3xTg-AD Mice
3.3. Vascular Measures of the Middle Cerebral Artery
3.4. Analysis of the Middle Cerebral Artery Skeleton
3.5. Analysis of the Collateral Vessels in the Middle Cerebral Artery Vascular Tree
4. Discussion
5. Conclusions
Supplementary Materials
Author Contributions
Funding
Institutional Review Board Statement
Informed Consent Statement
Data Availability Statement
Acknowledgments
Conflicts of Interest
References
- Alzheimer’s Association. 2022 Alzheimer’s disease facts and figures. Alzheimers Dement. 2022, 18, 700–789. [Google Scholar] [CrossRef] [PubMed]
- Gutierrez, J.; Guzman, V.; Khasiyev, F.; Manly, J.; Schupf, N.; Andrews, H.; Mayeux, R.; Brickman, A.M. Brain arterial dilatation and the risk of Alzheimer’s disease. Alzheimers Dement. 2019, 15, 666–674. [Google Scholar] [CrossRef] [PubMed]
- Roher, A.E.; Debbins, J.P.; Malek-Ahmadi, M.; Chen, K.; Pipe, J.G.; Maze, S.; Belden, C.; Maarouf, C.L.; Thiyyagura, P.; Mo, H.; et al. Cerebral blood flow in Alzheimer’s disease. Vasc. Health Risk Manag. 2012, 8, 599–611. [Google Scholar] [CrossRef] [PubMed]
- Thomas, T.; Miners, S.; Love, S. Post-mortem assessment of hypoperfusion of cerebral cortex in Alzheimer’s disease and vascular dementia. Brain 2015, 138, 1059–1069. [Google Scholar] [CrossRef] [PubMed]
- Nielsen, R.B.; Parbo, P.; Ismail, R.; Dalby, R.; Tietze, A.; Braendgaard, H.; Gottrup, H.; Brooks, D.J.; Ostergaard, L.; Eskildsen, S.F. Impaired perfusion and capillary dysfunction in prodromal Alzheimer’s disease. Alzheimers Dement. (Amst.) 2020, 12, e12032. [Google Scholar] [CrossRef] [PubMed]
- Ding, R.; Hase, Y.; Ameen-Ali, K.E.; Ndung’u, M.; Stevenson, W.; Barsby, J.; Gourlay, R.; Akinyemi, T.; Akinyemi, R.; Uemura, M.T.; et al. Loss of capillary pericytes and the blood-brain barrier in white matter in poststroke and vascular dementias and Alzheimer’s disease. Brain Pathol. 2020, 30, 1087–1101. [Google Scholar] [CrossRef] [PubMed]
- Uemura, M.T.; Maki, T.; Ihara, M.; Lee, V.M.Y.; Trojanowski, J.Q. Brain Microvascular Pericytes in Vascular Cognitive Impairment and Dementia. Front. Aging Neurosci. 2020, 12, 80. [Google Scholar] [CrossRef]
- Laing, K.K.; Simoes, S.; Baena-Caldas, G.P.; Lao, P.J.; Kothiya, M.; Igwe, K.C.; Chesebro, A.G.; Houck, A.L.; Pedraza, L.; Hernandez, A.I.; et al. Cerebrovascular disease promotes tau pathology in Alzheimer’s disease. Brain Commun. 2020, 2, fcaa132. [Google Scholar] [CrossRef]
- de la Torre, J.C. Pathophysiology of neuronal energy crisis in Alzheimer’s disease. Neurodegener. Dis. 2008, 5, 126–132. [Google Scholar] [CrossRef] [PubMed]
- Aguilar-Pineda, J.A.; Vera-Lopez, K.J.; Shrivastava, P.; Chavez-Fumagalli, M.A.; Nieto-Montesinos, R.; Alvarez-Fernandez, K.L.; Goyzueta Mamani, L.D.; Davila Del-Carpio, G.; Gomez-Valdez, B.; Miller, C.L.; et al. Vascular smooth muscle cell dysfunction contribute to neuroinflammation and Tau hyperphosphorylation in Alzheimer disease. iScience 2021, 24, 102993. [Google Scholar] [CrossRef]
- Avila, J.; Perry, G. A Multilevel View of the Development of Alzheimer’s Disease. Neuroscience 2021, 457, 283–293. [Google Scholar] [CrossRef] [PubMed]
- Styr, B.; Slutsky, I. Imbalance between firing homeostasis and synaptic plasticity drives early-phase Alzheimer’s disease. Nat. Neurosci. 2018, 21, 463–473. [Google Scholar] [CrossRef] [PubMed]
- Carare, R.O.; Aldea, R.; Agarwal, N.; Bacskai, B.J.; Bechman, I.; Boche, D.; Bu, G.; Bulters, D.; Clemens, A.; Counts, S.E.; et al. Clearance of interstitial fluid (ISF) and CSF (CLIC) group-part of Vascular Professional Interest Area (PIA): Cerebrovascular disease and the failure of elimination of Amyloid-beta from the brain and retina with age and Alzheimer’s disease-Opportunities for Therapy. Alzheimers Dement. (Amst.) 2020, 12, e12053. [Google Scholar] [CrossRef]
- de la Torre, J.C. Vascular risk factor detection and control may prevent Alzheimer’s disease. Ageing Res. Rev. 2010, 9, 218–225. [Google Scholar] [CrossRef]
- Yew, B.; Nation, D.A.; Alzheimer’s Disease Neuroimaging, I. Cerebrovascular resistance: Effects on cognitive decline, cortical atrophy, and progression to dementia. Brain 2017, 140, 1987–2001. [Google Scholar] [CrossRef] [PubMed]
- Quintana, D.D.; Anantula, Y.; Garcia, J.A.; Engler-Chiurazzi, E.B.; Sarkar, S.N.; Corbin, D.R.; Brown, C.M.; Simpkins, J.W. Microvascular degeneration occurs before plaque onset and progresses with age in 3xTg AD mice. Neurobiol. Aging 2021, 105, 115–128. [Google Scholar] [CrossRef] [PubMed]
- Fu, L.; Jiang, G.; Weng, H.; Dick, G.M.; Chang, Y.; Kassab, G.S. Cerebrovascular miRNAs correlate with the clearance of Abeta through perivascular route in younger 3xTg-AD mice. Brain Pathol. 2020, 30, 92–105. [Google Scholar] [CrossRef]
- Belfiore, R.; Rodin, A.; Ferreira, E.; Velazquez, R.; Branca, C.; Caccamo, A.; Oddo, S. Temporal and regional progression of Alzheimer’s disease-like pathology in 3xTg-AD mice. Aging Cell 2019, 18, e12873. [Google Scholar] [CrossRef] [PubMed]
- Oddo, S.; Caccamo, A.; Shepherd, J.D.; Murphy, M.P.; Golde, T.E.; Kayed, R.; Metherate, R.; Mattson, M.P.; Akbari, Y.; LaFerla, F.M. Triple-transgenic model of Alzheimer’s disease with plaques and tangles: Intracellular Abeta and synaptic dysfunction. Neuron 2003, 39, 409–421. [Google Scholar] [CrossRef]
- Lourenco, C.F.; Ledo, A.; Barbosa, R.M.; Laranjinha, J. Neurovascular uncoupling in the triple transgenic model of Alzheimer’s disease: Impaired cerebral blood flow response to neuronal-derived nitric oxide signaling. Exp. Neurol. 2017, 291, 36–43. [Google Scholar] [CrossRef]
- Krishnan, B.; Kayed, R.; Taglialatela, G. Elevated phospholipase D isoform 1 in Alzheimer’s disease patients’ hippocampus: Relevance to synaptic dysfunction and memory deficits. Alzheimers Dement. (N. Y.) 2018, 4, 89–102. [Google Scholar] [CrossRef] [PubMed]
- Karperien, A.; Ahammer, H.; Jelinek, H.F. Quantitating the subtleties of microglial morphology with fractal analysis. Front. Cell Neurosci. 2013, 7, 3. [Google Scholar] [CrossRef]
- Zudaire, E.; Gambardella, L.; Kurcz, C.; Vermeren, S. A computational tool for quantitative analysis of vascular networks. PLoS ONE 2011, 6, e27385. [Google Scholar] [CrossRef]
- Salehi, A.; Jullienne, A.; Wendel, K.M.; Hamer, M.; Tang, J.; Zhang, J.H.; Pearce, W.J.; DeFazio, R.A.; Vexler, Z.S.; Obenaus, A. A Novel Technique for Visualizing and Analyzing the Cerebral Vasculature in Rodents. Transl. Stroke Res. 2018, 10, 216–230. [Google Scholar] [CrossRef] [PubMed]
- Frost, S.; Kanagasingam, Y.; Sohrabi, H.; Vignarajan, J.; Bourgeat, P.; Salvado, O.; Villemagne, V.; Rowe, C.C.; Macaulay, S.L.; Szoeke, C.; et al. Retinal vascular biomarkers for early detection and monitoring of Alzheimer’s disease. Transl. Psychiatry 2013, 3, e233. [Google Scholar] [CrossRef] [PubMed]
- Meijering, E.; Jacob, M.; Sarria, J.C.; Steiner, P.; Hirling, H.; Unser, M. Design and validation of a tool for neurite tracing and analysis in fluorescence microscopy images. Cytometry 2004, 58, 167–176. [Google Scholar] [CrossRef] [PubMed]
- Arganda-Carreras, I.; Fernandez-Gonzalez, R.; Munoz-Barrutia, A.; Ortiz-De-Solorzano, C. 3D reconstruction of histological sections: Application to mammary gland tissue. Microsc. Res. Tech. 2010, 73, 1019–1029. [Google Scholar] [CrossRef]
- Homann, H. Implementation of a 3D thinning algorithm. Insight J. 2007. [Google Scholar] [CrossRef]
- Lee, T.C.; Kashyap, R.L.; Chu, C.N. Building Skeleton Models via 3-D Medial Surface Axis Thinning Algorithms. Graph. Models Image Processing 1994, 56, 462–478. [Google Scholar] [CrossRef]
- Salehi, A.; Jullienne, A.; Baghchechi, M.; Hamer, M.; Walsworth, M.; Donovan, V.; Tang, J.; Zhang, J.H.; Pearce, W.J.; Obenaus, A. Up-regulation of Wnt/beta-catenin expression is accompanied with vascular repair after traumatic brain injury. J. Cereb. Blood Flow Metab. 2018, 38, 274–289. [Google Scholar] [CrossRef] [PubMed]
- Franzblau, M.; Gonzales-Portillo, C.; Gonzales-Portillo, G.S.; Diamandis, T.; Borlongan, M.C.; Tajiri, N.; Borlongan, C.V. Vascular damage: A persisting pathology common to Alzheimer’s disease and traumatic brain injury. Med. Hypotheses 2013, 81, 842–845. [Google Scholar] [CrossRef] [PubMed]
- Hase, Y.; Ding, R.; Harrison, G.; Hawthorne, E.; King, A.; Gettings, S.; Platten, C.; Stevenson, W.; Craggs, L.J.L.; Kalaria, R.N. White matter capillaries in vascular and neurodegenerative dementias. Acta Neuropathol. Commun. 2019, 7, 16. [Google Scholar] [CrossRef] [PubMed]
- Snyder, H.M.; Corriveau, R.A.; Craft, S.; Faber, J.E.; Greenberg, S.M.; Knopman, D.; Lamb, B.T.; Montine, T.J.; Nedergaard, M.; Schaffer, C.B.; et al. Vascular contributions to cognitive impairment and dementia including Alzheimer’s disease. Alzheimers Dement. 2015, 11, 710–717. [Google Scholar] [CrossRef]
- Steinman, J.; Sun, H.S.; Feng, Z.P. Microvascular Alterations in Alzheimer’s Disease. Front. Cell Neurosci. 2020, 14, 618986. [Google Scholar] [CrossRef] [PubMed]
- Lee, W.J.; Yoon, C.W.; Kim, S.W.; Jeong, H.J.; Seo, S.; Na, D.L.; Noh, Y.; Seong, J.K. Effects of Alzheimer’s and Vascular Pathologies on Structural Connectivity in Early- and Late-Onset Alzheimer’s Disease. Front. Neurosci. 2021, 15, 606600. [Google Scholar] [CrossRef]
- Wolters, F.J.; Zonneveld, H.I.; Hofman, A.; van der Lugt, A.; Koudstaal, P.J.; Vernooij, M.W.; Ikram, M.A.; Heart-Brain Connection Collaborative Research, G. Cerebral Perfusion and the Risk of Dementia: A Population-Based Study. Circulation 2017, 136, 719–728. [Google Scholar] [CrossRef]
- Zhang, Q.; Wang, Q.; He, C.; Fan, D.; Zhu, Y.; Zang, F.; Tan, C.; Zhang, S.; Shu, H.; Zhang, Z.; et al. Altered Regional Cerebral Blood Flow and Brain Function Across the Alzheimer’s Disease Spectrum: A Potential Biomarker. Front. Aging Neurosci. 2021, 13, 630382. [Google Scholar] [CrossRef]
- Szu, J.I.; Obenaus, A. Cerebrovascular phenotypes in mouse models of Alzheimer’s disease. J. Cereb. Blood Flow Metab. 2021, 41, 1821–1841. [Google Scholar] [CrossRef]
- Jullienne, A.; Trinh, M.V.; Obenaus, A. Neuroimaging of Mouse Models of Alzheimer’s Disease. Biomedicines 2022, 10, 305. [Google Scholar] [CrossRef]
- Do, T.M.; Alata, W.; Dodacki, A.; Traversy, M.T.; Chacun, H.; Pradier, L.; Scherrmann, J.M.; Farinotti, R.; Calon, F.; Bourasset, F. Altered cerebral vascular volumes and solute transport at the blood-brain barriers of two transgenic mouse models of Alzheimer’s disease. Neuropharmacology 2014, 81, 311–317. [Google Scholar] [CrossRef]
- Barnes, J.N.; Corkery, A.T. Exercise Improves Vascular Function, but does this Translate to the Brain? Brain Plast. 2018, 4, 65–79. [Google Scholar] [CrossRef] [PubMed]
- Tomoto, T.; Liu, J.; Tseng, B.Y.; Pasha, E.P.; Cardim, D.; Tarumi, T.; Hynan, L.S.; Munro Cullum, C.; Zhang, R. One-Year Aerobic Exercise Reduced Carotid Arterial Stiffness and Increased Cerebral Blood Flow in Amnestic Mild Cognitive Impairment. J. Alzheimers Dis. 2021, 80, 841–853. [Google Scholar] [CrossRef] [PubMed]
- Bliss, E.S.; Wong, R.H.; Howe, P.R.; Mills, D.E. Benefits of exercise training on cerebrovascular and cognitive function in ageing. J. Cereb. Blood Flow Metab. 2021, 41, 447–470. [Google Scholar] [CrossRef] [PubMed]
- Bourasset, F.; Ouellet, M.; Tremblay, C.; Julien, C.; Do, T.M.; Oddo, S.; LaFerla, F.; Calon, F. Reduction of the cerebrovascular volume in a transgenic mouse model of Alzheimer’s disease. Neuropharmacology 2009, 56, 808–813. [Google Scholar] [CrossRef]
- Garcia-Mesa, Y.; Lopez-Ramos, J.C.; Gimenez-Llort, L.; Revilla, S.; Guerra, R.; Gruart, A.; Laferla, F.M.; Cristofol, R.; Delgado-Garcia, J.M.; Sanfeliu, C. Physical exercise protects against Alzheimer’s disease in 3xTg-AD mice. J. Alzheimers Dis. 2011, 24, 421–454. [Google Scholar] [CrossRef]
- Kim, D.; Cho, J.; Kang, H. Protective effect of exercise training against the progression of Alzheimer’s disease in 3xTg-AD mice. Behav. Brain Res. 2019, 374, 112105. [Google Scholar] [CrossRef]
- Bullitt, E.; Rahman, F.N.; Smith, J.K.; Kim, E.; Zeng, D.; Katz, L.M.; Marks, B.L. The effect of exercise on the cerebral vasculature of healthy aged subjects as visualized by MR angiography. Am. J. Neuroradiol. 2009, 30, 1857–1863. [Google Scholar] [CrossRef]
- Hansson, O.; Svensson, M.; Gustavsson, A.M.; Andersson, E.; Yang, Y.; Nagga, K.; Hallmarker, U.; James, S.; Deierborg, T. Midlife physical activity is associated with lower incidence of vascular dementia but not Alzheimer’s disease. Alzheimers Res. Ther. 2019, 11, 87. [Google Scholar] [CrossRef]
- Svensson, M.; Andersson, E.; Manouchehrian, O.; Yang, Y.; Deierborg, T. Voluntary running does not reduce neuroinflammation or improve non-cognitive behavior in the 5xFAD mouse model of Alzheimer’s disease. Sci. Rep. 2020, 10, 1346. [Google Scholar] [CrossRef]
- Algarzae, N.; Hebron, M.; Miessau, M.; Moussa, C.E. Parkin prevents cortical atrophy and Abeta-induced alterations of brain metabolism: (1)(3)C NMR and magnetic resonance imaging studies in AD models. Neuroscience 2012, 225, 22–34. [Google Scholar] [CrossRef][Green Version]
- Hohsfield, L.A.; Daschil, N.; Oradd, G.; Stromberg, I.; Humpel, C. Vascular pathology of 20-month-old hypercholesterolemia mice in comparison to triple-transgenic and APPSwDI Alzheimer’s disease mouse models. Mol. Cell Neurosci. 2014, 63, 83–95. [Google Scholar] [CrossRef] [PubMed]
- Kastyak-Ibrahim, M.Z.; Di Curzio, D.L.; Buist, R.; Herrera, S.L.; Albensi, B.C.; Del Bigio, M.R.; Martin, M. Neurofibrillary tangles and plaques are not accompanied by white matter pathology in aged triple transgenic-Alzheimer disease mice. Magn. Reson. Imaging 2013, 31, 1515–1521. [Google Scholar] [CrossRef] [PubMed]
- Stevens, L.M.; Brown, R.E. Reference and working memory deficits in the 3xTg-AD mouse between 2 and 15-months of age: A cross-sectional study. Behav. Brain Res. 2015, 278, 496–505. [Google Scholar] [CrossRef] [PubMed]
- Hakim, M.A.; Chum, P.P.; Buchholz, J.N.; Behringer, E.J. Aging Alters Cerebrovascular Endothelial GPCR and K+ Channel Function: Divergent Role of Biological Sex. J. Gerontol. A Biol. Sci. Med. Sci. 2020, 75, 2064–2073. [Google Scholar] [CrossRef] [PubMed]
- Lin, X.; Chen, L.; Jullienne, A.; Zhang, H.; Salehi, A.; Hamer, M.; T, C.H.; Obenaus, A.; Xu, X. Longitudinal dynamics of microvascular recovery after acquired cortical injury. Acta Neuropathol. Commun. 2022, 10, 59. [Google Scholar] [CrossRef]
- Javonillo, D.I.; Tran, K.M.; Phan, J.; Hingco, E.; Kramar, E.A.; da Cunha, C.; Forner, S.; Kawauchi, S.; Milinkeviciute, G.; Gomez-Arboledas, A.; et al. Systematic Phenotyping and Characterization of the 3xTg-AD Mouse Model of Alzheimer’s Disease. Front. Neurosci. 2021, 15, 785276. [Google Scholar] [CrossRef]


Publisher’s Note: MDPI stays neutral with regard to jurisdictional claims in published maps and institutional affiliations. |
© 2022 by the authors. Licensee MDPI, Basel, Switzerland. This article is an open access article distributed under the terms and conditions of the Creative Commons Attribution (CC BY) license (https://creativecommons.org/licenses/by/4.0/).
Share and Cite
Jullienne, A.; Quan, R.; Szu, J.I.; Trinh, M.V.; Behringer, E.J.; Obenaus, A. Progressive Vascular Abnormalities in the Aging 3xTg-AD Mouse Model of Alzheimer’s Disease. Biomedicines 2022, 10, 1967. https://doi.org/10.3390/biomedicines10081967
Jullienne A, Quan R, Szu JI, Trinh MV, Behringer EJ, Obenaus A. Progressive Vascular Abnormalities in the Aging 3xTg-AD Mouse Model of Alzheimer’s Disease. Biomedicines. 2022; 10(8):1967. https://doi.org/10.3390/biomedicines10081967
Chicago/Turabian StyleJullienne, Amandine, Ryan Quan, Jenny I. Szu, Michelle V. Trinh, Erik J. Behringer, and Andre Obenaus. 2022. "Progressive Vascular Abnormalities in the Aging 3xTg-AD Mouse Model of Alzheimer’s Disease" Biomedicines 10, no. 8: 1967. https://doi.org/10.3390/biomedicines10081967
APA StyleJullienne, A., Quan, R., Szu, J. I., Trinh, M. V., Behringer, E. J., & Obenaus, A. (2022). Progressive Vascular Abnormalities in the Aging 3xTg-AD Mouse Model of Alzheimer’s Disease. Biomedicines, 10(8), 1967. https://doi.org/10.3390/biomedicines10081967