Article

Effective Perturbations by Phenobarbital on INa, IK(erg), IK(M) and IK(DR) during Pulse Train Stimulation in Neuroblastoma Neuro-2a Cells

1
Department of Pediatrics, National Cheng Kung University Hospital, College of Medicine, National Cheng Kung University, Tainan 70101, Taiwan
2
Institute of Clinical Medicine, College of Medicine, National Cheng Kung University, Tainan 70101, Taiwan
3
Education Center, National Cheng Kung University Hospital, College of Medicine, National Cheng Kung University, Tainan 70101, Taiwan
4
Department of Physiology, College of Medicine, National Cheng Kung University, Tainan 70101, Taiwan
5
Institute of Basic Medical Sciences, College of Medicine, National Cheng Kung University, Tainan 70101, Taiwan
*
Authors to whom correspondence should be addressed.
These authors contributed equally to this work.
Biomedicines 2022, 10(8), 1968; https://doi.org/10.3390/biomedicines10081968
Submission received: 12 June 2022 / Revised: 7 August 2022 / Accepted: 9 August 2022 / Published: 13 August 2022
(This article belongs to the Section Drug Discovery, Development and Delivery)

Abstract

:
Phenobarbital (PHB, Luminal Sodium®) is a medication of the barbiturate and has long been recognized to be an anticonvulsant and a hypnotic because it can facilitate synaptic inhibition in the central nervous system through acting on the γ-aminobutyric acid (GABA) type A (GABAA) receptors. However, to what extent PHB could directly perturb the magnitude and gating of different plasmalemmal ionic currents is not thoroughly explored. In neuroblastoma Neuro-2a cells, we found that PHB effectively suppressed the magnitude of voltage-gated Na+ current (INa) in a concentration-dependent fashion, with an effective IC50 value of 83 µM. The cumulative inhibition of INa, evoked by pulse train stimulation, was enhanced by PHB. However, tefluthrin, an activator of INa, could attenuate PHB-induced reduction in the decaying time constant of INa inhibition evoked by pulse train stimuli. In addition, the erg (ether-à-go-go-related gene)-mediated K+ current (IK(erg)) was also blocked by PHB. The PHB-mediated inhibition on IK(erg) could not be overcome by flumazenil (GABA antagonist) or chlorotoxin (chloride channel blocker). The PHB reduced the recovery of IK(erg) by a two-step voltage protocol with a geometrics-based progression, but it increased the decaying rate of IK(erg), evoked by the envelope-of-tail method. About the M-type K+ currents (IK(M)), PHB caused a reduction of its amplitude, which could not be counteracted by flumazenil or chlorotoxin, and PHB could enhance its cumulative inhibition during pulse train stimulation. Moreover, the magnitude of delayed-rectifier K+ current (IK(DR)) was inhibited by PHB, while the cumulative inhibition of IK(DR) during 10 s of repetitive stimulation was enhanced. Multiple ionic currents during pulse train stimulation were subject to PHB, and neither GABA antagonist nor chloride channel blocker could counteract these PHB-induced reductions. It suggests that these actions might conceivably participate in different functional activities of excitable cells and be independent of GABAA receptors.

1. Introduction

Phenobarbital (PHB, phenobarbitone, phenobarb), also known by the trade name Luminal Sodium®, is a medication belonging to a group known as barbiturates. PHB has long been recognized to be an anticonvulsant and a hypnotic because it can facilitate synaptic inhibition in the central nervous system by acting on the γ-aminobutyric acid (GABA) type A (GABAA) receptors [1,2,3,4,5,6,7]. GABAA receptor is a ligand-gated chloride ion channel, which is the most common inhibitory channel in the brain. Pentobarbital also belongs to barbiturates and is similar to phenobarbital. It is recently disclosed to suppress neurogenic inflammation and exert neuroprotective and even anti-neoplastic activities by modifying membrane ion channels other than chloride channels [8,9,10]. Membrane ion channels mediate the excitability of membrane potentials, which is essential to the excitable cells, ex, the neurons. Several neurological diseases, including epilepsy, migraine, movement disorders, or muscular disorders, are caused by the dysfunctions of membrane ion channels [1,11]. Thus, we are curious whether PHB might also exert additional actions on other membrane ionic currents in addition to GABAA receptor-mediated chloride currents.
In this study, membrane Na+ and K+ currents are of interest. As we know, the voltage-gated Na+ (NaV) channels are important for generating and propagating action potentials (APs) in excitable cells [12]. Upon rapid depolarization, NaV channels can go through rapid transitions from the closed (resting) state to the open state and then swiftly change to the inactivated state [12,13]. The inactivation of voltage-gated Na+ current (INa) has been demonstrated to accumulate before being stimulated during repetitive short depolarizing pulses [14,15]. Several kinds of K+ currents were included. First is the erg (ether-à-go-go-related gene) -mediated K+ current (IK(erg)) gated by voltage-dependent K+ (KV) channels of EAG (ether-à-go-go) family. IK(erg) has been known to be intrinsic in cardiac cells or variable types of excitable cells, such as neuroblastoma or neuroendocrine cells. The erg KV channels have peculiar gating kinetics, i.e., rapid inactivation and slow deactivation kinetics. These characteristics are essential in maintaining resting potential and modifying the subthreshold excitability or rhythmic oscillations [16,17,18,19,20,21]. The time-dependent decay of IK(erg) evoked by the envelop-of-tail test has also been modified by different small molecules (e.g., azimilide, opioid agonists, and isoplumbagin) [21,22,23,24]. Therefore, it is worthy of investigating to what extent PHB itself can modify the magnitude and gating of IK(erg).
The KCNQ2, KCNQ3, or KCNQ5 gene is viewed to encode the core subunit of the KV7.2, KV7.3, or KV7.5 channel, respectively. The activity of these KV channels can generate the macroscopic M-type K+ current (IK(M)). The biophysical properties of IK(M) are known to exhibit current activation in response to low-threshold voltage and to display a slowly activating and deactivating time course of the current [25,26]. Furthermore, the magnitude of IK(M) can potentially regulate the availability of NaV channels during prolonged high-frequency firing [27]. Notable studies have also shown that the presence of either the benzodiazepine activator or cannabidiol could activate KV7-encoded currents [28,29]. Therefore, further investigations are warranted to delineate whether PHB has any perturbations on this type of K+ currents.
The KV channels play a role in determining the membrane excitability associated with delayed-rectifier KV channels. The activity of KV3 (KCNC) or KV2 (KCNB) channels and the magnitude of delayed-rectifier K+ current (IK(DR)) are correlated with AP firing in many cell types [18,26,30]. This type of IK(DR) activated during pulse train (PT) stimulations have the propensity to induce the resurgent K+ tail current, which is proposed to serve as a negative-feedback mechanism for the closure of KV channels during high-frequency firing [31]. However, the extent to which PHB can modify the magnitude of IK(DR), especially during pulse train (PT) stimuli, still remains unclear.
In the current study, the electrophysiological effects of PHB on these membrane ion currents were extensively investigated in Neuro-2a cells. Neuro-2a cells have been previously reported to express functional GABAA receptors with barbiturate binding sites [32]. These membrane ion currents, including INa, IK(erg), IK(M), and IK(DR), were explored with a single voltage-clamp pulse or pulse train stimulation and were synergistically inhibited by PHB. This PHB-induced synergistic inhibition of ionic currents may partially contribute to the underlying mechanisms through which PHB or other barbiturates affect the electrical behaviors of excitable cells in cell culture and in vivo.

2. Materials and Methods

2.1. Chemicals, Drugs, and Solutions

Phenobarbital (PHB, Luminal Sodium®, Solfoton®, Tedral®, phenobarbitone, phenobarbitol, 5-ethy-5-pheny-1,3-diazinane-2,4,6-trione [IUPAC name], 5-ethyl-5-phenylbarbituric acid, C12H12N2O3), flumazenil (FLM), tetraethylammonium chloride (TEA) and tetrodotoxin (TTX) were purchased from Sigma-Aldrich (Genechain, Kaohsiung, Taiwan). Thiopental sodium (Pentothal®) was acquired from SCI Pharmatech (Taoyuan, Taiwan), while midazolam was from Nan Kuang Pharmaceutical (Tainan, Taiwan). Chlorotoxin was kindly provided by Professor Dr. Woei-Jer Chuang (Department of Biochemistry, National Cheng Kung University Medical College, Tainan, Taiwan) [21].
For cell preparations, culture media, fetal bovine serum, L-glutamine, and trypsin/EDTA were supplied by HyCloneTM (Thermo Fisher, Tainan, Taiwan). All other chemicals were acquired from regular commercial chemicals and of reagent grade. In the current study, reagent water was obtained from a Milli-Q ultrapure water purification system (Millipore; Merck, Tainan, Taiwan).

2.2. Cell Preparation

Neuro-2a (N2a), a clonal cell line originally derived from mouse neuroblastoma, was purchased from the Bioresources Collection and Research Center ([BCRC-60026, https://catalog.bcrc.firdi.org.tw/BcrcContent?bid=60026 (accessed on 10 Jan 2022)], Hsinchu, Taiwan). Neuro-2a cells, originally derived from the American Type Culture Collection (ATCC® [CCL-131TM]; Manassas, VA, USA), has been used as electrically excitable cells in many studies of electrophysiology and pharmacology [11,33,34,35,36]. Cells were cultured in DMEM supplemented with 10% (v/v) heat-inactivated fetal bovine serum, 2 mM L-glutamine, 1.5 g/liter sodium bicarbonate, 0.1 mM non-essential amino acids, and 1.0 mM sodium pyruvate in a humidified atmosphere of CO2/air (1:19) at 37 °C [21,37,38]. Subcultures were made by trypsinization (0.025% trypsin solution [HyCloneTM] containing 0.01% sodium, N,N,-diethyldithiocarbamate and EDTA). Electrophysiological measurements were commonly conducted when cells reached 50–70% confluence (usually 5–7 days) [21].

2.3. Electrophysiological Measurements

In the few hours before the experiments, we dispersed Neuro-2a cells with a 1% trypsin/EDTA solution, and a few drops of cell suspension (106/mL) was quickly transferred to a custom-made chamber firmly mounted on the working stage of a DM-IL inverted microscope (Leica; Major Instruments, Kaohsiung, Taiwan). Cells were then bathed at room temperature (20–25 °C) in normal Tyrode’s solution, whose composition is described above. Before each experiment, cells were allowed to settle on the chamber’s bottom. The patch pipettes were pulled from Kimax®-51 borosilicate glass tube (#DWK34500–99; Kimble®, Merck, Tainan, Taiwan) and were further polished to reach their resistances ranging between 3 and 5 MΩ. During the recordings, the electrodes were mounted in an air-tight holder, which had a suction port on the side, and a silver-chloride wire was used to make contact with the internal electrode solution [39]. We recorded varying types of ionic currents (i.e., INa, IK(erg), IK(M), and IK(DR)) with the whole-cell mode of a modified patch-clamp technique by using either an Axoclamp-2B (Molecular Devices, Sunnyvale, CA) or an RK-400 amplifier (Bio-Logic, Claix, France), as described elsewhere [19,21,26,40]. The liquid junction potentials that occur when the composition of the pipette internal solution differed from that in the bath were zeroed shortly before giga-Ω formation was made, and the whole-cell data were corrected [21]. As pulse train (PT) stimulation was applied to the tested cell, we used an Astro-Med Grass S88X dual output pulse stimulator (Grass; KYS Technology, Tainan, Taiwan).

2.4. Data Recordings

The data were stored online in an ASUSPRO-BU4011LG laptop computer (ASUS, Tainan, Taiwan) at the sampling rate of 10 kHz. The computer was equipped by a Digidata® 1440A acquisition device (Molecular Device; Bestgen Biotech, New Taipei City, Taiwan), through which analog-to-digital and digital-to-analog conversions were controlled by pCLAMP® 10.6 software (Molecular Devices). Current signals were low pass filtered at 3 kHz. We analyzed off-line the signals acquired during the experiments by use of different analytical tools, including LabChartTM 7.0 program (AD Instruments; Gerin, Tainan, Taiwan), OriginPro® 2021 (OriginLab Corp.; Scientific Formosa, Kaohsiung, Taiwan), and custom-made macros built in Excel® 2022 (Redmond, DC, USA). We created various voltage-clamp protocols used in this work from pCLAMP® 10.6 and, through digital-to-analog conversion, different waveforms were used to investigate the current versus voltage (I-V) relationship, the steady-state inactivation curve, or the recovery of current inactivation for specific ionic currents (i.e., INa or IK(erg)) [12,21].

2.5. Whole-Cell Data Analyses

In order to evaluate the percentage inhibition of PHB on the INa amplitude, each tested cell was 30 ms depolarized from −100 to −10 mV, and current magnitudes during cell exposure to different PHB concentrations were measured and compared at the start of the voltage pulse. The concentration of PHB required to suppress 50% of the peak component of INa activated in response to short depolarizing pulse was thereafter determined using a Hill function:
y = E m a x { 1 + ( I C 50 n H / [ P H B ] n H ) }
where y = percentage inhibition (%); [PHB] = the PHB concentration applied; nH = the Hill coefficient; IC50 = the concentration required for a 50% inhibition of INa; Emax = PHB-induced maximal inhibition of peak INa.

2.6. Curve-Fitting Approximations and Statistical Analyses

Curve parameter estimation was made by a non-linear or linear fitting routine with a least-squares minimization procedure, in which the “Solver” add-in bundled with Excel® 2021 (Microsoft, Redmond, WA, USA) was employed [41]. The results are presented as the mean ± standard error of the mean (SEM). The sizes of independent samples (n) indicated the cell number from which the investigation was performed. The statistical significance between the two groups was analyzed by using paired or unpaired Student’s t-test, while as the difference among more than two groups was needed, post hoc least-significance tests were further performed. The statistical analyses were performed by using SPSS 20.0 software (IBM Corp., Armonk, NY, USA). A statistical significance was considered when p < 0.05.

3. Results

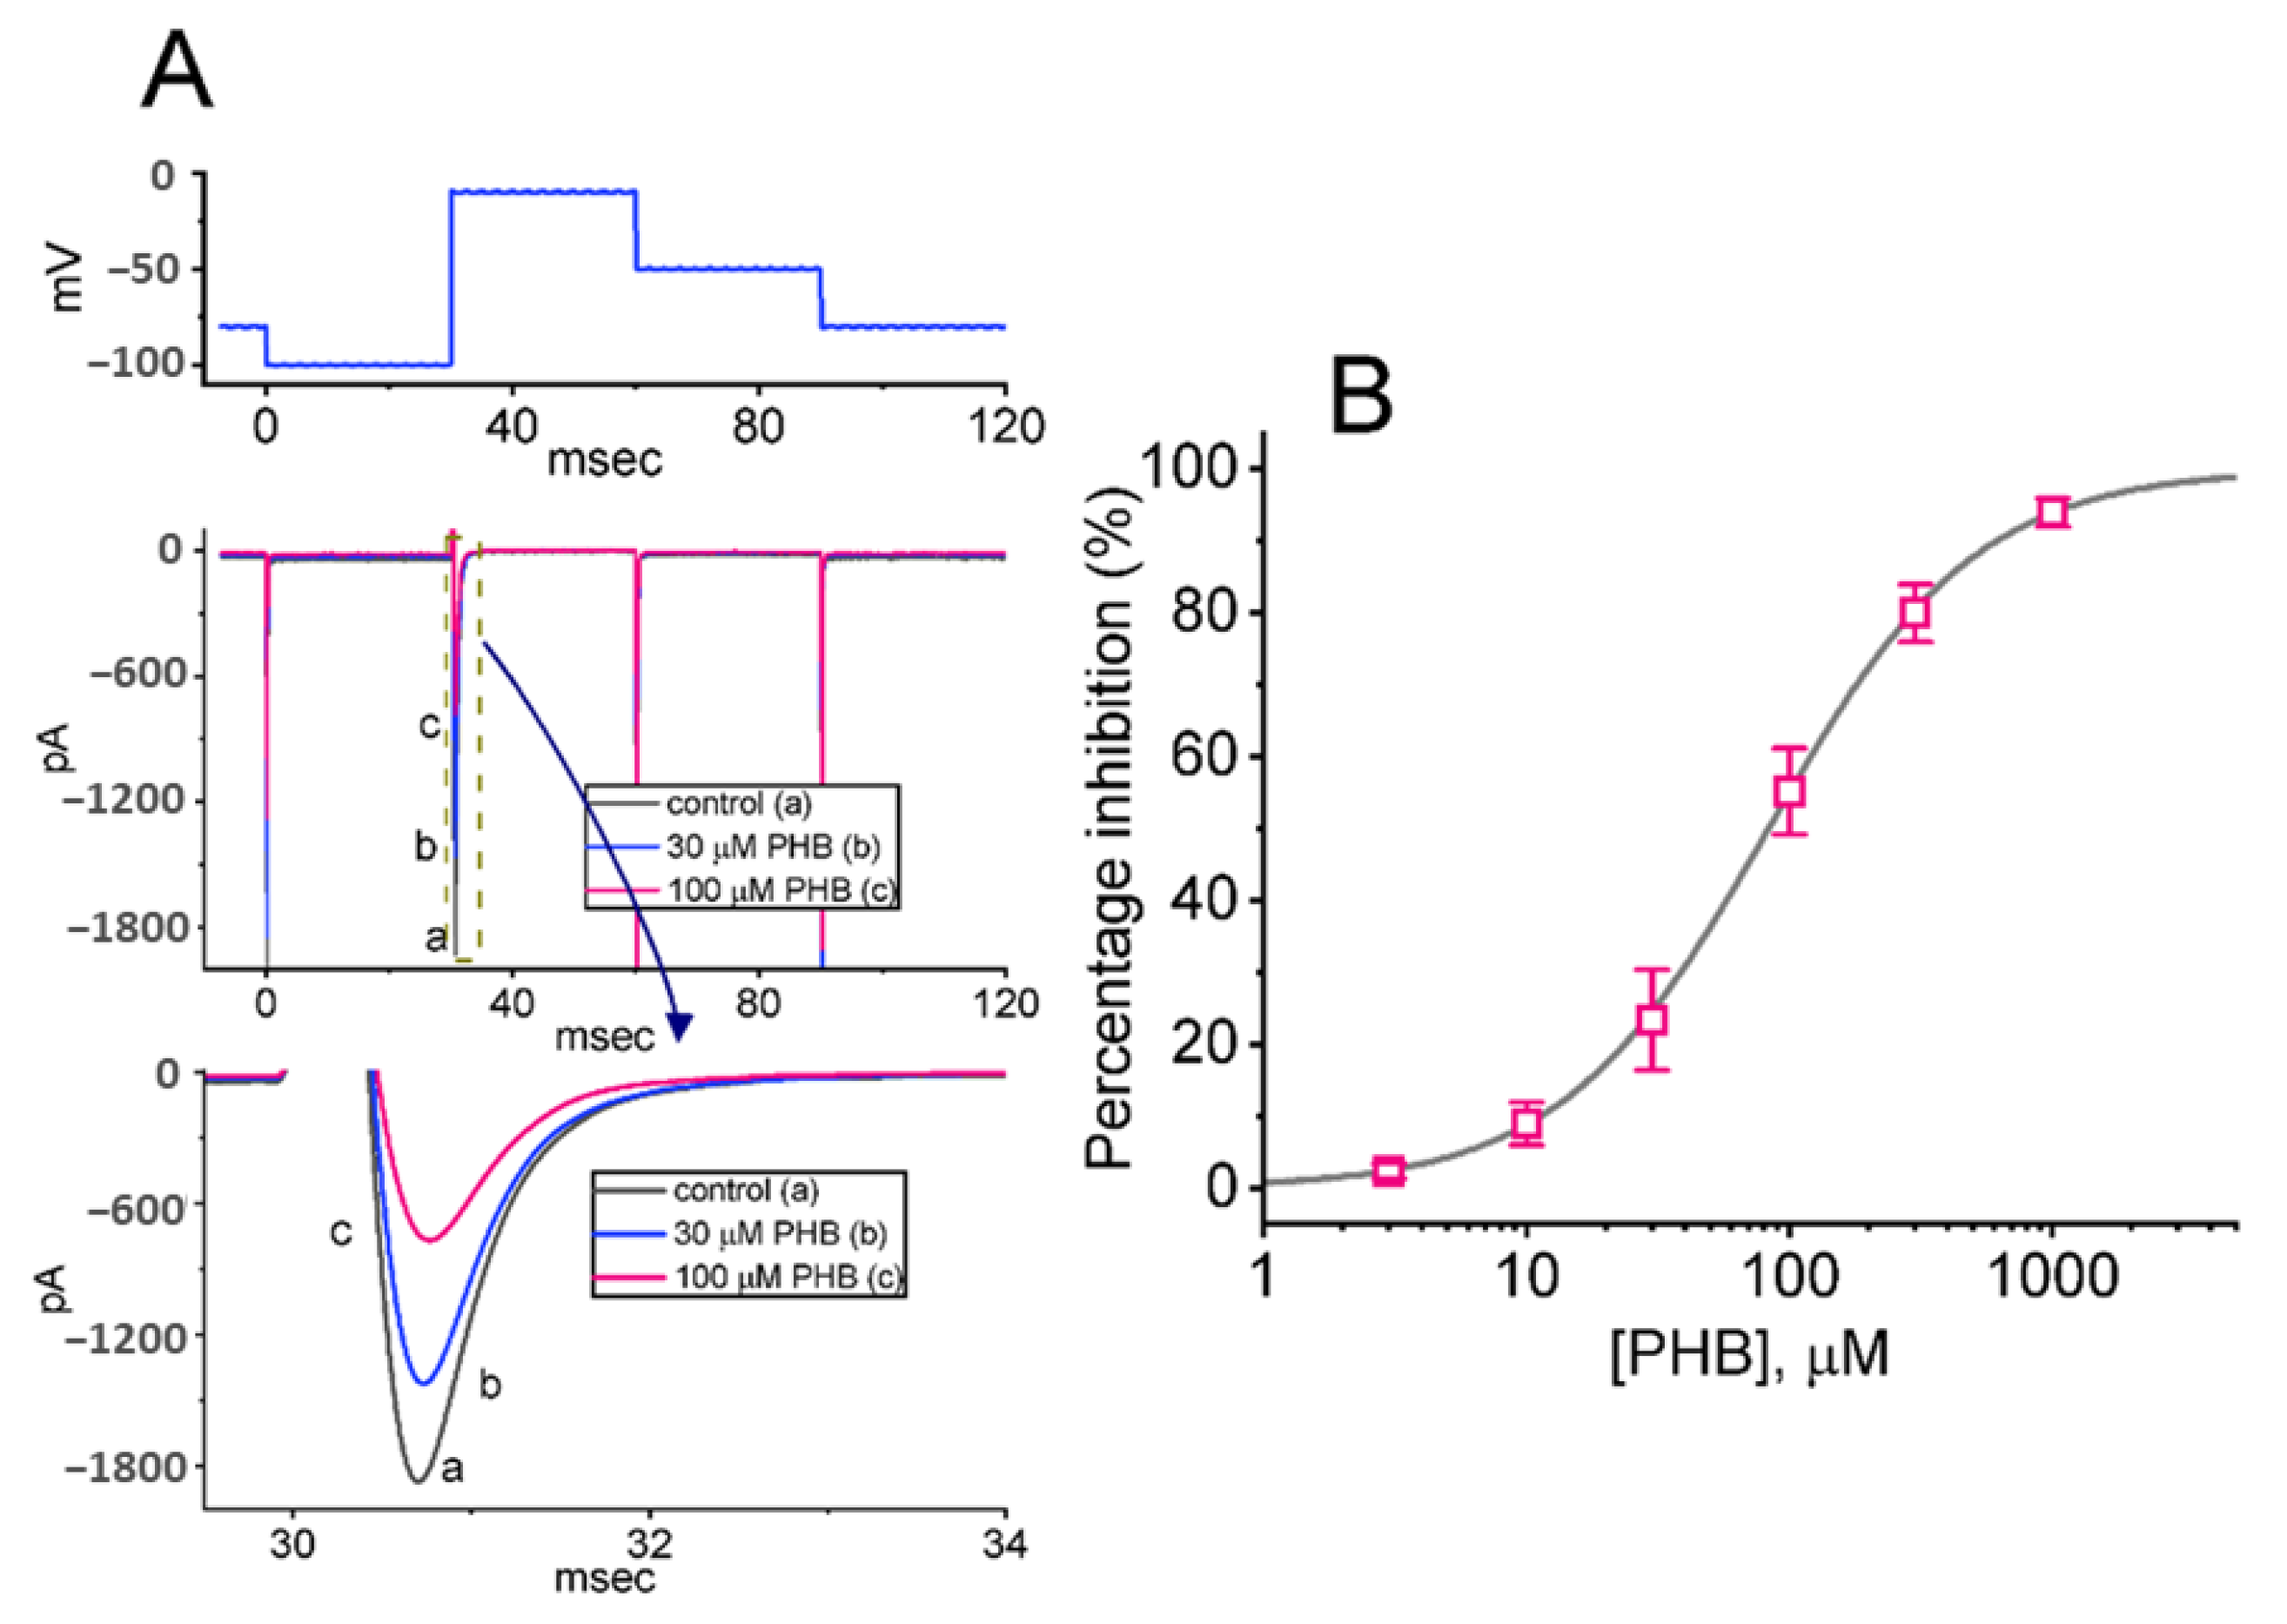
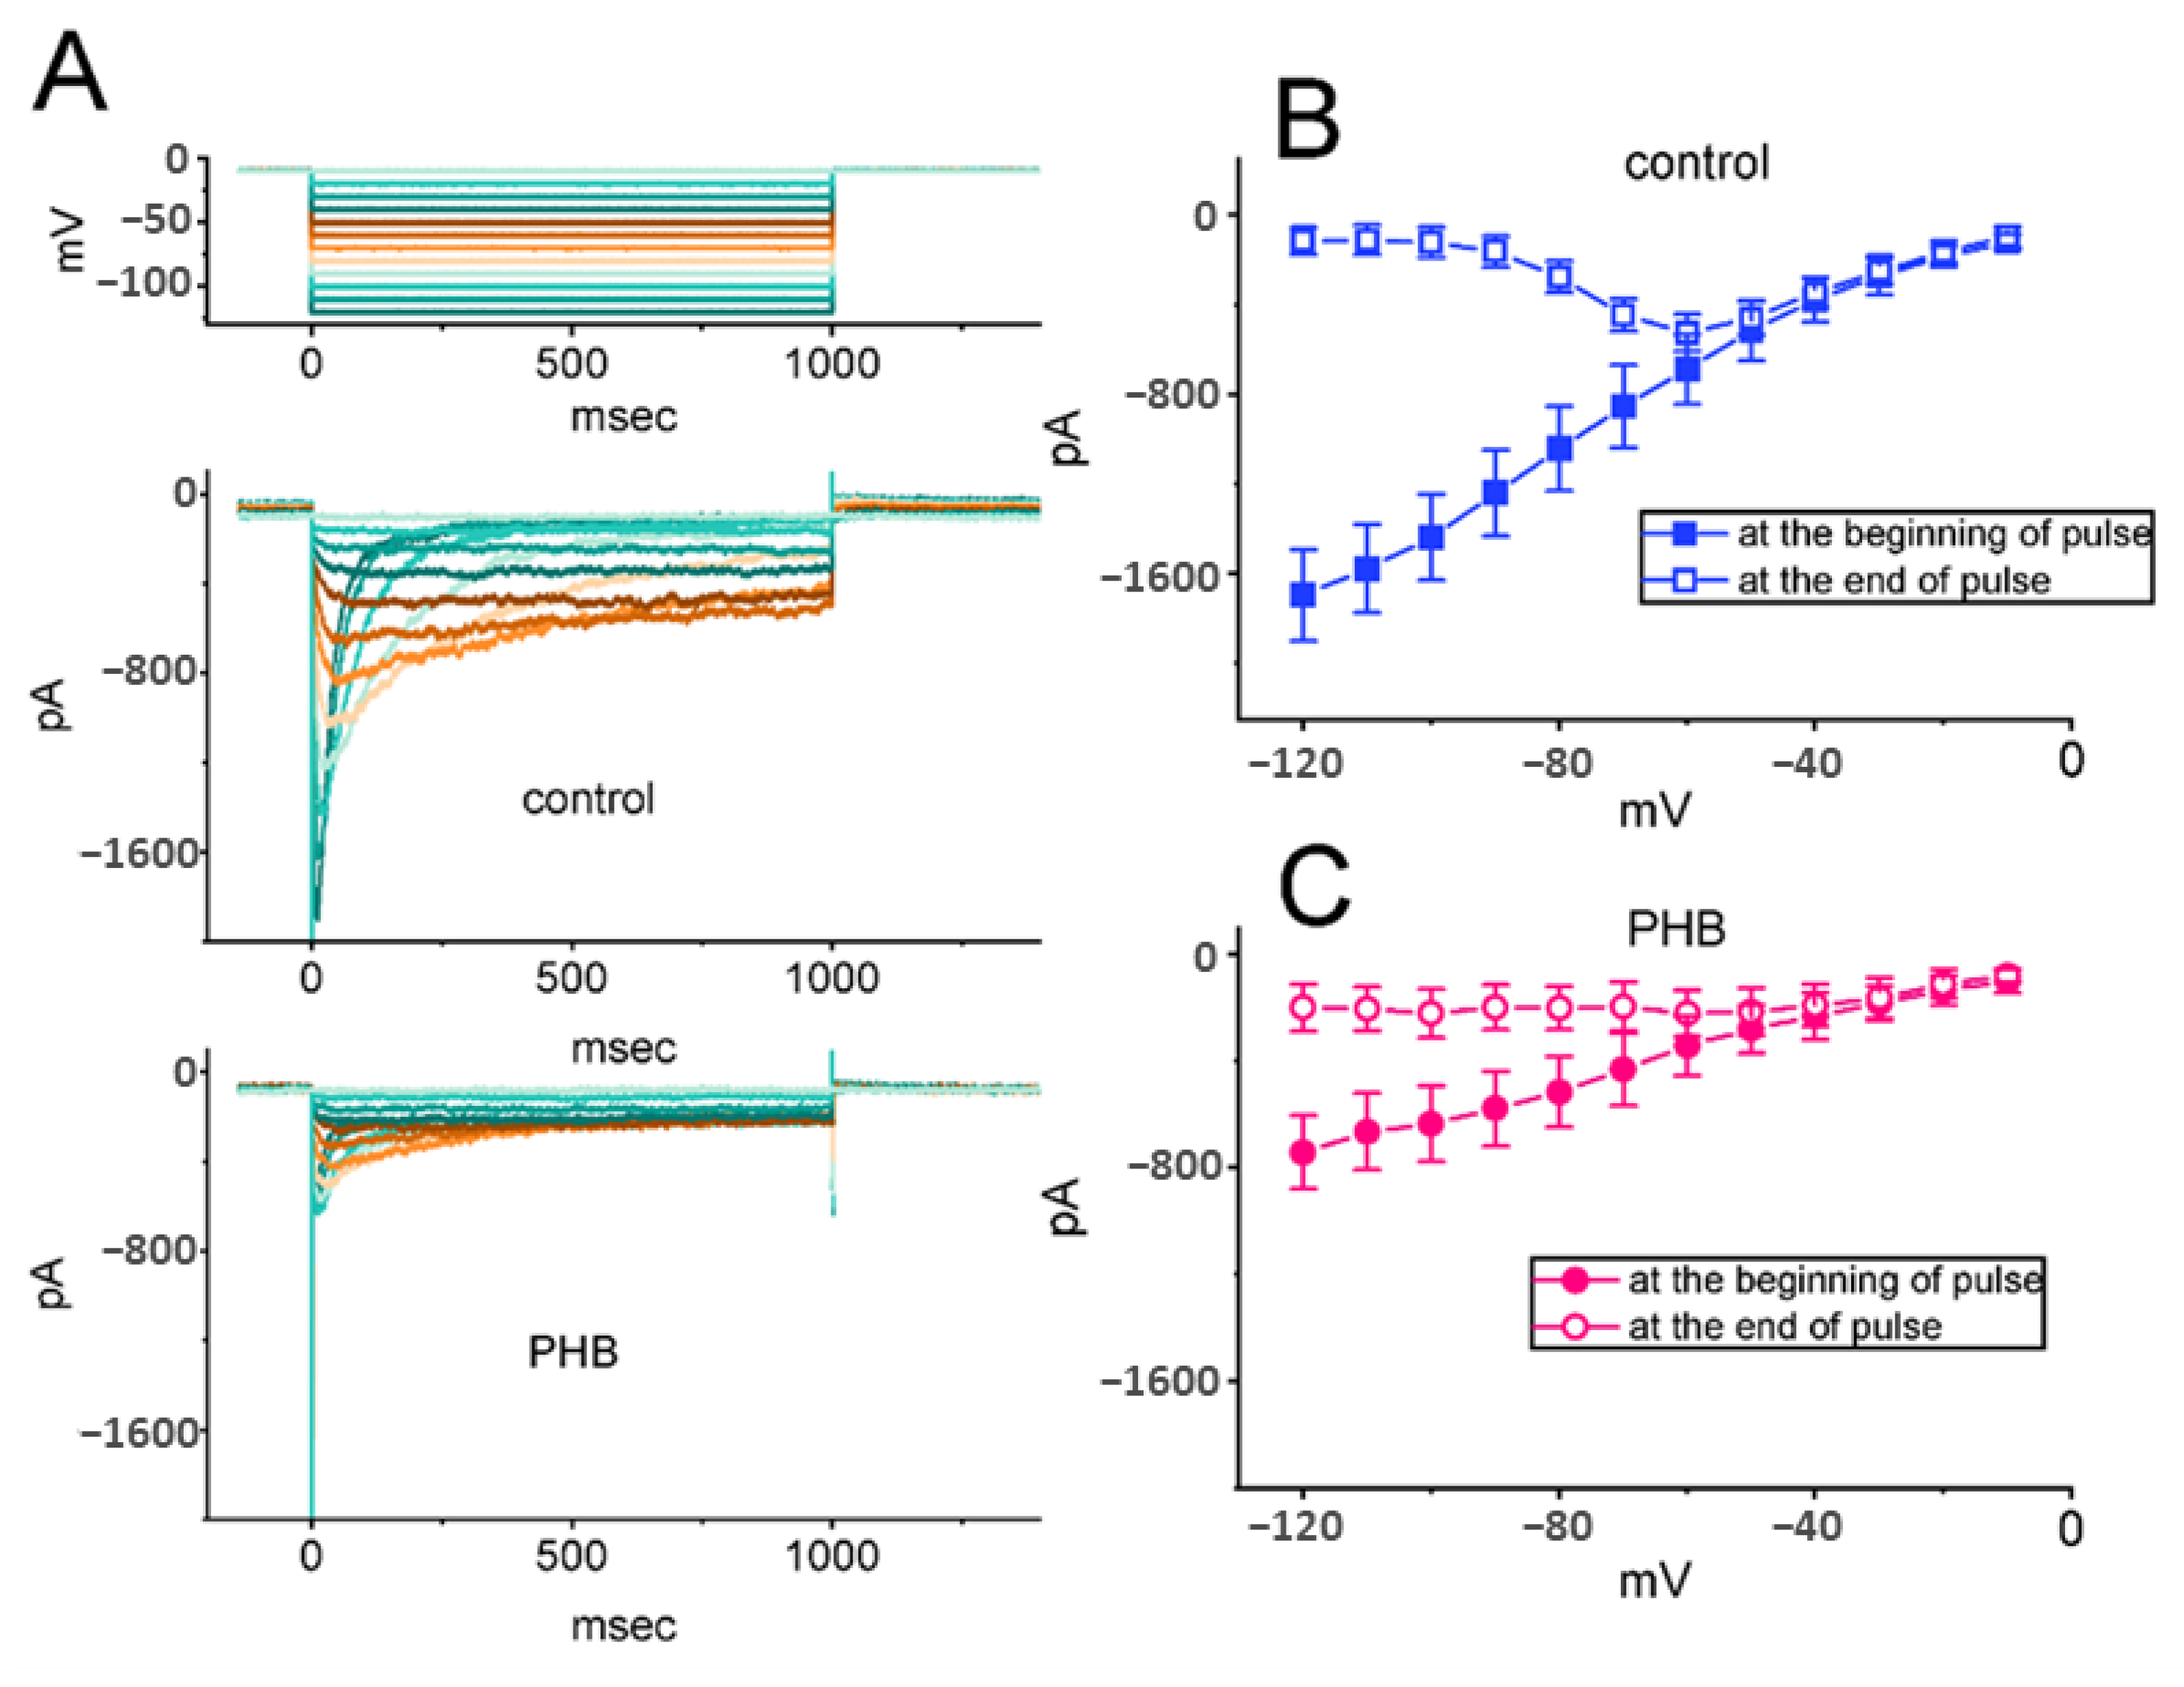
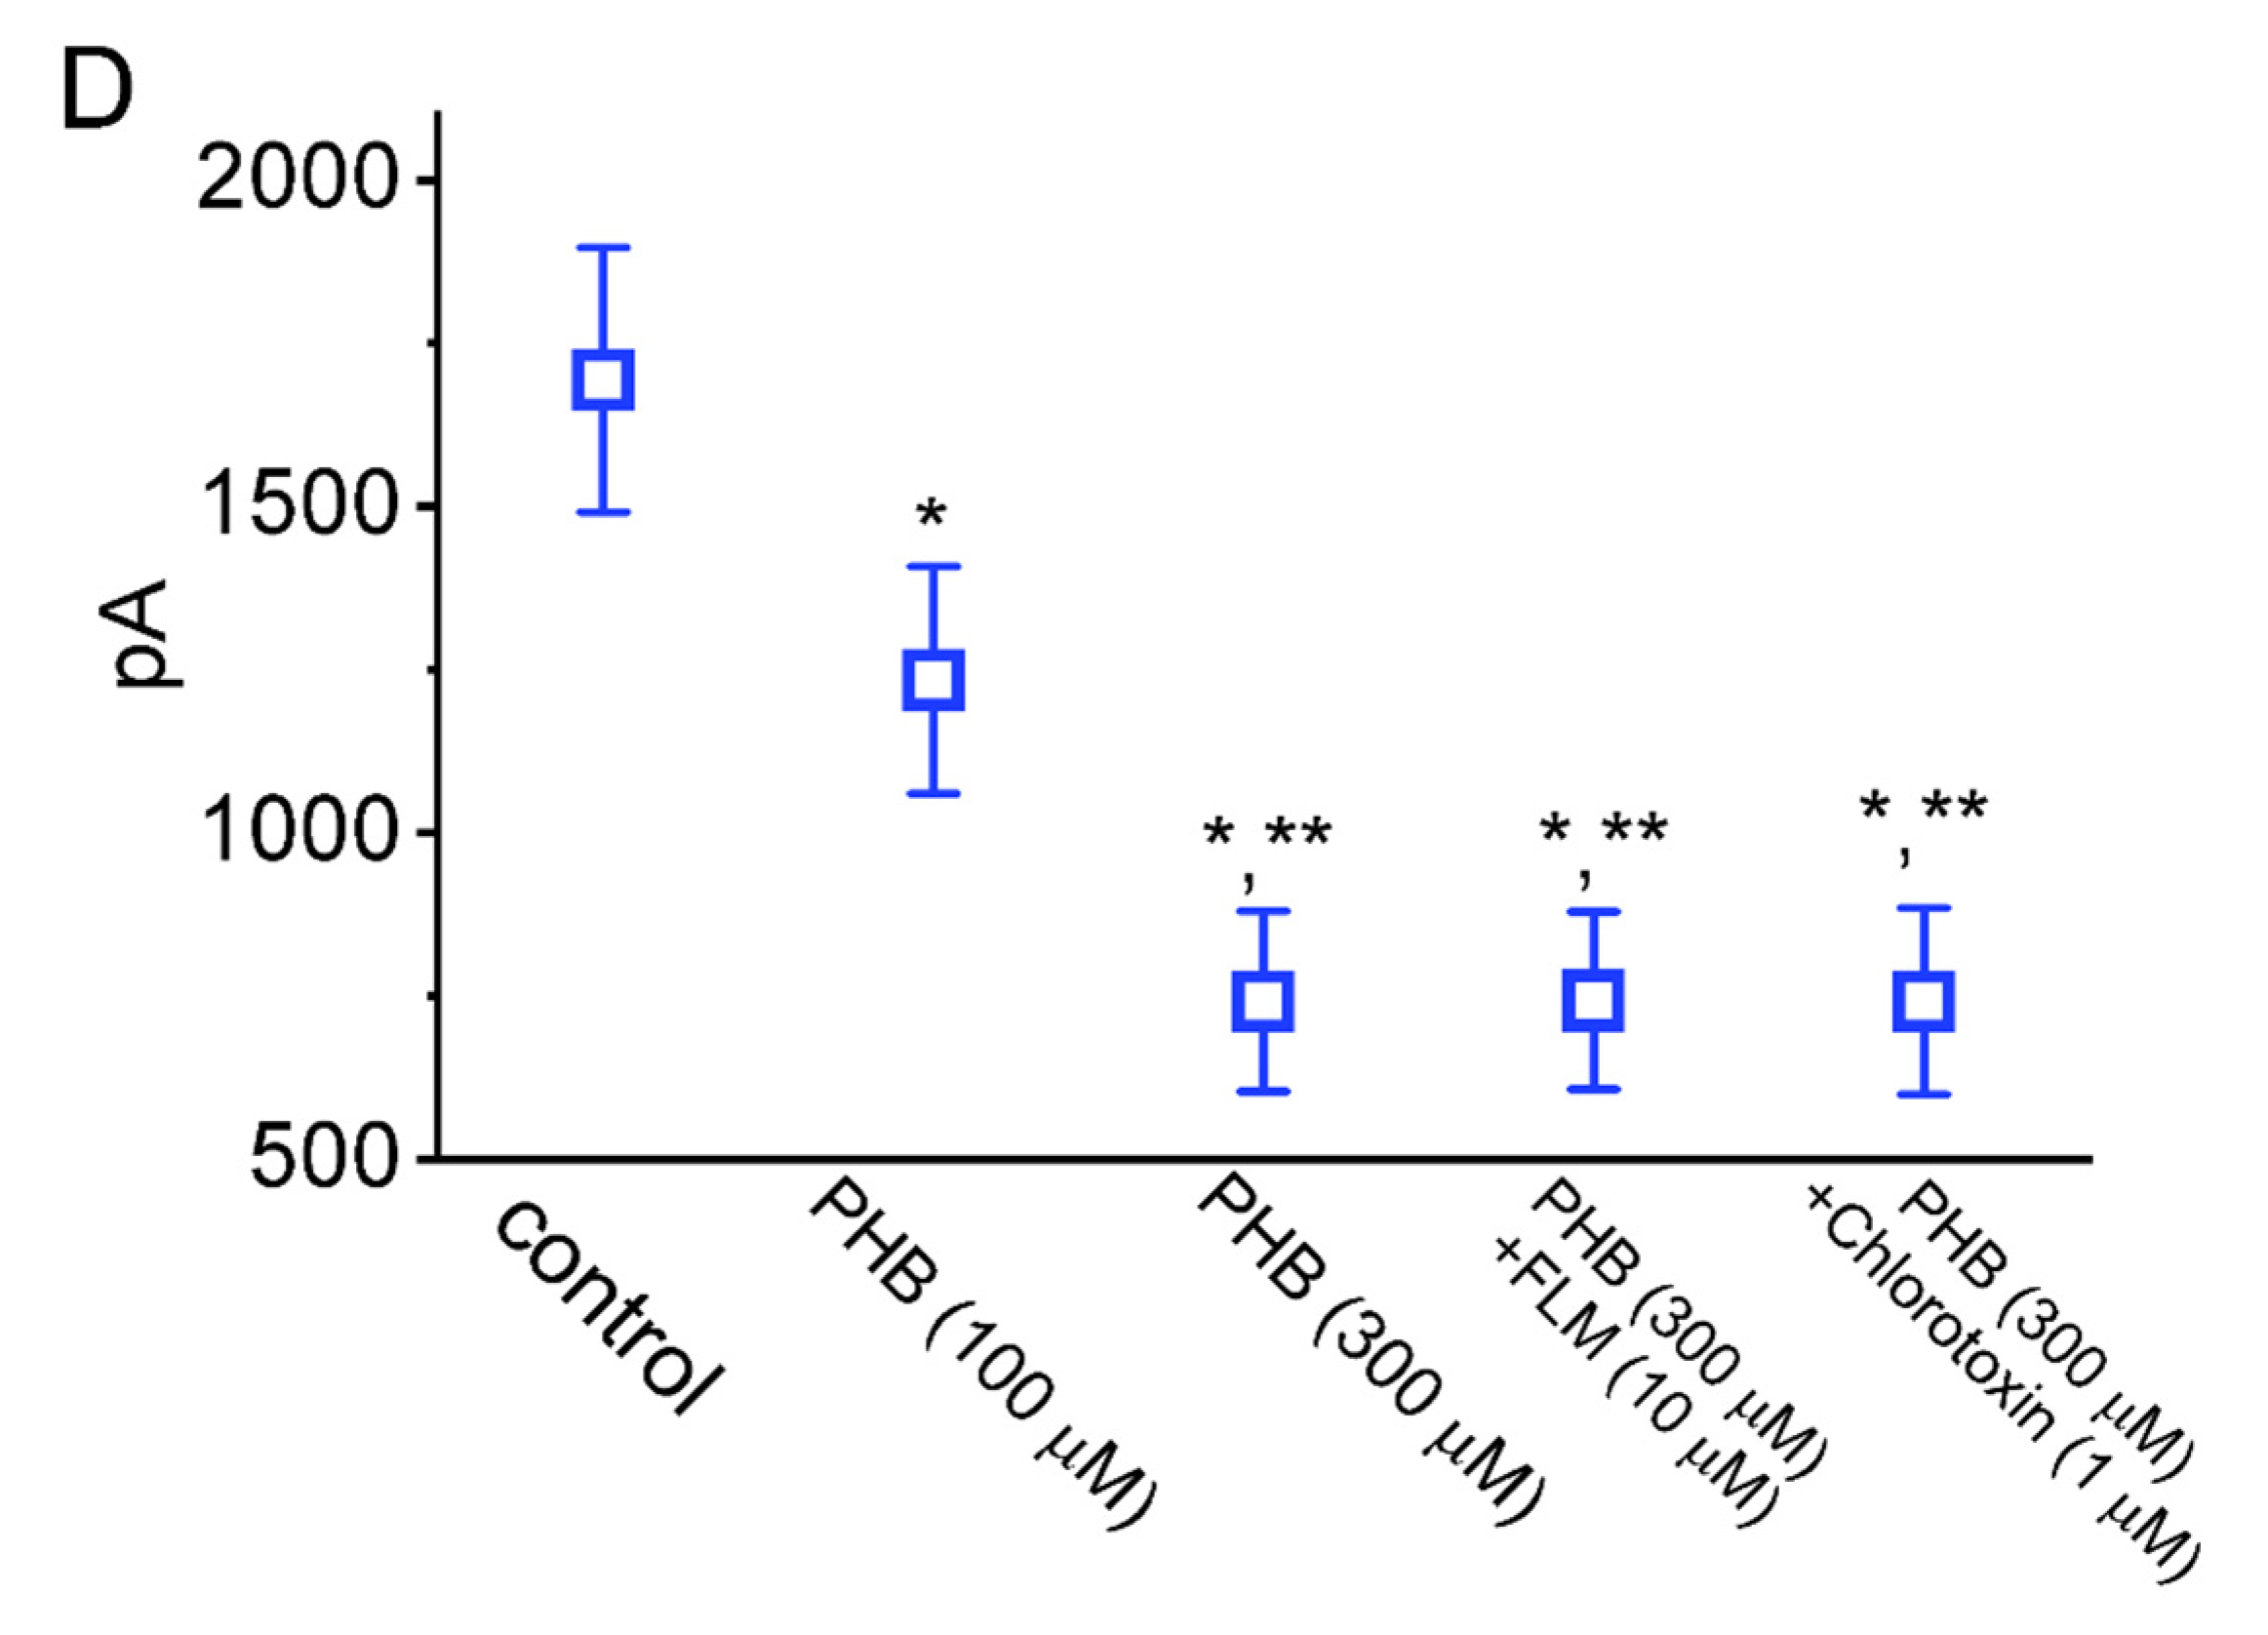
3.1. Effects of PHB on the Amplitude of Voltage-Gated Na+ Current (INa) in Neuro-2a Cells

In the beginning, the INa amplitude activated in response to rapid membrane depolarization was tested in different concentrations of PHB. Cells were placed in Ca2+-free, Tyrode’s solution, which contained 10 mM tetraethylammonium chloride (TEA) and 0.5 mM CdCl2. TEA and CdCl2 are recognized to block voltage-gated K+ and Ca2+ channels, respectively. Upon the short depolarizing pulse from −100 to −10 mV, the peak amplitude of INa with a rapidly activating and inactivating time course was decreased at the exposure to 30 and 100 µM PHB (Figure 1A). For example, in the presence of 100 µM PHB, INa amplitude was profoundly reduced to 812 ± 25 pA (n = 8, p < 0.05) from a control value of 1867 ± 78 pA (n = 8, Figure 1A). The current amplitude was returned to 833 ± 29 pA (n = 8) after the removal of PHB. The time constants of INa activation, and fast and slow components of current inactivation in the control period (i.e., no PHB) were respectively 0.61 ± 0.01, 0.91 ± 0.01, and 1.93 ± 0.03 ms (n = 8), while those of activation, and fast and slow components of inactivation in the presence of PHB were respectively 0.61 ± 0.01, 0.92 ± 0.01, and 1.94 ± 0.03 ms (n = 8, p > 0.05). It indicates no obvious change in activation or inactivation time course of INa activated by abrupt membrane depolarization was demonstrated as cells were exposed to PHB.
The relationship between the PHB concentrations and the peak INa was further constructed. As demonstrated in Figure 1B, the INa amplitudes obtained at different PHB concentrations were collated and then estimated. The cumulative addition of PHB in the range between 3 µM and 1 mM resulted in a concentration-dependent reduction in the peak amplitude of INa. According to a modified Hill equation stated in Materials and Methods, the IC50 value for the PHB-mediated inhibition of peak INa was optimally yielded to be 83 µM. The data, therefore, reflect that the PHB can exert a depressant action on the depolarization-activated INa in a concentration-dependent fashion in Neuro-2a cells.

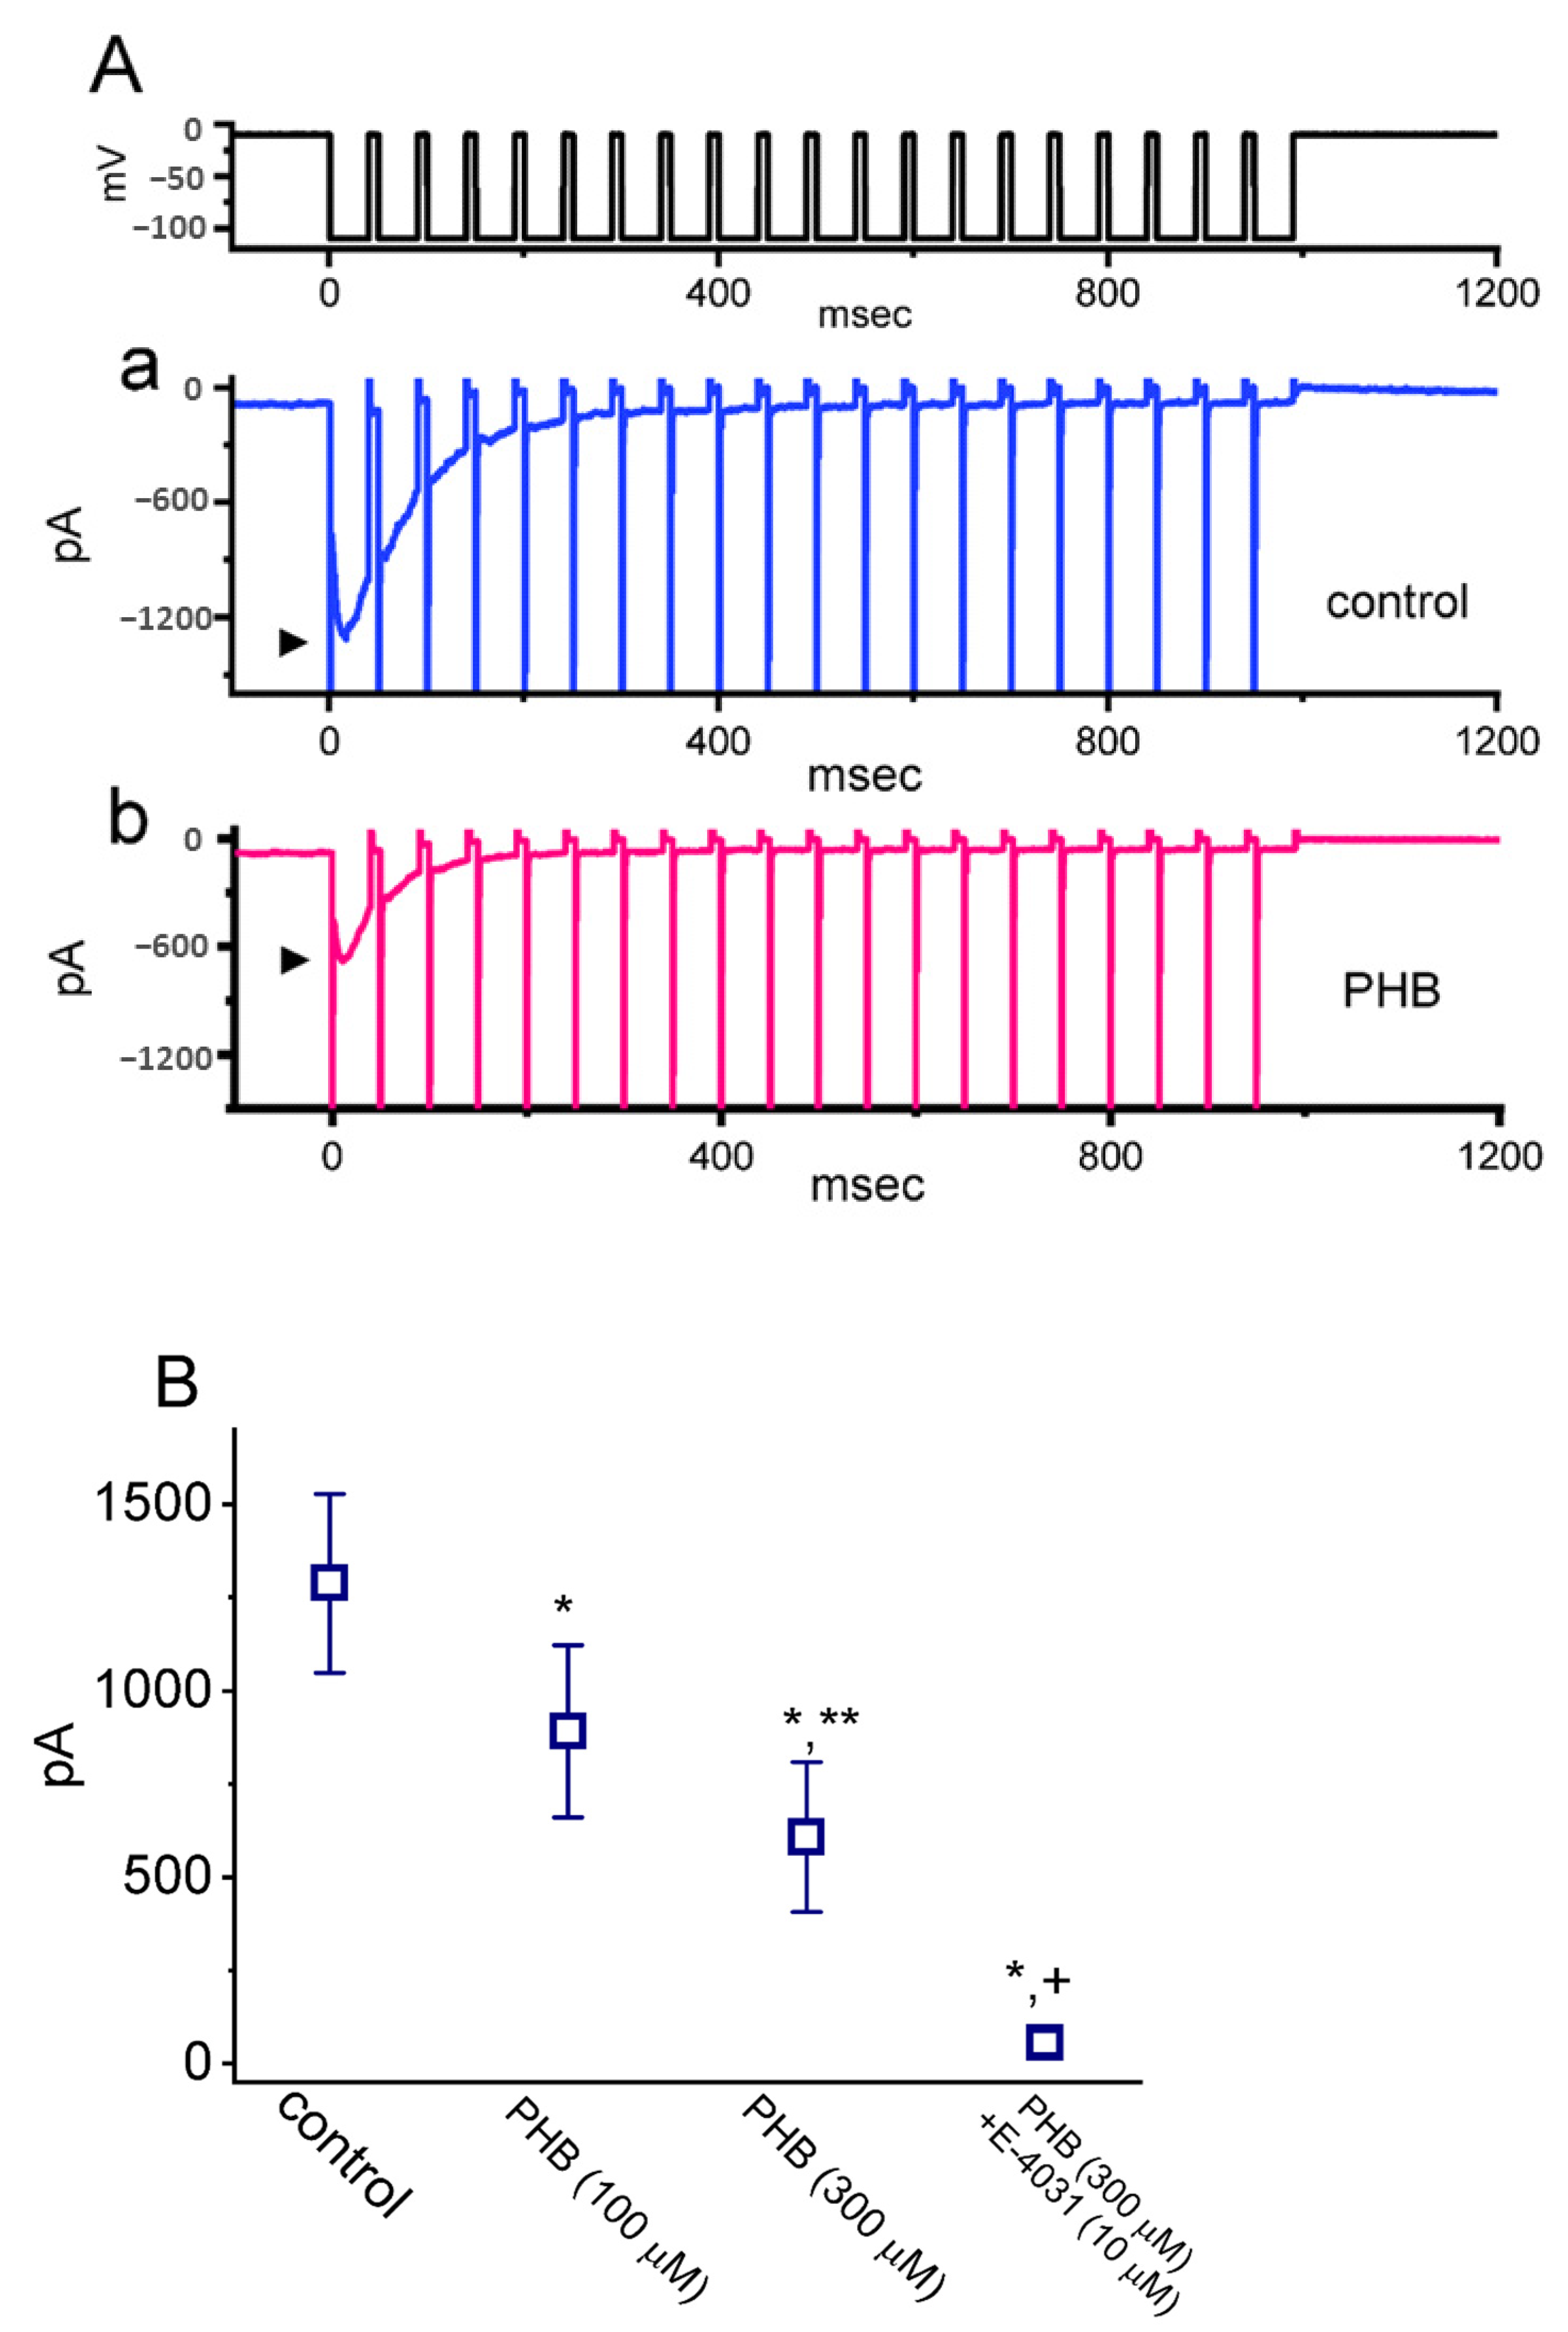
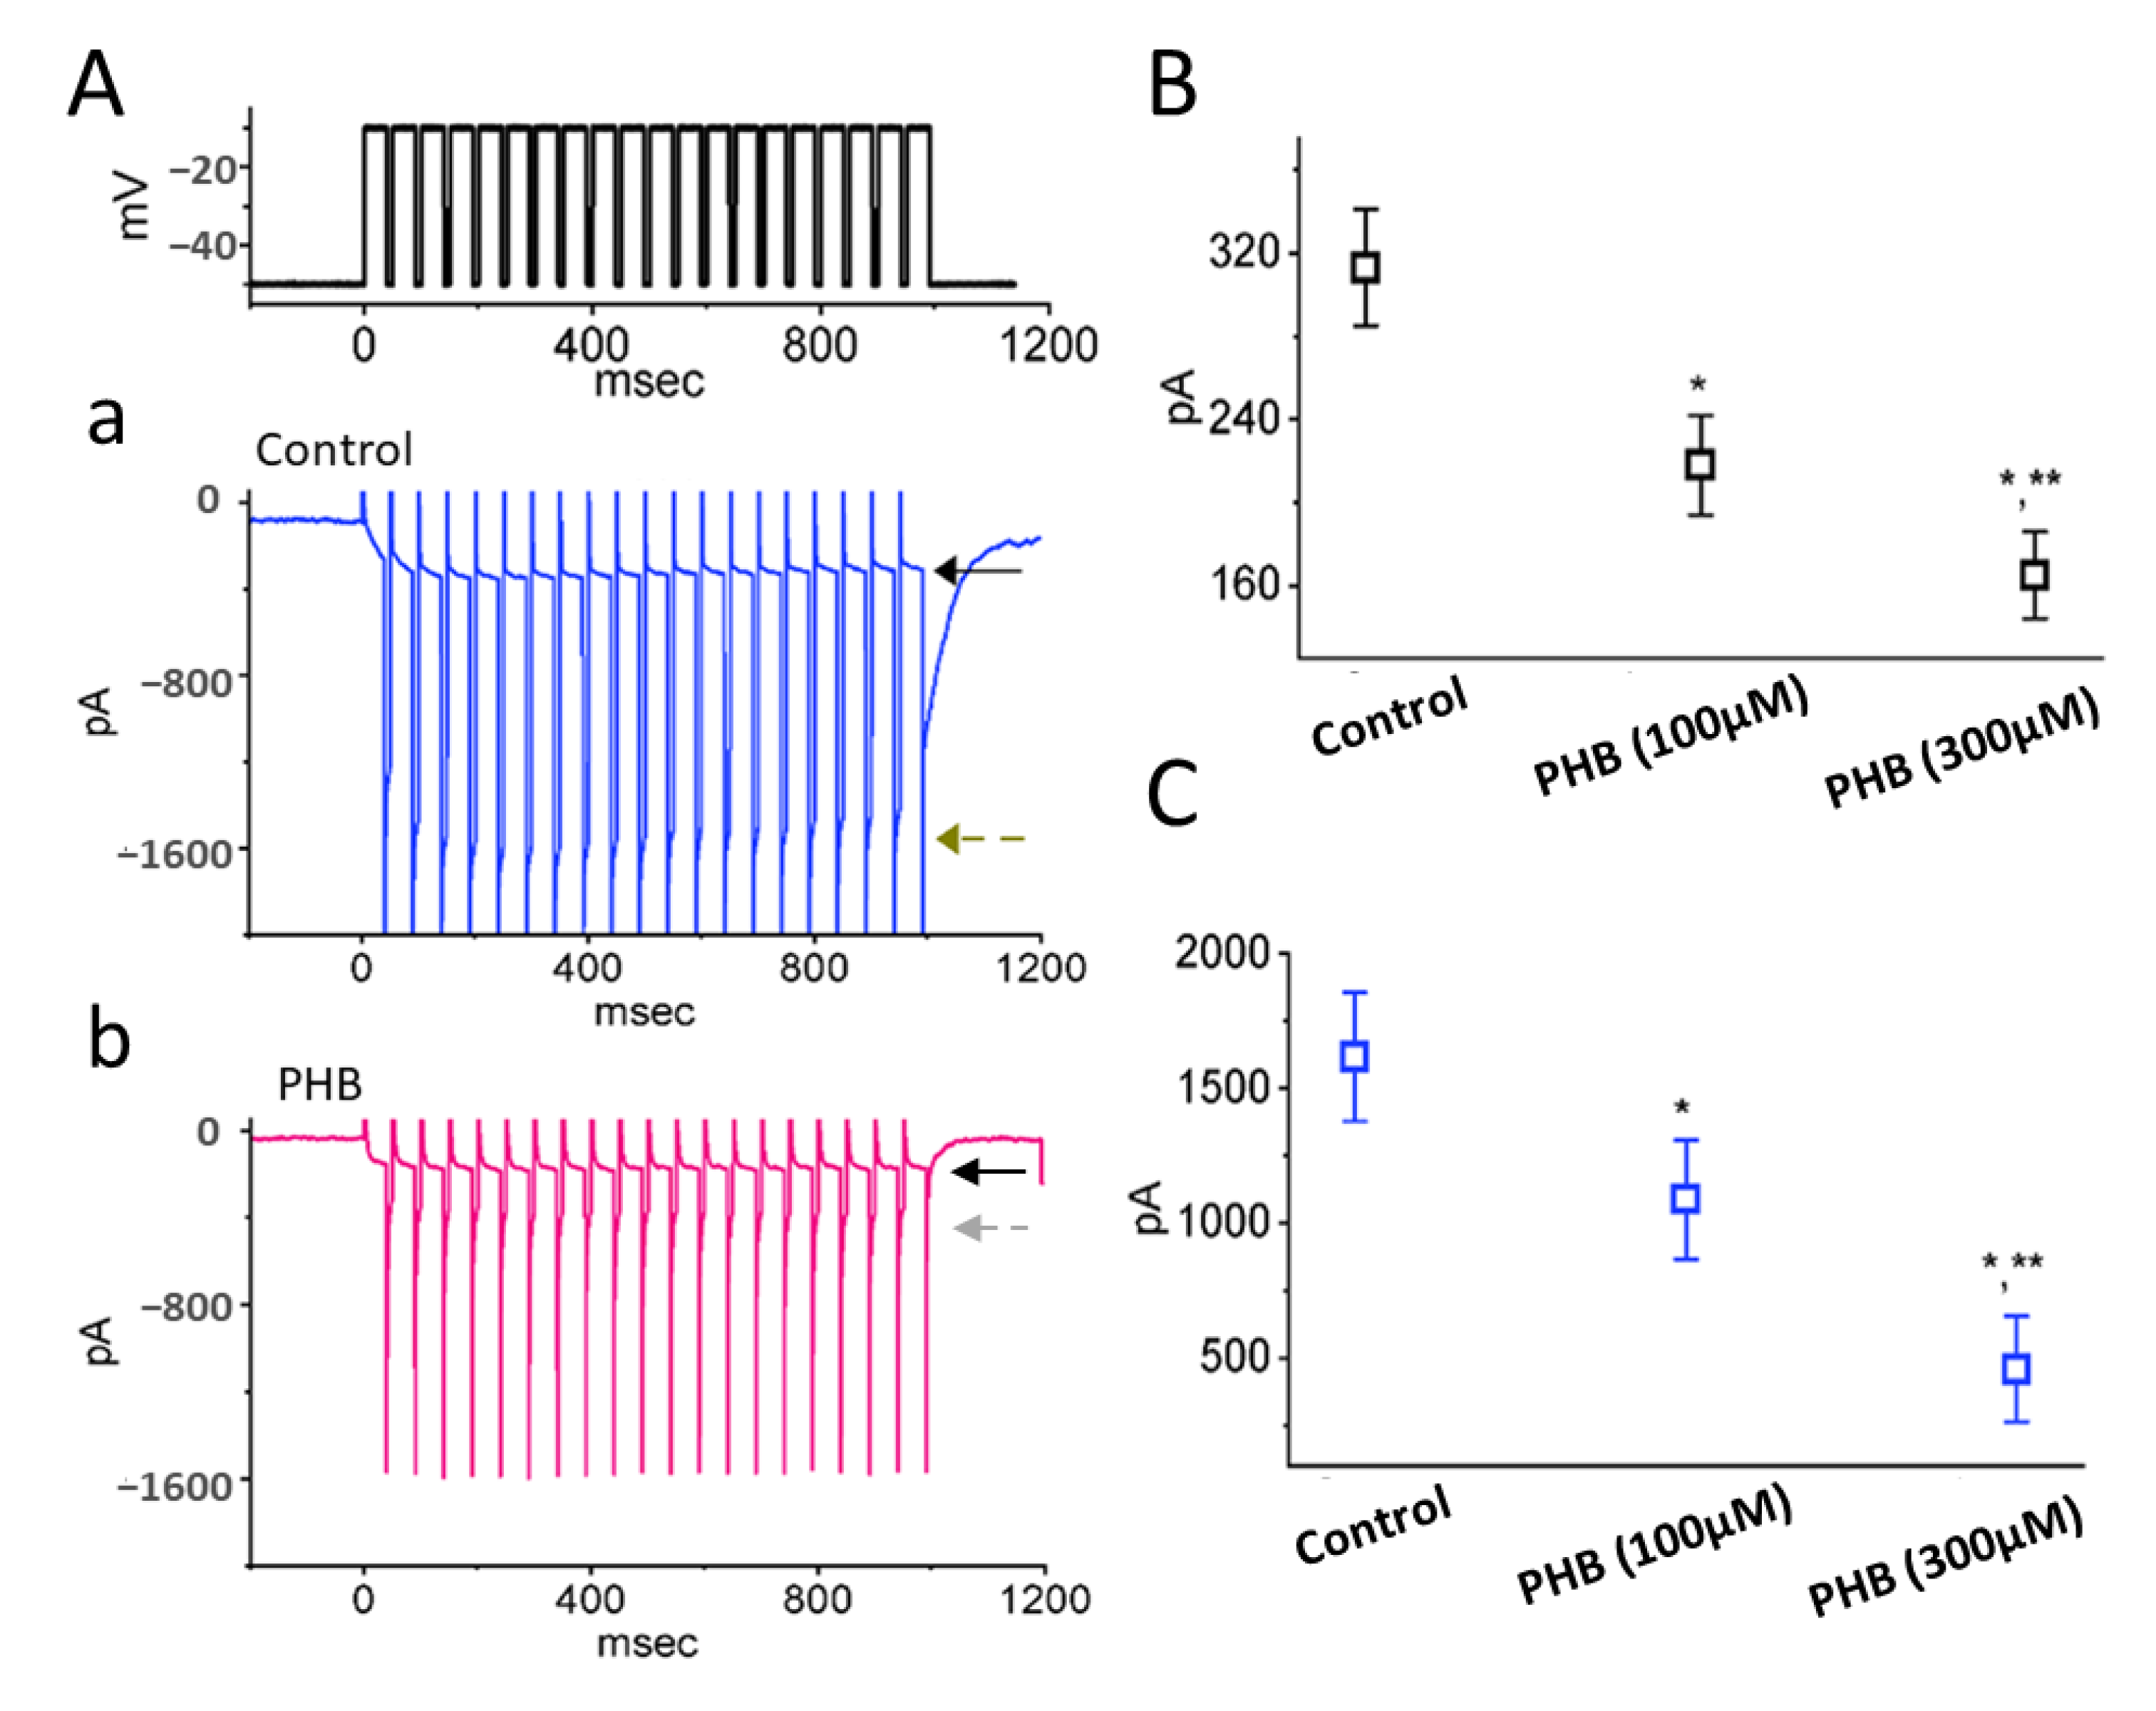
3.2. PHB-Induced Increase in Cumulative Inhibition of INa Inactivation

High-frequency action potential transmission is important for rapid information processing in the central nervous system. INa inactivation has been previously shown to accumulate prior to being activated during repetitive pulse train (PT) stimulation [14,15,40,42]. Therefore, further experiments were performed to explore whether PHB could modify the inactivation process of INa elicited by the PT stimuli. The PT stimuli were induced by repetitive PT depolarizations to −10 mV (20 ms in each pulse with a rate of 40 Hz for 1 s) when the cell was held at −80 mV. In Figure 2(Aa),B, the INa inactivation was evoked in Neuro-2a cells by a 1 s PT stimulus from −80 to −10 mV with the single-exponential time constant (τ) of 104 ± 28 ms (n = 7) in the control period (i.e., no PHB). It indicates a considerable slowing in current inactivation during PT stimulation. When cells exposure to PHB (30 or 100 µM), the exponential time course of INa evoked by the same PT stimulations was strikingly shortened to 81 ± 22 ms (n = 8, p < 0.05) or 45 ± 14 ms (n = 8, p < 0.05), respectively (Figure 2(Ab),B), in addition to a profound decrease in INa amplitude in response to rapid membrane depolarization. Furthermore, tefluthrin (Tef, 10 µM) could partially reverse the PHB-mediated reduction of current decay with a τ value of 87 ± 23 ms (n = 8, p < 0.05, Figure 2B). Tef is a synthetic insecticide known to activate INa [43,44,45].

3.3. Effects of PHB on erg-Mediated K+ Current (IK(erg)) Residing in Neuro-2a Cells

We continued to explore the possible perturbations of PHB on the magnitude of IK(erg). In order to amplify IK(erg), cells were placed in a high-K+, Ca2+-free solution containing 1 µM TTX. The recording electrode was filled up with a K+-enriched solution [18,19,46]. The different command voltages ranging between −120 and −10 mV for 1 s were imposed to induce hyperpolarization-activated IK(erg) when the tested cell was held at −10 mV (Figure 3A) [18,19,21,26]. The average current-versus-voltage (I-V) relationship of the peak (filled symbols) or sustained (open symbols) component of IK(erg) in the absence (control) or presence of 300 µM PHB was constructed, respectively (Figure 3B,C). For example, upon membrane hyperpolarization from −10 mV, PHB decreased the peak IK(erg) from a control value (i.e., no PHB) of 686 ± 156 pA (n = 8) to 343 ± 112 pA (n = 8, p < 0.05) at the level of −60 mV and decreased the sustained IK(erg) from 526 ± 82 pA (n = 8) to 222 ± 88 pA (n = 8, p < 0.05). The presence of PHB (300 µM) could suppress both the peak and sustained component of deactivating IK(erg) throughout the entire measurement (Figure 3C).
We further investigated whether PHB-induced inhibition of IK(erg) was associated with GABA-mediated inhibition or not. FLM is an antagonist of GABAA receptors, while chlorotoxin is a blocker of Cl- channels. In the presence of PHB (300 µM), neither FLM nor chlorotoxin could overcome the PHB-mediated inhibition of IK(erg) activated by long-lasting membrane hyperpolarization (Figure 3D). The results suggested that PHB-induced inhibition of IK(erg) in these cells is unlinked to its propensity to interact with GABAA receptors, as reported previously in other cell types [7,9,33,47,48,49,50].

3.4. Modification by PHB on the Magnitude of IK(erg) Activated by PT Stimulation

We further explored if PHB could modify the extent of IK(erg) activated in the PT hyperpolarizing stimuli. The stimulus protocol, consisting of repetitive hyperpolarization to −110 mV (40 ms in each pulse with a rate of 20 Hz for 1 s), was imposed over the tested cells held at −10 mV. In the absence of PHB (control), the 1 s repetitive hyperpolarization from −10 to −110 mV evoked the IK(erg) decay with a decaying τ of 147 ± 22 ms (n = 7) (Figure 4(Aa)). Upon exposure to 300 µM PHB, the τ value in the exponential time course of decaying IK(erg) evoked by the same train of hyperpolarizing pulses was shorted to 87 ± 11 ms (n = 7, p < 0.05) (Figure 4(Ab)), and the IK(erg) amplitude was reduced, too (Figure 4B). E-4031 is an inhibitor of IK(erg) [18,51], and E-4031 could further diminish the IK(erg) amplitude in the presence of 300 µM PHB (Figure 4B). These results indicate that, apart from the reduction in IK(erg) magnitude, the decrease in the decaying of IK(erg) elicited by a 1 s PT hyperpolarizing pulse (i.e., accumulative inactivation of the current) can be enhanced by PHB in these cells.

3.5. Slowing in Recovery from IK(erg) Block Caused by PHB in Neuro-2a Cells

We continued to explore if PHB could lead to any modifications on recovery from the block of IK(erg). The recovery from the current block was conducted by using a two-step voltage-clamp protocol in which the interval of depolarizing command pulses (i.e., conditioning pulse) varies with a geometrics-based progression. After each conditioning pulse, a hyperpolarizing pulse stepped back to −110 mV for 500 ms was applied to evoke deactivating IK(erg). As the duration of the conditioning pulse was set at 2048 ms, the amplitude of the tail current (i.e., deactivating IK(erg)) activated by hyperpolarizing step from −10 to −110 mV with a duration of 500 ms was taken as 1.0. The relative amplitude of IK(erg) with different duration of conditioning pulse was measured and then compared. In the absence of PHB (control), the peak amplitude of deactivating IK(erg) was fully restored from the block when the pulse duration was set at 2048 ms or above (Figure 5(Aa),B). Interestingly, the time course of recovery from the current block was appropriately fitted by a single exponential, and the τ values could be derived. The τ values were 387 ± 12 ms (n = 7) in the absence of PHB and 823 ± 23 ms (n = 7) in the presence of PHB. As a result, PHB produces a considerable lengthening in the recovery from the block of deactivating IK(erg) in Neuro-2a cells.

Modification by PHB of the Time Course of IK(erg) Evoked by the Envelope-of-Tail Test

Earlier investigations have demonstrated a time-dependent change in IK(erg) activation during the envelope-of-tail test [21,22,23,24,52]. Here, we then analyzed an inward activating and deactivating IK(erg) evoked by varying durations of conditioning pulse (from 4 to 2048 ms with a geometrics-based progression) to −10 mV from −110 mV, and the relationship of the relative amplitude versus the pulse duration was established in Figure 5C. Like earlier investigations [21,24], the envelope-of-tail test tailored for the activation of IK(erg) seen in Neuro-2a cells exhibits a time-dependent exponential decay in the ratio of the relative amplitude (i.e., Iact/Ideact) evoked during the pulse durations between 4 and 2048 ms in a geometrics-based progression. When Neuro-2a-cell exposure to 300 µM PHB, the τ value of IK(erg) activated by the envelope-of-tail method was significantly reduced to 64 ± 3 ms (n = 7, p < 0.05) from a control value of 112 ± 11 ms (n = 7). It is conceivable that PHB has the propensity to reduce the time course of IK(erg) activation evoked during the envelope-of-tail voltage protocol residing in Neuro-2a cells.

3.6. Modification by PHB of M-Type K+ Current (IK(M)) in Neuro-2a Cells

Next, we continued examining if PHB could modify the magnitude of IK(M) in Neuro-2a cells. Cells were placed in a high-K+, Ca2+-free solution, and the recording electrode was filled up with K+-enriched solution. Upon membrane depolarization from −50 to −10 mV, PHB-treated cells exerted an inhibitory effect on IK(M) amplitude (Figure 6A,B). This PHB-mediated inhibition of IK(M) amplitude could not be reversed by adding FLM (10 µM) or chlorotoxin (1 µM) (Figure 6B). Thus, unlike the stimulatory action of benzodiazepine derivative or cannabidiol on KV7-encoded currents, PHB exerts a depressant action of IK(M) in Neuro-2a cells. However, the inactivating properties of IK(M) shown in Figure 6A could be due to the interference by other types of delayed-rectifier K+ currents. The averaged I-V relationships of IK(M) with or without PHB (300 μM) were made, and the results are shown in Figure 6C.

3.7. Modification by PHB on IK(M) Inactivation during PT Stimulation

A recent study has demonstrated the capability of IK(M) to maintain the availability of NaV channels during prolonged high-frequency firing [27]. Therefore, we further examined if the PHB could modify the extent of IK(M) during PT stimulation in Neuro-2a cells. The results showed that PHB (100 µM or 300 µM) obviously decreased the amplitudes of activating and deactivating IK(M) during 1 s PT stimulation (Figure 7A–C). For example, PHB (300 µM) decreased the amplitudes of activating IK(M) to 165 ± 21 pA (n = 7, p < 0.05, Figure 7B) and the amplitudes of activating IK(M) to 459 ± 195 pA (n = 7, p < 0.05, Figure 7C). These disclosed that PHB-mediated inhibition of IK(M) remained efficacious upon high PT stimulation. It is conceivable that the availability of NaV channels during high-frequency firing in unclamped cells became further retarded during the exposure to PHB, despite its ability to suppress the INa amplitude directly, as described above.

3.8. Inhibitory Effect of PHB on Delayed-Rectifier K+ Current (IK(DR)) Residing in Neuro-2a Cells

The IK(DR) has been previously revealed to be suppressed by pentobarbital, another barbiturate, as well as to display the resurgent K+ tail currents during high PT stimulations [50,53] We additionally explored if the PHB could modify the magnitude of IK(DR) in these cells. In this series of experiments, cells were placed in Ca2+-free, Tyrode’s solution, which contained 1 µM TTX and 0.5 mM CdCl2, and the recording electrode used was filled up with K+-enriched solution. Under the voltage-clamp current recordings, the tested cell was held at −50 mV, and a series of voltage pulses ranging between −60 and +50 mV was imposed over it. In Figure 8A, upon the presence of 300 µM PHB, the IK(DR) amplitude was clearly suppressed, especially at the voltages above −10 mV. The average I-V relationship of IK(DR) is illustrated in Figure 8B.

3.9. PHB-Induced Increase in Cumulative Inhibition of IK(DR) Inactivation in Neuro-2a Cells

In the last series of measurements, we wanted to investigate if PHB can modify the time course of IK(DR) in response to long-lasting PT stimulation intrinsically in Neuro-2a cells. Under the control condition (i.e., no PHB), a single 10 s depolarizing step from −50 to +50 mV resulted in an exponential decline with a time constant of 2.12 ± 0.08 s (n = 8) (Figure 9A). In contrast, the time constant for 10 s PT stimulation to +50 mV, each of which lasted 100 ms with 100 ms interval at −50 mV between the depolarizing stimuli, was conceivably reduced to 1.78 ± 0.07 s (n = 8, p < 0.05, Figure 9(Ba)). In the presence of 300 µM PHB, the decaying time constant in response to 10 s repetitive depolarizing pulses was obviously decreased to 0.92 ± 0.05 s (n = 8, p < 0.05, Figure 9(Bb)). This decrease in the decaying time constant mediated by PHB could not be modified by FLM (10 µM). Thus, it is possible that the excessive accumulative inactivation of IK(DR) during the exposure to PHB might be irrelevant to GABAA receptors.

4. Discussion

The noticeable findings demonstrated in this work are that PHB can regulate the magnitude of multiple types of ionic currents (i.e., INa, IK(erg), IK(M), and IK(DR)) residing in Neuro-2a cells. Consistent with previous observations [54], the presence of PHB itself suppressed peak INa in a concentration-dependent manner with an estimated IC50 of 83 µM (Figure 1). However, the magnitude of PHB-mediated block in these ionic currents failed to be overcome by the subsequent addition of FLM or chlorotoxin. The cumulative inhibition of ionic currents activated during pulse train stimulation was facilitated by PHB. The PHB-induced rise in INa decay during repetitive stimulation was reversed by Tef. These experimental observations reflected that the reduction of INa, IK(erg), IK(M), and IK(DR) caused by PHB in Neuro-2a cells tends to be acute and may be independent of GABAA receptor-mediated chloride currents. In addition, these actions could potentially contribute to PHB-induced perturbations on the electrical behaviors of excitable cells (e.g., the discharge patterns in the high-frequency firing of action potentials [APs]), presuming that similar in vivo findings appear [55,56].
Previous work has demonstrated that the train of depolarizing pulses could be efficacious in perturbing the magnitude of INa, i.e., current decaying over time in an exponential fashion [14]. This blocking effect is essential in regulating sensory transduction because the driven spike rates can reach hundreds of hertz in response to strong stimuli. As a corollary, the reduced availability of NaV channels during prolonged repetitive activity (i.e., long-lasting trains of high-frequency APs) would attenuate the spike waveform, and Ca2+ flux and Ca2+-dependent exocytosis would be subsequently impaired at the nerve terminal. In our study, PHB was noted to shorten the τ value of INa decay responding to PT stimulation (Figure 2). Thus, it would further diminish NaV-channel availability at the same time.
The magnitude of INa could be rapidly declined in an exponential manner during high-frequency stimulation, as demonstrated previously [14,40,42] (Figure 2). In other words, during prolonged repetitive activity, the availability of NaV channels was profoundly decreased in a time-dependent fashion. By comparison, the decaying rate of INa during such high PT stimulation was noticeably faster than that of IK(erg), IK(M), or IK(DR) (Figure 4, Figure 7, and Figure 9) seen in Neuro-2a cells. Although the gating kinetics or inactivation-dependent mechanisms residing in these K+ currents are overly distinguishable [21,24,31,46,52], the difference in current decaying during PT stimulation could be of particular significance. The main reason for this is because the magnitude of these K+ currents (i.e., resurgent K+ tail currents) could maintain the membrane in a spike-ready state, thus conferring optimal repriming of INa during the occurrence of prolonged repetitive activity [27,31]. In this scenario, the augmentation of cumulative IK(erg), IK(M), or IK(DR) inactivation caused by PHB during high-frequency activity is relevant because it is able to suppress the rapid firing of neuronal APs and cause an additional loss-of-change in stable waveform and high-fidelity synaptic signaling, particularly in high-frequency firing [27]. Therefore, during high-frequency firing of neurons, the presence of PHB itself would decrease the magnitude of post-spike and steady-state currents leading to diminishing the subthreshold depolarized potential.
In the current study, PHB could slow the recovery of the IK(erg) block and increase the decay of IK(erg) activated by the envelope-of-tail method (Figure 5). These findings suggested that the molecule of PHB is capable of interacting with the open states (conformations) of the Kerg channels present in Neuro-2a cells.
Distinguishable from a recent study [28], the IK(M) present in Neuro-2a cells was directly suppressed by PHB. However, it should be emphasized that the IK(M) amplitude can gradually and progressively arise during repetitive APs because of its slow activation and deactivation kinetics [27]. Upon high-frequency stimulation, the accumulation of IK(M) is allowed to hyperpolarize the after-potential and consequently speed up the recovery of NaV channels from inactivation as well to increase the availability of these channels. The PHB facilitated the cumulative inhibition of IK(M) during PT stimulation (Figure 7). It means that the waveform of neuronal action potentials (APs) in high frequency could be distorted by PHB, and presynaptic signaling occurring across the full dynamic range of the system was thereafter potentially perturbed.
Despite its rapid deactivation kinetics, IK(DR) amplitude (e.g., KV3.1-encoded current), identified previously as a timely resurgent K+ current, can be progressively raised during high-frequency stimulation [31]. During high-frequency stimulation, the accumulation of IK(DR) can be allowed to hyperpolarize the after-potential as well as speed up the recovery of NaV channels from inactivation. In this study, we found that the IK(DR) in Neuro-2a cells can be susceptible to being blocked by PHB, and the cumulative inhibition of IK(DR) during prolonged (i.e., 10 s) repetitive stimulation was enhanced (Figure 9). Consequently, the magnitude of INa recovery from current inactivation during PT stimulation would become slowed owing to the enhanced cumulative inhibition of IK(erg), IK(DR), and IK(M) [27,31,57]. In this scenario, as cells were exposed to PHB, the high-frequency firing of neuronal APs would lose the emergence of APs’ stable waveforms leading to serious perturbations in high-fidelity synaptic signaling (e.g., the presynaptic release of neurotransmitters) [56]. In other words, the negative feedback mechanism on KV channel closure during high PT stimulation would be impaired during the exposure to PHB [27,31]. Therefore, susceptibility to PHB in vivo may depend on the pre-existing resting potential level, the high-frequency firing, and the concentration of PHB.
From previous pharmacokinetic studies, the recommended plasma concentrations of PHB for anti-seizure activities ranged between 10 and 35 µg/mL (or 43 and 151 µM), while for prophylaxis against febrile convulsions was around 15 µg/mM (or 65 µM) [3,5,58]. Because PHB is a lipophilic compound, its membrane concentration would be higher than blood levels. This study showed that the PHB concentration for the half-maximal inhibition of INa seen in Neuro-2a cells was 83 µM, a value within the clinically applied doses. The observed effects of PHB presented herein can achieve clinical concentration, especially for the treatment of seizure activities lined to high-frequency AP firing.
By synergistic inhibition of multiple ionic currents, including INa, IK(erg), IK(M), or IK(DR) in a frequency-dependent manner, PHB might induce other unpredictable electrophysiological responses, in addition to solely being an activator of GABAA receptors. The clinical use of PHB should take these effects into account. However, the findings in the current study are limited to Neuro-2a cells. Further studies will have to validate these in other excitable cells or in vivo.

Author Contributions

Conceptualization, S.-N.W., Y.-F.T., H.-Y.C., P.-C.L. and P.-M.W.; methodology, H.-Y.C. and S.-N.W.; software, H.-Y.C. and S.-N.W.; validation, H.-Y.C., T.-H.C. and S.-N.W.; formal analysis, S.-N.W.; investigation, H.-Y.C., T.-H.C., P.-C.L. and S.-N.W.; resources, S.-N.W., Y.-F.T., and P.-M.W.; data curation, S.-N.W.; writing—original draft preparation, P.-M.W. and S.-N.W.; writing—review and editing, H.-Y.C., T.-H.C., P.-M.W., P.-C.L., Y.-F.T. and S.-N.W.; supervision, Y.-F.T. and S.-N.W.; project administration, S.-N.W. and Y.-F.T.; funding acquisition, S.-N.W. and Y.-F.T. All authors have read and agreed to the published version of the manuscript.

Funding

This study was supported by grants from National Cheng Kung University Hospital (NCKUH-11102050, NCKUH-11102029) and Ministry of Science and Technology (MOST-110-2320-B-006-028, 110-2314-B-006-056) of Taiwan.

Institutional Review Board Statement

Not applicable.

Informed Consent Statement

Not applicable.

Data Availability Statement

The original data are available upon reasonable request to the corresponding author.

Acknowledgments

The authors are grateful to Tzu-Hsien Chuang for his zealous assistance with the experiments.

Conflicts of Interest

All the authors report no declarations of interest that is directly relevant to this study. The funders had no role in the design of the study; in the collection, analyses, or interpretation of data; in the writing of the manuscript; or in the decision to publish the results.

Abbreviations

AP action potential
ergether-à-go-go related gene
FLM flumazenil
GABAA receptor γ-aminobutyric acid type A receptor
I-Vcurrent versus voltage
IC50 the concentration required for 50% inhibition
IK(DR)delayed-rectifier K+ current
IK(erg)erg-mediated K+ current
IK(M)M-type K+ current
INavoltage-gated Na+ current
Kerg channel erg-mediated K+ channel
KV channel voltage-gated K+ channel
NaV channel voltage-gated Na+ channel
PHB phenobarbital (phenobarbitone, phenobarb, Luminal Sodium®)
PT stimulation pulse train stimulation
SEM standard error of mean
τ time constant
TEA tetraethylammonium chloride
Tef tefluthrin
TTX tetrodotoxin

References

  1. Armijo, J.A.; Shushtarian, M.; Valdizan, E.M.; Cuadrado, A.; de las Cuevas, I.; Adín, J. Ion channels and epilepsy. Curr. Pharm. Des. 2005, 11, 1975–2003. [Google Scholar] [CrossRef] [PubMed]
  2. Asgari, A.; Semnanian, S.; Atapour, N.; Shojaei, A.; Moradi-Chameh, H.; Ghafouri, S.; Sheibani, V.; Mirnajafi-Zadeh, J. Low-frequency electrical stimulation enhances the effectiveness of phenobarbital on GABAergic currents in hippocampal slices of kindled rats. Neuroscience 2016, 330, 26–38. [Google Scholar] [CrossRef] [PubMed]
  3. Brodie, M.J.; Dichter, M.A. Antiepileptic drugs. N. Engl. J. Med. 1996, 334, 168–175. [Google Scholar] [CrossRef]
  4. Chu, C.; Li, N.; Zhong, R.; Zhao, D.; Lin, W. Efficacy of Phenobarbital and Prognosis Predictors in Women with Epilepsy from Rural Northeast China: A 10-Year Follow-Up Study. Front. Neurol. 2022, 13, 838098. [Google Scholar] [CrossRef] [PubMed]
  5. Farwell, J.R.; Lee, Y.J.; Hirtz, D.G.; Sulzbacher, S.I.; Ellenberg, J.H.; Nelson, K.B. Phenobarbital for febrile seizures—Effects on intelligence and on seizure recurrence. N. Engl. J. Med. 1990, 322, 364–369. [Google Scholar] [CrossRef]
  6. Su, Y.; Huang, H.; Jiang, M.; Pan, S.; Ding, L.; Zhang, L.; Jiang, W.; Zhuang, X. Phenobarbital versus valproate for generalized convulsive status epilepticus in adults (2): A multicenter prospective randomized controlled trial in China (China 2-P vs. V). Epilepsy Res. 2021, 177, 106755. [Google Scholar] [CrossRef]
  7. Zeller, A.; Arras, M.; Jurd, R.; Rudolph, U. Identification of a molecular target mediating the general anesthetic actions of pentobarbital. Mol. Pharmacol. 2007, 71, 852–859. [Google Scholar] [CrossRef] [PubMed]
  8. Onizuka, C.; Irifune, M.; Mukai, A.; Shimizu, Y.; Doi, M.; Oue, K.; Yoshida, M.; Kochi, T.; Imado, E.; Kanematsu, T.; et al. Pentobarbital may protect against neurogenic inflammation after surgery via inhibition of substance P release from peripheral nerves of rats. Neurosci. Lett. 2022, 771, 136467. [Google Scholar] [CrossRef]
  9. Wang, Q.; Liu, X.; Li, B.; Yang, X.; Lu, W.; Li, A.; Li, H.; Zhang, X.; Han, J. Sodium Pentobarbital Suppresses Breast Cancer Cell Growth Partly via Normalizing Microcirculatory Hemodynamics and Oxygenation in Tumors. J. Pharmacol. Exp. Ther. 2022, 382, 11–20. [Google Scholar] [CrossRef]
  10. Zagaja, M.; Zagaja, A.; Szala-Rycaj, J.; Szewczyk, A.; Lemieszek, M.K.; Raszewski, G.; Andres-Mach, M. Influence of Umbelliferone on the Anticonvulsant and Neuroprotective Activity of Selected Antiepileptic Drugs: An In Vivo and In Vitro Study. Int. J. Mol. Sci. 2022, 23, 3492. [Google Scholar] [CrossRef]
  11. Tremblay, R.G.; Sikorska, M.; Sandhu, J.K.; Lanthier, P.; Ribecco-Lutkiewicz, M.; Bani-Yaghoub, M. Differentiation of mouse Neuro 2A cells into dopamine neurons. J. Neurosci. Methods 2010, 186, 60–67. [Google Scholar] [CrossRef] [PubMed]
  12. Chuang, T.H.; Cho, H.Y.; Wu, S.N. The Evidence for Sparsentan-Mediated Inhibition of I(Na) and I(K(erg)): Possibly Unlinked to Its Antagonism of Angiotensin II or Endothelin Type a Receptor. Biomedicines 2021, 10, 86. [Google Scholar] [CrossRef] [PubMed]
  13. Catterall, W.A.; Goldin, A.L.; Waxman, S.G. International Union of Pharmacology. XLVII. Nomenclature and structure-function relationships of voltage-gated sodium channels. Pharmacol. Rev. 2005, 57, 397–409. [Google Scholar] [CrossRef] [PubMed]
  14. Taddese, A.; Bean, B.P. Subthreshold sodium current from rapidly inactivating sodium channels drives spontaneous firing of tuberomammillary neurons. Neuron 2002, 33, 587–600. [Google Scholar] [CrossRef]
  15. Navarro, M.A.; Salari, A.; Lin, J.L.; Cowan, L.M.; Penington, N.J.; Milescu, M.; Milescu, L.S. Sodium channels implement a molecular leaky integrator that detects action potentials and regulates neuronal firing. eLife 2020, 9, e54940. [Google Scholar] [CrossRef]
  16. Schwarz, J.R.; Bauer, C.K. Functions of erg K+ channels in excitable cells. J. Cell Mol. Med. 2004, 8, 22–30. [Google Scholar] [CrossRef]
  17. Furlan, F.; Taccola, G.; Grandolfo, M.; Guasti, L.; Arcangeli, A.; Nistri, A.; Ballerini, L. ERG conductance expression modulates the excitability of ventral horn GABAergic interneurons that control rhythmic oscillations in the developing mouse spinal cord. J. Neurosci. 2007, 27, 919–928. [Google Scholar] [CrossRef]
  18. Liu, P.Y.; Chang, W.T.; Wu, S.N. Characterization of the Synergistic Inhibition of I(K(erg)) and I(K(DR)) by Ribociclib, a Cyclin-Dependent Kinase 4/6 Inhibitor. Int. J. Mol. Sci. 2020, 21, 8078. [Google Scholar] [CrossRef]
  19. Cho, H.Y.; Chuang, T.H.; Wu, S.N. Effective Perturbations on the Amplitude and Hysteresis of Erg-Mediated Potassium Current Caused by 1-Octylnonyl 8-[(2-hydroxyethyl)[6-oxo-6(undecyloxy)hexyl]amino]-octanoate (SM-102), a Cationic Lipid. Biomedicines 2021, 9, 1367. [Google Scholar] [CrossRef]
  20. Matsuoka, T.; Yamasaki, M.; Abe, M.; Matsuda, Y.; Morino, H.; Kawakami, H.; Sakimura, K.; Watanabe, M.; Hashimoto, K. Kv11 (ether-à-go-go-related gene) voltage-dependent K+ channels promote resonance and oscillation of subthreshold membrane potentials. J. Physiol. 2021, 599, 547–569. [Google Scholar] [CrossRef]
  21. Chen, L.; Cho, H.Y.; Chuang, T.H.; Ke, T.L.; Wu, S.N. The Effectiveness of Isoplumbagin and Plumbagin in Regulating Amplitude, Gating Kinetics, and Voltage-Dependent Hysteresis of erg-mediated K+ Currents. Biomedicines 2022, 10, 780. [Google Scholar] [CrossRef] [PubMed]
  22. Busch, A.E.; Eigenberger, B.; Jurkiewicz, N.K.; Salata, J.J.; Pica, A.; Suessbrich, H.; Lang, F. Blockade of HERG channels by the class III antiarrhythmic azimilide: Mode of action. Br. J. Pharmacol. 1998, 123, 23–30. [Google Scholar] [CrossRef] [PubMed]
  23. Katchman, A.N.; McGroary, K.A.; Kilborn, M.J.; Kornick, C.A.; Manfredi, P.L.; Woosley, R.L.; Ebert, S.N. Influence of opioid agonists on cardiac human ether-a-go-go-related gene K+ currents. J. Pharmacol. Exp. Ther. 2002, 303, 688–694. [Google Scholar] [CrossRef]
  24. Kang, J.; Chen, X.L.; Wang, H.; Ji, J.; Cheng, H.; Incardona, J.; Reynolds, W.; Viviani, F.; Tabart, M.; Rampe, D. Discovery of a small molecule activator of the human ether-a-go-go-related gene (HERG) cardiac K+ channel. Mol. Pharmacol. 2005, 67, 827–836. [Google Scholar] [CrossRef] [PubMed]
  25. Brown, D.A.; Passmore, G.M. Neural KCNQ (Kv7) channels. Br. J. Pharmacol. 2009, 156, 1185–1195. [Google Scholar] [CrossRef]
  26. Chang, W.T.; Liu, P.Y.; Gao, Z.H.; Lee, S.W.; Lee, W.K.; Wu, S.N. Evidence for the Effectiveness of Remdesivir (GS-5734), a Nucleoside-Analog Antiviral Drug in the Inhibition of I (K(M)) or I (K(DR)) and in the Stimulation of I (MEP). Front. Pharmacol. 2020, 11, 1091. [Google Scholar] [CrossRef] [PubMed]
  27. Zhang, Y.; Li, D.; Darwish, Y.; Fu, X.; Trussell, L.O.; Huang, H. KCNQ Channels Enable Reliable Presynaptic Spiking and Synaptic Transmission at High Frequency. J. Neurosci. 2022, 42, 3305–3315. [Google Scholar] [CrossRef]
  28. Schreiber, J.A.; Möller, M.; Zaydman, M.; Zhao, L.; Beller, Z.; Becker, S.; Ritter, N.; Hou, P.; Shi, J.; Silva, J.; et al. A benzodiazepine activator locks K(v)7.1 channels open by electro-mechanical uncoupling. Commun. Biol. 2022, 5, 301. [Google Scholar] [CrossRef]
  29. Zhang, H.B.; Heckman, L.; Niday, Z.; Jo, S.; Fujita, A.; Shim, J.; Pandey, R.; Al Jandal, H.; Jayakar, S.; Barrett, L.B.; et al. Cannabidiol activates neuronal Kv7 channels. eLife 2022, 11, e73246. [Google Scholar] [CrossRef]
  30. Hsiao, H.T.; Lu, G.L.; Liu, Y.C.; Wu, S.N. Effective Perturbations of the Amplitude, Gating, and Hysteresis of I(K(DR)) Caused by PT-2385, an HIF-2α Inhibitor. Membranes 2021, 11, 636. [Google Scholar] [CrossRef]
  31. Labro, A.J.; Priest, M.F.; Lacroix, J.J.; Snyders, D.J.; Bezanilla, F. Kv3.1 uses a timely resurgent K+ current to secure action potential repolarization. Nat. Commun. 2015, 6, 10173. [Google Scholar] [CrossRef] [PubMed]
  32. Baraldi, M.; Guidotti, A.; Schwartz, J.P.; Costa, E. GABA receptors in clonal cell lines: A model for study of benzodiazepine action at molecular level. Science 1979, 205, 821–823. [Google Scholar] [CrossRef]
  33. Gorman, A.M.; O’Beirne, G.B.; Regan, C.M.; Williams, D.C. Antiproliferative action of benzodiazepines in cultured brain cells is not mediated through the peripheral-type benzodiazepine acceptor. J. Neurochem. 1989, 53, 849–855. [Google Scholar] [CrossRef] [PubMed]
  34. Nicolas, J.; Bovee, T.F.; Kamelia, L.; Rietjens, I.M.; Hendriksen, P.J. Exploration of new functional endpoints in neuro-2a cells for the detection of the marine biotoxins saxitoxin, palytoxin and tetrodotoxin. Toxicol. In Vitro 2015, 30, 341–347. [Google Scholar] [CrossRef]
  35. Tan, N.N.; Tang, H.L.; Lin, G.W.; Chen, Y.H.; Lu, P.; Li, H.J.; Gao, M.M.; Zhao, Q.H.; Yi, Y.H.; Liao, W.P.; et al. Epigenetic Downregulation of Scn3a Expression by Valproate: A Possible Role in Its Anticonvulsant Activity. Mol. Neurobiol. 2017, 54, 2831–2842. [Google Scholar] [CrossRef] [PubMed]
  36. Khan, F.; Saify, Z.S.; Jamali, K.S.; Naz, S.; Hassan, S.; Siddiqui, S. Vitex negundo induces an anticonvulsant effect by inhibiting voltage gated sodium channels in murine Neuro 2A cell line. Pak. J. Pharm. Sci. 2018, 31, 297–303. [Google Scholar]
  37. Olmsted, J.B.; Carlson, K.; Klebe, R.; Ruddle, F.; Rosenbaum, J. Isolation of microtubule protein from cultured mouse neuroblastoma cells. Proc. Natl. Acad. Sci. USA 1970, 65, 129–136. [Google Scholar] [CrossRef]
  38. Wu, M.; Zhao, D.; Wei, Z.; Zhong, W.; Yan, H.; Wang, X.; Liang, Z.; Li, Z. Method for electric parametric characterization and optimization of electroporation on a chip. Anal. Chem. 2013, 85, 4483–4491. [Google Scholar] [CrossRef]
  39. Wu, P.M.; Cho, H.Y.; Chiang, C.W.; Chuang, T.H.; Wu, S.N.; Tu, Y.F. Characterization in Inhibitory Effectiveness of Carbamazepine in Voltage-Gated Na+ and Erg-Mediated K+ Currents in a Mouse Neural Crest-Derived (Neuro-2a) Cell Line. Int. J. Mol. Sci. 2022, 23, 7892. [Google Scholar] [CrossRef]
  40. Cho, H.Y.; Chen, P.C.; Chuang, T.H.; Yu, M.C.; Wu, S.N. Activation of Voltage-Gated Na+ Current by GV-58, a Known Activator of Ca(V) Channels. Biomedicines 2022, 10, 721. [Google Scholar] [CrossRef]
  41. Wu, S.N.; Shen, A.Y.; Hwang, T.L. Analysis of mechanical restitution and post-rest potentiation in isolated rat atrium. Chin. J. Physiol. 1996, 39, 23–29. [Google Scholar] [PubMed]
  42. Wu, C.L.; Chuang, C.W.; Cho, H.Y.; Chuang, T.H.; Wu, S.N. The Evidence for Effective Inhibition of I(Na) Produced by Mirogabalin ((1R,5S,6S)-6-(aminomethyl)-3-ethyl-bicyclo [3.2.0] hept-3-ene-6-acetic acid), a Known Blocker of Ca(V) Channels. Int. J. Mol. Sci. 2022, 23, 3845. [Google Scholar] [CrossRef] [PubMed]
  43. Oortgiesen, M.; van Kleef, R.G.; Vijverberg, H.P. Block of deltamethrin-modified sodium current in cultured mouse neuroblastoma cells: Local anesthetics as potential antidotes. Brain Res. 1990, 518, 11–18. [Google Scholar] [CrossRef]
  44. Wu, S.N.; Wu, Y.H.; Chen, B.S.; Lo, Y.C.; Liu, Y.C. Underlying mechanism of actions of tefluthrin, a pyrethroid insecticide, on voltage-gated ion currents and on action currents in pituitary tumor (GH3) cells and GnRH-secreting (GT1-7) neurons. Toxicology 2009, 258, 70–77. [Google Scholar] [CrossRef] [PubMed]
  45. McCavera, S.J.; Soderlund, D.M. Differential state-dependent modification of inactivation-deficient Nav1.6 sodium channels by the pyrethroid insecticides S-bioallethrin, tefluthrin and deltamethrin. Neurotoxicology 2012, 33, 384–390. [Google Scholar] [CrossRef] [PubMed]
  46. Meves, H. Inactivation of the ERG current in NG108-15 cells. Biochem. Biophys. Res. Commun. 1999, 263, 510–515. [Google Scholar] [CrossRef]
  47. Lambert, D.G.; Willets, J.M.; Atcheson, R.; Frost, C.; Smart, D.; Rowbotham, D.J.; Smith, G. Effects of propofol and thiopentone on potassium- and carbachol-evoked [3H]noradrenaline release and increased [Ca2+]i from SH-SY5Y human neuroblastoma cells. Biochem. Pharmacol. 1996, 51, 1613–1621. [Google Scholar] [CrossRef]
  48. Yang, C.X.; Zhang, X.B.; Gong, N.; Wang, M.Y.; Xu, T.L. Differential effects of thiopental and pentobarbital on spinal GABA(A) receptors. Neurochem. Res. 2008, 33, 2159–2165. [Google Scholar] [CrossRef]
  49. So, E.C.; Wu, K.C.; Kao, F.C.; Wu, S.N. Effects of midazolam on ion currents and membrane potential in differentiated motor neuron-like NSC-34 and NG108-15 cells. Eur. J. Pharmacol. 2014, 724, 152–160. [Google Scholar] [CrossRef]
  50. Foo, N.P.; Liu, Y.F.; Wu, P.C.; Hsing, C.H.; Huang, B.M.; So, E.C. Midazolam’s Effects on Delayed-Rectifier K+ Current and Intermediate-Conductance Ca2+-Activated K+ Channel in Jurkat T-lymphocytes. Int. J. Mol. Sci. 2021, 22, 7198. [Google Scholar] [CrossRef]
  51. Wu, D.M.; Lu, J.Y.; Wu, B.W. Class III anti-arrhythmia drug E-4031 potentiates Na+/Ca2+ exchange current in rat ventricular myocytes. Acta Pharmacol. Sin. 2000, 21, 249–252. [Google Scholar] [PubMed]
  52. Kodirov, S.A. Tale of tail current. Prog. Biophys. Mol. Biol. 2020, 150, 78–97. [Google Scholar] [CrossRef] [PubMed]
  53. Bachmann, A.; Mueller, S.; Kopp, K.; Brueggemann, A.; Suessbrich, H.; Gerlach, U.; Busch, A.E. Inhibition of cardiac potassium currents by pentobarbital. Naunyn Schmiedebergs Arch. Pharmacol. 2002, 365, 29–37. [Google Scholar] [CrossRef] [PubMed]
  54. Kendig, J.J. Barbiturates: Active form and site of action at node of Ranvier sodium channels. J. Pharmacol. Exp. Ther. 1981, 218, 175–181. [Google Scholar] [PubMed]
  55. Prokic, E.J.; Weston, C.; Yamawaki, N.; Hall, S.D.; Jones, R.S.; Stanford, I.M.; Ladds, G.; Woodhall, G.L. Cortical oscillatory dynamics and benzodiazepine-site modulation of tonic inhibition in fast spiking interneurons. Neuropharmacology 2015, 95, 192–205. [Google Scholar] [CrossRef]
  56. Neumann, E.; Rudolph, U.; Knutson, D.E.; Li, G.; Cook, J.M.; Hentschke, H.; Antkowiak, B.; Drexler, B. Zolpidem Activation of Alpha 1-Containing GABA(A) Receptors Selectively Inhibits High Frequency Action Potential Firing of Cortical Neurons. Front. Pharmacol. 2018, 9, 1523. [Google Scholar] [CrossRef]
  57. Hsu, H.T.; Lo, Y.C.; Huang, Y.M.; Tseng, Y.T.; Wu, S.N. Important modifications by sugammadex, a modified γ-cyclodextrin, of ion currents in differentiated NSC-34 neuronal cells. BMC Neurosci. 2017, 18, 6. [Google Scholar] [CrossRef]
  58. Methaneethorn, J.; Leelakanok, N. Pharmacokinetic variability of phenobarbital: A systematic review of population pharmacokinetic analysis. Eur. J. Clin. Pharmacol. 2021, 77, 291–309. [Google Scholar] [CrossRef]
Figure 1. Effects of phenobarbital (PHB) on voltage-gated Na+ current (INa) in Neuro-2a cells. (A) Representative current traces were obtained in the control period (a, absence of PHB, black line) and during cell exposure to 30 µM PHB (b, blue line) or 100 µM PHB (c, pink line). The uppermost part shows the voltage-clamp protocol applied, while the lower part indicates an expanded record from the dashed box in the middle part of (A). (B) Concentration-dependent response of PHB-mediated inhibition of peak INa residing in Neuro-2a cells (mean ± SEM; n = 8 for each point). The sigmoidal gray line, on which the data points were overlaid, indicates the best fit to a modified Hill equation, as mentioned in Materials and Methods.
Biomedicines 10 01968 g001
Figure 2. Effect of PHB on INa decline evoked during a 40 Hz train of depolarizing pulses in Neuro-2a cells. The pulse train (PT) stimuli were designed to comprise 40 20-ms pulses which are separated by 5 ms intervals at −80 mV with a total duration of 1 s. (A) Representative current traces are taken in the control period (a, blue color) and during the exposure to 100 µM PHB (b, red color). The uppermost part is the voltage-clamp protocol delivered to the tested cell (i.e., PT stimulation). To provide a single current trace, the right side of (A) shows the expanded records from the broken boxes in (Aa) and (Ab). The asterisks indicate the occurrence of peak INa (i.e., transient inward deflection) activated during PT stimulation. (B) Summary graph demonstrating the effect of PHB (30 or 100 µM) and PHB plus tefluthrin (Tef, 10 µM) on the time constant (τ) of INa decay in response to depolarizing PT stimuli from −80 to −10 mV (mean ± SEM; n = 8 for each point). Of note, the PHB addition results in a decrease in the τ value of INa activated by PT depolarizing pulses; and the subsequent application of 10 µM Tef can overcome the PHB-induced decrease in τ value. * Significantly different from control (p < 0.05), ** significantly different from PHB (30 µM) alone group (p < 0.05), and + significantly different from PHB (100 µM) alone group (p < 0.05).
Biomedicines 10 01968 g002
Figure 3. The inhibition of PHB on steady-state I-V relationship of hyperpolarization-activated IK(erg) and comparisons among effects of PHB, PHB plus flumazenil (FLM), or PHB plus chlorotoxin on IK(erg) amplitude identified in Neuro-2a cells. (A) Superimposed current traces acquired in the control period (i.e., PHB was not present) (upper) and during cell exposure to 300 µM PHB (lower). The voltage-clamp protocol used is illustrated in the top part, and potential traces shown in different colors correspond with current traces which were evoked by the same level of step commands. In (B,C), the averaged I-V relationships of the peak (filled symbols) or sustained component (open symbols) of IK(erg) acquired in the absence (upper, blue color) and presence (lower, pink color) of 300 µM PHB were demonstrated, respectively. Each point in (B,C) represents the mean ± SEM (n = 8). (D) Comparison among effects of PHB, PHB plus FLM, or PHB plus chlorotoxin on IK(erg) amplitude recorded from Neuro-2a cells (mean ± SEM; n = 8 for each point). The current amplitude (i.e., absolute value) taken during exposure to different tested compounds was measured at the start of the 1 s hyperpolarizing step from −10 to −110 mV. * p < 0.05 compared with control; ** p < 0.05 compared with 100 µM PHB. Of note, neither FLM nor chlorotoxin can reverse PHB-induced inhibition of deactivating IK(erg) in Neuro-2a cells.
Biomedicines 10 01968 g003aBiomedicines 10 01968 g003b
Figure 4. Effect of PHB on cumulative inhibition of IK(erg) in response to pulse train (PT) hyperpolarizing stimuli recorded from Neuro-2a cells. In these experiments, we applied a train of hyperpolarizing pulses which consist of 20 40 ms pulse (stepped to −110 mV) separated by 10 ms at −10 mV for a total duration of 1 s. (A) Representative current traces taken in the control period (a, absence of PHB, blue color) and during cell exposure to 300 µM PHB (b, pink color). The top part indicates the voltage-clamp protocol applied (black color), and the arrowhead in each trace shows the peak amplitude of deactivating IK(erg) with a resurgent (i.e., hook-of-tail) property. (B) Summary graph showing effect of PHB (100 and 300 µM), PHB (300 µM) plus E-4031 (10 µM) on deactivating IK(erg) during PT stimulation (mean ± SEM; n = 7 for each point). Current amplitude of IK(erg) was measured at the start of 1 s PT stimuli from −10 to −110 mV. * Significantly different from control (p < 0.05), ** significantly different from PHB (100 µM) alone group (p < 0.05), and + significantly different from PHB (300 µM) alone group.
Biomedicines 10 01968 g004
Figure 5. Effects of PHB on both the recovery of IK(erg) decay and IK(erg) magnitude evoked by the envelop-of-tail test seen in Neuro-2 cells. (A) Representative current traces are taken in the control period (a. absence of PHB) and during cell exposure to 300 µM PHB (b). Each color represents the specific current trace evoked by different voltage pulse with increasing interval of interpulse. The panels shown on the right side indicate the expanded records from purple dashed boxes on the left side for better illustrations. The asterisks show the occurrence of deactivating IK(erg), while the gray dashed arrow indicates a gradual increase in peak component of deactivating IK(erg) with the prolonged duration of conditioning pulse from −10 to −110 mV. (B) Relationship of the duration of conditioning pulse versus the relative amplitude of deactivating IK(erg) (mean ± SEM; n = 7 for each point). The amplitude of deactivating current at the conditioning pulse with a duration of 2048 ms was taken as 1.0. The blue square symbols are control data points, and the orange circle symbols were acquired during cell exposure to 300 µM PHB. (C) PHB-mediated changes in IK(erg) magnitude were evoked by the envelop-of-tail test (mean ± SEM; n = 7 for each point). The relationship of the pulse duration versus the relative amplitude of IK(erg) is illustrated. The relative amplitude appearing at the y axis was measured, when the inwardly gradually increasing current (i.e., activating IK(erg), Iact) activated by conditioning pulse was divided by peak deactivating IK(erg) (Ideact) obtained following a return of the voltage to −110 mV. The decaying rate of IK(erg) evoked during the envelop-of-tail occurred in a single exponential function. Of notice, the relationships in (B,C) are illustrated with a semi-logarithmic plot. The smooth curves with or without the application of 300 µM PHB indicate the best fits to a single exponential function.
Biomedicines 10 01968 g005
Figure 6. Effect of PHB on M-type K+ current (IK(M)) identified in Neuro-2a cells. (A) Representative current traces (i.e., IK(M)’s) acquired in the control period (a, black line) and during the exposure to 100 µM PHB (b, blue line) or 300 µM PHB (c, pink line). The voltage-clamp protocol we used is in the upper part. (B) Summary graph demonstrating effect of PHB (100 or 300 µM), PHB (300 µM) plus flumazenil (FLM, 10 µM), or PHB (300 µM) plus chlorotoxin (1 µM) on IK(M) amplitude (mean ± SEM; n = 8 for each point). Current amplitude was measured at the end of 1 s depolarizing pulse from −50 to −10 mV. * Significantly different from control (p < 0.05) and ** significantly different from PHB (100 µM) alone group (p < 0.05). (C) Averaged I-V relationship of IK(M) obtained in the absence (black open squares) and presence (red open circles) of 300 μM PHB (mean ± SEM; n = 8 for each point). Current amplitude was measured at the end of each voltage step.
Biomedicines 10 01968 g006
Figure 7. Effect of PHB on IK(M) activated by a pulse-train (PT) stimulations identified in Neuro-2a cells. The train was designed to consist of 40 20 ms pulses (stepped to −10 mV) separated by 5 ms intervals at −50 mV for a total duration of 1 s. (A) Representative current traces taken during the control period (a, blue color) and during the exposure to 300 µM PHB (b, red color). The uppermost part shows the voltage-clamp protocol applied. Black solid arrow indicates the activating IK(M), while brown dashed arrow is the deactivating component of IK(M) obtained following return to −50 mV. Summary graphs in (B,C), respectively, demonstrate the activating and deactivating amplitudes of IK(M) in the absence and presence of 100 or 300 µM PHB (mean ± SEM, n = 7 for each point). Activating or deactivating (or tail) amplitude of IK(M) was measured at the end of each depolarizing pulse from −50 to −10 mV or following return to −50 mV, respectively. * Significantly different from control (p < 0.05) and ** significantly different from PHB (100 µM) alone group (p < 0.05).
Biomedicines 10 01968 g007
Figure 8. Inhibitory effect of PHB on delayed-rectifier K+ currents (IK(DR)) observed in Neuro-2a cells. (A) Superimposed current traces obtained in the absence (upper) and presence (lower) 300 µM PHB. The voltage-clamp protocol applied is illustrated on the top part. Each color represents corresponding current trace evoked by specific voltage pulse. (B) Averaged I-V relationship of IK(DR) taken with or without the application of 300 µM PLB (mean ± SEM; n = 8 for each point). Of note, current amplitudes measured at the voltages above −10 mV were suppressed by adding PHB (300 µM). Current amplitude was measured at the end of each voltage step. ▇: control; ○: during exposure to 300 µM PLB.
Biomedicines 10 01968 g008
Figure 9. Effect of PHB on long-lasting IK(DR) taken with or without the application of PHB (300 µM) inherently residing in Neuro-2a cells. (A) Representative current traces (i.e., IK(DR)’s) were obtained in the absence (a, blue color) and presence (b, pink color) of 300 µM PHB. The tested cell was depolarized from −50 to +50 mV with a duration of 10 s, as indicated in the upper part of (A). (B) Excessive accumulative inactivation of IK(DR) during repetitive stimuli in the absence (upper, a, blue color) and presence (lower, b, pink color) of 300 µM PHB measured from Neuro-2a cells. Ionic currents were acquired during 100 ms repetitive depolarizations from −50 to +50 mV with a total duration of 10 s (indicated in the upper part of (B)). Of note, in addition to the inhibition of IK(DR) amplitude, the presence of PHB increases the rate of excessive accumulative inactivation of IK(DR) activated by repetitive stimuli.
Biomedicines 10 01968 g009
Publisher’s Note: MDPI stays neutral with regard to jurisdictional claims in published maps and institutional affiliations.

