
Association of Serum GFAP with Functional and Neurocognitive Outcome in Sporadic Small Vessel Disease

 , , , , , , and
Abstract
:1. Introduction
2. Materials and Methods
2.1. Patient Selection and Inclusion
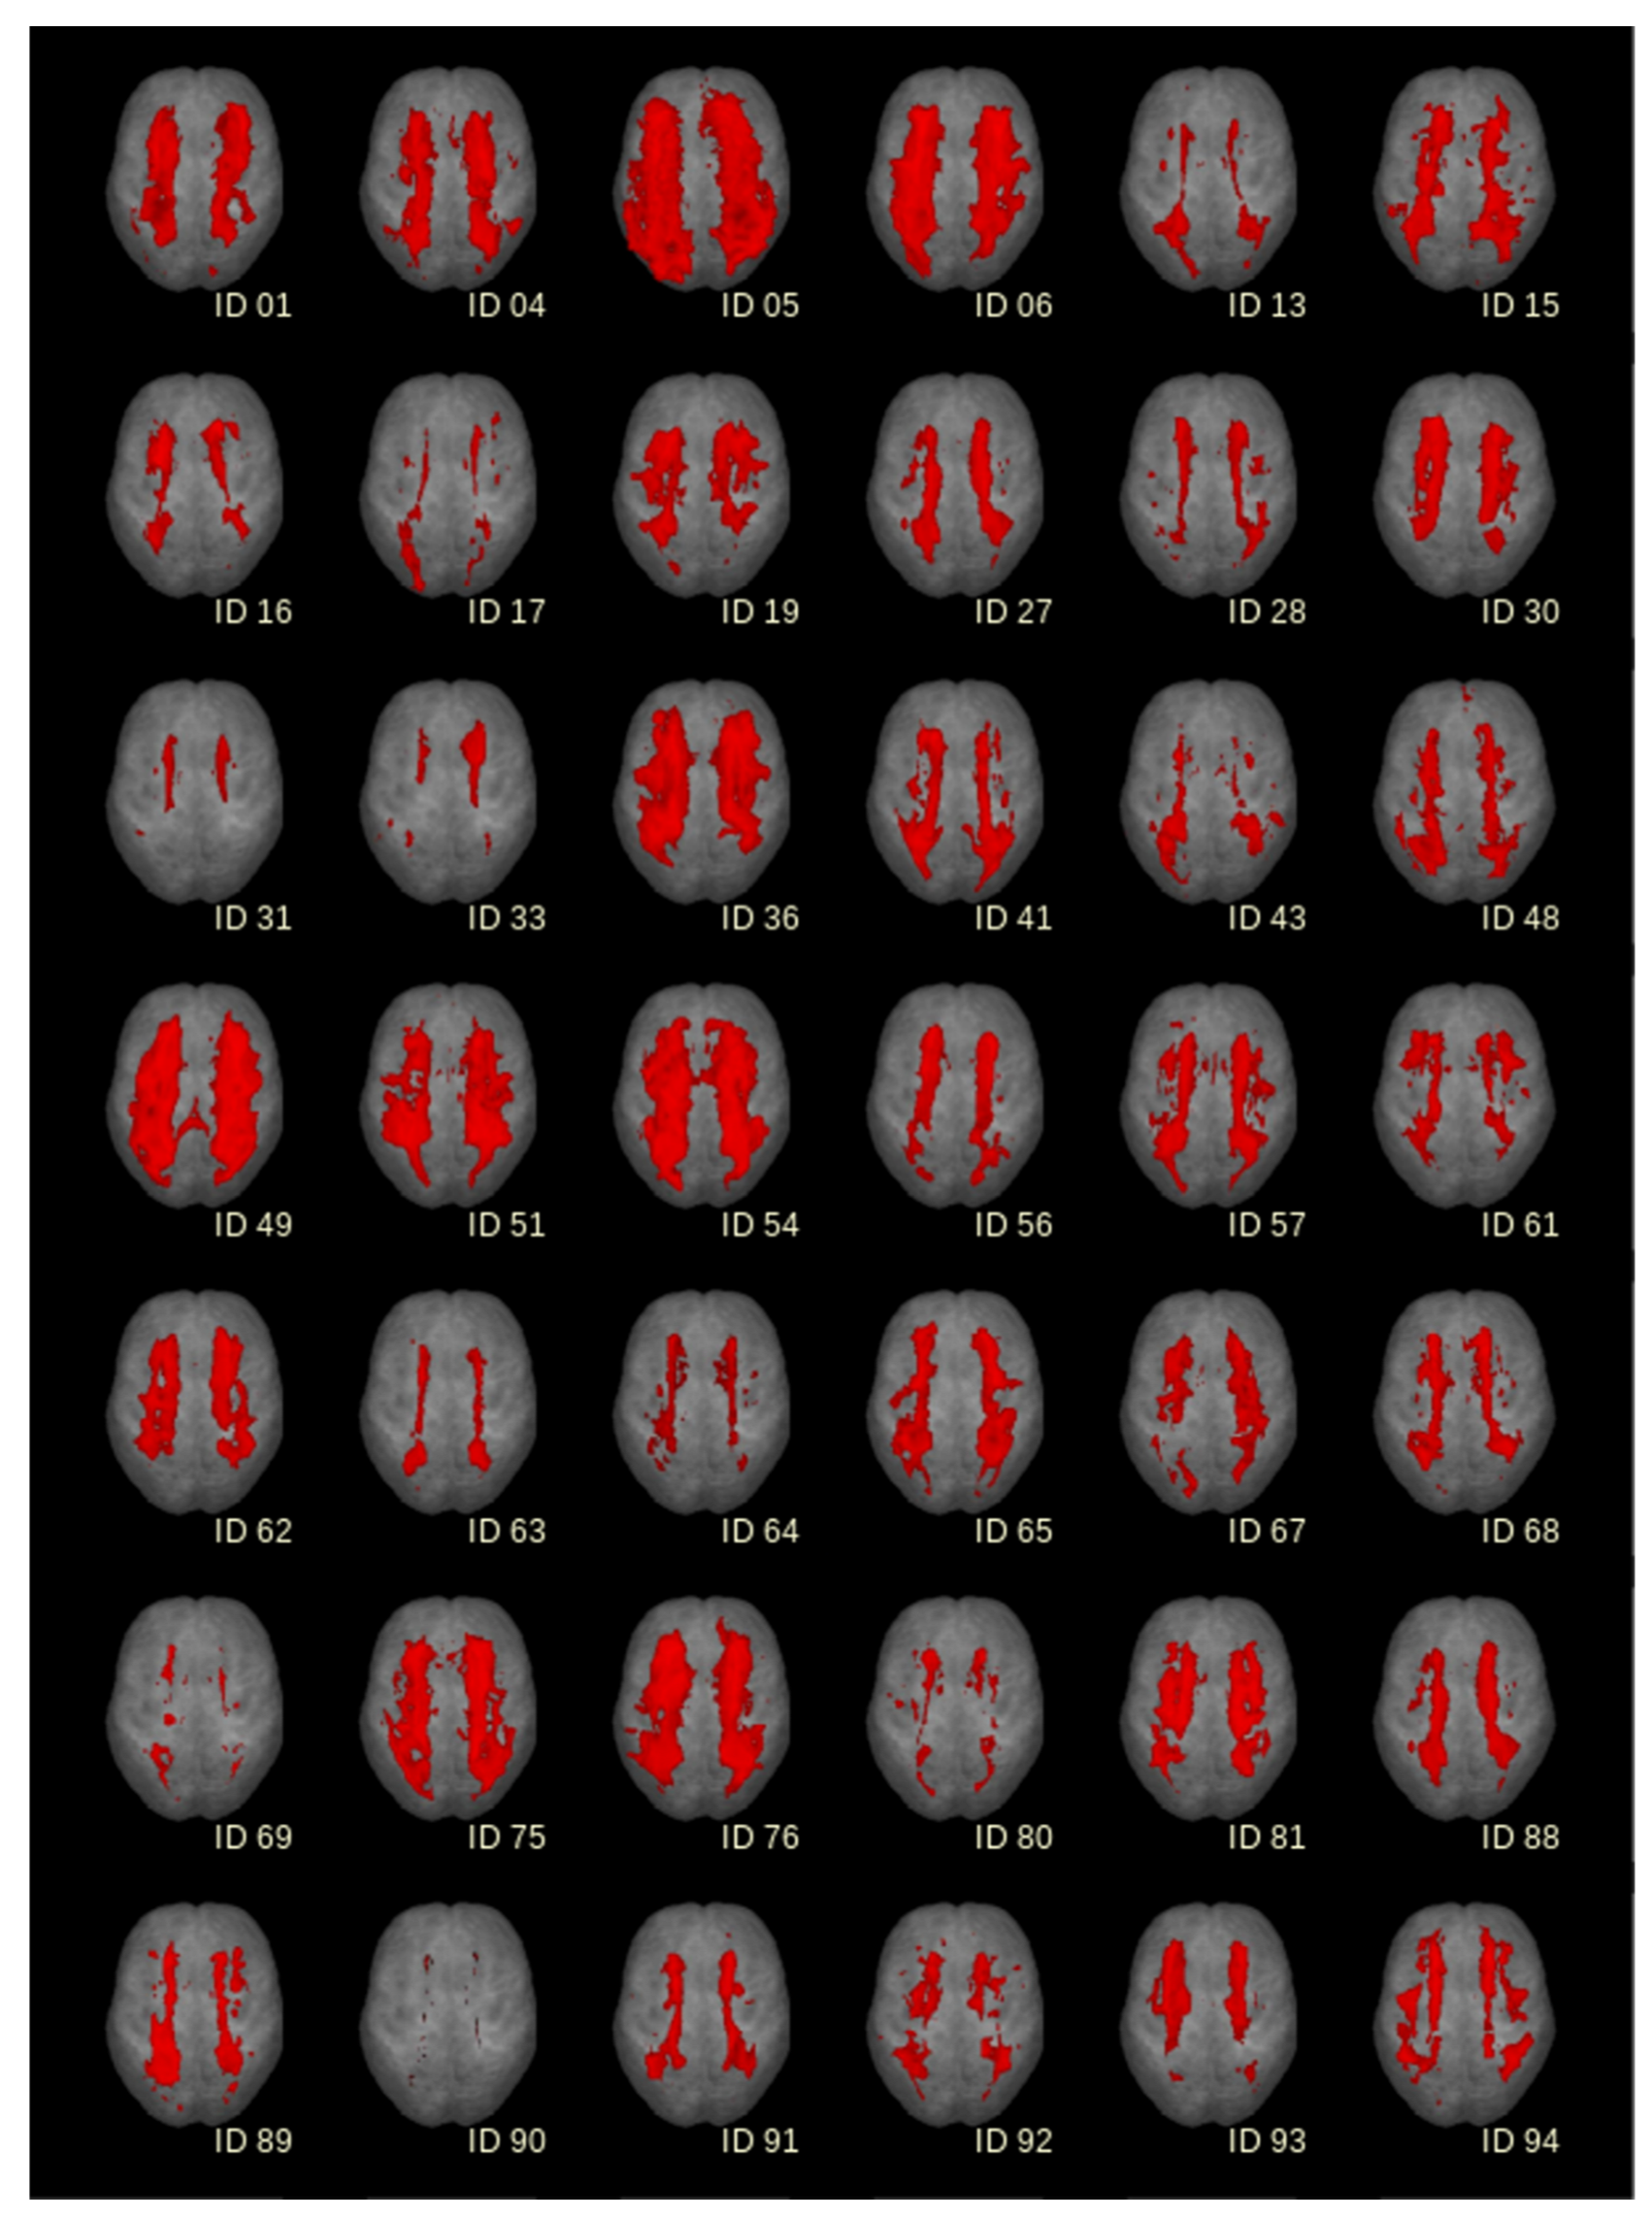
2.2. Magnetic Resonance Imaging (MRI)
2.3. Lumbar Puncture
2.4. CSF and Serum Biomarker Analyses
2.5. Cognitive Testing
2.6. Immunohistochemistry
2.7. Quantitative Histopathological Analyses
2.8. Statistical Analyses
3. Results
3.1. Patients’ Characteristics

| All Patients = 42 | p-Value | |||
|---|---|---|---|---|
| CSVD degree | 1 (mild) | 2 (moderate) | 3 (severe) | - |
| Number (n) | 8 | 18 | 16 | - |
| Male/Female | 7/1 | 10/8 | 9/7 | 0.22 |
| Age (range) | 71 (64–80) | 77 (48–89) | 74 (61–91) | 0.25 |
| mRS (IQR) | 1.0 (0.0–1.75) | 1.5 (1.0–3.0) | 2.0 (1.0–3.0) | 0.06 |
| NIHSS (IQR) | 0.5 (0.0–1.75) | 1.0 (0.0–2.0) | 3.0 (1.0–4.0) | 0.07 |
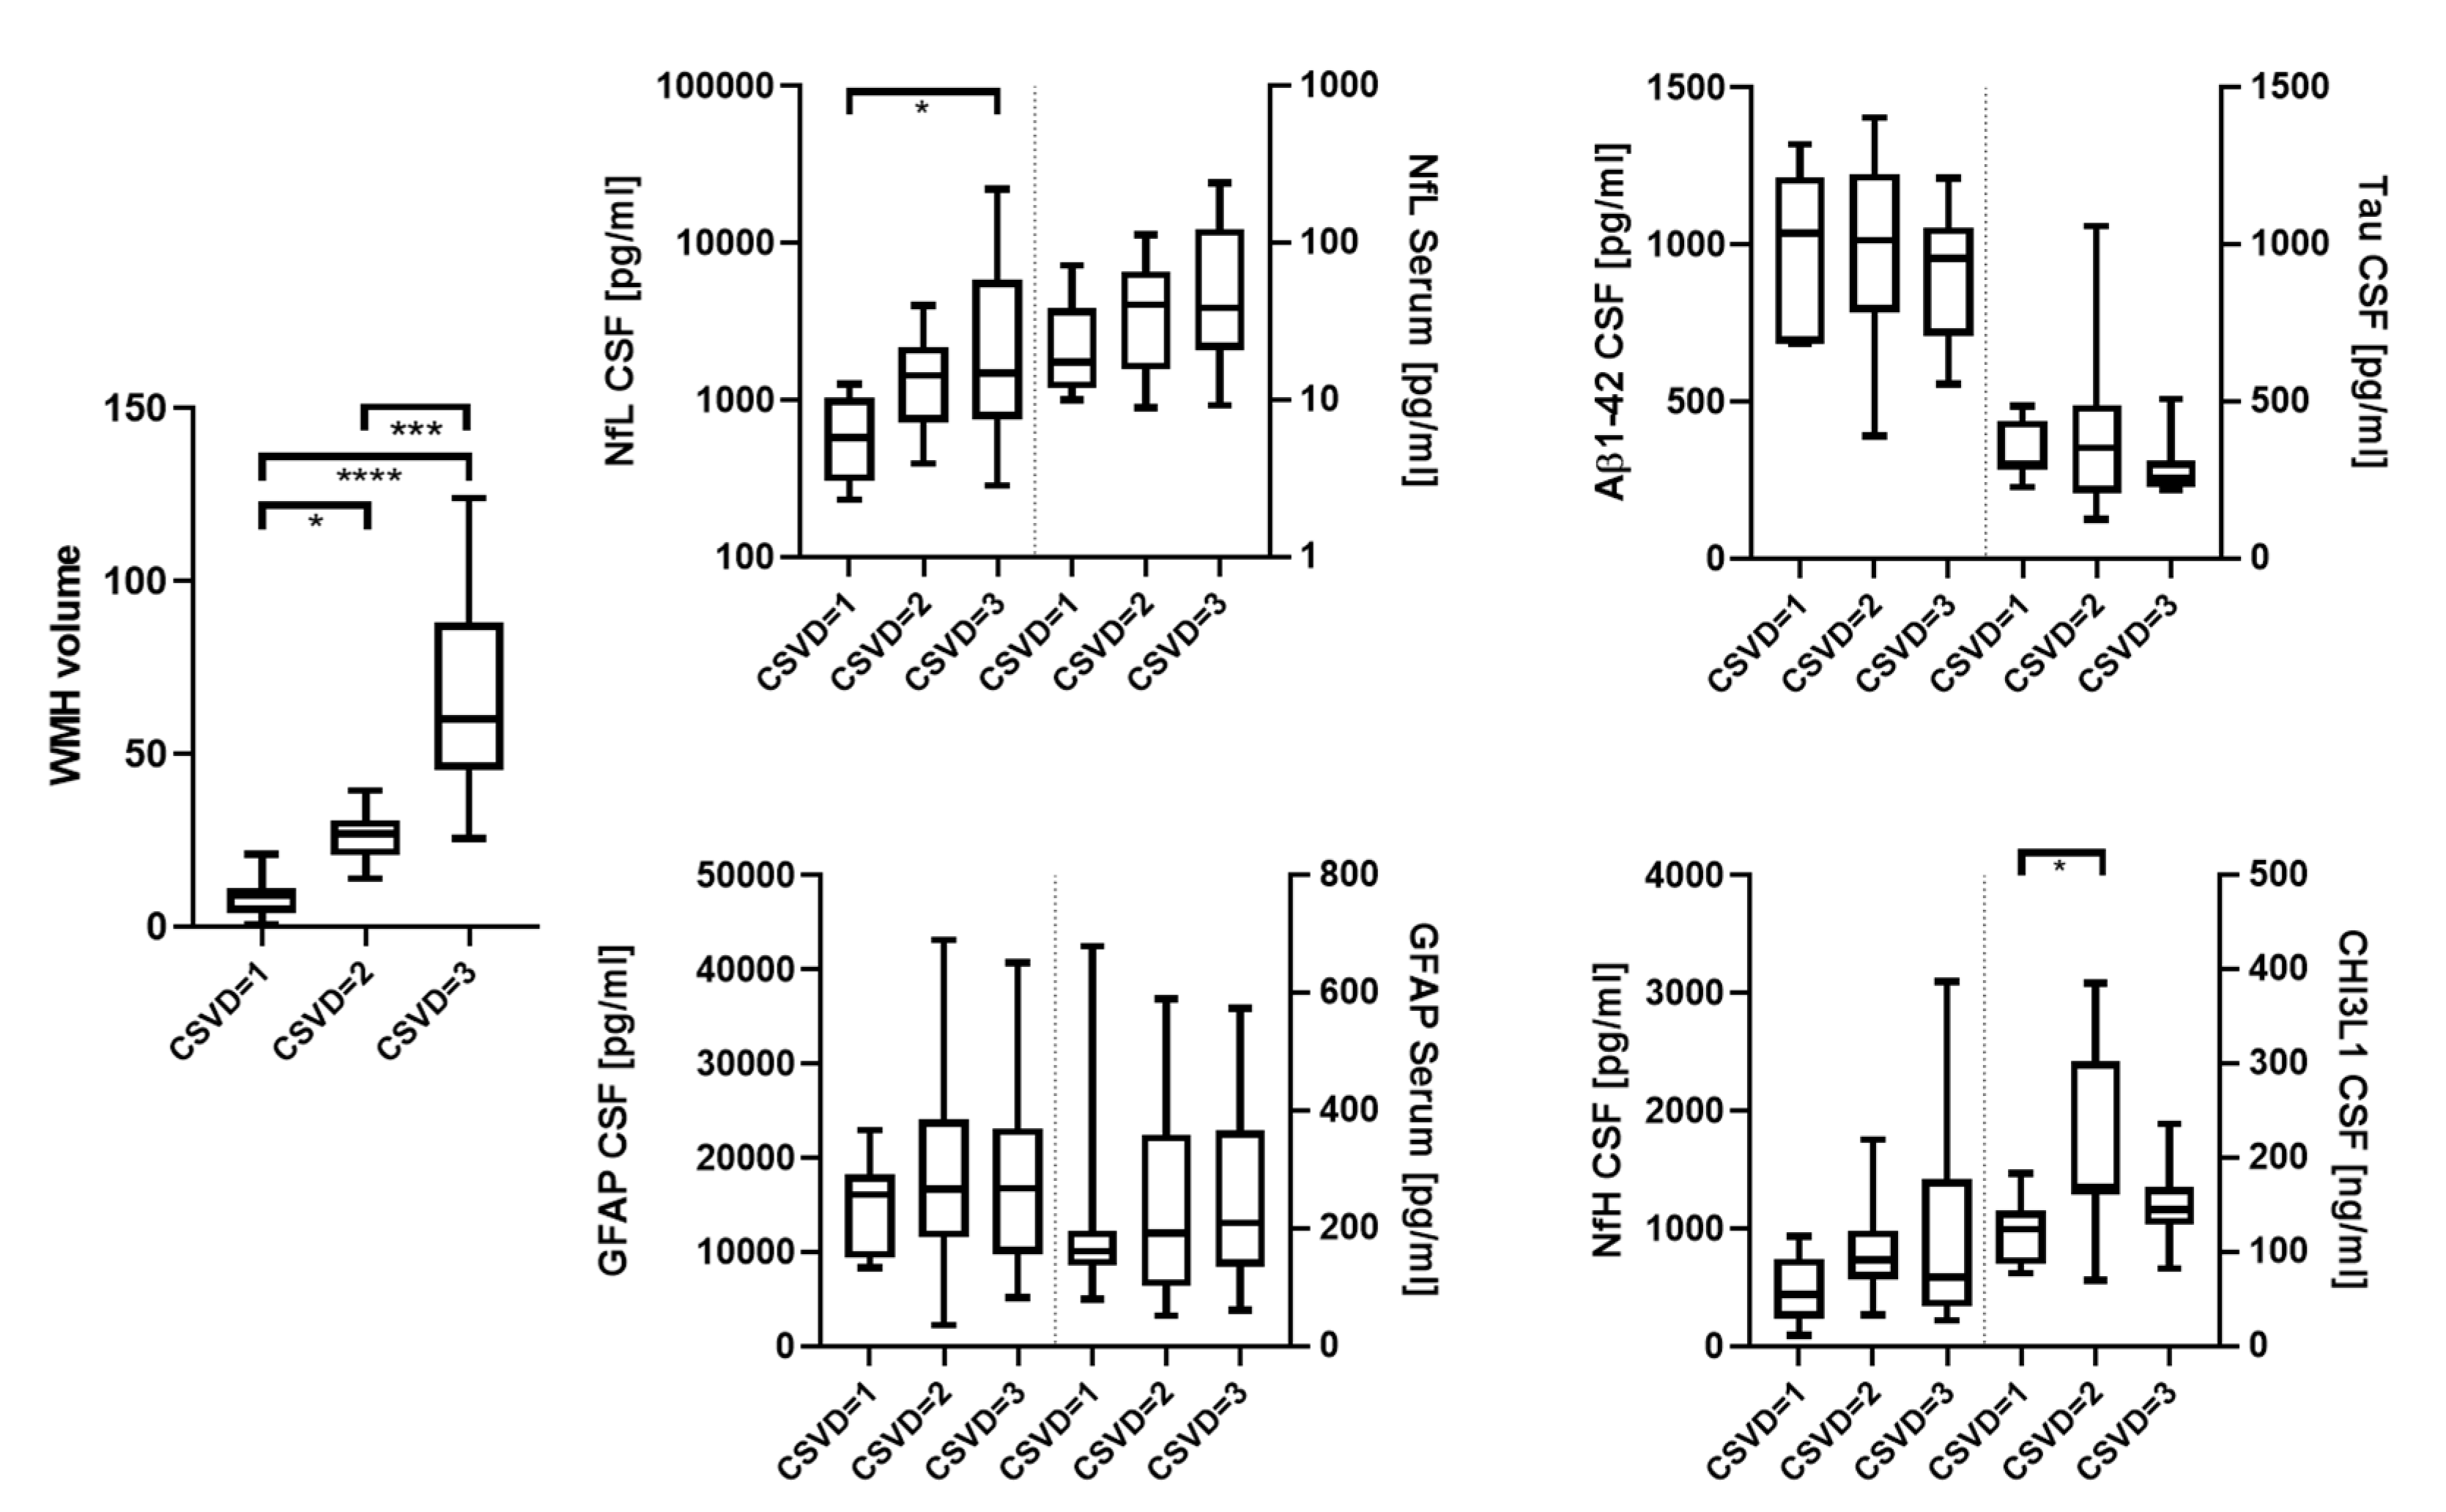
| WMH volume (IQR) | 8.8 (3.8–11.2) | 26.6 (20.5–30.7) | 60.1 (45.2–88.0) | <0.0001 |
3.2. Histopathology

| No | Age | Sex | Group | Diagnosis | Staging AD/Aβ | GFAP-PVM wm (cm2) | GFAP-PVL wm (cm2) | GFAP-PV Total wm (cm2) | CHI3L1-PV wm (# Cell Cluster) |
|---|---|---|---|---|---|---|---|---|---|
| 1 | 89 | f | CSVD | Art. hypertension, mixed dementia, TIA, aneurysm ACA, bradycardiac arrhythmia with decompensated CRF | IV/C | 0.240 | 0.535 | 0.775 | 0 |
| 2 | 79 | m | CSVD | Art. hypertension, aortic valve replacement | I/B | 0.263 | 1.167 § | 1.430 § | 1 |
| 3 | 77 | m | CSVD | Pulmonary embolism | 0/0 | 0.120 | 0.649 | 0.769 | 5 |
| 4 | 57 | m | CSVD | Renal cancer | 0/0 | 0.223 | 0.740 | 0.963 | 0 |
| 5 | 81 | f | CSVD | (Sub)acute ischemic MCA infarct L | I/0 | 0.638 | 2.172 § | 2.810 § | 1 |
| 6 | 60 | f | CSVD | Pontine bleeding | I/A | 0.357 | 0.749 | 1.106 | 0 |
| 7 | 57 | f | CSVD | Breast cancer, infarction in internal capsule | I/A | 0.490 | 1.890 § | 2.380 § | 3 |
| 8 | 78 | f | Ctrl | Pulmonary embolism, renal failure | 0/0 | 0.134 | 0.157 | 0.291 | 0 |
| 9 | 71 | f | Ctrl | Left heart failure | 0/0 | 0.125 | 0.538 | 0.663 | 0 |
| 10 | 67 | f | Ctrl | Ruptured aortic aneurysm with bleeding and circulatory arrest | 0/0 | 0.220 | 0.211 | 0.431 | 0 |
| 11 | 54 | f | Ctrl | Ovarian cancer | I/B | 0.100 | 0.777 | 0.877 | 0 |
| 12 | 84 | f | Ctrl | Subacute cerebral MCA and PCA infarctions R | II/0 | 0.181 | 0.341 | 0.522 | 1 |
| Mean | CSVD | 0.333 | 1.129 | 1.462 | 1.429 | ||||
| Ctrl | 0.152 | 0.405 | 0.557 | 0.200 | |||||
| S.E.M. | CSVD | 0.067 | 0.246 | 0.308 | 0.719 | ||||
| Ctrl | 0.021 | 0.114 | 0.100 | 0.200 | |||||
| Mann–Whitney U test | |||||||||
| Mann–Whitney U | 4.000 | 5.000 | 2.000 | 10.000 | |||||
| standardised test statistic | −2.192 | −2.030 | −2.517 | −1.370 | |||||
| exact p-value (2-sided) | 0.030 * | 0.048 * | 0.010 ** | 0.268 | |||||
4. Discussion
5. Conclusions
Author Contributions
Funding
Institutional Review Board Statement
Data Availability Statement
Acknowledgments
Conflicts of Interest
References
- Wardlaw, J.M.; Smith, C.; Dichgans, M. Mechanisms of Sporadic Cerebral Small Vessel Disease: Insights from Neuroimaging. Lancet Neurol. 2013, 12, 483–497. [Google Scholar] [CrossRef] [Green Version]
- Vilar-Bergua, A.; Riba-Llena, I.; Nafría, C.; Bustamante, A.; Llombart, V.; Delgado, P.; Montaner, J. Blood and CSF Biomarkers in Brain Subcortical Ischemic Vascular Disease: Involved Pathways and Clinical Applicability. J. Cereb. Blood Flow Metab. 2016, 36, 55–71. [Google Scholar] [CrossRef]
- Gattringer, T.; Pinter, D.; Enzinger, C.; Seifert-Held, T.; Kneihsl, M.; Fandler, S.; Pichler, A.; Barro, C.; Gröbke, S.; Voortman, M.; et al. Serum Neurofilament Light Is Sensitive to Active Cerebral Small Vessel Disease. Neurology 2017, 89, 2108–2114. [Google Scholar] [CrossRef] [PubMed]
- Schmidt, R.; Berghold, A.; Jokinen, H.; Gouw, A.A.; Van Der Flier, W.M.; Barkhof, F.; Scheltens, P.; Petrovic, K.; Madureira, S.; Verdelho, A.; et al. White Matter Lesion Progression in LADIS: Frequency, Clinical Effects, and Sample Size Calculations. Stroke 2012, 43, 2643–2647. [Google Scholar] [CrossRef]
- Li, Q.; Yang, Y.; Reis, C.; Tao, T.; Li, W.; Li, X.; Zhang, J.H. Cerebral Small Vessel Disease. Cell Transplant. 2018, 27, 1711–1722. [Google Scholar] [CrossRef] [PubMed]
- Pantoni, L. Cerebral Small Vessel Disease: From Pathogenesis and Clinical Characteristics to Therapeutic Challenges. Lancet Neurol. 2010, 9, 689–701. [Google Scholar] [CrossRef]
- Biesbroek, J.M.; Kuijf, H.J.; van der Graaf, Y.; Vincken, K.L.; Postma, A.; Mali, W.P.T.M.; Biessels, G.J.; Geerlings, M.I. Association between Subcortical Vascular Lesion Location and Cognition: A Voxel-Based and Tract-Based Lesion-Symptom Mapping Study. The SMART-MR Study. PLoS ONE 2013, 8, e60541. [Google Scholar] [CrossRef] [PubMed] [Green Version]
- Yoshita, M.; Fletcher, E.; Harvey, D.; Ortega, M.; Martinez, O.; Mungas, D.M.; Reed, B.R.; DeCarli, C.S. Extent and Distribution of White Matter Hyperintensities in Normal Aging, MCI, and AD. Neurology 2006, 67, 2192–2198. [Google Scholar] [CrossRef] [PubMed] [Green Version]
- Fazekas, F.; Barkhof, F.; Wahlund, L.O.; Pantoni, L.; Erkinjuntti, T.; Scheltens, P.; Schmidt, R. CT and MRI Rating of White Matter Lesions. Cerebrovasc. Dis. 2002, 13, 31–36. [Google Scholar] [CrossRef]
- Kapeller, P.; Barber, R.; Vermeulen, R.J.; Adèr, H.; Scheltens, P.; Freidl, W.; Almkvist, O.; Moretti, M.; Del Ser, T.; Vaghfeldt, P.; et al. Visual Rating of Age-Related White Matter Changes on Magnetic Resonance Imaging: Scale Comparison, Interrater Agreement, and Correlations with Quantitative Measurements. Stroke 2003, 34, 441–445. [Google Scholar] [CrossRef] [Green Version]
- Debette, S.; Markus, H.S. The Clinical Importance of White Matter Hyperintensities on Brain Magnetic Resonance Imaging: Systematic Review and Meta-Analysis. BMJ 2010, 341, 288. [Google Scholar] [CrossRef] [PubMed] [Green Version]
- Duering, M.; Konieczny, M.J.; Tiedt, S.; Baykara, E.; Tuladhar, A.M.; van Leijsen, E.; Lyrer, P.; Engelter, S.T.; Gesierich, B.; Achmüller, M.; et al. Serum Neurofilament Light Chain Levels Are Related to Small Vessel Disease Burden. J. Stroke 2018, 20, 228–238. [Google Scholar] [CrossRef]
- Peters, N.; van Leijsen, E.; Tuladhar, A.M.; Barro, C.; Konieczny, M.J.; Ewers, M.; Lyrer, P.; Engelter, S.T.; Kuhle, J.; Duering, M.; et al. Serum Neurofilament Light Chain Is Associated with Incident Lacunes in Progressive Cerebral Small Vessel Disease. J. Stroke 2020, 22, 369–376. [Google Scholar] [CrossRef] [PubMed]
- Khalil, M.; Teunissen, C.E.; Otto, M.; Piehl, F.; Sormani, M.P.; Gattringer, T.; Barro, C.; Kappos, L.; Comabella, M.; Fazekas, F.; et al. Neurofilaments as Biomarkers in Neurological Disorders. Nat. Rev. Neurol. 2018, 14, 577–589. [Google Scholar] [CrossRef]
- Jonsson, M.; Zetterberg, H.; van Straaten, E.; Lind, K.; Syversen, S.; Edman, A.; Blennow, K.; Rosengren, L.; Pantoni, L.; Inzitari, D.; et al. Cerebrospinal Fluid Biomarkers of White Matter Lesions—Cross-Sectional Results from the LADIS Study. Eur. J. Neurol. 2010, 17, 377–382. [Google Scholar] [CrossRef]
- Sjögren, M.; Blomberg, M.; Jonsson, M.; Wahlund, L.-O.; Edman, Å.; Lind, K.; Rosengren, L.; Blennow, K.; Wallin, A. Neurofilament Protein in Cerebrospinal Fluid: A Marker of White Matter Changes. J. Neurosci. Res. 2001, 66, 510–516. [Google Scholar] [CrossRef] [PubMed]
- Tiedt, S.; Duering, M.; Barro, C.; Boeck, A.G.J.; Bode, F.J.; Klein, M.; Dorn, F.; Gesierich, B.; Kellert, L.; Ertl-Wagner, B.; et al. Serum Neurofilament Light a Biomarker of Neuroaxonal Injury after Ischemic Stroke. Neurology 2018, 91, E1338–E1347. [Google Scholar] [CrossRef] [PubMed]
- Pujol-Calderón, F.; Portelius, E.; Zetterberg, H.; Blennow, K.; Rosengren, L.E.; Höglund, K. Neurofilament Changes in Serum and Cerebrospinal Fluid after Acute Ischemic Stroke. Neurosci. Lett. 2019, 698, 58–63. [Google Scholar] [CrossRef] [PubMed]
- Pekny, M.; Wilhelmsson, U.; Tatlisumak, T.; Pekna, M. Astrocyte Activation and Reactive Gliosis—A New Target in Stroke? Neurosci. Lett. 2019, 689, 45–55. [Google Scholar] [CrossRef] [PubMed]
- Glushakova, O.; Glushakov, A.; Miller, E.; Valadka, A.; Hayes, R. Biomarkers for Acute Diagnosis and Management of Stroke in Neurointensive Care Units. Brain Circ. 2016, 2, 28. [Google Scholar] [CrossRef]
- Ren, C.; Kobeissy, F.; Alawieh, A.; Li, N.; Li, N.; Zibara, K.; Zoltewicz, S.; Guingab-Cagmat, J.; Larner, S.F.; Ding, Y.; et al. Assessment of Serum UCH-L1 and GFAP in Acute Stroke Patients. Sci. Rep. 2016, 14, 24588. [Google Scholar] [CrossRef] [PubMed] [Green Version]
- Bonneh-Barkay, D.; Wang, G.; Starkey, A.; Hamilton, R.L.; Wiley, C.A. In Vivo CHI3L1 (YKL-40) Expression in Astrocytes in Acute and Chronic Neurological Diseases. J. Neuroinflamm. 2010, 7, 34. [Google Scholar] [CrossRef] [Green Version]
- Im, J.H.; Yeo, I.J.; Park, P.H.; Choi, D.Y.; Han, S.B.; Yun, J.; Hong, J.T. Deletion of Chitinase-3-like 1 Accelerates Stroke Development through Enhancement of Neuroinflammation by STAT6-Dependent M2 Microglial Inactivation in Chitinase-3-like 1 Knockout Mice. Exp. Neurol. 2020, 323, 113082. [Google Scholar] [CrossRef] [PubMed]
- Brott, T.; Adams, H.P.; Olinger, C.P.; Marle, J.R.; Barsan, W.G.; Biller, J.; Spilker, J.; Holleran, R.; Eberle, R.; Hertzberg, V.; et al. Measurements of Acute Cerebral Infarction: A Clinical Examination Scale. Stroke 1989, 20, 864–870. [Google Scholar] [CrossRef] [PubMed] [Green Version]
- Van Swieten, J.C.; Koudstaal, P.J.; Visser, M.C.; Schouten, H.; Van Gijn, J. Interobserver Agreement for the Assessment of Handicap in Stroke Patients. Stroke 1988, 19, 604–607. [Google Scholar] [CrossRef] [Green Version]
- Fazekas, G.; Fazekas, F.; Schmidt, R.; Kapeller, P.; Offenbacher, H.; Krejs, G.J. Brain MRI Findings and Cognitive Impairment in Patients Undergoing Chronic Hemodialysis Treatment. J. Neurol. Sci. 1995, 134, 83–88. [Google Scholar] [CrossRef]
- Staals, J.; Makin, S.D.J.; Doubal, F.N.; Dennis, M.S.; Wardlaw, J.M. Stroke Subtype, Vascular Risk Factors, and Total MRI Brain Small-Vessel Disease Burden. Neurology 2014, 83, 1228–1234. [Google Scholar] [CrossRef]
- Pinkhardt, E.H.; Issa, H.; Gorges, M.; Jürgens, R.; Lulé, D.; Heimrath, J.; Müller, H.P.; Ludolph, A.C.; Becker, W.; Kassubek, J. Do Eye Movement Impairments in Patients with Small Vessel Cerebrovascular Disease Depend on Lesion Load or on Cognitive Deficits? A Video-Oculographic and MRI Study. J. Neurol. 2014, 261, 791–803. [Google Scholar] [CrossRef]
- Shu, J.; Neugebauer, H.; Li, F.; Lulé, D.; Müller, H.P.; Zhang, J.; Ludolph, A.C.; Huang, Y.; Kassubek, J.; Zhang, W. Clinical and Neuroimaging Disparity between Chinese and German Patients with Cerebral Small Vessel Disease: A Comparative Study. Sci. Rep. 2019, 9, 20015. [Google Scholar] [CrossRef] [PubMed]
- Abdelhak, A.; Huss, A.; Brück, A.; Sebert, U.; Mayer, B.; Müller, H.P.; Tumani, H.; Otto, M.; Yilmazer-Hanke, D.; Ludolph, A.C.; et al. Optical Coherence Tomography-Based Assessment of Retinal Vascular Pathology in Cerebral Small Vessel Disease. Neurol. Res. Pract. 2020, 2, 13. [Google Scholar] [CrossRef] [PubMed]
- Teunissen, C.E.; Petzold, A.; Bennett, J.L.; Berven, F.S.; Brundin, L.; Comabella, M.; Franciotta, D.; Frederiksen, J.L.; Fleming, J.O.; Furlan, R.; et al. A Consensus Protocol for the Standardization of Cerebrospinal Fluid Collection and Biobanking. Neurology 2009, 73, 1914–1922. [Google Scholar] [CrossRef] [Green Version]
- Ehrensperger, M.M.; Berres, M.; Taylor, K.I.; Monsch, A.U. Early Detection of Alzheimers Disease with a Total Score of the German CERAD. J. Int. Neuropsychol. Soc. 2010, 16, 910–920. [Google Scholar] [CrossRef] [PubMed] [Green Version]
- Schmid, N.S.; Ehrensperger, M.M.; Berres, M.; Beck, I.R.; Monsch, A.U. The Extension of the German CERAD Neuropsychological Assessment Battery with Tests Assessing Subcortical, Executive and Frontal Functions Improves Accuracy in Dementia Diagnosis. Dement. Geriatr. Cogn. Dis. Extra 2014, 4, 322–334. [Google Scholar] [CrossRef] [Green Version]
- Forsberg, K.M.E.; Zhang, Y.; Reiners, J.; Ander, M.; Niedermayer, A.; Fang, L.; Neugebauer, H.; Kassubek, J.; Katona, I.; Weis, J.; et al. Endothelial Damage, Vascular Bagging and Remodeling of the Microvascular Bed in Human Microangiopathy with Deep White Matter Lesions. Acta Neuropathol. Commun. 2018, 6, 128. [Google Scholar] [CrossRef]
- Yilmazer-Hanke, D.; Mayer, T.; Müller, H.P.; Neugebauer, H.; Abaei, A.; Scheuerle, A.; Weis, J.; Forsberg, K.M.E.; Althaus, K.; Meier, J.; et al. Histological Correlates of Postmortem Ultra-High-Resolution Single-Section MRI in Cortical Cerebral Microinfarcts. Acta Neuropathol. Commun. 2020, 8, 33. [Google Scholar] [CrossRef] [PubMed]
- Braak, H.; Braak, E. Neuropathological Stageing of Alzheimer-Related Changes. Acta Neuropathol. 1991, 82, 239–259. [Google Scholar] [CrossRef] [PubMed]
- Gallart-Palau, X.; Serra, A.; Hase, Y.; Tan, C.F.; Chen, C.P.; Kalaria, R.N.; Sze, S.K. Brain-Derived and Circulating Vesicle Profiles Indicate Neurovascular Unit Dysfunction in Early Alzheimer’s Disease. Brain Pathol. 2019, 29, 593–605. [Google Scholar] [CrossRef]
- Puspitasari, V.; Gunawan, P.Y.; Wiradarma, H.D.; Hartoyo, V. Glial Fibrillary Acidic Protein Serum Level as a Predictor of Clinical Outcome in Ischemic Stroke. Open Access Maced. J. Med. Sci. 2019, 7, 1471–1474. [Google Scholar] [CrossRef] [Green Version]
- Abdelhak, A.; Huss, A.; Kassubek, J.; Tumani, H.; Otto, M. Serum GFAP as a Biomarker for Disease Severity in Multiple Sclerosis. Sci. Rep. 2018, 8, 14798. [Google Scholar] [CrossRef]
- Abdelhak, A.; Hottenrott, T.; Morenas-Rodríguez, E.; Suárez-Calvet, M.; Zettl, U.K.; Haass, C.; Meuth, S.G.; Rauer, S.; Otto, M.; Tumani, H.; et al. Glial Activation Markers in CSF and Serum from Patients with Primary Progressive Multiple Sclerosis: Potential of Serum GFAP as Disease Severity Marker? Front. Neurol. 2019, 10, 280. [Google Scholar] [CrossRef]
- Högel, H.; Rissanen, E.; Barro, C.; Matilainen, M.; Nylund, M.; Kuhle, J.; Airas, L. Serum Glial Fibrillary Acidic Protein Correlates with Multiple Sclerosis Disease Severity. Mult. Scler. J. 2018, 26, 210–219. [Google Scholar] [CrossRef] [PubMed]
- Oeckl, P.; Halbgebauer, S.; Anderl-Straub, S.; Steinacker, P.; Huss, A.M.; Neugebauer, H.; von Arnim, C.A.F.; Diehl-Schmid, J.; Grimmer, T.; Kornhuber, J.; et al. Glial Fibrillary Acidic Protein in Serum Is Increased in Alzheimer’s Disease and Correlates with Cognitive Impairment. J. Alzheimer’s Dis. 2019, 67, 481–488. [Google Scholar] [CrossRef] [PubMed]
- Watanabe, M.; Nakamura, Y.; Michalak, Z.; Isobe, N.; Barro, C.; Leppert, D.; Matsushita, T.; Hayashi, F.; Yamasaki, R.; Kuhle, J.; et al. Serum GFAP and Neurofilament Light as Biomarkers of Disease Activity and Disability in NMOSD. Neurology 2019, 93, E1299–E1311. [Google Scholar] [CrossRef] [PubMed]
- Aktas, O.; Smith, M.A.; Rees, W.A.; Bennett, J.L.; She, D.; Katz, E.; Cree, B.A.C.; Fujihara, K.; Paul, F.; Hartung, H.; et al. Serum Glial Fibrillary Acidic Protein: A Neuromyelitis Optica Spectrum Disorder Biomarker. Ann. Neurol. 2021, 89, 895–910. [Google Scholar] [CrossRef]
- Wardlaw, J.M.; Smith, C.; Dichgans, M. Small Vessel Disease: Mechanisms and Clinical Implications. Rev. Lancet Neurol. 2019, 18, 684–696. [Google Scholar] [CrossRef]
- Cuadrado-Godia, E.; Dwivedi, P.; Sharma, S.; Santiago, A.O.; Gonzalez, J.R.; Balcells, M.; Laird, J.; Turk, M.; Suri, H.S.; Nicolaides, A.; et al. Cerebral Small Vessel Disease: A Review Focusing on Pathophysiology, Biomarkers, and Machine Learning Strategies. J. Stroke 2018, 20, 302–320. [Google Scholar] [CrossRef]
- Brown, W.R.; Thore, C.R. Review: Cerebral Microvascular Pathology in Ageing and Neurodegeneration. Neuropathol. Appl. Neurobiol. 2011, 37, 56–74. [Google Scholar] [CrossRef] [Green Version]
- Mattsson, N.; Andreasson, U.; Zetterberg, H.; Blennow, K.; Weiner, M.W.; Aisen, P.; Toga, A.W.; Petersen, R.; Jack, C.R.; Jagust, W.; et al. Association of Plasma Neurofilament Light with Neurodegeneration in Patients with Alzheimer Disease. JAMA Neurol. 2017, 74, 557–566. [Google Scholar] [CrossRef]
- Preische, O.; Schultz, S.A.; Apel, A.; Kuhle, J.; Kaeser, S.A.; Barro, C.; Gräber, S.; Kuder-Buletta, E.; LaFougere, C.; Laske, C.; et al. Serum Neurofilament Dynamics Predicts Neurodegeneration and Clinical Progression in Presymptomatic Alzheimer’s Disease. Nat. Med. 2019, 25, 277–283. [Google Scholar] [CrossRef] [PubMed]
- Van Der Flier, W.M.; Van Straaten, E.C.W.; Barkhof, F.; Ferro, J.M.; Pantoni, L.; Basile, A.M.; Inzitari, D.; Erkinjuntti, T.; Wahlund, L.O.; Rostrup, E.; et al. Medial Temporal Lobe Atrophy and White Matter Hyperintensities Are Associated with Mild Cognitive Deficits in Non-Disabled Elderly People: The LADIS Study. J. Neurol. Neurosurg. Psychiatry 2005, 76, 1497–1500. [Google Scholar] [CrossRef] [Green Version]
- Godin, O.; Tzourio, C.; Rouaud, O.; Zhu, Y.; Maillard, P.; Pasquier, F.; Crivello, F.; Alpérovitch, A.; Mazoyer, B.; Dufouil, C. Joint Effect of White Matter Lesions and Hippocampal Volumes on Severity of Cognitive Decline: The 3C-Dijon MRI Study. J. Alzheimer’s Dis. 2010, 20, 453–463. [Google Scholar] [CrossRef] [PubMed]
- Prins, N.D.; Scheltens, P. White Matter Hyperintensities, Cognitive Impairment and Dementia: An Update. Nat. Rev. Neurol. 2015, 11, 157–165. [Google Scholar] [CrossRef] [PubMed]
- Kalaria, R.N. Small Vessel Disease and Alzheimer’s Dementia: Pathological Considerations. Cerebrovasc. Dis. 2002, 13, 48–52. [Google Scholar] [CrossRef] [PubMed]
- Breteler, M.M.B. Vascular Risk Factors for Alzheimer’s Disease: An Epidemiologic Perspective. Neurobiol. Aging 2000, 21, 153–160. [Google Scholar] [CrossRef]
- Fleisher, A.S.; Pontecorvo, M.J.; Devous, M.D.; Lu, M.; Arora, A.K.; Truocchio, S.P.; Aldea, P.; Flitter, M.; Locascio, T.; Devine, M.; et al. Positron Emission Tomography Imaging with [18F]Flortaucipir and Postmortem Assessment of Alzheimer Disease Neuropathologic Changes. JAMA Neurol. 2020, 77, 829–839. [Google Scholar] [CrossRef]
- Clark, C.M.; Pontecorvo, M.J.; Beach, T.G.; Bedell, B.J.; Coleman, R.E.; Doraiswamy, P.M.; Fleisher, A.S.; Reiman, E.M.; Sabbagh, M.N.; Sadowsky, C.H.; et al. Cerebral PET with Florbetapir Compared with Neuropathology at Autopsy for Detection of Neuritic Amyloid-β Plaques: A Prospective Cohort Study. Lancet Neurol. 2012, 11, 669–678. [Google Scholar] [CrossRef]
- Baykara, E.; Gesierich, B.; Adam, R.; Tuladhar, A.M.; Biesbroek, J.M.; Koek, H.L.; Ropele, S.; Jouvent, E.; Chabriat, H.; Ertl-Wagner, B.; et al. A Novel Imaging Marker for Small Vessel Disease Based on Skeletonization of White Matter Tracts and Diffusion Histograms. Ann. Neurol. 2016, 80, 581–592. [Google Scholar] [CrossRef] [PubMed]
- Ter Telgte, A.; Van Leijsen, E.M.C.; Wiegertjes, K.; Klijn, C.J.M.; Tuladhar, A.M.; De Leeuw, F.E. Cerebral Small Vessel Disease: From a Focal to a Global Perspective. Nat. Rev. Neurol. 2018, 14, 387–398. [Google Scholar] [CrossRef]
Publisher’s Note: MDPI stays neutral with regard to jurisdictional claims in published maps and institutional affiliations. |
© 2022 by the authors. Licensee MDPI, Basel, Switzerland. This article is an open access article distributed under the terms and conditions of the Creative Commons Attribution (CC BY) license (https://creativecommons.org/licenses/by/4.0/).
Share and Cite
Huss, A.; Abdelhak, A.; Mayer, B.; Tumani, H.; Müller, H.-P.; Althaus, K.; Kassubek, J.; Otto, M.; Ludolph, A.C.; Yilmazer-Hanke, D.; et al. Association of Serum GFAP with Functional and Neurocognitive Outcome in Sporadic Small Vessel Disease. Biomedicines 2022, 10, 1869. https://doi.org/10.3390/biomedicines10081869
Huss A, Abdelhak A, Mayer B, Tumani H, Müller H-P, Althaus K, Kassubek J, Otto M, Ludolph AC, Yilmazer-Hanke D, et al. Association of Serum GFAP with Functional and Neurocognitive Outcome in Sporadic Small Vessel Disease. Biomedicines. 2022; 10(8):1869. https://doi.org/10.3390/biomedicines10081869
Chicago/Turabian StyleHuss, André, Ahmed Abdelhak, Benjamin Mayer, Hayrettin Tumani, Hans-Peter Müller, Katharina Althaus, Jan Kassubek, Markus Otto, Albert C. Ludolph, Deniz Yilmazer-Hanke, and et al. 2022. "Association of Serum GFAP with Functional and Neurocognitive Outcome in Sporadic Small Vessel Disease" Biomedicines 10, no. 8: 1869. https://doi.org/10.3390/biomedicines10081869
APA StyleHuss, A., Abdelhak, A., Mayer, B., Tumani, H., Müller, H.-P., Althaus, K., Kassubek, J., Otto, M., Ludolph, A. C., Yilmazer-Hanke, D., & Neugebauer, H. (2022). Association of Serum GFAP with Functional and Neurocognitive Outcome in Sporadic Small Vessel Disease. Biomedicines, 10(8), 1869. https://doi.org/10.3390/biomedicines10081869