
Concerted Regulation of Glycosylation Factors Sustains Tissue Identity and Function

 , ,
, ,  and
and 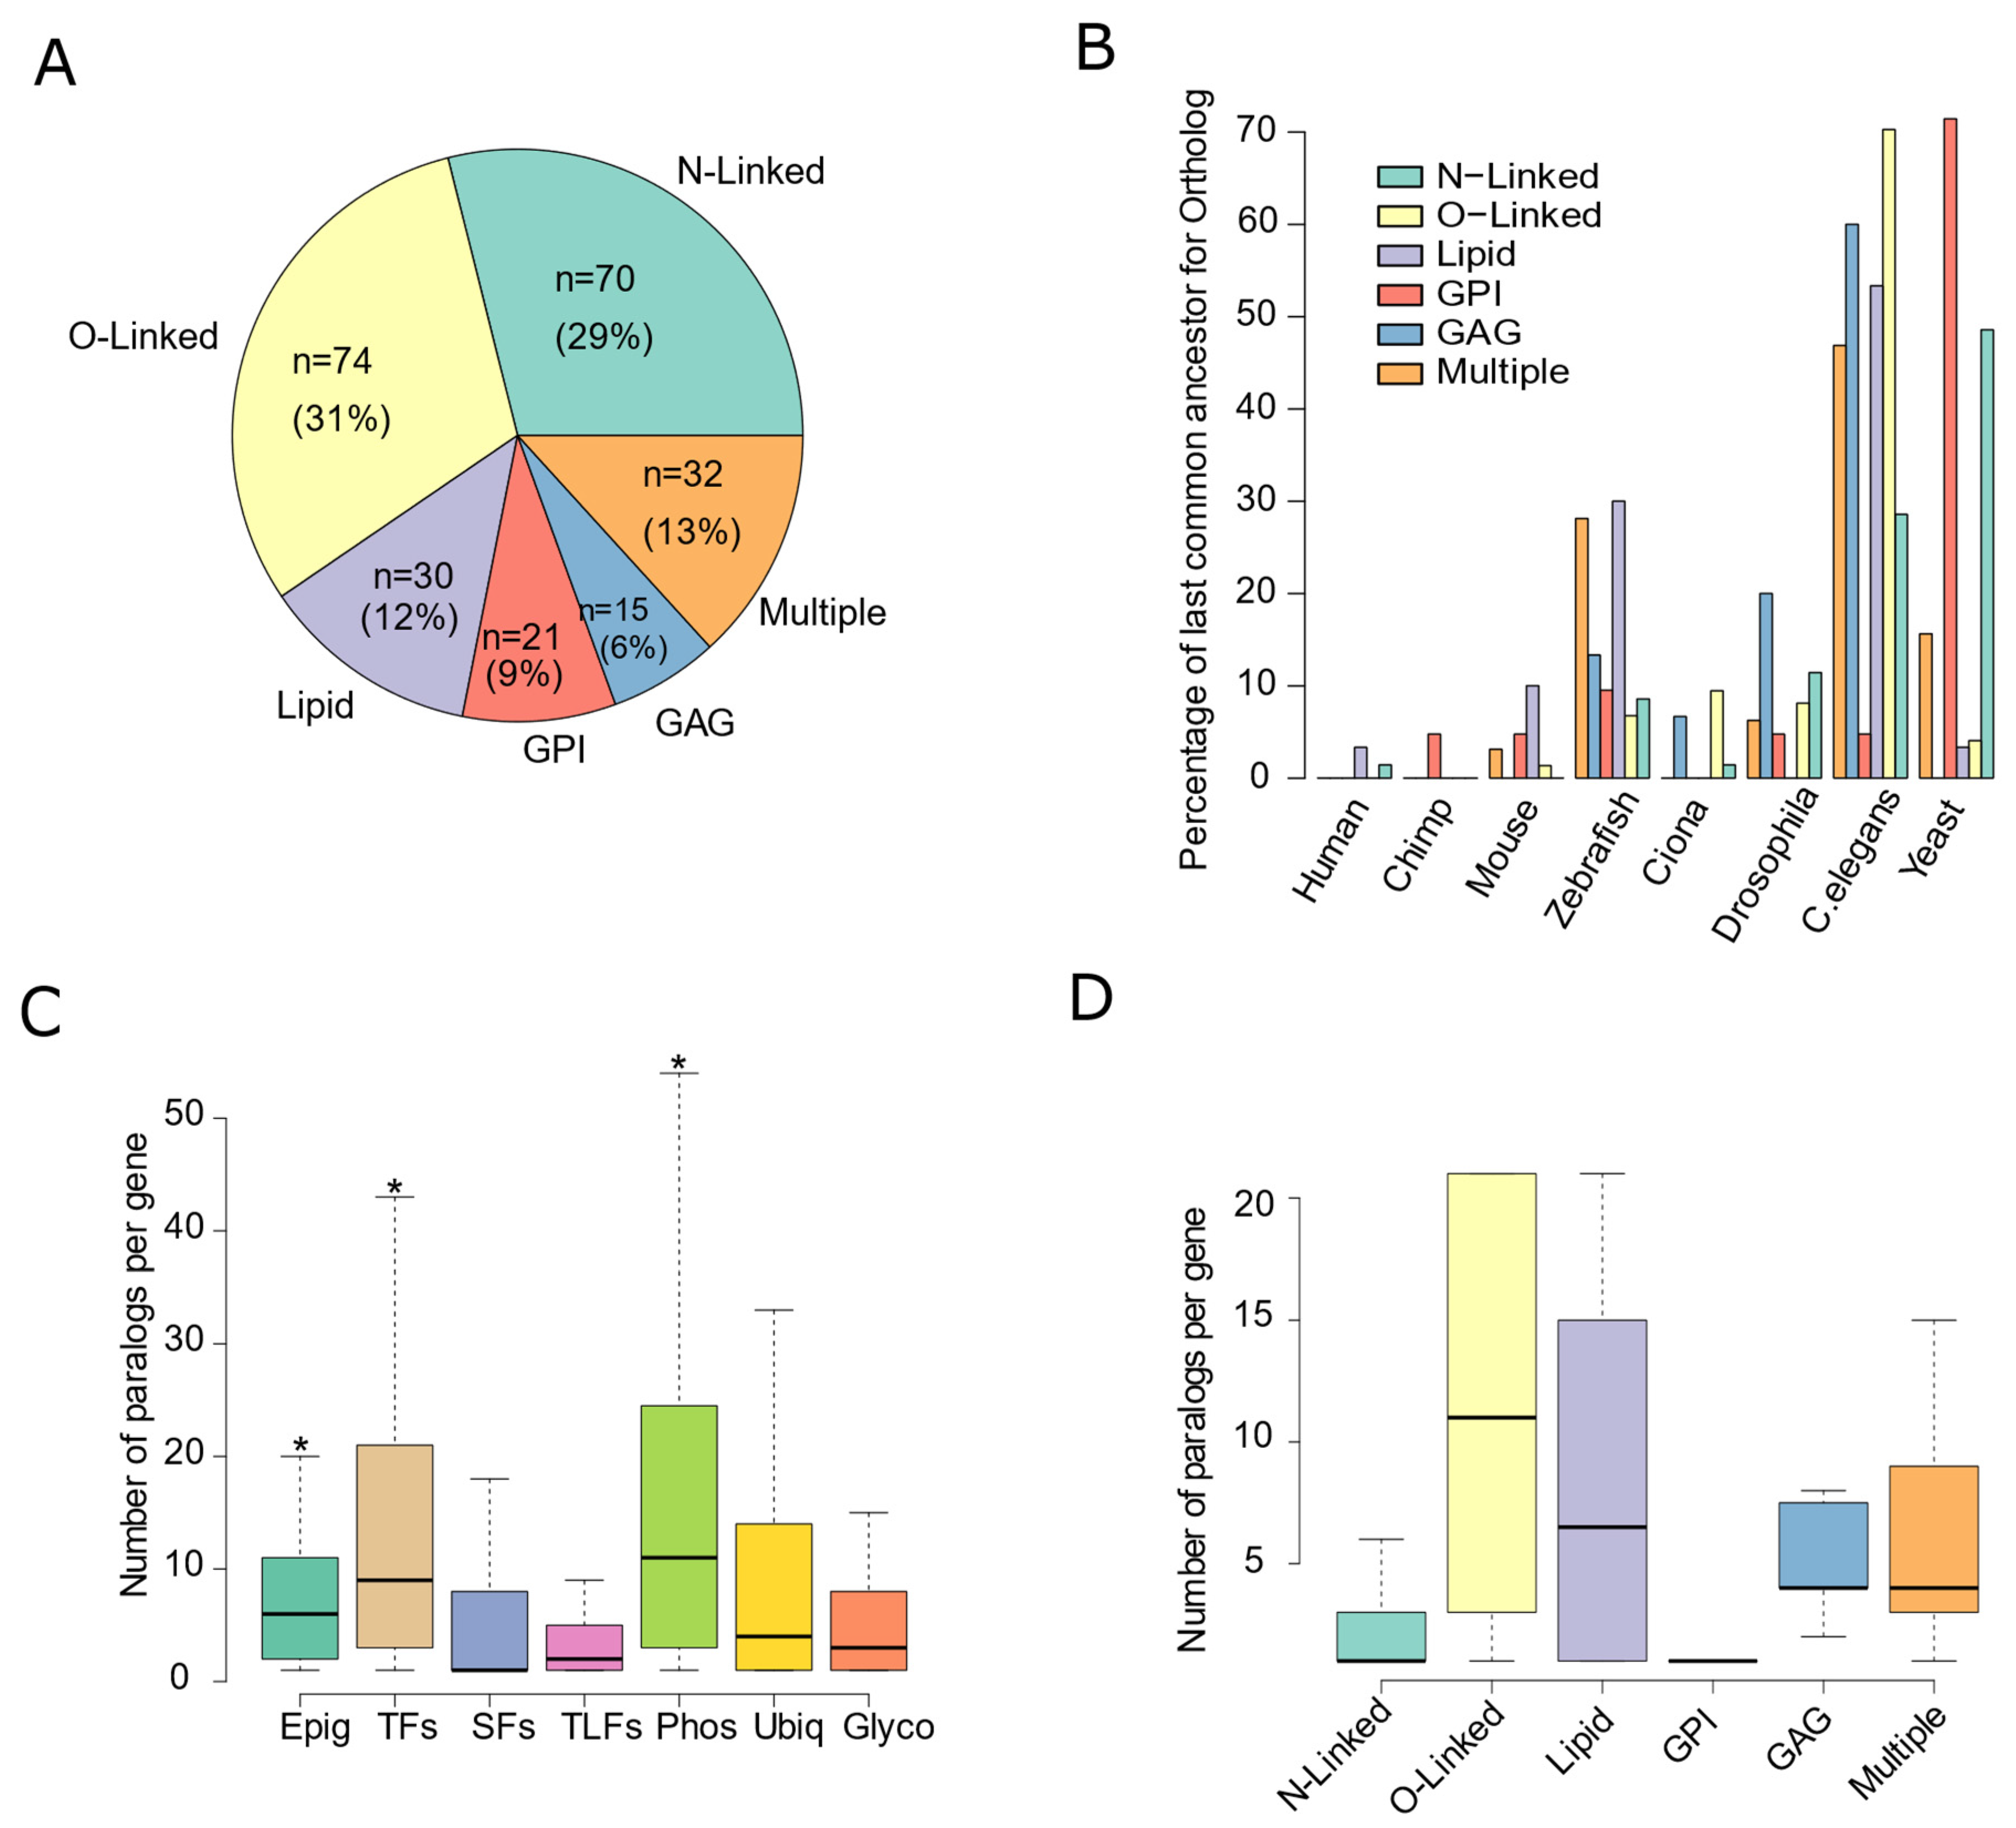
Abstract
:1. Introduction
2. Materials and Methods
2.1. Selection of Glycosylation-Factors and Gene Expression-Related Genes
2.2. Phylogenetic Information and Expression
2.3. Transcriptome Profiles of Healthy Tissues
2.4. Tissue-Specificity and Classification Based on Transcriptome Profiles
2.5. Molecular Profiles of Tumor Samples
2.6. Impact of Genetic Alterations
2.7. Transcriptome Alterations in Tumor Samples
2.8. Association with Cellular Composition in Healthy and Diseased Tissues
2.9. Statistical Analysis
3. Results
3.1. Glycosylation Factors Are an Evolutionarily Conserved Family of Genes

3.2. Glycosylation Factors Show Tissue-Specific Expression Preserved across Mammals
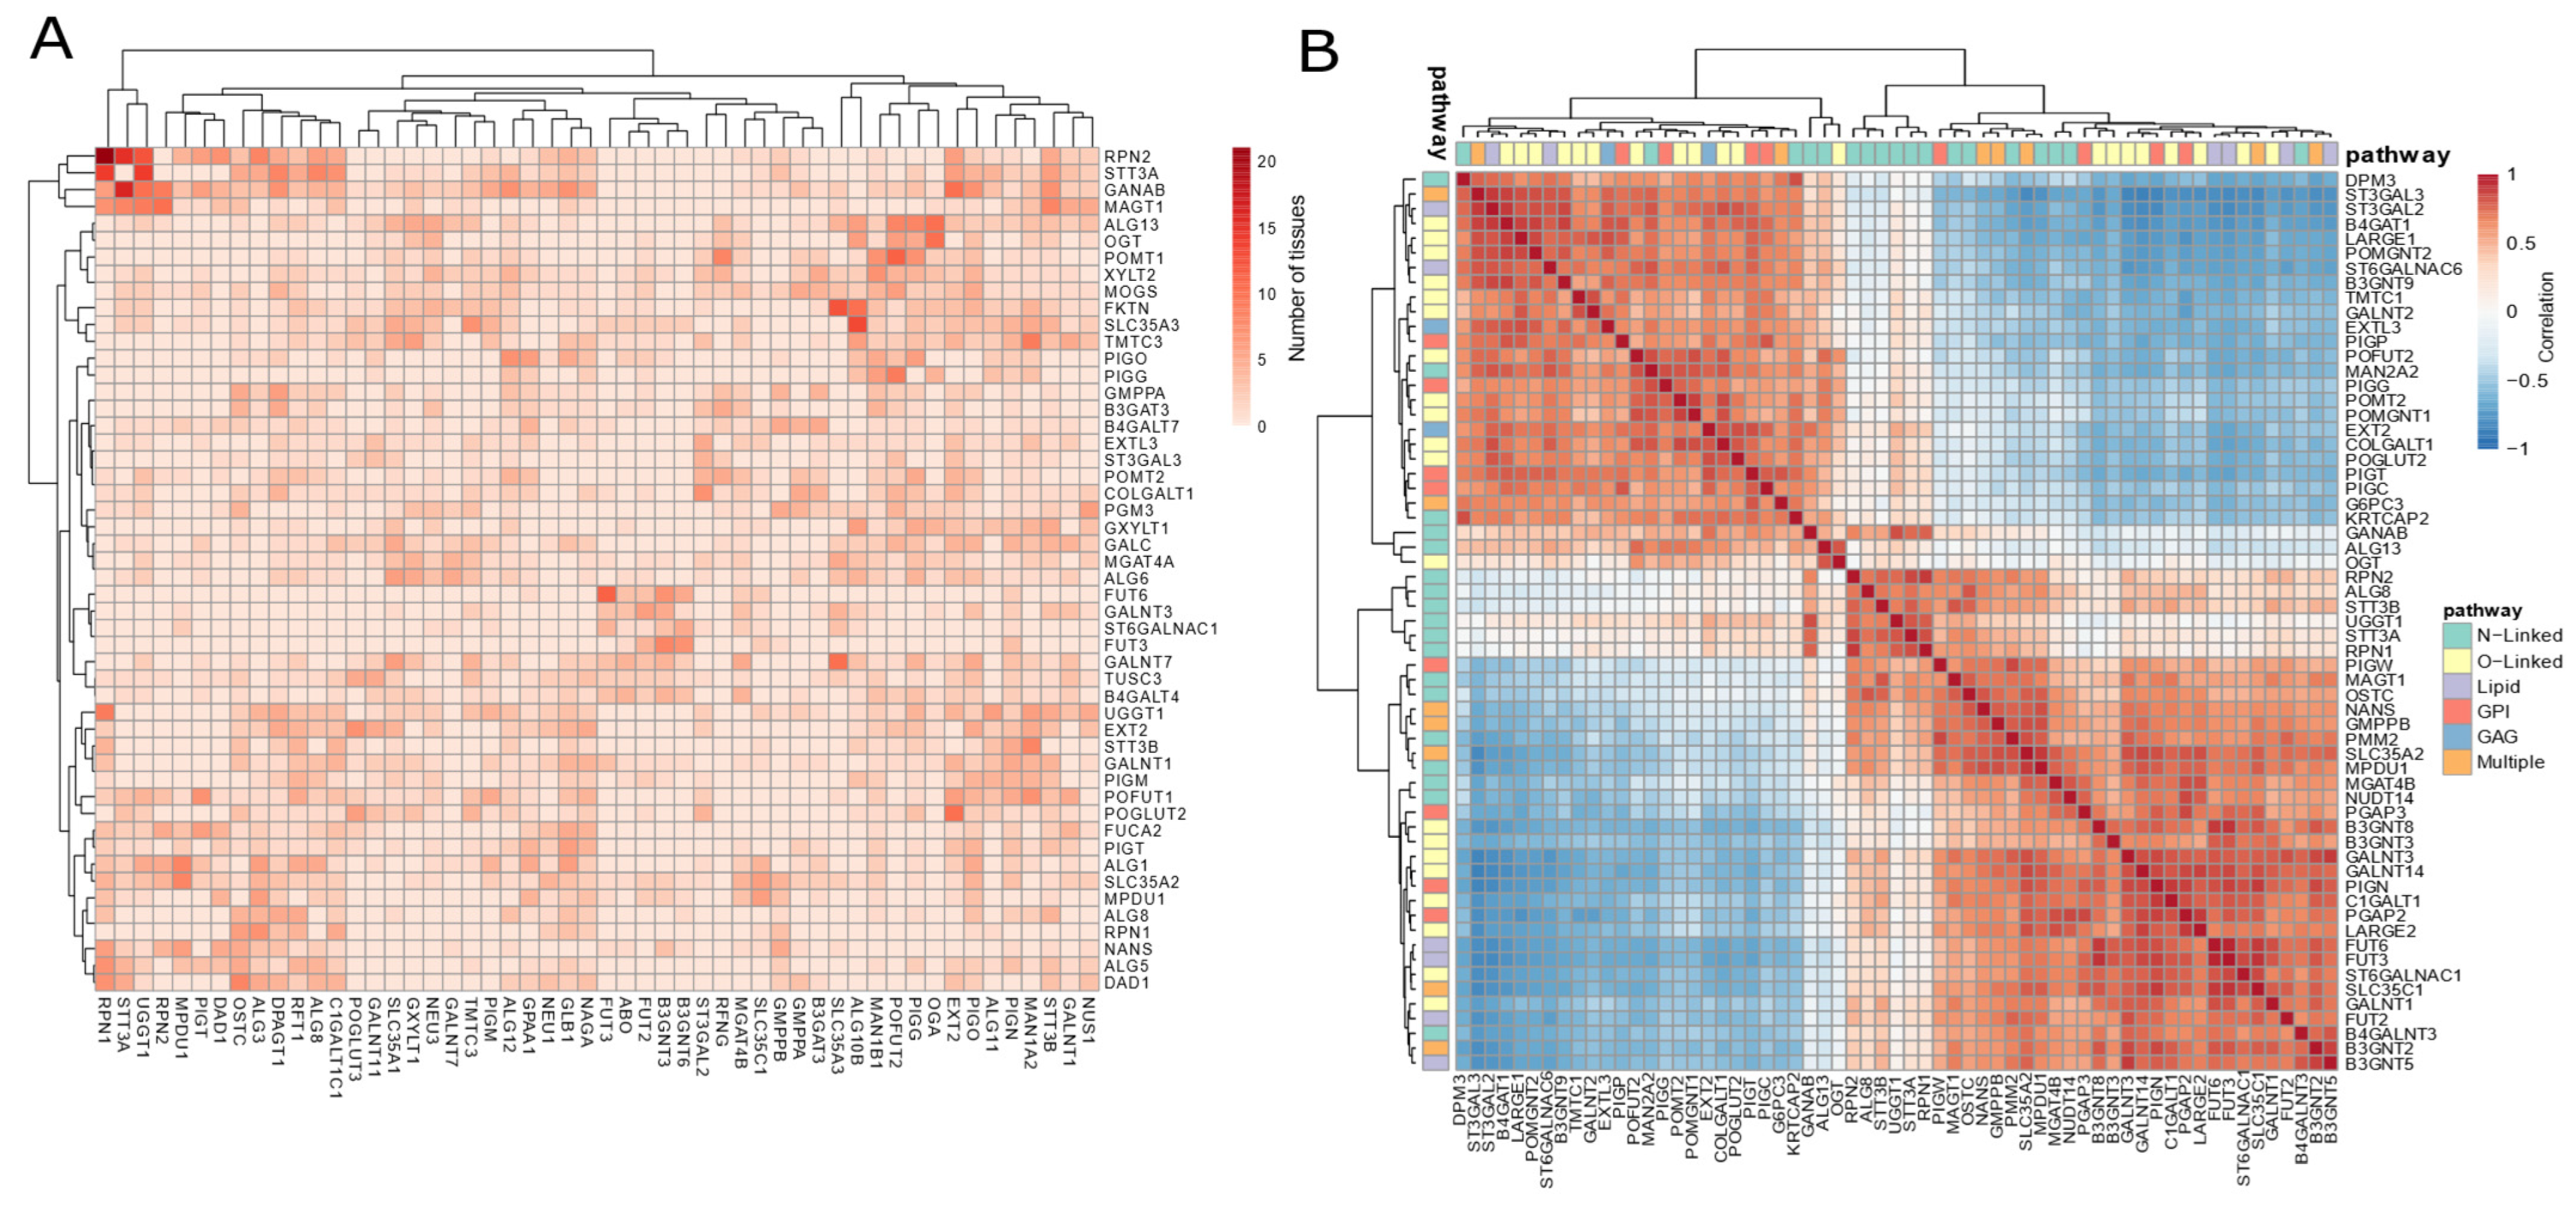
3.3. Co-Expression Patterns Strengthen a Tissue-Specific Glycosylation Code
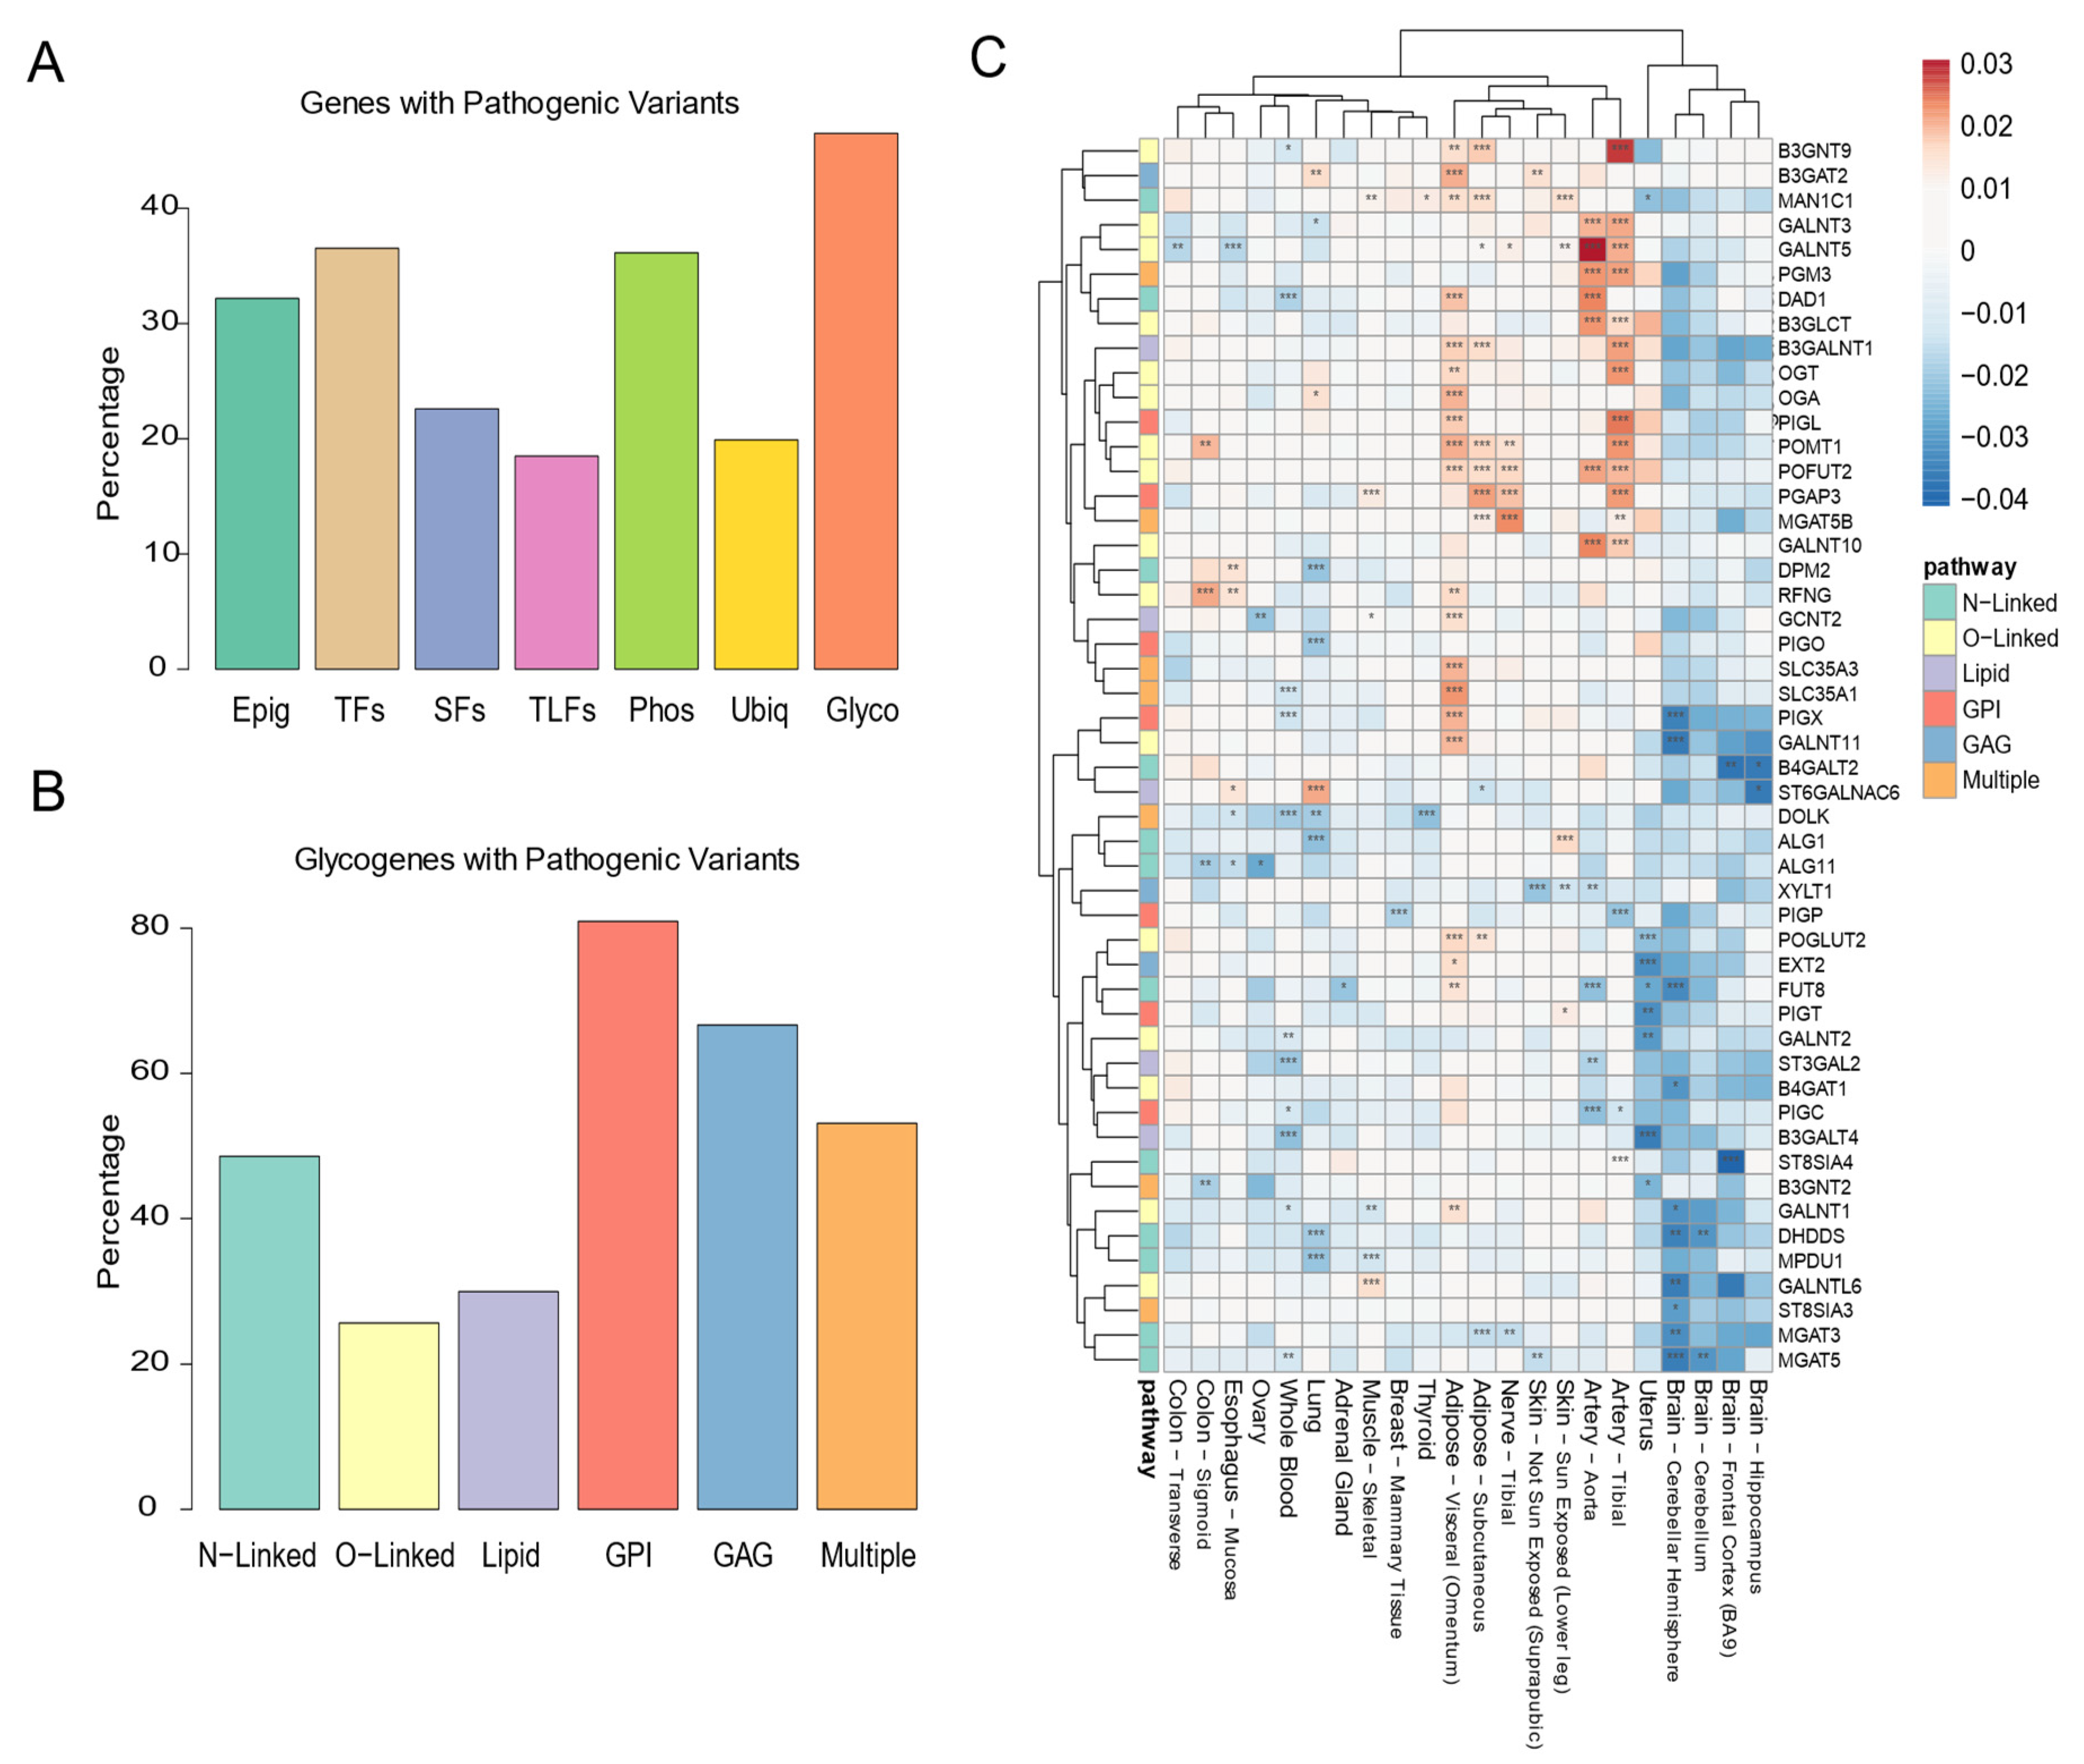
3.4. Maintenance of the Glycosylation Machinery Is Important for Human Health
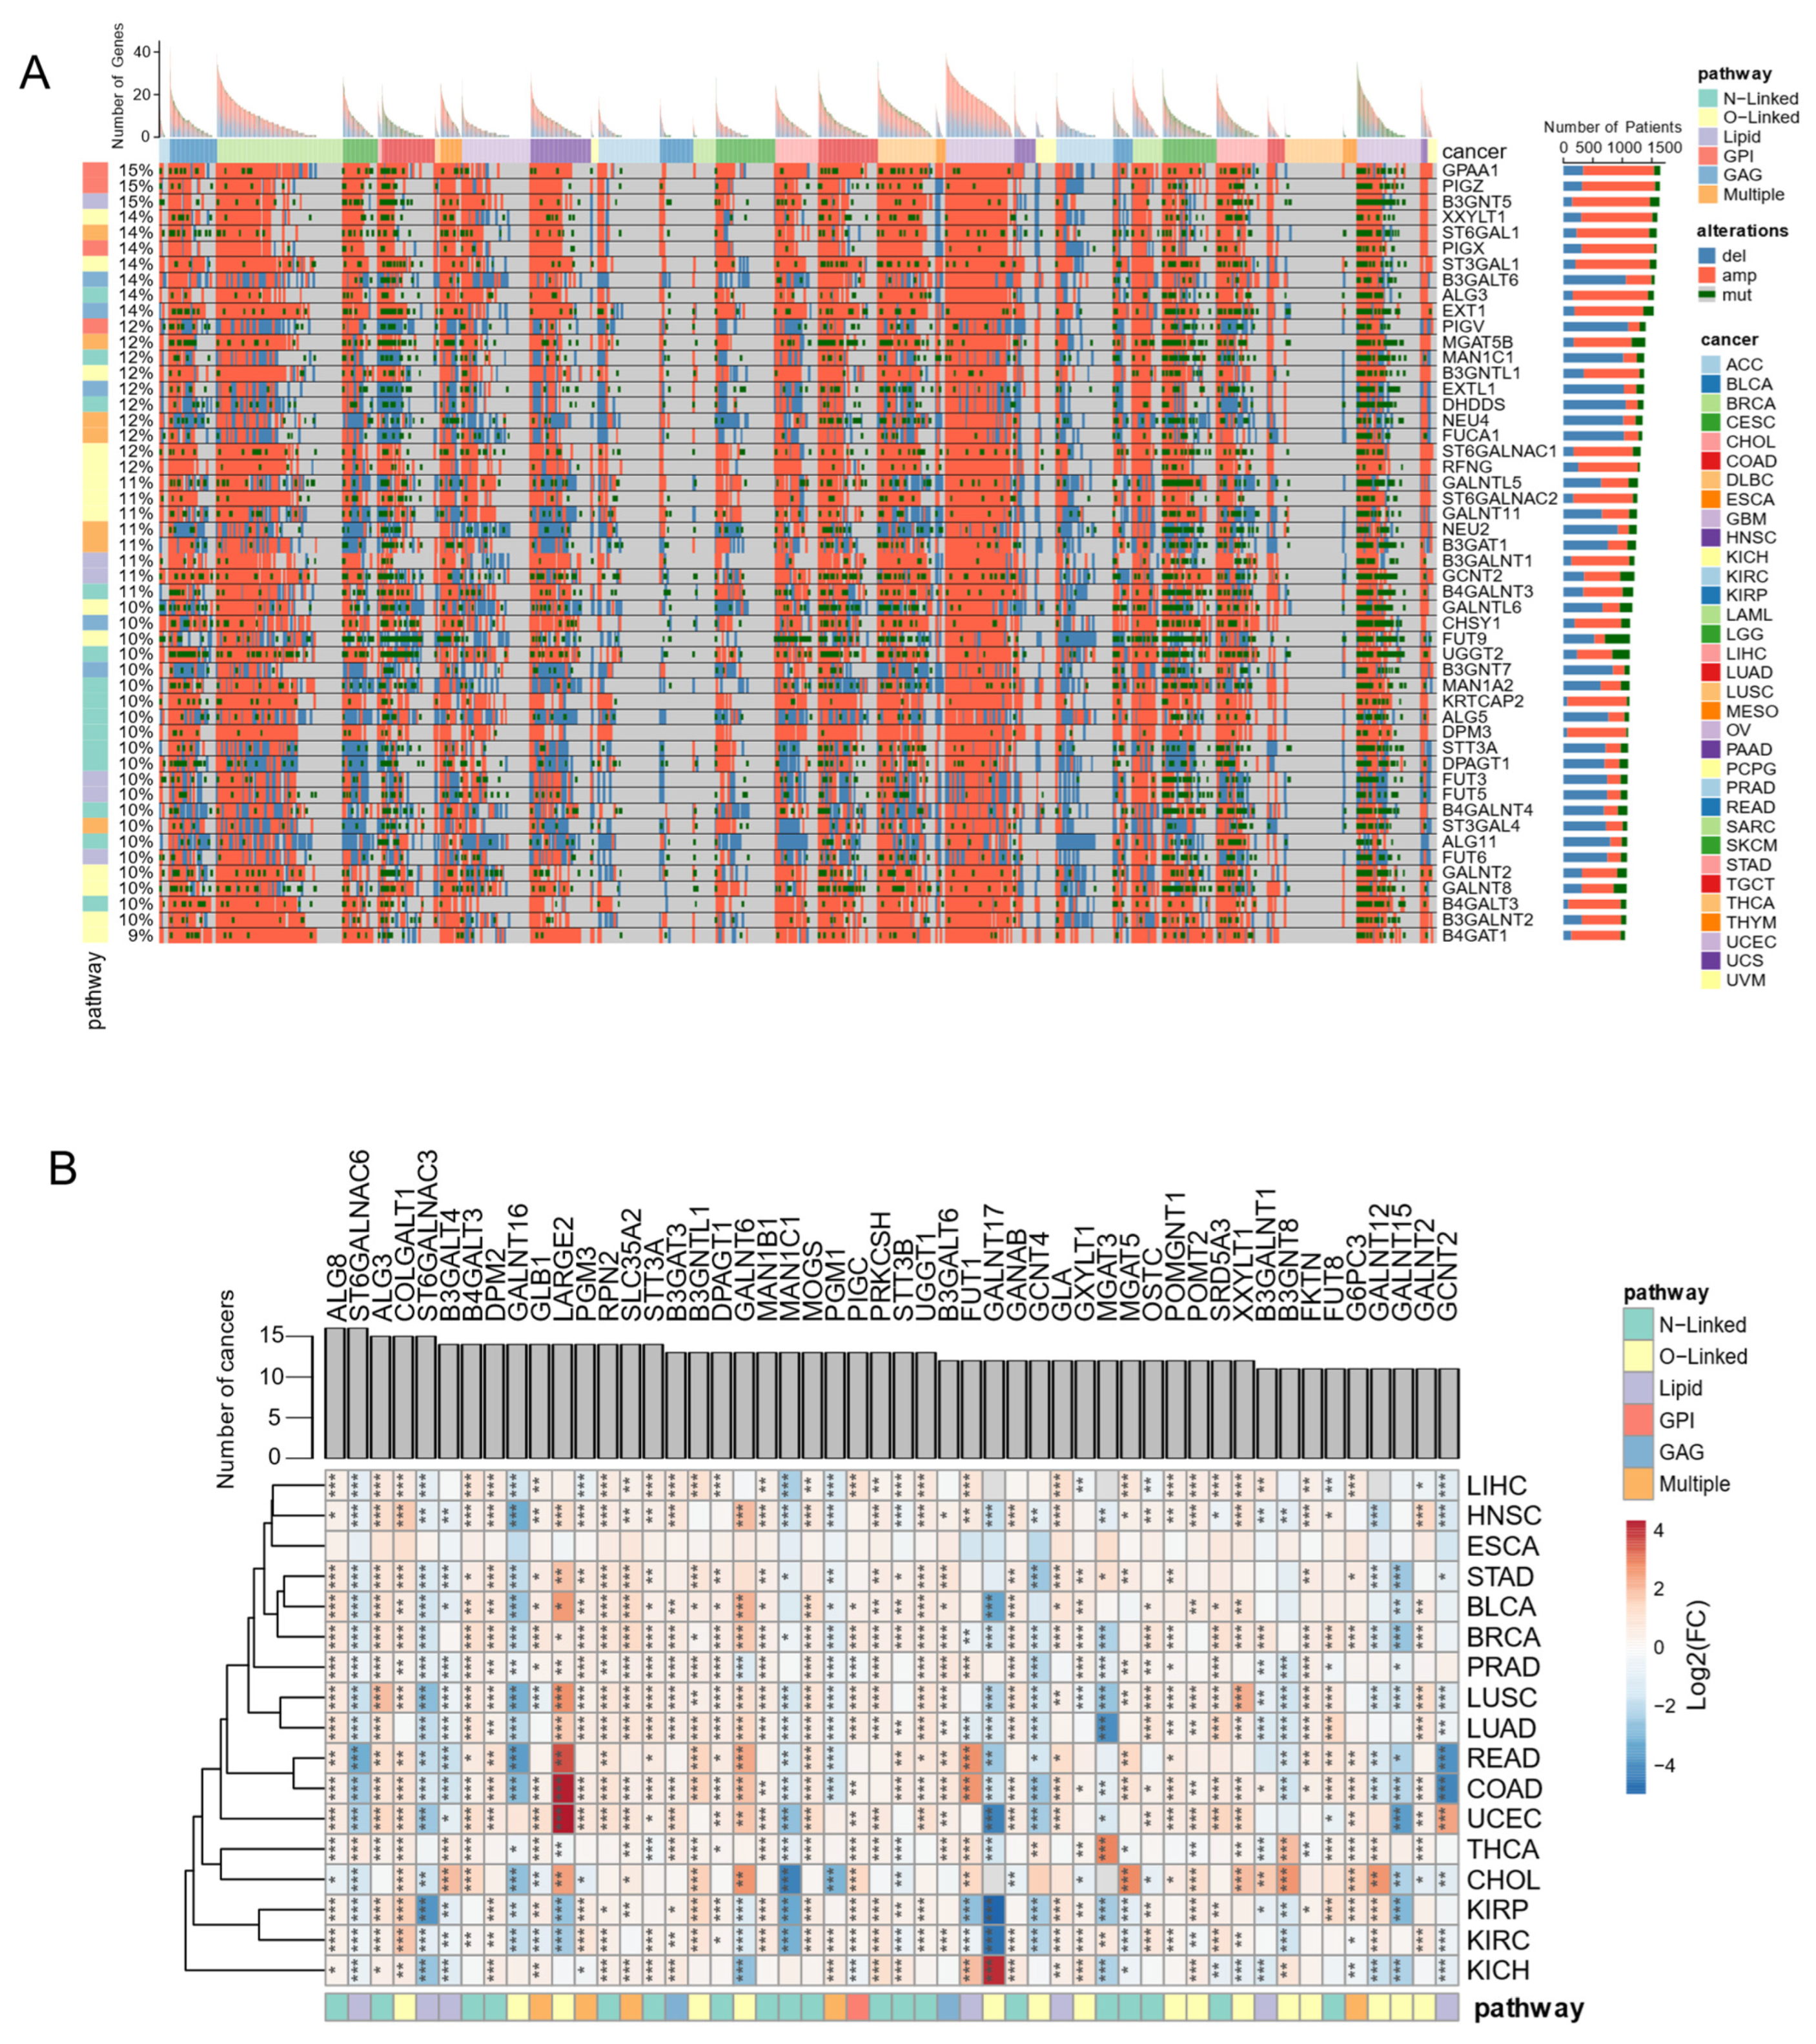
3.5. Genome and Transcriptome Alterations of Glycosylation Factors Are Pervasive in Cancer
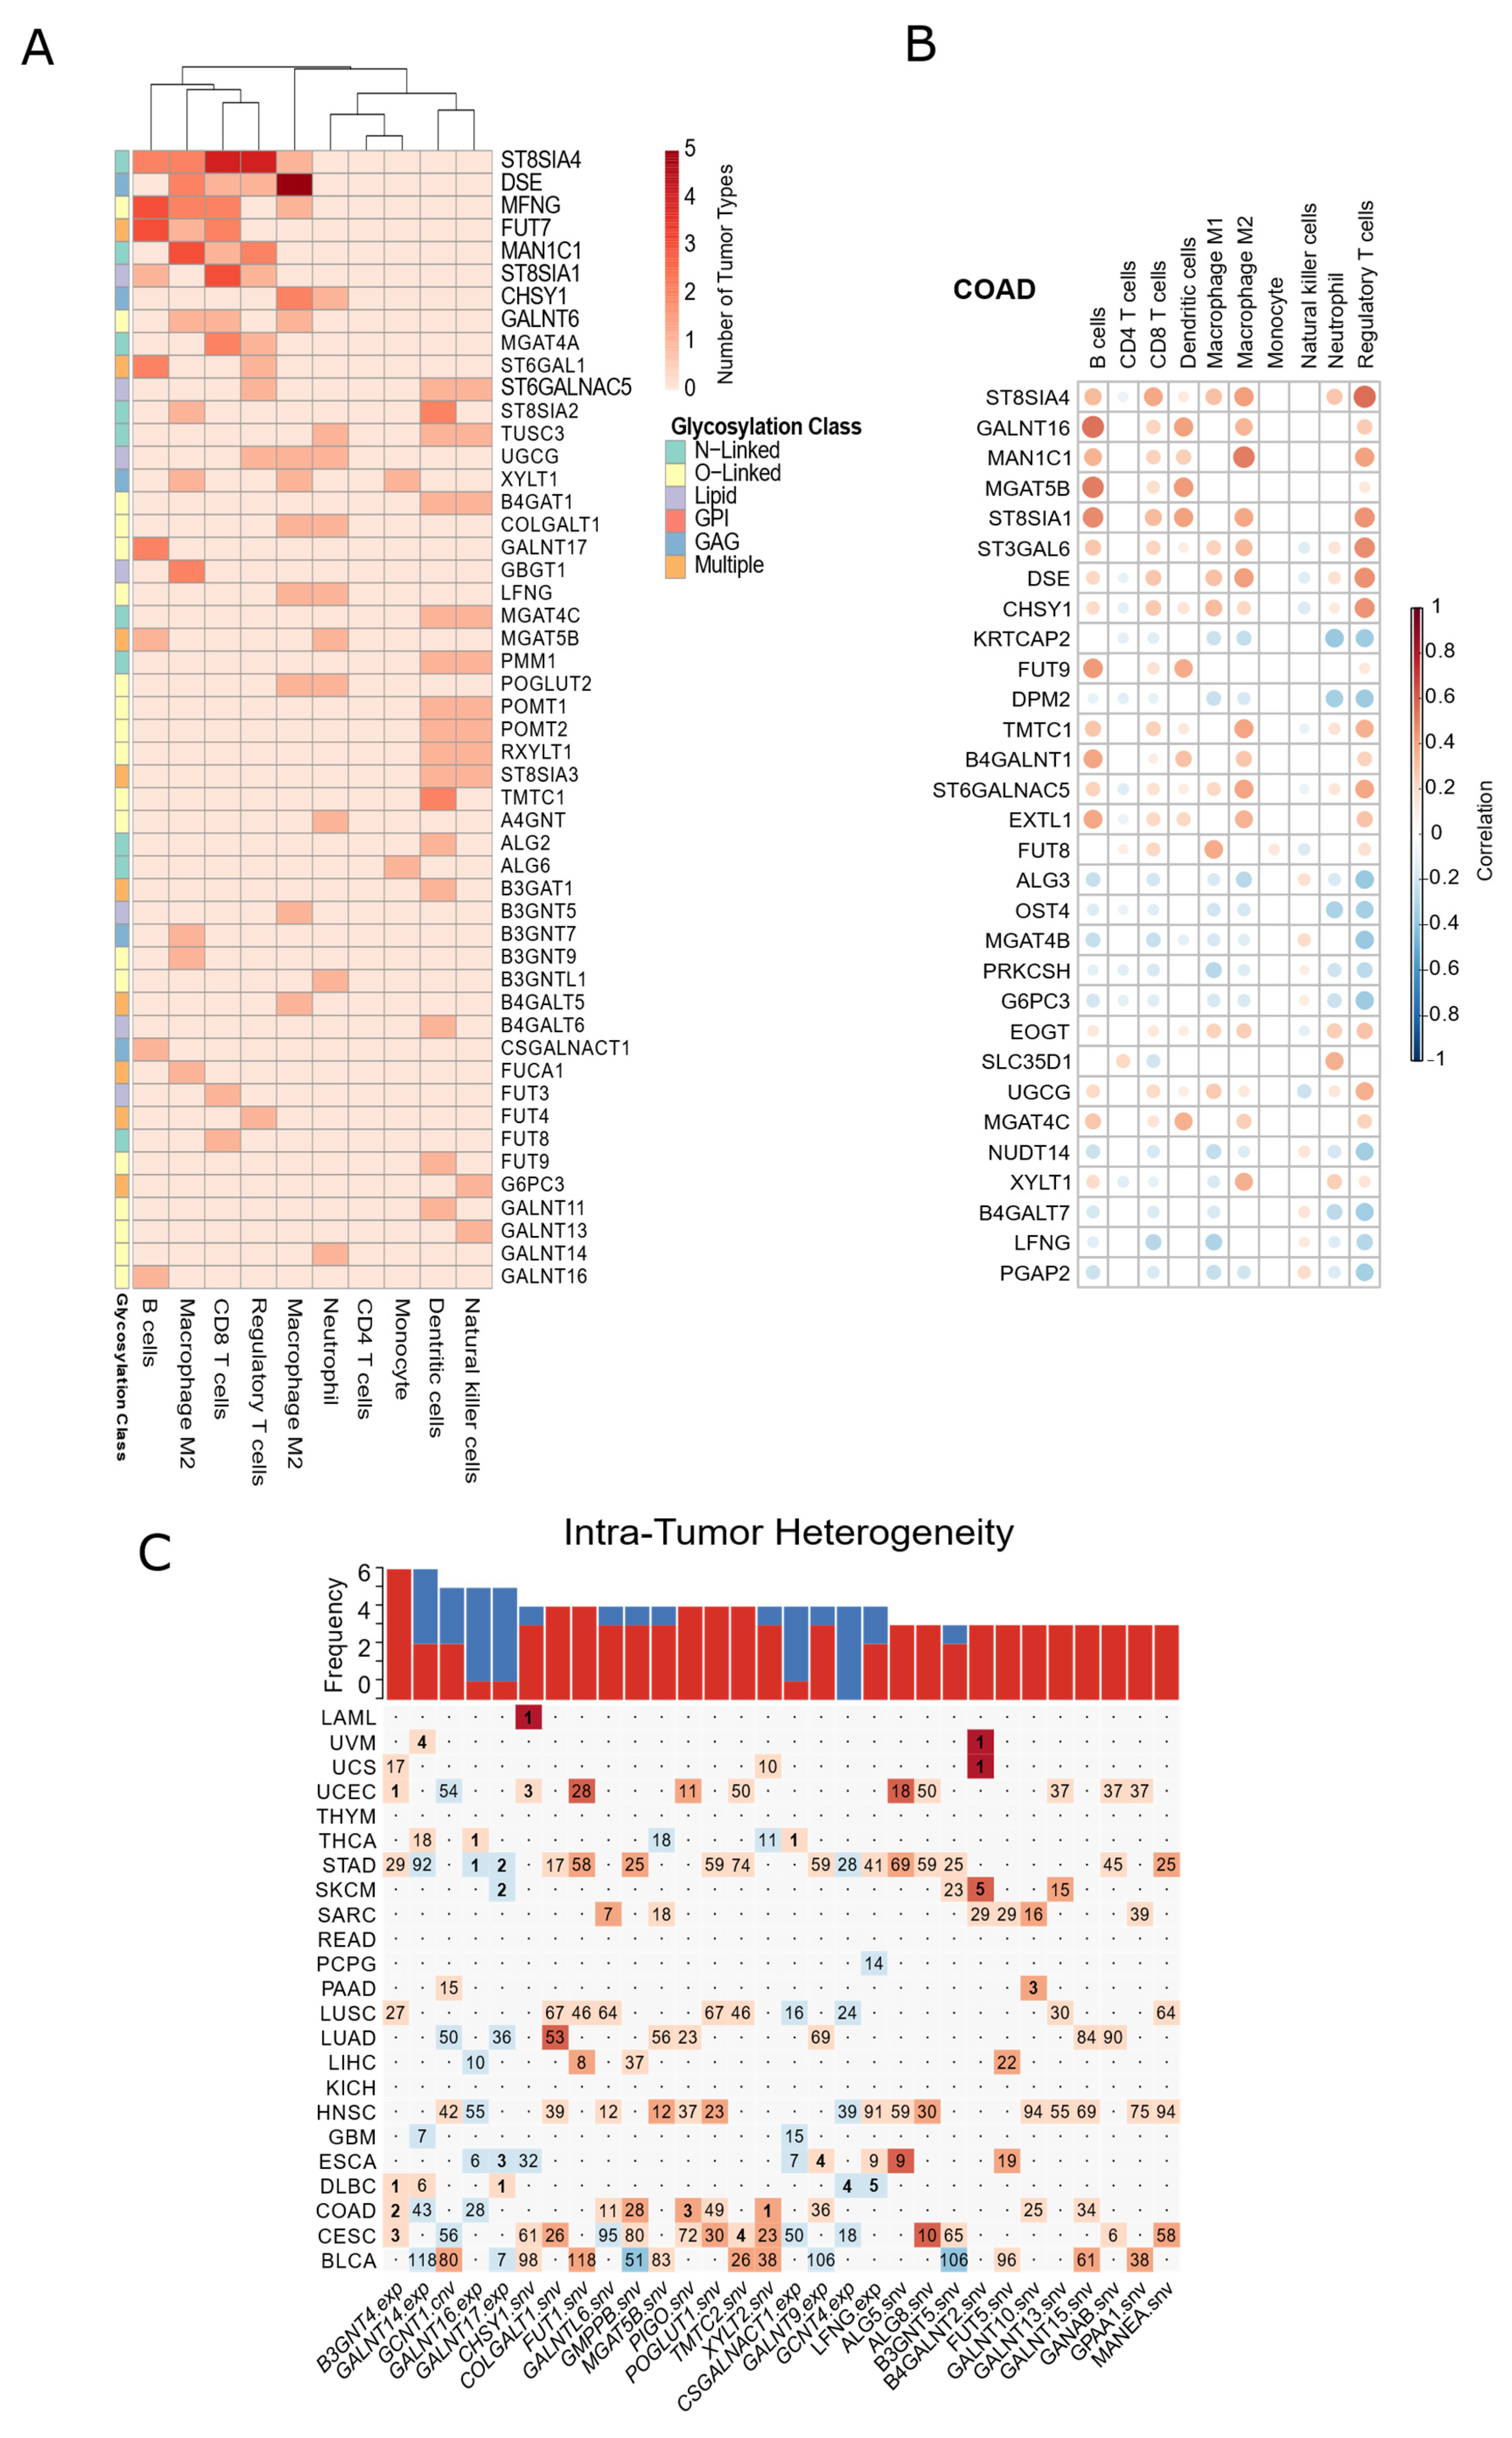
3.6. Glycosylation Machinery Is Associated with Changes in the Cellular Composition of Healthy Tissues and Tumor Microenvironment
4. Discussion
Supplementary Materials
Author Contributions
Funding
Institutional Review Board Statement
Informed Consent Statement
Data Availability Statement
Acknowledgments
Conflicts of Interest
References
- Varki, A.; Cummings, R.D.; Esko, J.D.; Stanley, P.; Hart, G.W.; Aebi, M.; Darvill, A.G.; Kinoshita, T.; Packer, N.H.; Prestegard, J.H.; et al. (Eds.) Essentials of Glycobiology, 3rd ed.; Cold Spring Harbor Laboratory Press: Cold Spring Harbor, NY, USA, 2015. [Google Scholar]
- Flynn, R.A.; Pedram, K.; Malaker, S.A.; Batista, P.J.; Smith, B.A.H.; Johnson, A.G.; George, B.M.; Majzoub, K.; Villalta, P.W.; Carette, J.E.; et al. Small RNAs Are Modified with N-Glycans and Displayed on the Surface of Living Cells. Cell 2021, 184, 3109–3124.e22. [Google Scholar] [CrossRef]
- Apweiler, R. On the Frequency of Protein Glycosylation, as Deduced from Analysis of the SWISS-PROT Database. Biochim. Biophys. Acta BBA-Gen. Subj. 1999, 1473, 4–8. [Google Scholar] [CrossRef]
- Li, C.-W.; Lim, S.-O.; Xia, W.; Lee, H.-H.; Chan, L.-C.; Kuo, C.-W.; Khoo, K.-H.; Chang, S.-S.; Cha, J.-H.; Kim, T.; et al. Glycosylation and Stabilization of Programmed Death Ligand-1 Suppresses T-Cell Activity. Nat. Commun. 2016, 7, 12632. [Google Scholar] [CrossRef] [PubMed] [Green Version]
- Singh, S.; Thompson, J.A.; Yilmaz, B.; Li, H.; Weis, S.; Sobral, D.; Truglio, M.; Aires da Silva, F.; Aguiar, S.; Carlos, A.R.; et al. Loss of α-Gal during Primate Evolution Enhanced Antibody-Effector Function and Resistance to Bacterial Sepsis. Cell Host Microbe 2021, 29, 347–361.e12. [Google Scholar] [CrossRef] [PubMed]
- Harvey, B.M.; Haltiwanger, R.S. Regulation of Notch Function by O-Glycosylation. In Molecular Mechanisms of Notch Signaling; Borggrefe, T., Giaimo, B.D., Eds.; Advances in Experimental Medicine and Biology; Springer International Publishing: Cham, Switzerland, 2018; Volume 1066, pp. 59–78. ISBN 978-3-319-89511-6. [Google Scholar]
- Lasky, L.A. Selectin-carbohydrate interactions and the initiation of the inflammatory response. Annu. Rev. Biochem. 1995, 64, 113–140. [Google Scholar] [CrossRef] [PubMed]
- Lombard, J. The Multiple Evolutionary Origins of the Eukaryotic N-Glycosylation Pathway. Biol. Direct 2016, 11, 36. [Google Scholar] [CrossRef] [Green Version]
- Ohtsubo, K.; Marth, J.D. Glycosylation in Cellular Mechanisms of Health and Disease. Cell 2006, 126, 855–867. [Google Scholar] [CrossRef] [Green Version]
- Bagdonaite, I.; Pallesen, E.M.; Ye, Z.; Vakhrushev, S.Y.; Marinova, I.N.; Nielsen, M.I.; Kramer, S.H.; Pedersen, S.F.; Joshi, H.J.; Bennett, E.P.; et al. O-glycan Initiation Directs Distinct Biological Pathways and Controls Epithelial Differentiation. EMBO Rep. 2020, 21, e48885. [Google Scholar] [CrossRef]
- Matsuda-Lennikov, M.; Biancalana, M.; Zou, J.; Ravell, J.C.; Zheng, L.; Kanellopoulou, C.; Jiang, P.; Notarangelo, G.; Jing, H.; Masutani, E.; et al. Magnesium Transporter 1 (MAGT1) Deficiency Causes Selective Defects in N-Linked Glycosylation and Expression of Immune-Response Genes. J. Biol. Chem. 2019, 294, 13638–13656. [Google Scholar] [CrossRef]
- Reily, C.; Stewart, T.J.; Renfrow, M.B.; Novak, J. Glycosylation in Health and Disease. Nat. Rev. Nephrol. 2019, 15, 346–366. [Google Scholar] [CrossRef]
- Lauc, G.; Pezer, M.; Rudan, I.; Campbell, H. Mechanisms of Disease: The Human N-Glycome. Biochim. Biophys. Acta 2016, 1860, 1574–1582. [Google Scholar] [CrossRef] [Green Version]
- Videira, P.A.Q.; Castro-Caldas, M. Linking Glycation and Glycosylation With Inflammation and Mitochondrial Dysfunction in Parkinson’s Disease. Front. Neurosci. 2018, 12, 381. [Google Scholar] [CrossRef]
- Fuster, M.M.; Esko, J.D. The Sweet and Sour of Cancer: Glycans as Novel Therapeutic Targets. Nat. Rev. Cancer 2005, 5, 526–542. [Google Scholar] [CrossRef] [PubMed]
- Kirwan, A.; Utratna, M.; O’Dwyer, M.E.; Joshi, L.; Kilcoyne, M. Glycosylation-Based Serum Biomarkers for Cancer Diagnostics and Prognostics. BioMed. Res. Int. 2015, 2015, 490531. [Google Scholar] [CrossRef] [PubMed] [Green Version]
- Pinho, S.S.; Reis, C.A. Glycosylation in Cancer: Mechanisms and Clinical Implications. Nat. Rev. Cancer 2015, 15, 540–555. [Google Scholar] [CrossRef] [PubMed]
- Carrascal, M.A.; Severino, P.F.; Cabral, M.G.; Silva, M.; Ferreira, J.A.; Calais, F.; Quinto, H.; Pen, C.; Ligeiro, D.; Santos, L.L.; et al. Sialyl Tn-Expressing Bladder Cancer Cells Induce a Tolerogenic Phenotype in Innate and Adaptive Immune Cells. Mol. Oncol. 2014, 8, 753–765. [Google Scholar] [CrossRef]
- Lise, M.; Belluco, C.; Perera, S.P.; Patel, R.; Thomas, P.; Ganguly, A. Clinical Correlations of A2,6-Sialyltransferase Expression in Colorectal Cancer Patients. Hybridoma 2000, 19, 281–286. [Google Scholar] [CrossRef]
- Lonsdale, J.; Thomas, J.; Salvatore, M.; Phillips, R.; Lo, E.; Shad, S.; Hasz, R.; Walters, G.; Garcia, F.; Young, N.; et al. The Genotype-Tissue Expression (GTEx) Project. Nat. Genet. 2013, 45, 580–585. [Google Scholar] [CrossRef]
- Uhlén, M.; Fagerberg, L.; Hallström, B.M.; Lindskog, C.; Oksvold, P.; Mardinoglu, A.; Sivertsson, Å.; Kampf, C.; Sjöstedt, E.; Asplund, A.; et al. Tissue-Based Map of the Human Proteome. Science 2015, 347, 1260419. [Google Scholar] [CrossRef]
- The Cancer Genome Atlas Research Network; Weinstein, J.N.; Collisson, E.A.; Mills, G.B.; Shaw, K.R.M.; Ozenberger, B.A.; Ellrott, K.; Shmulevich, I.; Sander, C.; Stuart, J.M. The Cancer Genome Atlas Pan-Cancer Analysis Project. Nat. Genet. 2013, 45, 1113–1120. [Google Scholar] [CrossRef]
- Togayachi, A.; Dae, K.-Y.; Shikanai, T.; Narimatsu, H. A Database System for Glycogenes (GGDB). In Experimental Glycoscience; Taniguchi, N., Suzuki, A., Ito, Y., Narimatsu, H., Kawasaki, T., Hase, S., Eds.; Springer: Tokyo, Japan, 2008; pp. 423–425. ISBN 978-4-431-77921-6. [Google Scholar]
- Jassal, B.; Matthews, L.; Viteri, G.; Gong, C.; Lorente, P.; Fabregat, A.; Sidiropoulos, K.; Cook, J.; Gillespie, M.; Haw, R.; et al. The Reactome Pathway Knowledgebase. Nucleic Acids Res. 2019, 48, gkz1031. [Google Scholar] [CrossRef] [PubMed]
- Kanehisa, M.; Sato, Y.; Kawashima, M.; Furumichi, M.; Tanabe, M. KEGG as a Reference Resource for Gene and Protein Annotation. Nucleic Acids Res. 2016, 44, D457–D462. [Google Scholar] [CrossRef] [Green Version]
- Howe, K.L.; Achuthan, P.; Allen, J.; Allen, J.; Alvarez-Jarreta, J.; Amode, M.R.; Armean, I.M.; Azov, A.G.; Bennett, R.; Bhai, J.; et al. Ensembl 2021. Nucleic Acids Res. 2021, 49, D884–D891. [Google Scholar] [CrossRef] [PubMed]
- Boukas, L.; Havrilla, J.M.; Hickey, P.F.; Quinlan, A.R.; Bjornsson, H.T.; Hansen, K.D. Coexpression Patterns Define Epigenetic Regulators Associated with Neurological Dysfunction. Genome Res. 2019, 29, 532–542. [Google Scholar] [CrossRef] [PubMed]
- Jolma, A.; Yan, J.; Whitington, T.; Toivonen, J.; Nitta, K.R.; Rastas, P.; Morgunova, E.; Enge, M.; Taipale, M.; Wei, G.; et al. DNA-Binding Specificities of Human Transcription Factors. Cell 2013, 152, 327–339. [Google Scholar] [CrossRef] [Green Version]
- Brawand, D.; Soumillon, M.; Necsulea, A.; Julien, P.; Csárdi, G.; Harrigan, P.; Weier, M.; Liechti, A.; Aximu-Petri, A.; Kircher, M.; et al. The Evolution of Gene Expression Levels in Mammalian Organs. Nature 2011, 478, 343–348. [Google Scholar] [CrossRef]
- Breiman, L. Random Forests. Mach. Learn. 2001, 45, 5–32. [Google Scholar] [CrossRef] [Green Version]
- Jain, A.; Tuteja, G. TissueEnrich: Tissue-Specific Gene Enrichment Analysis. Bioinformatics 2019, 35, 1966–1967. [Google Scholar] [CrossRef]
- Martincorena, I.; Raine, K.M.; Gerstung, M.; Dawson, K.J.; Haase, K.; Van Loo, P.; Davies, H.; Stratton, M.R.; Campbell, P.J. Universal Patterns of Selection in Cancer and Somatic Tissues. Cell 2017, 171, 1029–1041.e21. [Google Scholar] [CrossRef]
- Lin, H.; Zelterman, D. Modeling Survival Data: Extending the Cox Model. Technometrics 2002, 44, 85–86. [Google Scholar] [CrossRef]
- Robinson, M.D.; Oshlack, A. A Scaling Normalization Method for Differential Expression Analysis of RNA-Seq Data. Genome Biol. 2010, 11, R25. [Google Scholar] [CrossRef] [PubMed] [Green Version]
- Law, C.W.; Chen, Y.; Shi, W.; Smyth, G.K. Voom: Precision Weights Unlock Linear Model Analysis Tools for RNA-Seq Read Counts. Genome Biol. 2014, 15, R29. [Google Scholar] [CrossRef] [Green Version]
- Korotkevich, G.; Sukhov, V.; Budin, N.; Shpak, B.; Artyomov, M.N.; Sergushichev, A. Fast Gene Set Enrichment Analysis. BioRxiv 2021. [Google Scholar] [CrossRef] [Green Version]
- Charoentong, P.; Finotello, F.; Angelova, M.; Mayer, C.; Efremova, M.; Rieder, D.; Hackl, H.; Trajanoski, Z. Pan-Cancer Immunogenomic Analyses Reveal Genotype-Immunophenotype Relationships and Predictors of Response to Checkpoint Blockade. Cell Rep. 2017, 18, 248–262. [Google Scholar] [CrossRef] [PubMed] [Green Version]
- Plattner, C.; Finotello, F.; Rieder, D. Deconvoluting Tumor-Infiltrating Immune Cells from RNA-Seq Data Using QuanTIseq. In Methods in Enzymology; Elsevier: Amsterdam, The Netherlands, 2020; Volume 636, pp. 261–285. ISBN 978-0-12-820667-6. [Google Scholar]
- de Matos, M.; Posa, I.; Carvalho, F.; Morais, V.; Grosso, A.; de Almeida, S. A Systematic Pan-Cancer Analysis of Genetic Heterogeneity Reveals Associations with Epigenetic Modifiers. Cancers 2019, 11, 391. [Google Scholar] [CrossRef] [PubMed] [Green Version]
- Friedman, J.; Hastie, T.; Tibshirani, R. Regularization Paths for Generalized Linear Models via Coordinate Descent. J. Stat. Softw. 2010, 33, 1–22. [Google Scholar] [CrossRef] [Green Version]
- Andor, N.; Harness, J.V.; Müller, S.; Mewes, H.W.; Petritsch, C. EXPANDS: Expanding Ploidy and Allele Frequency on Nested Subpopulations. Bioinformatics 2014, 30, 50–60. [Google Scholar] [CrossRef]
- Nothaft, H.; Szymanski, C.M. Protein Glycosylation in Bacteria: Sweeter than Ever. Nat. Rev. Microbiol. 2010, 8, 765–778. [Google Scholar] [CrossRef]
- Tomono, T.; Kojima, H.; Fukuchi, S.; Tohsato, Y.; Ito, M. Investigation of Glycan Evolution Based on a Comprehensive Analysis of Glycosyltransferases Using Phylogenetic Profiling. Biophys. Phys. 2015, 12, 57–68. [Google Scholar] [CrossRef] [Green Version]
- Praissman, J.L.; Live, D.H.; Wang, S.; Ramiah, A.; Chinoy, Z.S.; Boons, G.-J.; Moremen, K.W.; Wells, L. B4GAT1 Is the Priming Enzyme for the LARGE-Dependent Functional Glycosylation of α-Dystroglycan. eLife 2014, 3, e03943. [Google Scholar] [CrossRef]
- Wakil, S.M.; Monies, D.M.; Ramzan, K.; Hagos, S.; Bastaki, L.; Meyer, B.F.; Bohlega, S. Novel B4GALNT1 Mutations in a Complicated Form of Hereditary Spastic Paraplegia: Letter to the Editor. Clin. Genet. 2014, 86, 500–501. [Google Scholar] [CrossRef] [PubMed]
- Landrum, M.J.; Lee, J.M.; Benson, M.; Brown, G.; Chao, C.; Chitipiralla, S.; Gu, B.; Hart, J.; Hoffman, D.; Hoover, J.; et al. ClinVar: Public Archive of Interpretations of Clinically Relevant Variants. Nucleic Acids Res. 2016, 44, D862–D868. [Google Scholar] [CrossRef] [PubMed] [Green Version]
- Ferreira, C.R.; Altassan, R.; Marques-Da-Silva, D.; Francisco, R.; Jaeken, J.; Morava, E. Recognizable Phenotypes in CDG. J. Inherit. Metab. Dis. 2018, 41, 541–553. [Google Scholar] [CrossRef] [PubMed]
- Vaes, L.; Tiller, G.E.; Pérez, B.; Boyer, S.W.; Berry, S.A.; Sarafoglou, K.; Morava, E. PMM2-CDG Caused by Uniparental Disomy: Case Report and Literature Review. JIMD Rep. 2020, 54, 16–21. [Google Scholar] [CrossRef]
- Matthijs, G.; Schollen, E.; Van Schaftingen, E.; Cassiman, J.-J.; Jaeken, J. Lack of Homozygotes for the Most Frequent Disease Allele in Carbohydrate-Deficient Glycoprotein Syndrome Type 1A. Am. J. Hum. Genet. 1998, 62, 542–550. [Google Scholar] [CrossRef] [Green Version]
- Francisco, R.; Marques-da-Silva, D.; Brasil, S.; Pascoal, C.; dos Reis Ferreira, V.; Morava, E.; Jaeken, J. The Challenge of CDG Diagnosis. Mol. Genet. Metab. 2019, 126, 1–5. [Google Scholar] [CrossRef]
- Exome Aggregation Consortium; Lek, M.; Karczewski, K.J.; Minikel, E.V.; Samocha, K.E.; Banks, E.; Fennell, T.; O’Donnell-Luria, A.H.; Ware, J.S.; Hill, A.J.; et al. Analysis of Protein-Coding Genetic Variation in 60,706 Humans. Nature 2016, 536, 285–291. [Google Scholar] [CrossRef] [Green Version]
- Gudelj, I.; Lauc, G.; Pezer, M. Immunoglobulin G Glycosylation in Aging and Diseases. Cell. Immunol. 2018, 333, 65–79. [Google Scholar] [CrossRef]
- Li, C.-W.; Lim, S.-O.; Chung, E.M.; Kim, Y.-S.; Park, A.H.; Yao, J.; Cha, J.-H.; Xia, W.; Chan, L.-C.; Kim, T.; et al. Eradication of Triple-Negative Breast Cancer Cells by Targeting Glycosylated PD-L1. Cancer Cell 2018, 33, 187–201.e10. [Google Scholar] [CrossRef] [Green Version]
- Sasatomi, T.; Suefuji, Y.; Matsunaga, K.; Yamana, H.; Miyagi, Y.; Araki, Y.; Ogata, Y.; Itoh, K.; Shirouzu, K. Expression of Tumor Rejection Antigens in Colorectal Carcinomas. Cancer 2002, 94, 1636–1641. [Google Scholar] [CrossRef]
- Chang, I.J.; He, M.; Lam, C.T. Congenital Disorders of Glycosylation. Ann. Transl. Med. 2018, 6, 477. [Google Scholar] [CrossRef] [PubMed]
- Thiel, C.; Lübke, T.; Matthijs, G.; von Figura, K.; Körner, C. Targeted Disruption of the Mouse Phosphomannomutase 2 Gene Causes Early Embryonic Lethality. Mol. Cell. Biol. 2006, 26, 5615–5620. [Google Scholar] [CrossRef] [PubMed] [Green Version]
- Chan, B.; Clasquin, M.; Smolen, G.A.; Histen, G.; Powe, J.; Chen, Y.; Lin, Z.; Lu, C.; Liu, Y.; Cang, Y.; et al. A Mouse Model of a Human Congenital Disorder of Glycosylation Caused by Loss of PMM2. Hum. Mol. Genet. 2016, 25, 2182–2193. [Google Scholar] [CrossRef] [PubMed]
- Yu, X.; Lin, J.; Zack, D.J.; Qian, J. Computational Analysis of Tissue-Specific Combinatorial Gene Regulation: Predicting Interaction between Transcription Factors in Human Tissues. Nucleic Acids Res. 2006, 34, 4925–4936. [Google Scholar] [CrossRef] [PubMed] [Green Version]
- Nairn, A.V.; Aoki, K.; dela Rosa, M.; Porterfield, M.; Lim, J.-M.; Kulik, M.; Pierce, J.M.; Wells, L.; Dalton, S.; Tiemeyer, M.; et al. Regulation of Glycan Structures in Murine Embryonic Stem Cells: Combined Transcript Profiling of Glycan-Related Genes and Glycan Structural Analysis. J. Biol. Chem. 2012, 287, 37835–37856. [Google Scholar] [CrossRef] [Green Version]
- Yamakawa, N.; Vanbeselaere, J.; Chang, L.-Y.; Yu, S.-Y.; Ducrocq, L.; Harduin-Lepers, A.; Kurata, J.; Aoki-Kinoshita, K.F.; Sato, C.; Khoo, K.-H.; et al. Systems Glycomics of Adult Zebrafish Identifies Organ-Specific Sialylation and Glycosylation Patterns. Nat. Commun. 2018, 9, 4647. [Google Scholar] [CrossRef]
- Williams, S.E.; Noel, M.; Lehoux, S.; Cetinbas, M.; Xavier, R.J.; Sadreyev, R.I.; Scolnick, E.M.; Smoller, J.W.; Cummings, R.D.; Mealer, R.G. Mammalian Brain Glycoproteins Exhibit Diminished Glycan Complexity Compared to Other Tissues. Nat. Commun. 2022, 13, 275. [Google Scholar] [CrossRef]
- Kearney, C.J.; Vervoort, S.J.; Ramsbottom, K.M.; Todorovski, I.; Lelliott, E.J.; Zethoven, M.; Pijpers, L.; Martin, B.P.; Semple, T.; Martelotto, L.; et al. SUGAR-Seq Enables Simultaneous Detection of Glycans, Epitopes, and the Transcriptome in Single Cells. Sci. Adv. 2021, 7, eabe3610. [Google Scholar] [CrossRef]
- Minoshima, F.; Ozaki, H.; Odaka, H.; Tateno, H. Integrated Analysis of Glycan and RNA in Single Cells. iScience 2021, 24, 102882. [Google Scholar] [CrossRef]
- Lee, J.; Ha, S.; Kim, M.; Kim, S.-W.; Yun, J.; Ozcan, S.; Hwang, H.; Ji, I.J.; Yin, D.; Webster, M.J.; et al. Spatial and Temporal Diversity of Glycome Expression in Mammalian Brain. Proc. Natl. Acad. Sci. USA 2020, 117, 28743–28753. [Google Scholar] [CrossRef]
- Kudelka, M.R.; Stowell, S.R.; Cummings, R.D.; Neish, A.S. Intestinal Epithelial Glycosylation in Homeostasis and Gut Microbiota Interactions in IBD. Nat. Rev. Gastroenterol. Hepatol. 2020, 17, 597–617. [Google Scholar] [CrossRef]
- Bergstrom, K.S.B.; Xia, L. Mucin-Type O-Glycans and Their Roles in Intestinal Homeostasis. Glycobiology 2013, 23, 1026–1037. [Google Scholar] [CrossRef] [PubMed]
- Schjoldager, K.T.; Narimatsu, Y.; Joshi, H.J.; Clausen, H. Global View of Human Protein Glycosylation Pathways and Functions. Nat. Rev. Mol. Cell Biol. 2020, 21, 729–749. [Google Scholar] [CrossRef] [PubMed]
- Niccoli, T.; Partridge, L. Ageing as a Risk Factor for Disease. Curr. Biol. 2012, 22, R741–R752. [Google Scholar] [CrossRef] [Green Version]
- Vanhooren, V.; Dewaele, S.; Libert, C.; Engelborghs, S.; De Deyn, P.P.; Toussaint, O.; Debacq-Chainiaux, F.; Poulain, M.; Glupczynski, Y.; Franceschi, C.; et al. Serum N-Glycan Profile Shift during Human Ageing. Exp. Gerontol. 2010, 45, 738–743. [Google Scholar] [CrossRef] [Green Version]
- Gudelj, I.; Keser, T.; Vučković, F.; Škaro, V.; Goreta, S.Š.; Pavić, T.; Dumić, J.; Primorac, D.; Lauc, G.; Gornik, O. Estimation of Human Age Using N-Glycan Profiles from Bloodstains. Int. J. Legal Med. 2015, 129, 955–961. [Google Scholar] [CrossRef] [Green Version]
- Horvath, S. DNA Methylation Age of Human Tissues and Cell Types. Genome Biol. 2013, 14, R115. [Google Scholar] [CrossRef] [PubMed] [Green Version]
- Schneider, J.S. Altered Expression of Genes Involved in Ganglioside Biosynthesis in Substantia Nigra Neurons in Parkinson’s Disease. PLoS ONE 2018, 13, e0199189. [Google Scholar] [CrossRef]
- Waldera Lupa, D.M.; Kalfalah, F.; Safferling, K.; Boukamp, P.; Poschmann, G.; Volpi, E.; Götz-Rösch, C.; Bernerd, F.; Haag, L.; Huebenthal, U.; et al. Characterization of Skin Aging–Associated Secreted Proteins (SAASP) Produced by Dermal Fibroblasts Isolated from Intrinsically Aged Human Skin. J. Investig. Dermatol. 2015, 135, 1954–1968. [Google Scholar] [CrossRef] [Green Version]
- Paton, B.; Suarez, M.; Herrero, P.; Canela, N. Glycosylation Biomarkers Associated with Age-Related Diseases and Current Methods for Glycan Analysis. Int. J. Mol. Sci. 2021, 22, 5788. [Google Scholar] [CrossRef]
- Joshi, H.J.; Narimatsu, Y.; Schjoldager, K.T.; Tytgat, H.L.P.; Aebi, M.; Clausen, H.; Halim, A. SnapShot: O-Glycosylation Pathways across Kingdoms. Cell 2018, 172, 632–632.e2. [Google Scholar] [CrossRef] [PubMed]
- Smith, J.C.; Sheltzer, J.M. Systematic Identification of Mutations and Copy Number Alterations Associated with Cancer Patient Prognosis. eLife 2018, 7, e39217. [Google Scholar] [CrossRef]
- Ashkani, J.; Naidoo, K.J. Glycosyltransferase Gene Expression Profiles Classify Cancer Types and Propose Prognostic Subtypes. Sci. Rep. 2016, 6, 26451. [Google Scholar] [CrossRef] [PubMed] [Green Version]
- Costa, A.F.; Campos, D.; Reis, C.A.; Gomes, C. Targeting Glycosylation: A New Road for Cancer Drug Discovery. Trends Cancer 2020, 6, 757–766. [Google Scholar] [CrossRef]
- Silva, M.; Silva, Z.; Marques, G.; Ferro, T.; Gonçalves, M.; Monteiro, M.; van Vliet, S.J.; Mohr, E.; Lino, A.C.; Fernandes, A.R.; et al. Sialic Acid Removal from Dendritic Cells Improves Antigen Cross-Presentation and Boosts Anti-Tumor Immune Responses. Oncotarget 2016, 7, 41053. [Google Scholar] [CrossRef] [PubMed] [Green Version]
- Silva, Z.; Ferro, T.; Almeida, D.; Soares, H.; Ferreira, J.A.; Deschepper, F.M.; Hensbergen, P.J.; Pirro, M.; van Vliet, S.J.; Springer, S.; et al. MHC Class I Stability Is Modulated by Cell Surface Sialylation in Human Dendritic Cells. Pharmaceutics 2020, 12, 249. [Google Scholar] [CrossRef] [PubMed] [Green Version]

Publisher’s Note: MDPI stays neutral with regard to jurisdictional claims in published maps and institutional affiliations. |
© 2022 by the authors. Licensee MDPI, Basel, Switzerland. This article is an open access article distributed under the terms and conditions of the Creative Commons Attribution (CC BY) license (https://creativecommons.org/licenses/by/4.0/).
Share and Cite
Sobral, D.; Francisco, R.; Duro, L.; Videira, P.A.; Grosso, A.R. Concerted Regulation of Glycosylation Factors Sustains Tissue Identity and Function. Biomedicines 2022, 10, 1805. https://doi.org/10.3390/biomedicines10081805
Sobral D, Francisco R, Duro L, Videira PA, Grosso AR. Concerted Regulation of Glycosylation Factors Sustains Tissue Identity and Function. Biomedicines. 2022; 10(8):1805. https://doi.org/10.3390/biomedicines10081805
Chicago/Turabian StyleSobral, Daniel, Rita Francisco, Laura Duro, Paula Alexandra Videira, and Ana Rita Grosso. 2022. "Concerted Regulation of Glycosylation Factors Sustains Tissue Identity and Function" Biomedicines 10, no. 8: 1805. https://doi.org/10.3390/biomedicines10081805
APA StyleSobral, D., Francisco, R., Duro, L., Videira, P. A., & Grosso, A. R. (2022). Concerted Regulation of Glycosylation Factors Sustains Tissue Identity and Function. Biomedicines, 10(8), 1805. https://doi.org/10.3390/biomedicines10081805