Article

Estimating the Prevalence of De Novo Monogenic Neurodevelopmental Disorders from Large Cohort Studies

by
Madelyn A. Gillentine
1,*,
Tianyun Wang
2,3 and
Evan E. Eichler
4,5
1
Department of Laboratories, Seattle Children’s Hospital, Seattle, WA 98105, USA
2
Department of Medical Genetics, Center for Medical Genetics, School of Basic Medical Sciences, Peking University Health Science Center, Beijing 100191, China
3
Key Laboratory for Neuroscience, Neuroscience Research Institute, Peking University, Ministry of Education of China & National Health Commission of China, Beijing 100191, China
4
Department of Genome Sciences, University of Washington School of Medicine, Seattle, WA 98105, USA
5
Howard Hughes Medical Institute, University of Washington, Seattle, WA 98195, USA
*
Author to whom correspondence should be addressed.
Biomedicines 2022, 10(11), 2865; https://doi.org/10.3390/biomedicines10112865
Submission received: 8 August 2022 / Revised: 27 September 2022 / Accepted: 28 October 2022 / Published: 9 November 2022

Abstract

:
Rare diseases impact up to 400 million individuals globally. Of the thousands of known rare diseases, many are rare neurodevelopmental disorders (RNDDs) impacting children. RNDDs have proven to be difficult to assess epidemiologically for several reasons. The rarity of them makes it difficult to observe them in the population, there is clinical overlap among many disorders, making it difficult to assess the prevalence without genetic testing, and data have yet to be available to have accurate counts of cases. Here, we utilized large sequencing cohorts of individuals with rare, de novo monogenic disorders to estimate the prevalence of variation in over 11,000 genes among cohorts with developmental delay, autism spectrum disorder, and/or epilepsy. We found that the prevalence of many RNDDs is positively correlated to the previously estimated incidence. We identified the most often mutated genes among neurodevelopmental disorders broadly, as well as developmental delay and autism spectrum disorder independently. Finally, we assessed if social media group member numbers may be a valuable way to estimate prevalence. These data are critical for individuals and families impacted by these RNDDs, clinicians and geneticists in their understanding of how common diseases are, and for researchers to potentially prioritize research into particular genes or gene sets.

1. Introduction

Rare diseases, in particular rare neurodevelopmental disorders (RNDDs), have proven to be challenging to understand epidemiologically. There are several definitions of “rare disease” that vary globally [1,2]. The current definition of a rare disease in the United States is a disease that impacts fewer than 200,000 individuals, or approximately 86 per 100,000 individuals at the time the American Orphan Drug Act was passed in 1983. Other global definitions range from 5 to 76 per 100,000 individuals. Overall, an estimated 3.5–5.9% of the global population has a rare disease, many of which are RNDDs mostly diagnosed in early childhood [3].
Neurodevelopmental disorders (NDDs), impacting up to 17% of the population, are a clinically and genetically heterogenous group of diagnoses [4]. NDDs as a whole are not rare; but each individual RNDD with known genetic cause only accounts for 1% or less of NDD cases. Many studies have shown that de novo variants (DNVs) are key contributors to such disorders [5,6,7,8,9]. The prevalence of these disorders is key for families looking for community, researchers, clinicians, and in pharmaceutical development [10].
Due to the scarcity of these RNDDs, with variable expressivity and incomplete penetrance, traditional epidemiological methods are challenging to assess. Additionally, many monogenic RNDDs share clinical features or lack pathognomonic features, making it difficult to identify them without genetic testing. Another challenge is the barriers to genetic testing resulting in underdiagnoses of many RNDDs, which leave patients uncounted.
Multiple approaches have been taken to understand the prevalence and/or incidence of RNDDs. Clinical data have been utilized for deletion/duplication syndromes mediated by nonallelic homologous recombination [11]. The number of published articles has also been used as a potential metric for prevalence [12]. For monogenic disorders, Nguengang Wakap et al. (2020) utilized point prevalence (number of cases in the population at one time/total population at the same time point), although not by gene but by inheritance pattern [3]. The incidence of de novo monogenic RNDDs has been elegantly estimated by López-Rivera et al. (2020), utilizing mutational constraint and probability of mutation to estimate based on mutation rate of individual genes [13,14]. Additionally, several resources report estimated prevalence, such as Orphanet, the National Organization for Rare Disorders (NORD), and others, although it is not always clear how these numbers are determined.
In order to assess the prevalence of autosomal dominant de novo monogenic RNDDs, we utilized the DNV data from multiple large cohorts of individuals with NDDs, specifically developmental delay/intellectual disability (DD/ID), autism spectrum disorder (ASD), and epilepsy. Cohorts include the Deciphering Developmental Disorders studies, Autism Sequencing Consortium, Simons Simplex Collection, SPARK, and MSSNG [5,6,7,15,16,17,18,19,20,21,22,23,24,25,26,27,28]. It is likely that these large studies of DNV provide the most comprehensive counts available of individuals with specific neurodevelopmental-related genetic alterations. From these cohorts (n = 50,377), we estimated the prevalence of variation of over 11,000 genes with reported variation in NDDs among the general population, which is positively correlated to the previously estimated incidence. We also identified the most often mutated genes among NDDs broadly, DD/ID and ASD. Finally, we determined that social media group member numbers may be a valuable way to estimate prevalence. These data are critical for individuals and families impacted by these rare disorders, clinicians and geneticists in their understanding of how common diseases are, and researchers to potentially prioritize research into particular genes or gene sets.

2. Methods

2.1. Cohorts and Samples

Published data were utilized from genome and exome studies (Table S1). Cohorts included studies focusing on NDDs (n = 50,377), ASD (n = 16,125), DD/ID (n = 31,191), and epilepsy (n = 1389). Utilizing published data, we avoided double counting probands that were in multiple studies to the best of our ability [26]. A subset of variants was Sanger validated in their original studies with greater than 90% of variants being confirmed, suggesting that any false positives on prevalence estimates would be negligible. Phenotypic and diagnostic information varies by cohort but typically included ASD diagnoses by both the ADOS and ADI-R, cognitive testing, Diagnostic and Statistical Manual of Mental Disorders (DSM) diagnoses (mostly DSM-V, although some studies were performed before its release in 2013), and basic medical screening (Table S1) [29,30,31,32,33,34,35,36,37,38,39,40,41,42,43,44,45].

2.2. Prevalence Estimation

Prevalence information for ASD, DD, and epilepsy was used from Zablotsky and Black (2020) to comprise our NDD prevalence (Table 1) [4]. While NDDs as a whole affect 17% of 3- to 17-year-old children in the US, we focused on those that were well represented in our de novo NDD cohort. Coding, nonsynonymous variant counts were computed from each study (Tables S3–S6). The number of variants in each gene was normalized by the observed/expected values for each type of variant obtained from gnomAD v2.1.1 (Table S3). Genes with negative values resulting from normalization or no constraint metrics available were excluded. The proportion of cases in our combined cohort was multiplied by the estimated prevalence of RNDDs and extrapolated to the prevalence in 100,000 individuals.
Estimates were performed for NDDs, DD/ID, and ASD independently. The number of probands for epilepsy was dramatically lower than DD/ID and ASD; thus, this was not calculated separately due to an inaccurate representation of cases of epilepsy. Variants were also separated by variant type: all DNVs, de novo likely gene disrupting (dnLGD) variants, de novo missense (dnMIS) variants, and de novo severe missense variants with a CADD score greater than or equal to 30 (dnMIS30). Candidate NDD genes were assessed separately and determined by combining statistically significant genes from multiple large cohort studies (n = 468) [7,8,9,26] (Table S2).

2.3. Comparison to Previous Incidence Estimates

Our estimates were compared to birth incidence rates from López-Rivera et al. (2020) using Pearson’s correlations in R Studio (2022.02.2-485, R version 4.2.0). Correlation analyses were performed in R for the gene level and cohort level. For the gene level, the number of DNVs was rounded to the nearest integer. Then, Fisher exact tests between genes that were reported in both our cohort and in that of López-Rivera et al. (2020) were performed in R with Bonferroni correction accounting for all genes (n = 20,000) and number of probands tested (n = 50,377). The 11,461 genes analyzed all had DNVs in our cohort, while the remaining genes in the genome did not in the data used. As previous estimates were not calculated by phenotype, our analysis was only performed for the total NDD cohort.

2.4. Comparison to Social Media Group Numbers for Top NDD Genes

We searched Facebook for each gene name and/or known disorder for the top 500 genes as well as any gene that had an OMIM disease entry (n = 294 genes with Facebook groups, Table S3). The number of members in each group was compared to the estimated prevalence using Pearson’s correlations.

3. Results

3.1. Prevalence Estimates for All NDDs

We assessed the number of cases in our total NDD cohort for each gene with at least one variant. The number of variants was normalized by observed/expected counts obtained from gnomAD v2.1.1 for dnLGD and dnMIS variants. The dnLGD and dnMIS variants were summed to estimate all DNV prevalence. Utilizing the prevalence estimates from Zablotsky and Black (2020), we calculated prevalence among individuals with NDDs and the prevalence in the general population.
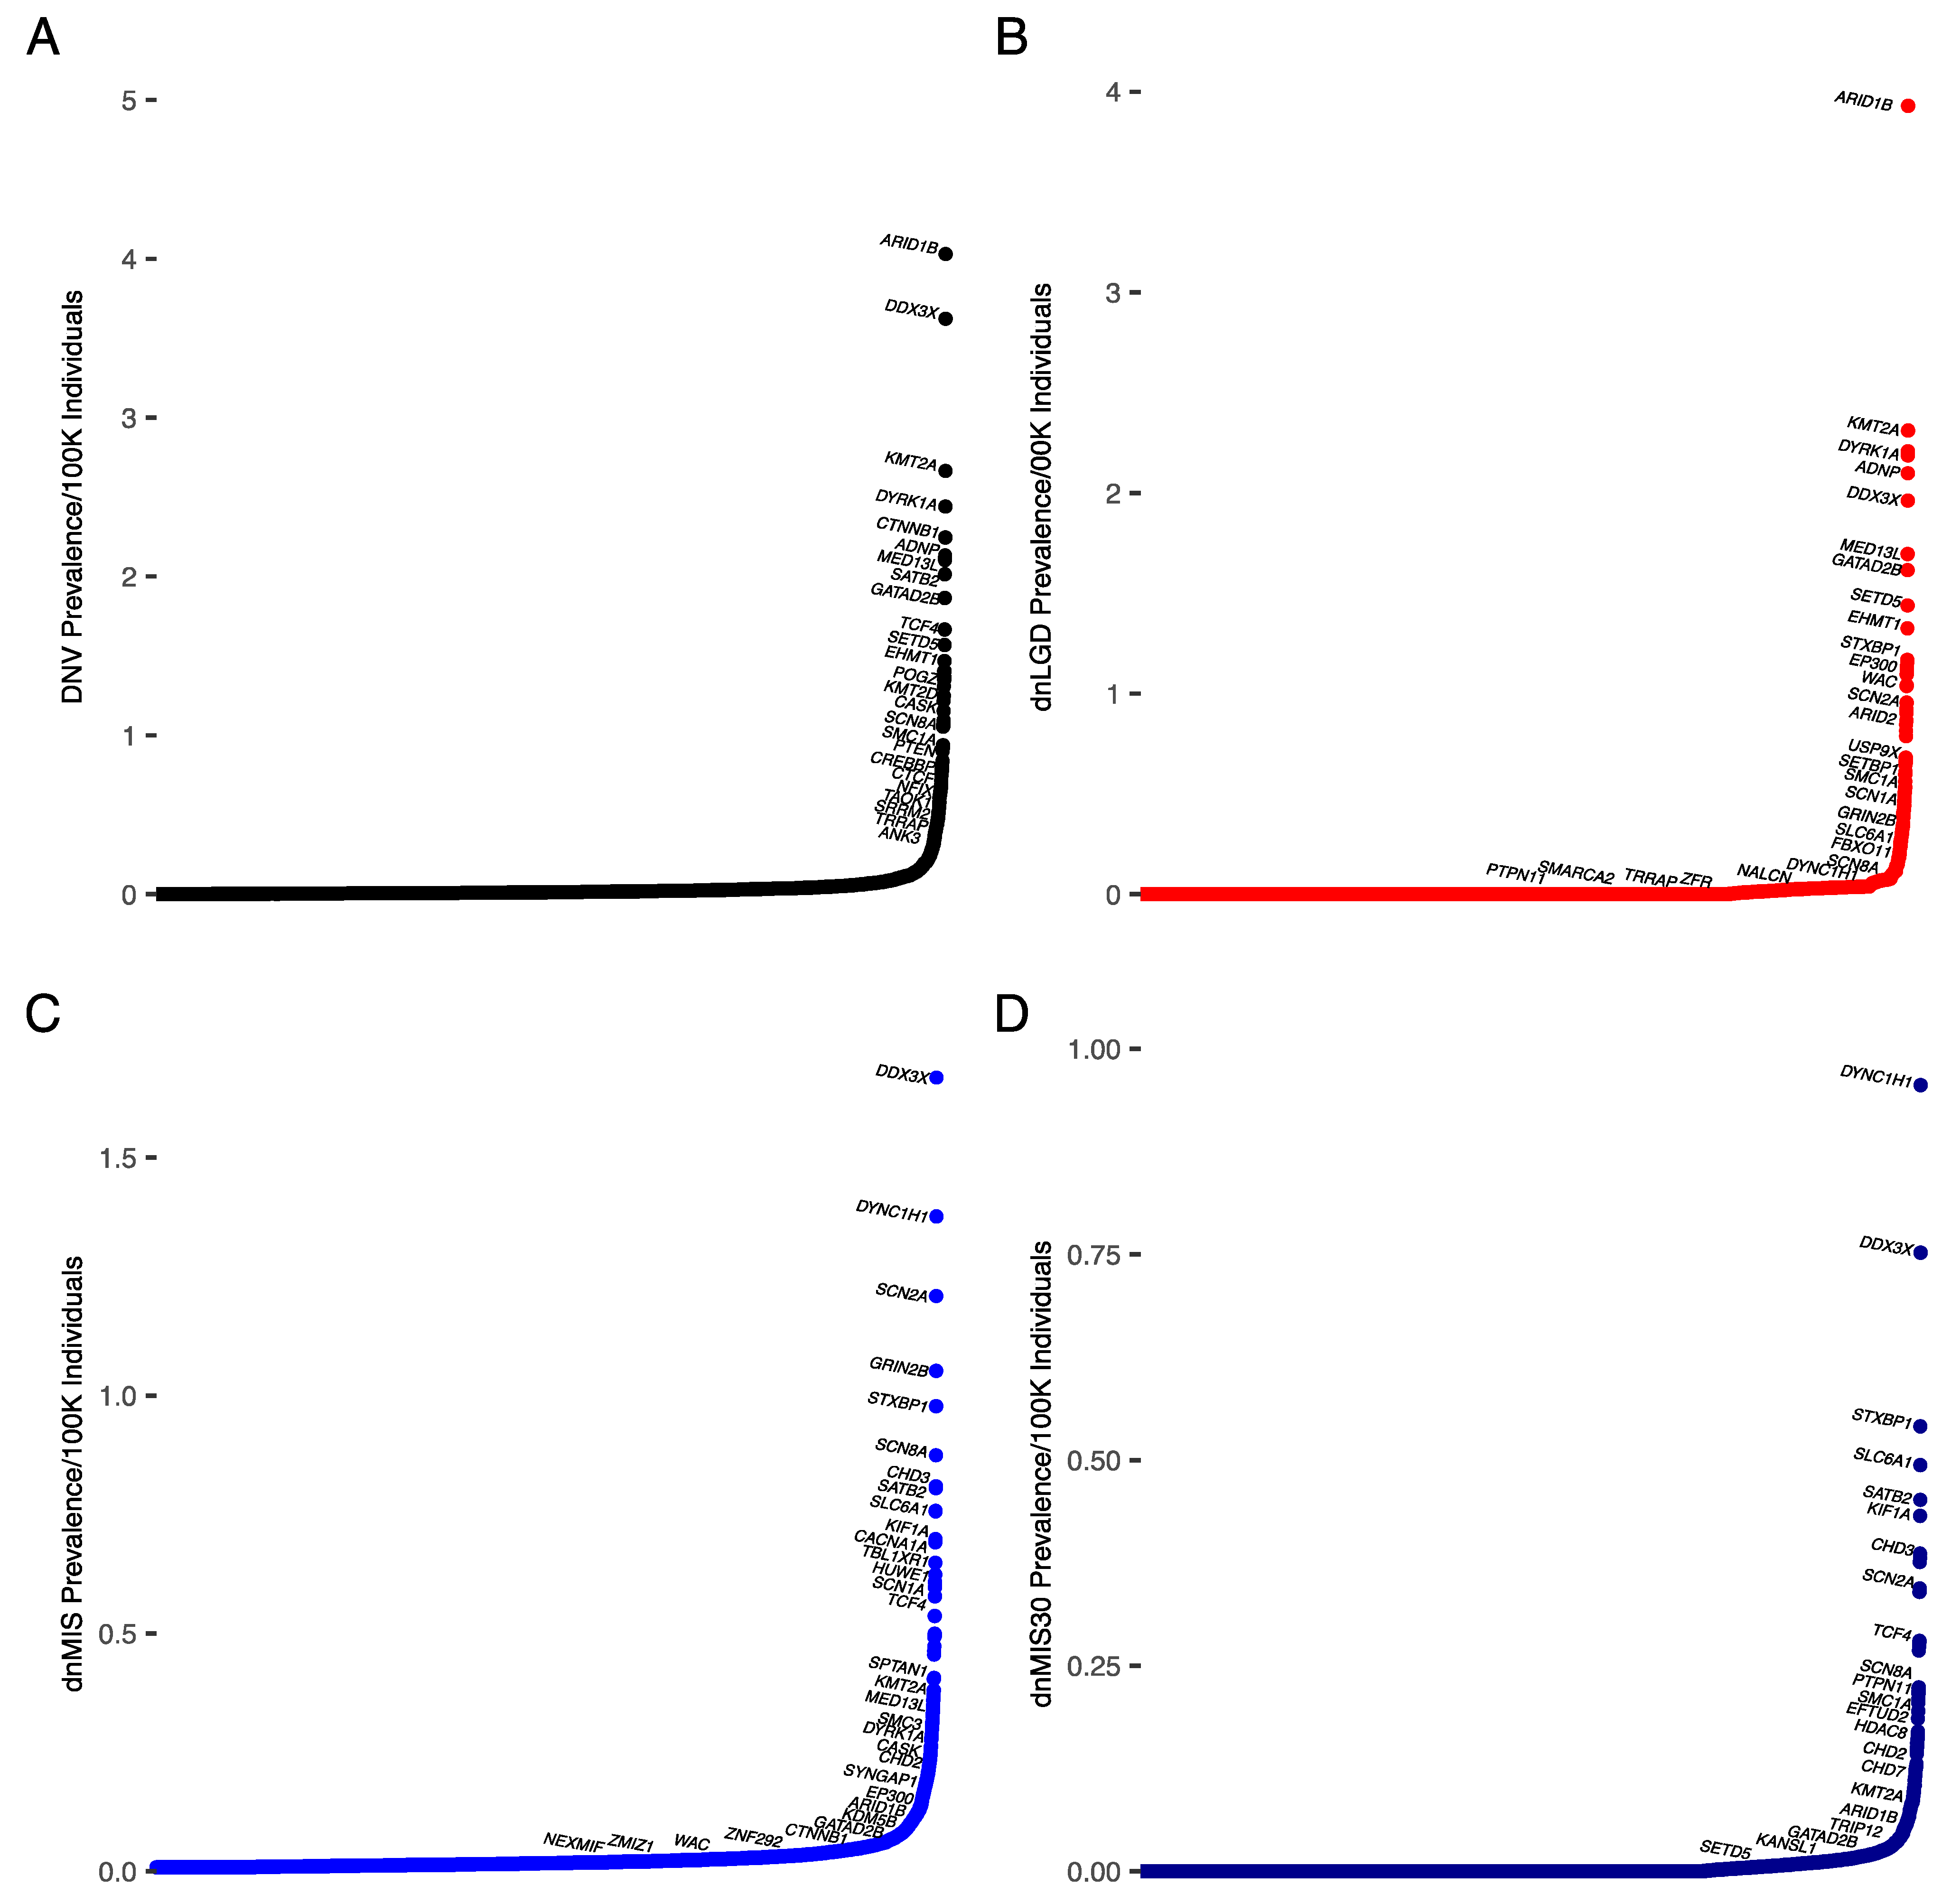
All genes examined met the criteria for rare disease. The most often mutated gene in our NDD cohort was ARID1B, accounting for 0.3% of all DNVs as well as the highest proportion of dnLGD variants (dnLGD = 0.25%, dnMIS = 0.05%, dnMIS30 = 0.02%) (Figure 1A,B, Table 2 and Table S3). This resulted in a prevalence of ARID1B variants of 11.1/100,000 individuals (95% CI: 9.9–12.3/100,000 individuals; 1/9009 individuals (95% CI: 1/10,136–8109 individuals)). An ARID1B-related disorder is typically due to loss-of-function variants; so, the dnLGD prevalence may be more accurate (10.7/100,000 individuals; 95% CI: 9.5–11.9/100,000 individuals (1/9372 individuals; 95% CI: 1/10,543–8435 individuals)), although missense variants have been reported [46]. This estimate is similar to previous estimates (Table 3) [47].
The gene with the highest proportion of missense variants identified in our NDD cohort was DDX3X, accounting for 0.14% of all dnMIS variants (DNV = 0.3% dnLGD = 0.11%, dnMIS30 = 0.06%) (Figure 1C, Table 2 and Table S3). This resulted in a prevalence of DDX3X-related NDD of 9.3/100,000 individuals (95% CI: 8.2–9.2/100,000 individuals (1/10,798 individuals; 95% CI: 1/12,147–10,824)). Previous estimates of DDX3X-related NDD were 1–3% of DD/ID in females, suggesting this may be an under-ascertained group in our cohort, although our cohort also had individuals without DD/ID diagnoses [62]. The DYNC1H1 gene had the most severe missense variants (MIS30) in our NDD cohort, accounting for 0.1% of all variants (DNV = 0.16%, dnLGD = 0.1%, dnMIS = 0.16%) (Figure 1D, Table S3). While still rare, this suggests that DYNC1H1 variants may be under-recognized in NDD cohorts [63].

3.2. Prevalence Estimates for DD/ID

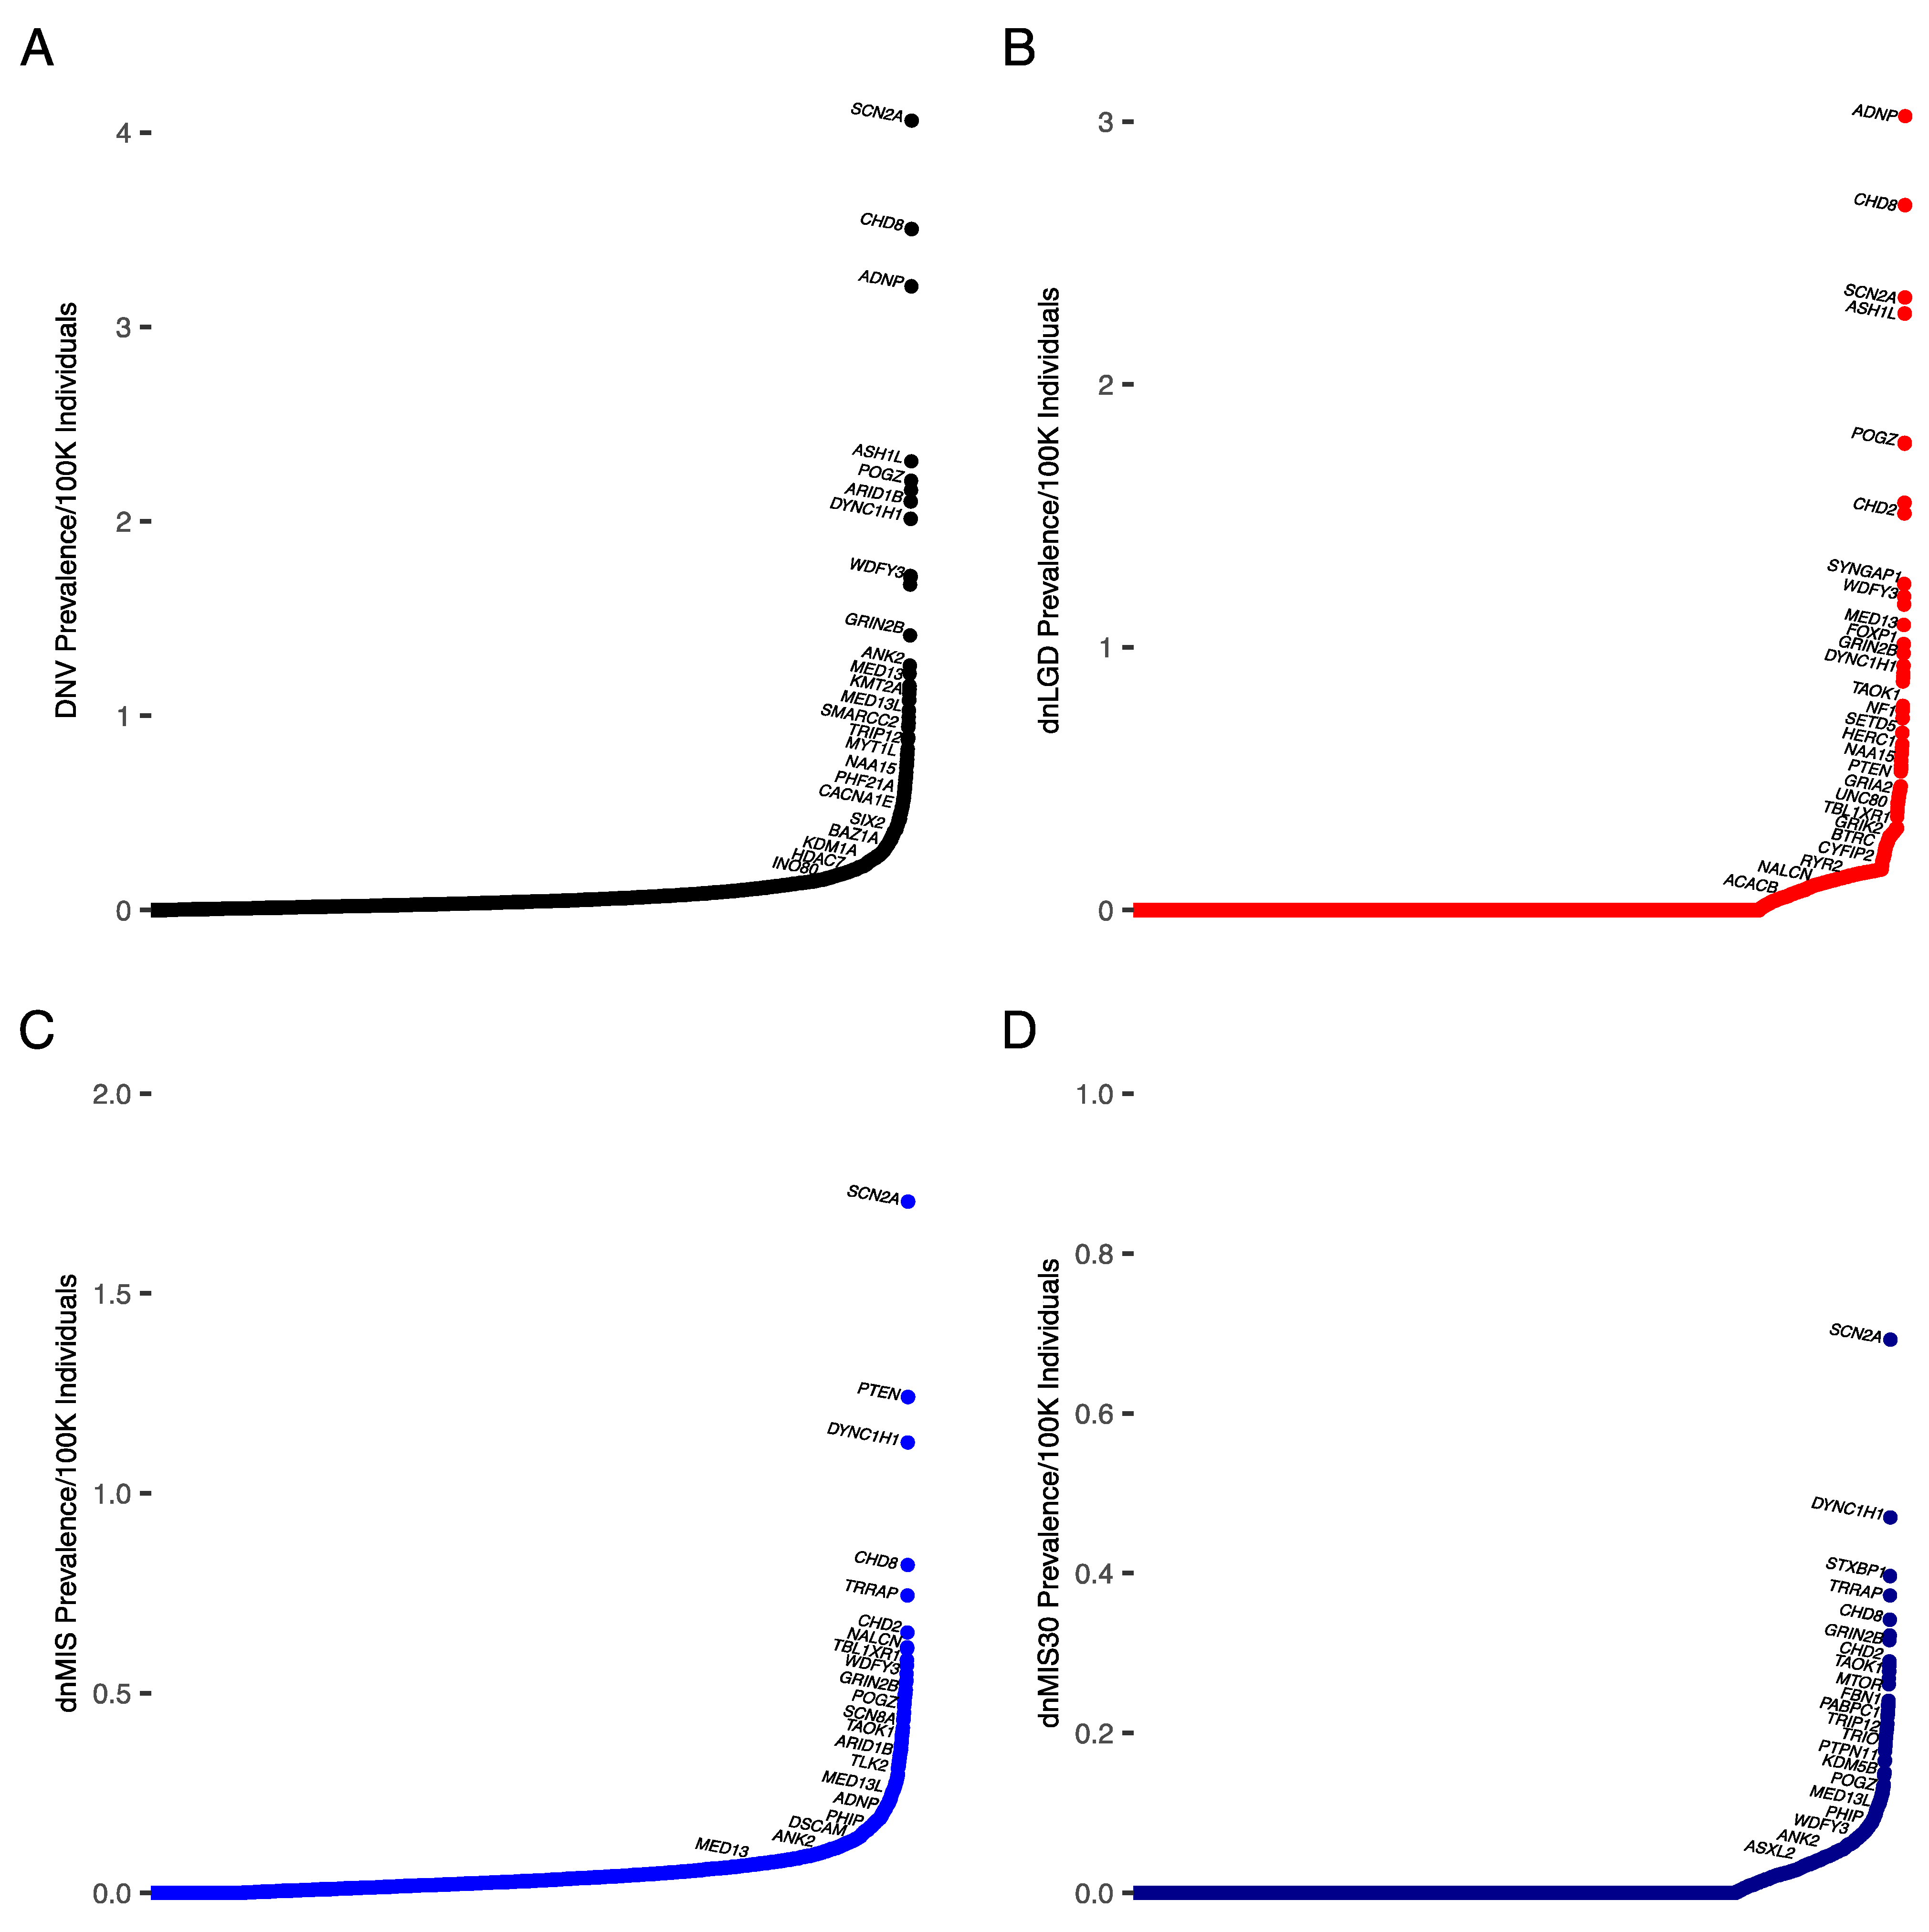
Cohorts in which the primary diagnosis was DD or ID were analyzed separately. In general, the pattern was similar to the entire NDD cohort, likely due to the larger DD sample size. The gene most often mutated in DD was ARID1B, accounting for 0.38% (dnLGD = 0.3%, dnMIS = 0.04%, dnMIS30 = 0.02%) of all DNVs (Figure 2A, Table 4 and Table S4). ARID1B was also the most frequently mutated in dnLGD variants (Figure 2B). This resulted in the frequency of an ARID1B-related disease with DD of 4/100,000 individuals (95% CI: 3.7–4.7/100,000 individuals (1/24,816 individuals; 95% CI: 1/27,013–21,225)).
The gene with the highest proportion of missense variants identified was DDX3X, accounting for 0.2% of all dnMIS variants (DNVs: 0.37%, dnLGD = 0.13 %, dnMIS = 0.2%, dnMIS30 = 0.09%) (Figure 2C, Table 4 and Table S4). DYNC1H1 had the highest percentage of severe missense (dnMIS30) variants (DNV: 0.2%, dnLGD: 0.003%, dnMIS: 0.2%, dnMIS30: 0.13%). This resulted in a prevalence of DDX3X-related NDD with DD of 3.6/100,000 individuals (95% CI: 3.5–4.4/100,000 individuals (1/27,610 individuals; 95% CI: 1/28,916–22,720). DYNC1H1 had the most severe missense variants in our DD cohort, accounting for 0.13% of all variants (DNV = 0.2%, dnLGD = 0.003%, dnMIS = 0.05%) (Figure 2D).

3.3. Prevalence Estimates for ASD

Cohorts in which the primary diagnosis was ASD were analyzed separately. Notably, most genes had similar variant numbers between the DD and ASD cohorts, but not necessarily the same ranking. The gene most often mutated in ASD was SCN2A, accounting for 0.22% of all DNVs (dnLGD = 0.01%, dnMIS = 0.12%, dnMIS30 = 0.5%) (Figure 3A, Table 5 and Table S5). SCN2A also accounted for the highest prevalence of dnMIS and dnMIS30 variants (Figure 3C,D). This is consistent with previous ASD meta-analyses [26]. This resulted in a prevalence of an SCN2A-related disorder with ASD of 4/100,000 individuals (95% CI: 3.6–4.4/100,000 individuals (1/24,626 individuals; 95% CI: 1/27,984–22,801)).
For dnLGD variants, the most often mutated gene in ASD was ADNP, accounting for 0.12% of all dnLGD variants (DNVs: 0.16%, dnMIS: 0.03%, dnMIS30: 0%) (Figure 3B). This resulted in a prevalence of an ADNP-related disorder with ASD of 3/100,000 individuals (95% CI: 2.7–3.3/100,000 individuals (1/33,107; 95% CI: 1/37,622–30,655)).

3.4. Comparison to Previous Estimates

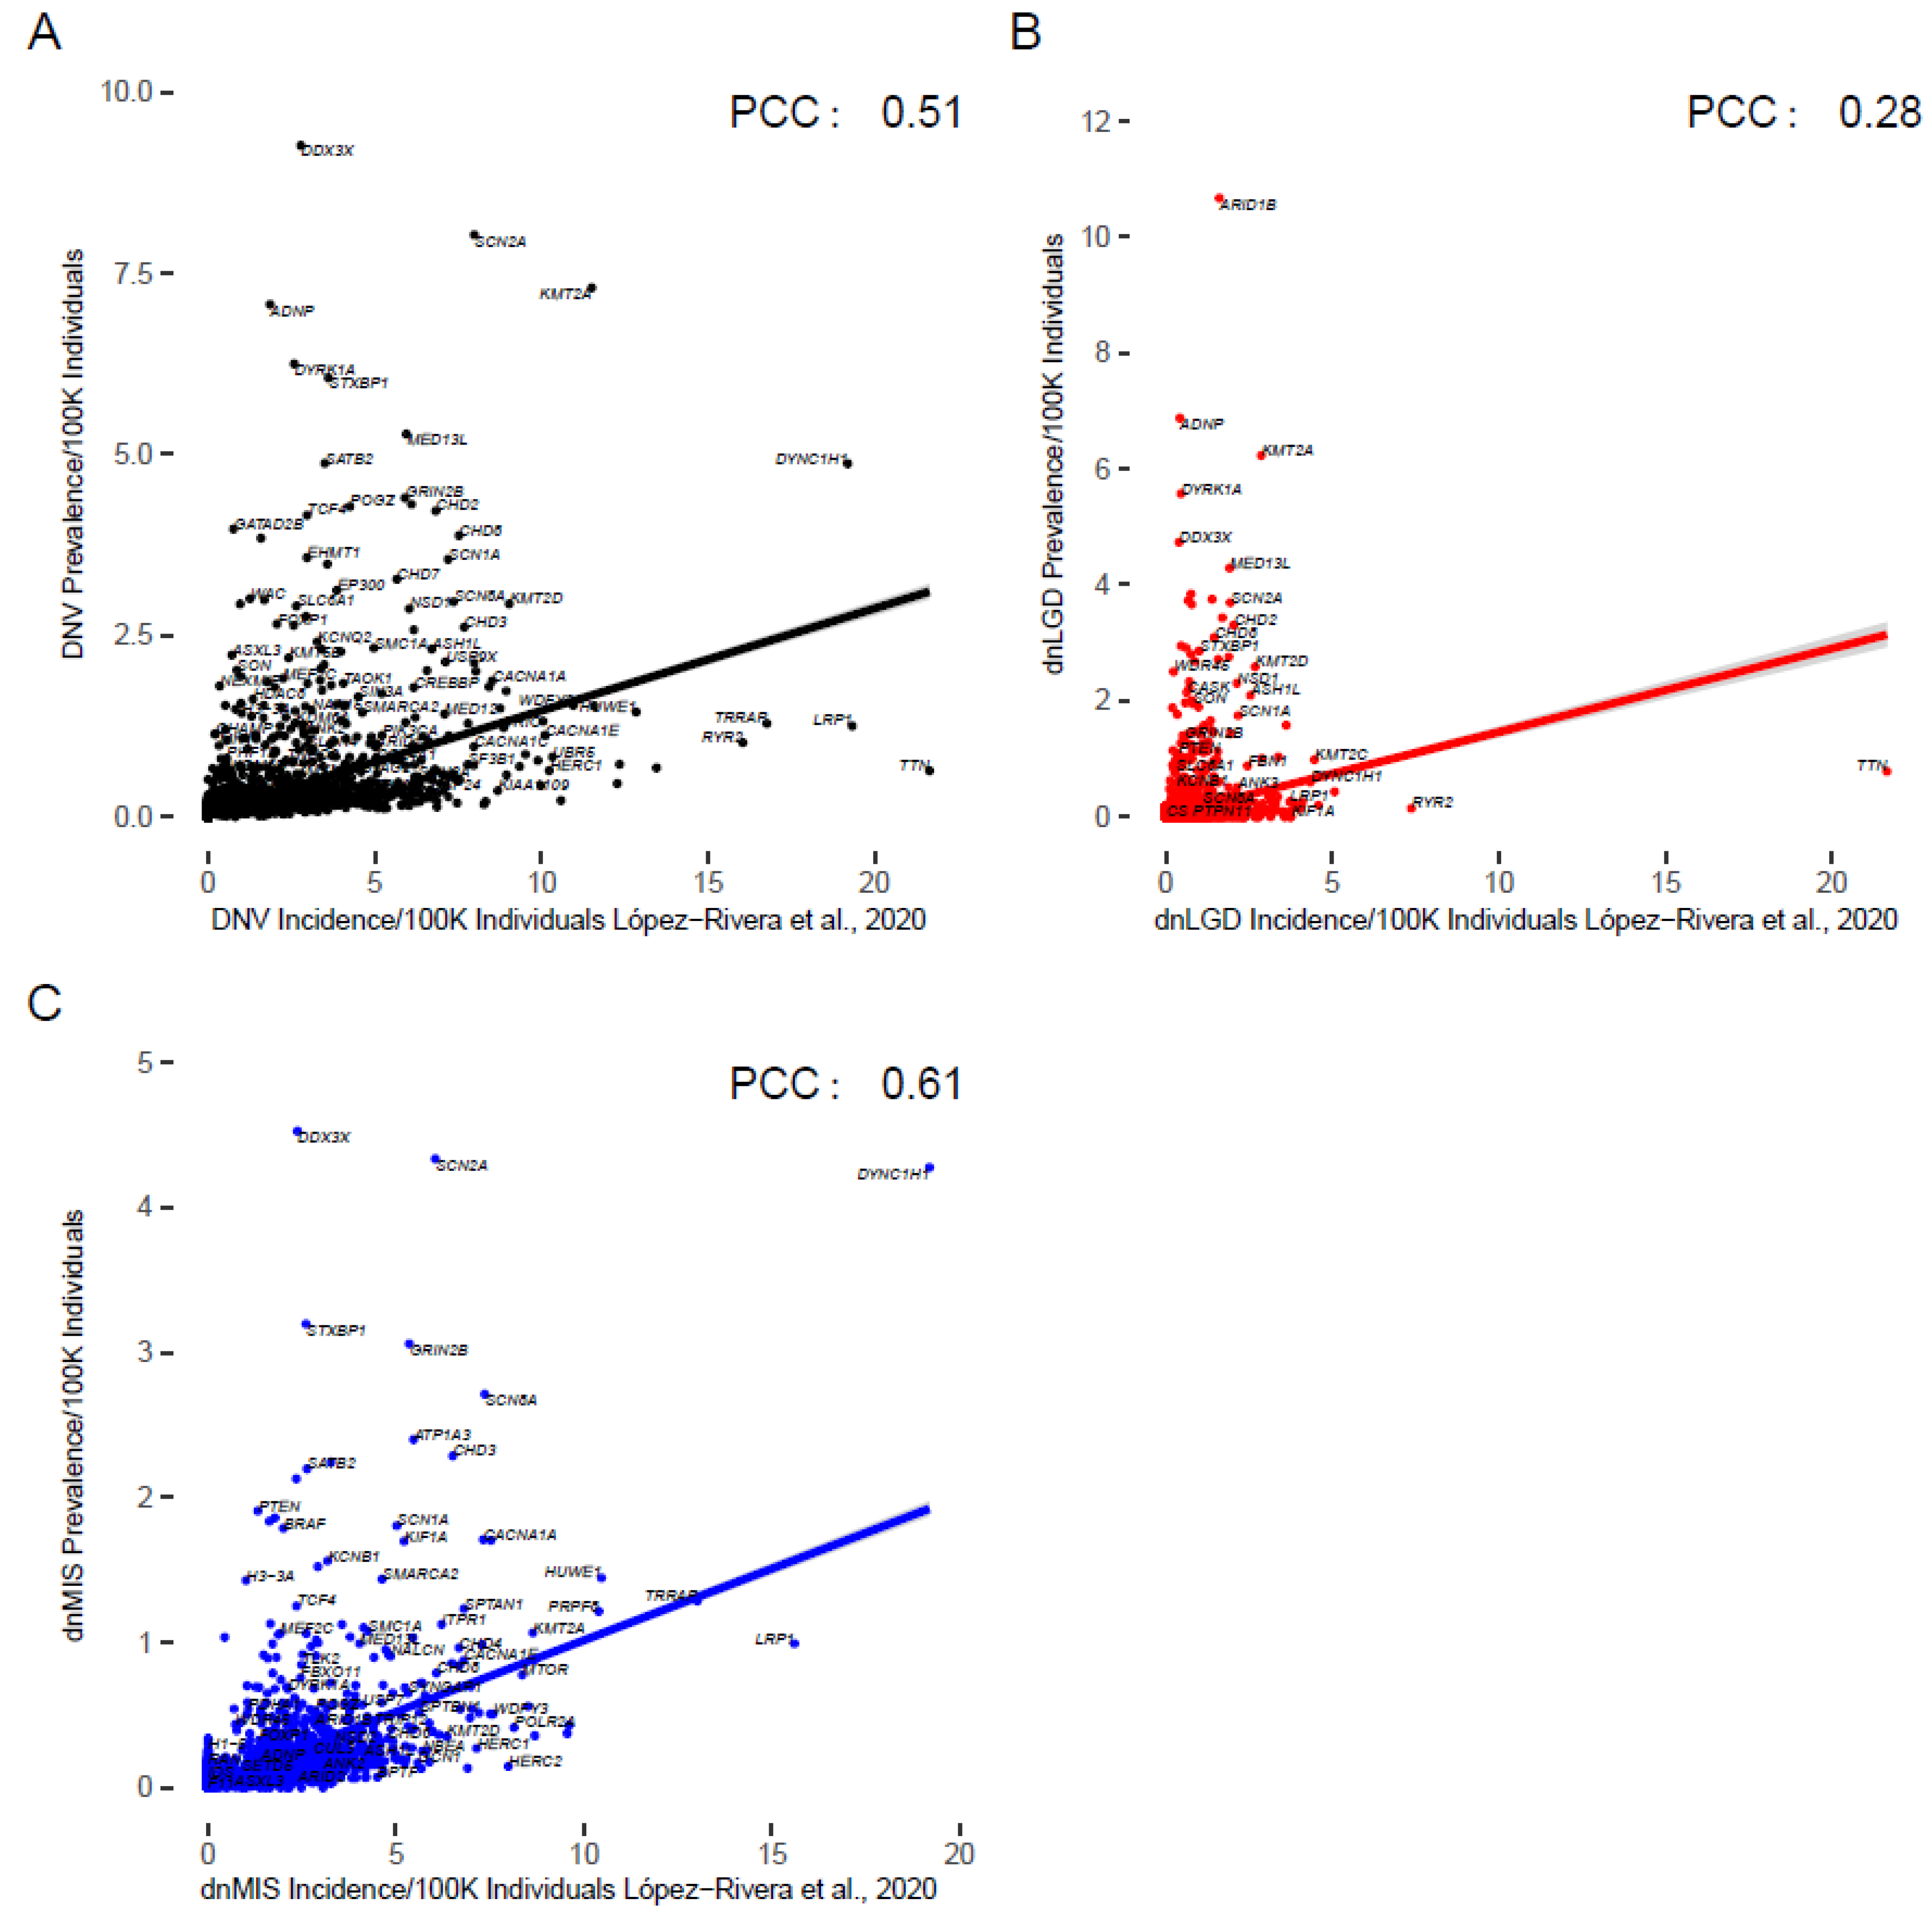
López-Rivera et al. (2020) estimated the incidence for 100 known monogenic disorders as well as the mutation incidence of over 1000 variation intolerant genes. We compared our estimates to theirs using correlation analysis. All variant categories’ prevalence was significantly positively correlated with previous incidence estimates (Figure 4, Tables S3–S6).
For all DNVs in NDDs, there was a significant positive pairwise correlation between the incidence from López-Rivera et al. (Pearson’s correlation coefficient (PCC) = 0.51 (95% CI: 0.5–0.53, p < 0.0001)) (Figure 4A). The dnLGD and dnMIS variants for all NDDs were also significantly positively correlated to the López-Rivera et al. estimates (PCC = 0.3: p > 0.0001 (95% CI: 0.26–0.3) and PCC = 0.6, p < 0.0001 (95% CI: 0.6–0.63)), respectively (Figure 4B,C). For all DNVs and dnMIS variants, NDD candidate genes’ prevalence was significantly correlated with previous incidence estimates (Figure S1, Table S6). No genes had a significantly different prevalence of mutation when using Bonferroni or FDR correction.
Most genes (n = 6681) had a higher prevalence than previous incidence estimates, as expected since prevalence accounts for all cases and incidence is cases in a year. However, some of these genes may also have been over-ascertained in our cohort (n = 468 NDD candidate genes). Genes with a lower prevalence than incidence (n = 1056; 249 NDD candidate genes) may have had lethal phenotypes or have been under-ascertained in our cohort. The proportion of NDD candidate genes among genes with lower prevalence than incidence (19%) was significantly higher than genes with higher prevalence than incidence (1.5%, Chi squared test, p = 0.0005, Figure S2). No genes showed significantly different mutation prevalence after Bonferroni correction.

3.5. Comparison to Social Media Groups

One potential estimate of how many individuals and families may be affected by these monogenic disorders is through their social media groups, i.e., how many members does a group have. This likely represents parents of children with rare disorders, and mostly mothers [10]. Over 4000 pediatric rare diseases have Facebook support groups. While membership is limited by computer and internet access, as well as interest in connecting with other families, this may be a reasonable metric for prevalence of these disorders.
To assess this, we found Facebook groups for the top 500 genes and any genes that had a named disorder (n = 294 genes with Facebook groups) (Table S3). Foundation pages were not included, and the group with the highest number of members was used. Gene and syndrome names were used to identify Facebook groups.
The number of Facebook group members was positively correlated with prevalence (PCC = 0.31) (Figure S1D). This moderate correlation suggests that there is an underdiagnosis for many of these monogenic de novo disorders. Interestingly, 66 of the 293 genes analyzed were not significantly enriched among NDD meta-analyses.

4. Discussion

The prevalence of most monogenic RNDDs has yet to be determined, and those with estimates are often anecdotal. An accurate estimate of the prevalence is important in understanding each disorder, which also has an impact on research funding and focus. Additionally, there is value in individuals being counted in rare disease [64]. Recently, it has been suggested that there are over 11,000 individual rare diseases, a number that is likely to increase. By identifying individuals with each disorder and determining their prevalence, we can better contribute to our knowledge of rare disease. In combination with cohort-based estimates, incidence estimates from mutation rates, and social media analysis, we hope to have a more comprehensive understanding of the prevalence of these rare disorders.
Utilizing the collection of probands from large sequencing studies that best represent multiple NDD-affected populations to date, we showed the prevalence of de novo variation among NDDs broadly, which, in our cohort, included DD/ID, ASD, epilepsy, and other diagnoses (Figure 1). Our results showed that while most monogenic RNDDs are likely underdiagnosed based on prevalence estimates, they also each account for fewer individuals with NDDs than previously thought. Often, it is reported that each NDD candidate gene accounts for less than 1% of the individuals diagnosed. Here, we showed that each gene accounts for even fewer individuals, with the highest percentage being 0.3% of individuals with NDDs for ARID1B (Figure 1A, Table 2 and Table S3). The GeneReviews for Coffin-Siris syndrome (CSS), of which ~37% of cases are due to ARID1B variants, reports that fewer than 200 individuals with CSS have been identified, although a literature and social media review suggests that this number is higher [65,66,67]. Our results suggest there is a considerable underdiagnosis of this syndrome, and this pattern is likely the same for other genetic RNDDs.
Previous studies have tried to use novel methods to determine the prevalence, including using mutation rates and number of papers published [12]. In a similar vein, we compared number of members in social media groups with prevalence estimates (Figure S1D). While not significant, there is a positive correlation between number of Facebook group members of a rare disease group and the prevalence of that rare disease. Those with higher estimated prevalence but lower numbers of Facebook group members may represent underdiagnosed or misdiagnosed disorders.
While positively correlated, there are notable differences between our prevalence estimates and previous prevalence or incidence estimates. To an extent, we expect prevalence to be higher than incidence, as incidence is the number of new cases per year, and this is the case for many genes. Several genes are overrepresented compared to their estimated incidence, suggesting possible ascertainment bias. In contrast, many genes have markedly decreased prevalence compared to the estimated incidence, which could be due to a range of factors. We only focused on DNVs, and some of these monogenic disorders have carrier parents, affected or unaffected. Given our DNV-only focus, our cohort likely will have higher accuracy for more severe conditions. We also assumed 100% penetrance for our calculations. It is likely that there are variants that are not fully penetrant or result in subclinical features; thus, those probands may not have been included in our cohort. We also did not consider mortality, which may decrease the prevalence, although most of these disorders are not perinatal lethal. However, the few disorders that are perinatal lethal, such as MECP2 variants in males, combined with decreased lifespan of individuals with NDDs (average age ~60 years of age) may contribute to the prevalence and be absent from our calculations [68]. Additionally, we only discerned dnLGD and dnMIS or dnMIS30 variants. This leads to some inaccuracy, as there are syndromes that are caused by neither of these variant types but were analyzed in our cohort. Some genes appear to have had a much higher prevalence in our cohort versus the incidence in López-Rivera et al.’s analysis but are skewed due to mutation mechanisms, such as PPM1D or ADNP, both of which are causative for disease by nonsense and frameshift variants in the penultimate exon that result in truncated proteins escaping nonsense mediated decay. Additionally, there are genes in both the López-Rivera et al., 2020, estimates and ours that are not pathogenic, such as TTN, that may skew our correlations, although our normalization with constraint measures aimed to avoid such issues. Furthermore, there are genes that we know to be pathogenic that may have better estimates based on mutation rate than our cohort due to the rarity of these syndromes. Such genes highlight our ascertainment bias, with disorders that have a higher frequency of ASD and/or DD/ID having better estimates. These include disorders such as Schaaf-Yang syndrome (MAGEL2), which had only one variant in our cohort, or HNRNPH2-related NDD, which had no variants in our cohort. Additionally, barriers to genetic testing likely impacted our cohort composition. Finally, we made the assumption that NDDs have similar prevalence globally, which is difficult to assess. While our estimates may reflect some ascertainment bias, these are still the most accurate estimates to date.
In addition to providing novel information for many RNDDs, this work also shows the values of exome or genome sequencing over panel analysis. While it is feasible to choose the top genes from our work for a panel, it is important to know that each of these affects 0.29% or less of individuals with NDDs. Thus, even with the top 100 genes, only 8.8% of potential RNDD diagnoses would be made. Even a panel of the top 500 genes would only have a diagnostic yield of <20%. In contrast, exome sequencing has an approximately 36% diagnostic yield and a higher yield for NDDs with comorbid conditions [69]. Our study supports the use of exome sequencing as a first-tier clinical diagnostic test for individuals with NDDs.
With this new approach to prevalence estimates, we hope that valuable information can be provided to families, clinicians, and groups developing potential therapeutics. Additionally, we show the value of large cohort studies in disease and emphasize the need for international collaboration. While these numbers are inherently in flux, we provide the most accurate prevalence estimates for many disorders to date.

Supplementary Materials

The following supporting information can be downloaded at https://www.mdpi.com/article/10.3390/biomedicines10112865/s1: Figure S1: Prevalence of DNVs in candidate NDD genes versus incidence estimates from [14], along with comparison to social media estimates; Figure S2: Fold difference between our prevalence estimates and López-Rivera et al.’s incidence estimates; Table S1: Cohorts and samples in study; Table S2: NDD genes (n = 468) as determined by multiple metanalyses studies; Table S3: Prevalence Estimates among NDD (n = 50,377). Zablotsky and Black prevalence: 4.5% (95% CI: 4–5%); Table S4: Prevalence Estimates among DD (n = 31,191). Zablotsky and Black prevalence: 1.2% (95% CI: 1.1–1.4%); Table S5: Prevalence Estimates among ASD (n = 16,125). Zablotsky and Black ASD prevalence = 2.5% (95% CI: 2.2–2.7%); Table S6: Pearson’s correlations and corrected p values for prevalence vs incidence.

Author Contributions

Conceptualization: M.A.G.; Methodology: M.A.G. and T.W.; Formal analysis: M.A.G.; Data curation: M.A.G.; Writing-original draft preparation: M.A.G.; Writing-review and editing: M.A.G., T.W. and E.E.E.; Visualization: M.A.G.; Supervision: E.E.E. All authors have read and agreed to the published version of the manuscript.

Funding

This work was supported, in part, by the Howard Hughes Medical Institute (HHMI). This work was also supported, in part, by the Fundamental Research Funds for the Central Universities starting fund (BMU2022RCZX038) to T.W. and E.E.E. is an investigator of the Howard Hughes Medical Institute (HHMI).

Data Availability Statement

The data presented in this study are available in the supplemental materials Tables S1–S6.

Acknowledgments

We thank all the families participating in the multiple studies from which we used data. We are grateful to all of the families at the participating SSC sites, as well as the principal investigators (A. Beaudet, R. Bernier, J. Constantino, E. Cook, E. Fombonne, D. Geschwind, R. Goin-Kochel, E. Hanson, D. Grice, A. Klin, D. Ledbetter, C. Lord, C. Martin, D. Martin, R. Maxim, J. Miles, O. Ousley, K. Pelphrey, B. Peterson, J. Piggot, C. Saulnier, M. State, W. Stone, J. Sutcliffe, C. Walsh, Z. Warren, and E. Wijsman). We appreciate access to SAGE family information, as well as TASC and the multiple TASC principal investigators (D. Grodberg, A. Kolevzon, L.Soorya, A. Tryfon, S. Brennan, G. Hughes, M. Law-Smith, F. Lombard, J. McGrath, P. Cali, S. Guter, W. McMahon, J. Miller, J. Gilbert, M. Pericak-Vance, E. Duketis, S. Schlitt, C. McDougle, D. Posey, J. Almedia, A. Nicolson, C. Correia, G. Crockett, J. Haines, M. Potter, and P. Farrar). We appreciate obtaining access to phenotypic data on SFARI Base for both SSC and SPARK samples, as well as SPARK exome data from the SPARK Consortium. Approved researchers can obtain the SSC population dataset described in this study (https://www.sfari.org/resource/resources/simons-simplex-collection/) by applying at https://base.sfari.org (accessed on 5 January 2022). We thank the DDD study, which presents independent research commissioned by the Health Innovation Challenge Fund (grant number HICF-1009-003), a parallel funding partnership between the Wellcome Trust and the Department of Health, and the Wellcome Trust Sanger Institute (grant number WT098051). The views expressed in this publication are those of the authors and not necessarily those of the Wellcome Trust or the Department of Health. The study has UK Research Ethics Committee approval (10/H0305/83 granted by the Cambridge South REC and GEN/284/12 granted by the Republic of Ireland REC). The research team acknowledges the support of the National Institute for Health Research, through the Comprehensive Clinical Research Network. We thank the researchers who generated data for all the other cohorts utilized. We thank the Autism Intervention Research Network on Physical Health (AIR-P) for early feedback on this work. E.E.E. is an investigator of the Howard Hughes Medical Institute. We also thank T. Brown for assistance in editing this manuscript. This article is subject to HHMI’s Open Access to Publications policy. HHMI lab heads have previously granted a nonexclusive CC BY 4.0 license to the public and a sublicensable license to HHMI in their research articles. Pursuant to those licenses, the author-accepted manuscript of this article can be made freely available under a CC BY 4.0 license immediately upon publication.

Conflicts of Interest

E.E.E. is a scientific advisory board (SAB) member of Variant Bio, Inc. (Seattle, WA, USA).

References

  1. Rare Disease Act of 2002. Available online: https://www.congress.gov/107/plaws/publ280/PLAW-107publ280.pdf (accessed on 19 May 2022).
  2. Moliner, A.M.; Waligora, J. The European Union Policy in the Field of Rare Diseases. Adv. Exp. Med. Biol. 2017, 1031, 561–587. [Google Scholar] [CrossRef]
  3. Nguengang Wakap, S.; Lambert, D.M.; Olry, A.; Rodwell, C.; Gueydan, C.; Lanneau, V.; Murphy, D.; Le Cam, Y.; Rath, A. Estimating Cumulative Point Prevalence of Rare Diseases: Analysis of the Orphanet Database. Eur. J. Hum. Genet. 2020, 28, 165–173. Available online: https://www.nature.com/articles/s41431-019-0508-0 (accessed on 24 May 2022). [CrossRef] [PubMed] [Green Version]
  4. Zablotsky, B.; Black, L.I. Prevalence of Children Aged 3–17 Years with Developmental Disabilities, by Urbanicity: United States, 2015–2018. Natl. Health Stat. Report 2020, 139, 1–7. [Google Scholar]
  5. Iossifov, I.; O’Roak, B.J.; Sanders, S.J.; Ronemus, M.; Krumm, N.; Levy, D.; Stessman, H.A.; Witherspoon, K.T.; Vives, L.; Patterson, K.E.; et al. The Contribution of de Novo Coding Mutations to Autism Spectrum Disorder. Nature 2014, 515, 216–221. [Google Scholar] [CrossRef] [PubMed] [Green Version]
  6. Krumm, N.; Turner, T.N.; Baker, C.; Vives, L.; Mohajeri, K.; Witherspoon, K.; Raja, A.; Coe, B.P.; Stessman, H.A.; He, Z.-X.; et al. Excess of Rare, Inherited Truncating Mutations in Autism. Nat. Genet. 2015, 47, 582–588. [Google Scholar] [CrossRef] [Green Version]
  7. Coe, B.P.; Stessman, H.A.F.; Sulovari, A.; Geisheker, M.R.; Bakken, T.E.; Lake, A.M.; Dougherty, J.D.; Lein, E.S.; Hormozdiari, F.; Bernier, R.A.; et al. Neurodevelopmental Disease Genes Implicated by de Novo Mutation and Copy Number Variation Morbidity. Nat. Genet. 2019, 51, 106–116. [Google Scholar] [CrossRef] [PubMed]
  8. Kaplanis, J.; Samocha, K.E.; Wiel, L.; Zhang, Z.; Arvai, K.J.; Eberhardt, R.Y.; Gallone, G.; Lelieveld, S.H.; Martin, H.C.; McRae, J.F.; et al. Evidence for 28 genetic disorders discovered by combining healthcare and research data. Nature 2020, 586, 757–762. [Google Scholar] [CrossRef]
  9. Satterstrom, F.K.; Kosmicki, J.A.; Wang, J.; Breen, M.S.; De Rubeis, S.; An, J.-Y.; Peng, M.; Collins, R.; Grove, J.; Klei, L.; et al. Large-Scale Exome Sequencing Study Implicates Both Developmental and Functional Changes in the Neurobiology of Autism. Cell 2020, 180, 568–584.e23. [Google Scholar] [CrossRef]
  10. Titgemeyer, S.C.; Schaaf, C.P. Facebook Support Groups for Pediatric Rare Diseases: Cross-Sectional Study to Investigate Opportunities, Limitations, and Privacy Concerns. JMIR Pediatr. Parent. 2022, 5, e31411. [Google Scholar] [CrossRef]
  11. Gillentine, M.A.; Lupo, P.J.; Stankiewicz, P.; Schaaf, C.P. An Estimation of the Prevalence of Genomic Disorders Using Chromosomal Microarray Data. J. Hum. Genet. 2018, 63, 795–801. [Google Scholar] [CrossRef]
  12. Shourick, J.; Wack, M.; Jannot, A.-S. Assessing Rare Diseases Prevalence Using Literature Quantification. Orphanet J. Rare Dis. 2021, 16, 139. [Google Scholar] [CrossRef]
  13. Samocha, K.E.; Robinson, E.B.; Sanders, S.J.; Stevens, C.; Sabo, A.; McGrath, L.M.; Kosmicki, J.A.; Rehnström, K.; Mallick, S.; Kirby, A.; et al. A Framework for the Interpretation of de Novo Mutation in Human Disease. Nat. Genet. 2014, 46, 944–950. [Google Scholar] [CrossRef]
  14. López-Rivera, J.A.; Pérez-Palma, E.; Symonds, J.; Lindy, A.S.; McKnight, D.A.; Leu, C.; Zuberi, S.; Brunklaus, A.; Møller, R.S.; Lal, D. A Catalogue of New Incidence Estimates of Monogenic Neurodevelopmental Disorders Caused by de Novo Variants. Brain 2020, 143, 1099–1105. [Google Scholar] [CrossRef] [Green Version]
  15. Wang, T.; Hoekzema, K.; Vecchio, D.; Wu, H.; Sulovari, A.; Coe, B.P.; Gillentine, M.A.; Wilfert, A.B.; Perez-Jurado, L.A.; Kvarnung, M.; et al. Large-Scale Targeted Sequencing Identifies Risk Genes for Neurodevelopmental Disorders. Nat. Commun. 2020, 11, 4932. [Google Scholar] [CrossRef]
  16. Yuen, C.R.K.; Merico, D.; Bookman, M.; Howe, L.J.; Thiruvahindrapuram, B.; Patel, R.V.; Whitney, J.; Deflaux, N.; Bingham, J.; Wang, Z.; et al. Whole Genome Sequencing Resource Identifies 18 New Candidate Genes for Autism Spectrum Disorder. Nat. Neurosci. 2017, 20, 602–611. [Google Scholar] [CrossRef]
  17. De Rubeis, S.; He, X.; Goldberg, A.P.; Poultney, C.S.; Samocha, K.; Cicek, A.E.; Kou, Y.; Liu, L.; Fromer, M.; Walker, S.; et al. Synaptic, Transcriptional and Chromatin Genes Disrupted in Autism. Nature 2014, 515, 209–215. [Google Scholar] [CrossRef] [Green Version]
  18. McRae, J.F.; Clayton, S.; Fitzgerald, T.W.; Kaplanis, J.; Prigmore, E.; Rajan, D.; Sifrim, A.; Aitken, S.; Akawi, N.; Alvi, M. Deciphering Developmental Disorders Study Prevalence and Architecture of de Novo Mutations in Developmental Disorders. Nature 2017, 542, 433–438. [Google Scholar] [CrossRef]
  19. Epi4K Consortium; Epilepsy Phenome/Genome Project; Allen, A.S.; Berkovic, S.F.; Cossette, P.; Delanty, N.; Dlugos, D.; Eichler, E.E.; Epstein, M.P.; Glauser, T.; et al. De Novo Mutations in Epileptic Encephalopathies. Nature 2013, 501, 217–221. [Google Scholar] [CrossRef] [PubMed] [Green Version]
  20. Guo, H.; Duyzend, M.H.; Coe, B.P.; Baker, C.; Hoekzema, K.; Gerdts, J.; Turner, T.N.; Zody, M.C.; Beighley, J.S.; Murali, S.C.; et al. Genome Sequencing Identifies Multiple Deleterious Variants in Autism Patients with More Severe Phenotypes. Genet. Med. 2019, 21, 1611–1620. [Google Scholar] [CrossRef] [PubMed]
  21. Lelieveld, S.H.; Reijnders, M.R.F.; Pfundt, R.; Yntema, H.G.; Kamsteeg, E.-J.; de Vries, P.; de Vries, B.B.A.; Willemsen, M.H.; Kleefstra, T.; Löhner, K.; et al. Meta-Analysis of 2,104 Trios Provides Support for 10 New Genes for Intellectual Disability. Nat. Neurosci. 2016, 19, 1194–1196. [Google Scholar] [CrossRef] [PubMed]
  22. Michaelson, J.J.; Shi, Y.; Gujral, M.; Zheng, H.; Malhotra, D.; Jin, X.; Jian, M.; Liu, G.; Greer, D.; Bhandari, A.; et al. Whole-Genome Sequencing in Autism Identifies Hot Spots for de Novo Germline Mutation. Cell 2012, 151, 1431–1442. [Google Scholar] [CrossRef] [PubMed]
  23. Rauch, A.; Wieczorek, D.; Graf, E.; Wieland, T.; Endele, S.; Schwarzmayr, T.; Albrecht, B.; Bartholdi, D.; Beygo, J.; Di Donato, N.; et al. Range of Genetic Mutations Associated with Severe Non-Syndromic Sporadic Intellectual Disability: An Exome Sequencing Study. Lancet 2012, 380, 1674–1682. [Google Scholar] [CrossRef]
  24. Takata, A.; Miyake, N.; Tsurusaki, Y.; Fukai, R.; Miyatake, S.; Koshimizu, E.; Kushima, I.; Okada, T.; Morikawa, M.; Uno, Y.; et al. Integrative Analyses of De Novo Mutations Provide Deeper Biological Insights into Autism Spectrum Disorder. Cell Rep. 2018, 22, 734–747. [Google Scholar] [CrossRef] [PubMed] [Green Version]
  25. Turner, T.N.; Coe, B.P.; Dickel, D.E.; Hoekzema, K.; Nelson, B.J.; Zody, M.C.; Kronenberg, Z.N.; Hormozdiari, F.; Raja, A.; Pennacchio, L.A.; et al. Genomic Patterns of De Novo Mutation in Simplex Autism. Cell 2017, 171, 710–722.e12. [Google Scholar] [CrossRef] [Green Version]
  26. Wang, T.; Kim, C.; Bakken, T.E.; Gillentine, M.A.; Henning, B.; Mao, Y.; Gilissen, C.; Consortium, T.S.; Nowakowski, T.J.; Eichler, E.E. Integrated Gene Analyses of de Novo Mutations from 46,612 Trios with Autism and Developmental Disorders. bioRxiv 2021. Available online: https://www.biorxiv.org/content/10.1101/2021.09.15.460398v1 (accessed on 6 May 2022).
  27. Buxbaum, J.D.; Bolshakova, N.; Brownfeld, J.M.; Anney, R.J.; Bender, P.; Bernier, R.; Cook, E.H.; Coon, H.; Cuccaro, M.; Freitag, C.M.; et al. The Autism Simplex Collection: An International, Expertly Phenotyped Autism Sample for Genetic and Phenotypic Analyses. Mol. Autism 2014, 5, 34. [Google Scholar] [CrossRef] [Green Version]
  28. Fischbach, G.D.; Lord, C. The Simons Simplex Collection: A Resource for Identification of Autism Genetic Risk Factors. Neuron 2010, 68, 192–195. [Google Scholar] [CrossRef] [Green Version]
  29. Feliciano, P.; Zhou, X.; Astrovskaya, I.; Turner, T.N.; Wang, T.; Brueggeman, L.; Barnard, R.; Hsieh, A.; Snyder, L.G.; Muzny, D.M.; et al. Exome Sequencing of 457 Autism Families Recruited Online Provides Evidence for Autism Risk Genes. NPJ Genom. Med. 2019, 4, 19. [Google Scholar] [CrossRef] [Green Version]
  30. Chen, R.; Davis, L.K.; Guter, S.; Wei, Q.; Jacob, S.; Potter, M.H.; Cox, N.J.; Cook, E.H.; Sutcliffe, J.S.; Li, B. Leveraging Blood Serotonin as an Endophenotype to Identify de Novo and Rare Variants Involved in Autism. Mol. Autism 2017, 8, 14. [Google Scholar] [CrossRef] [Green Version]
  31. Hashimoto, R.; Nakazawa, T.; Tsurusaki, Y.; Yasuda, Y.; Nagayasu, K.; Matsumura, K.; Kawashima, H.; Yamamori, H.; Fujimoto, M.; Ohi, K.; et al. Whole-Exome Sequencing and Neurite Outgrowth Analysis in Autism Spectrum Disorder. J. Hum. Genet. 2016, 61, 199–206. [Google Scholar] [CrossRef] [Green Version]
  32. Hamdan, F.F.; Srour, M.; Capo-Chichi, J.-M.; Daoud, H.; Nassif, C.; Patry, L.; Massicotte, C.; Ambalavanan, A.; Spiegelman, D.; Diallo, O.; et al. De Novo Mutations in Moderate or Severe Intellectual Disability. PLoS Genet. 2014, 10, e1004772. [Google Scholar] [CrossRef] [PubMed] [Green Version]
  33. Halvardson, J.; Zhao, J.J.; Zaghlool, A.; Wentzel, C.; Georgii-Hemming, P.; Månsson, E.; Ederth Sävmarker, H.; Brandberg, G.; Soussi Zander, C.; Thuresson, A.-C.; et al. Mutations in HECW2 Are Associated with Intellectual Disability and Epilepsy. J. Med. Genet. 2016, 53, 697–704. [Google Scholar] [CrossRef] [PubMed]
  34. Hamanaka, K.; Miyake, N.; Mizuguchi, T.; Miyatake, S.; Uchiyama, Y.; Tsuchida, N.; Sekiguchi, F.; Mitsuhashi, S.; Tsurusaki, Y.; Nakashima, M.; et al. Large-Scale Discovery of Novel Neurodevelopmental Disorder-Related Genes through a Unified Analysis of Single-Nucleotide and Copy Number Variants. Genome Med. 2022, 14, 40. [Google Scholar] [CrossRef]
  35. Chérot, E.; Keren, B.; Dubourg, C.; Carré, W.; Fradin, M.; Lavillaureix, A.; Afenjar, A.; Burglen, L.; Whalen, S.; Charles, P.; et al. Using Medical Exome Sequencing to Identify the Causes of Neurodevelopmental Disorders: Experience of 2 Clinical Units and 216 Patients. Clin. Genet. 2018, 93, 567–576. [Google Scholar] [CrossRef] [Green Version]
  36. Zhu, X.; Petrovski, S.; Xie, P.; Ruzzo, E.K.; Lu, Y.-F.; McSweeney, K.M.; Ben-Zeev, B.; Nissenkorn, A.; Anikster, Y.; Oz-Levi, D.; et al. Whole-Exome Sequencing in Undiagnosed Genetic Diseases: Interpreting 119 Trios. Genet. Med. 2015, 17, 774–781. [Google Scholar] [CrossRef] [Green Version]
  37. Helbig, K.L.; Farwell Hagman, K.D.; Shinde, D.N.; Mroske, C.; Powis, Z.; Li, S.; Tang, S.; Helbig, I. Diagnostic Exome Sequencing Provides a Molecular Diagnosis for a Significant Proportion of Patients with Epilepsy. Genet. Med. 2016, 18, 898–905. [Google Scholar] [CrossRef] [Green Version]
  38. Moreno-Ramos, O.A.; Olivares, A.M.; Haider, N.B.; de Autismo, L.C.; Lattig, M.C. Whole-Exome Sequencing in a South American Cohort Links ALDH1A3, FOXN1 and Retinoic Acid Regulation Pathways to Autism Spectrum Disorders. PLoS ONE 2015, 10, e0135927. [Google Scholar] [CrossRef] [PubMed] [Green Version]
  39. Lee, H.; Deignan, J.L.; Dorrani, N.; Strom, S.P.; Kantarci, S.; Quintero-Rivera, F.; Das, K.; Toy, T.; Harry, B.; Yourshaw, M.; et al. Clinical Exome Sequencing for Genetic Identification of Rare Mendelian Disorders. JAMA 2014, 312, 1880–1887. [Google Scholar] [CrossRef] [PubMed]
  40. Tavassoli, T.; Kolevzon, A.; Wang, A.T.; Curchack-Lichtin, J.; Halpern, D.; Schwartz, L.; Soffes, S.; Bush, L.; Grodberg, D.; Cai, G.; et al. De Novo SCN2A Splice Site Mutation in a Boy with Autism Spectrum Disorder. BMC Med. Genet. 2014, 15, 35. [Google Scholar] [CrossRef] [Green Version]
  41. Werling, D.M.; Brand, H.; An, J.-Y.; Stone, M.R.; Zhu, L.; Glessner, J.T.; Collins, R.L.; Dong, S.; Layer, R.M.; Markenscoff-Papadimitriou, E.; et al. An Analytical Framework for Whole-Genome Sequence Association Studies and Its Implications for Autism Spectrum Disorder. Nat. Genet. 2018, 50, 727–736. [Google Scholar] [CrossRef]
  42. Veeramah, K.R.; O’Brien, J.E.; Meisler, M.H.; Cheng, X.; Dib-Hajj, S.D.; Waxman, S.G.; Talwar, D.; Girirajan, S.; Eichler, E.E.; Restifo, L.L.; et al. De Novo Pathogenic SCN8A Mutation Identified by Whole-Genome Sequencing of a Family Quartet Affected by Infantile Epileptic Encephalopathy and SUDEP. Am. J. Hum. Genet. 2012, 90, 502–510. [Google Scholar] [CrossRef] [PubMed] [Green Version]
  43. Veeramah, K.R.; Johnstone, L.; Karafet, T.M.; Wolf, D.; Sprissler, R.; Salogiannis, J.; Barth-Maron, A.; Greenberg, M.E.; Stuhlmann, T.; Weinert, S.; et al. Exome Sequencing Reveals New Causal Mutations in Children with Epileptic Encephalopathies. Epilepsia 2013, 54, 1270–1281. [Google Scholar] [CrossRef] [PubMed]
  44. Barcia, G.; Fleming, M.R.; Deligniere, A.; Gazula, V.-R.; Brown, M.R.; Langouet, M.; Chen, H.; Kronengold, J.; Abhyankar, A.; Cilio, R.; et al. De Novo Gain-of-Function KCNT1 Channel Mutations Cause Malignant Migrating Partial Seizures of Infancy. Nat. Genet. 2012, 44, 1255–1259. [Google Scholar] [CrossRef] [PubMed] [Green Version]
  45. de Ligt, J.; Willemsen, M.H.; van Bon, B.W.M.; Kleefstra, T.; Yntema, H.G.; Kroes, T.; Vulto-van Silfhout, A.T.; Koolen, D.A.; de Vries, P.; Gilissen, C.; et al. Diagnostic Exome Sequencing in Persons with Severe Intellectual Disability. N. Engl. J. Med. 2012, 367, 1921–1929. [Google Scholar] [CrossRef] [PubMed] [Green Version]
  46. Mignot, C.; Moutard, M.-L.; Rastetter, A.; Boutaud, L.; Heide, S.; Billette, T.; Doummar, D.; Garel, C.; Afenjar, A.; Jacquette, A.; et al. ARID1B Mutations Are the Major Genetic Cause of Corpus Callosum Anomalies in Patients with Intellectual Disability. Brain 2016, 139, e64. [Google Scholar] [CrossRef] [PubMed] [Green Version]
  47. Hoyer, J.; Ekici, A.B.; Endele, S.; Popp, B.; Zweier, C.; Wiesener, A.; Wohlleber, E.; Dufke, A.; Rossier, E.; Petsch, C.; et al. Haploinsufficiency of ARID1B, a Member of the SWI/SNF-A Chromatin-Remodeling Complex, Is a Frequent Cause of Intellectual Disability. Am. J. Hum. Genet. 2012, 90, 565–572. [Google Scholar] [CrossRef] [Green Version]
  48. Kleefstra, T.; de Leeuw, N. Kleefstra, T.; de Leeuw, N. Kleefstra Syndrome. In GeneReviews®; Adam, M.P., Mirzaa, G.M., Pagon, R.A., Wallace, S.E., Bean, L.J.H., Gripp, K.W., Amemiya, A., Eds.; University of Washington: Seattle, WA, USA, 1993. [Google Scholar]
  49. Stamberger, H.; Nikanorova, M.; Willemsen, M.H.; Accorsi, P.; Angriman, M.; Baier, H.; Benkel-Herrenbrueck, I.; Benoit, V.; Budetta, M.; Caliebe, A.; et al. STXBP1 Encephalopathy: A Neurodevelopmental Disorder Including Epilepsy. Neurology 2016, 86, 954–962. [Google Scholar] [CrossRef]
  50. Issekutz, K.A.; Jr, J.M.G.; Prasad, C.; Smith, I.M.; Blake, K.D. An epidemiological analysis of CHARGE syndrome: Preliminary results from a Canadian study. Am. J. Med Genet. Part A 2005, 133A, 309–317. [Google Scholar] [CrossRef]
  51. Janssen, N.; Bergman, J.; Swertz, M.; Tranebjaerg, L.; Lodahl, M.; Schoots, J.; Hofstra, R.; van Ravenswaaij-Arts, C.M.A.; Hoefsloot, L.H. Mutation update on the CHD7 gene involved in CHARGE syndrome. Hum. Mutat. 2012, 33, 1149–1160. [Google Scholar] [CrossRef]
  52. Adam, M.P.; Hudgins, L.; Hannibal, M. Kabuki Syndrome. In GeneReviews®; Adam, M.P., Mirzaa, G.M., Pagon, R.A., Wallace, S.E., Bean, L.J.H., Gripp, K.W., Amemiya, A., Eds.; University of Washington: Seattle, WA, USA, 1993. [Google Scholar]
  53. Tatton-Brown, K.; Cole. T/R.; Rahman, N. Sotos Syndrome. In GeneReviews®; Adam, M.P., Mirzaa, G.M., Pagon, R.A., Wallace, S.E., Bean, L.J.H., Gripp, K.W., Amemiya, A., Eds.; University of Washington: Seattle, WA, USA, 1993. [Google Scholar]
  54. Adam, M.P.; Conta, J.; Bean, L.J.H. Mowat-Wilson Syndrome. In GeneReviews®; Adam, M.P., Mirzaa, G.M., Pagon, R.A., Wallace, S.E., Bean, L.J.H., Gripp, K.W., Amemiya, A., Eds.; University of Washington: Seattle, WA, USA, 1993. [Google Scholar]
  55. Kaur, S.; Christodoulou, J. MECP2 Disorders. In GeneReviews®; Adam, M.P., Mirzaa, G.M., Pagon, R.A., Wallace, S.E., Bean, L.J.H., Gripp, K.W., Amemiya, A., Eds.; University of Washington: Seattle, WA, USA, 1993. [Google Scholar]
  56. A Koolen, D.; Morgan, A.; de Vries, B.B. Koolen-de Vries Syndrome. In GeneReviews®; Adam, M.P., Mirzaa, G.M., Pagon, R.A., Wallace, S.E., Bean, L.J.H., Gripp, K.W., Amemiya, A., Eds.; University of Washington: Seattle, WA, USA, 1993. [Google Scholar]
  57. Koolen, A.D.; DDD Study; Pfundt, R.; Linda, K.; Beunders, G.; Veenstra-Knol, E.H.; Conta, J.H.; Fortuna, A.; Gillessen-Kaesbach, G.; Dugan, S.; et al. The Koolen-de Vries syndrome: A phenotypic comparison of patients with a 17q21.31 microdeletion versus a KANSL1 sequence variant. Eur. J. Hum. Genet. 2015, 24, 652–659. [Google Scholar] [CrossRef]
  58. Bayat, A.; Hjalgrim, H.; Møller, R.S. The incidence of SCN1A-related dravet syndrome in Denmark is 1:22,000: A population-based study from 2004 to 2009. Epilepsia 2015, 56. [Google Scholar] [CrossRef]
  59. Larsen, J.; Johannesen, K.M.; Ek, J.; Tang, S.; Marini, C.; Blichfeldt, S.; Kibaek, M.; von Spiczak, S.; Weckhuysen, S.; Frangu, M.; et al. The role of SLC2A1 mutations in myoclonic astatic epilepsy and absence epilepsy, and the estimated frequency of GLUT1 deficiency syndrome. Epilepsia 2015, 56, e203–e208. [Google Scholar] [CrossRef]
  60. Symonds, J.; Zuberi, S.M.; Stewart, K.; McLellan, A.; O‘Regan, M.; MacLeod, S.; Jollands, A.; Joss, S.; Kirkpatrick, M.; Brunklaus, A.; et al. Incidence and phenotypes of childhood-onset genetic epilepsies: A prospective population-based national cohort. Brain 2019, 142, 2303–2318. [Google Scholar] [CrossRef] [PubMed] [Green Version]
  61. Stevens, C.A. Rubinstein-Taybi Syndrome. In GeneReviews®; Adam, M.P., Mirzaa, G.M., Pagon, R.A., Wallace, S.E., Bean, L.J.H., Gripp, K.W., Amemiya, A., Eds.; University of Washington: Seattle, WA, USA, 1993. [Google Scholar]
  62. Snijders Blok, L.; Madsen, E.; Juusola, J.; Gilissen, C.; Baralle, D.; Reijnders, M.R.F.; Venselaar, H.; Helsmoortel, C.; Cho, M.T.; Hoischen, A.; et al. Mutations in DDX3X Are a Common Cause of Unexplained Intellectual Disability with Gender-Specific Effects on Wnt Signaling. Am. J. Hum. Genet. 2015, 97, 343–352. [Google Scholar] [CrossRef] [PubMed] [Green Version]
  63. Amabile, S.; Jeffries, L.; McGrath, J.M.; Ji, W.; Spencer-Manzon, M.; Zhang, H.; Lakhani, S.A. DYNC1H1-Related Disorders: A Description of Four New Unrelated Patients and a Comprehensive Review of Previously Reported Variants. Am. J. Med. Genet. Part A 2020, 182, 2049–2057. [Google Scholar] [CrossRef] [PubMed]
  64. The Power of Being Counted—RARE-X. 2022. Available online: https://rare-x.org/case-studies/the-power-of-being-counted/ (accessed on 8 June 2022).
  65. van der Sluijs, P.J.; Jansen, S.; Vergano, S.A.; Adachi-Fukuda, M.; Alanay, Y.; AlKindy, A.; Baban, A.; Bayat, A.; Beck-Wödl, S.; Berry, K.; et al. The ARID1B Spectrum in 143 Patients: From Nonsyndromic Intellectual Disability to Coffin-Siris Syndrome. Genet. Med. 2019, 21, 1295–1307. [Google Scholar] [CrossRef] [Green Version]
  66. Vasko, A.; Drivas, T.G.; Schrier Vergano, S.A. Genotype-Phenotype Correlations in 208 Individuals with Coffin-Siris Syndrome. Genes 2021, 12, 937. [Google Scholar] [CrossRef]
  67. Schrier Vergano, S.; Santen, G.; Wieczorek, D.; Wollnik, B.; Matsumoto, N.; Deardorff, M.A. Coffin-Siris Syndrome. In GeneReviews®; Adam, M.P., Ardinger, H.H., Pagon, R.A., Wallace, S.E., Bean, L.J., Gripp, K.W., Mirzaa, G.M., Amemiya, A., Eds.; University of Washington: Seattle, WA, USA, 1993. [Google Scholar]
  68. Lauer, E.; McCallion, P. Mortality of People with Intellectual and Developmental Disabilities from Select US State Disability Service Systems and Medical Claims Data. J. Appl. Res. Intellect. Disabil. 2015, 28, 394–405. [Google Scholar] [CrossRef]
  69. Srivastava, S.; Love-Nichols, J.A.; Dies, K.A.; Ledbetter, D.H.; Martin, C.L.; Chung, W.K.; Firth, H.V.; Frazier, T.; Hansen, R.L.; Prock, L.; et al. Meta-Analysis and Multidisciplinary Consensus Statement: Exome Sequencing Is a First-Tier Clinical Diagnostic Test for Individuals with Neurodevelopmental Disorders. Genet. Med. 2019, 21, 2413–2421. [Google Scholar] [CrossRef]
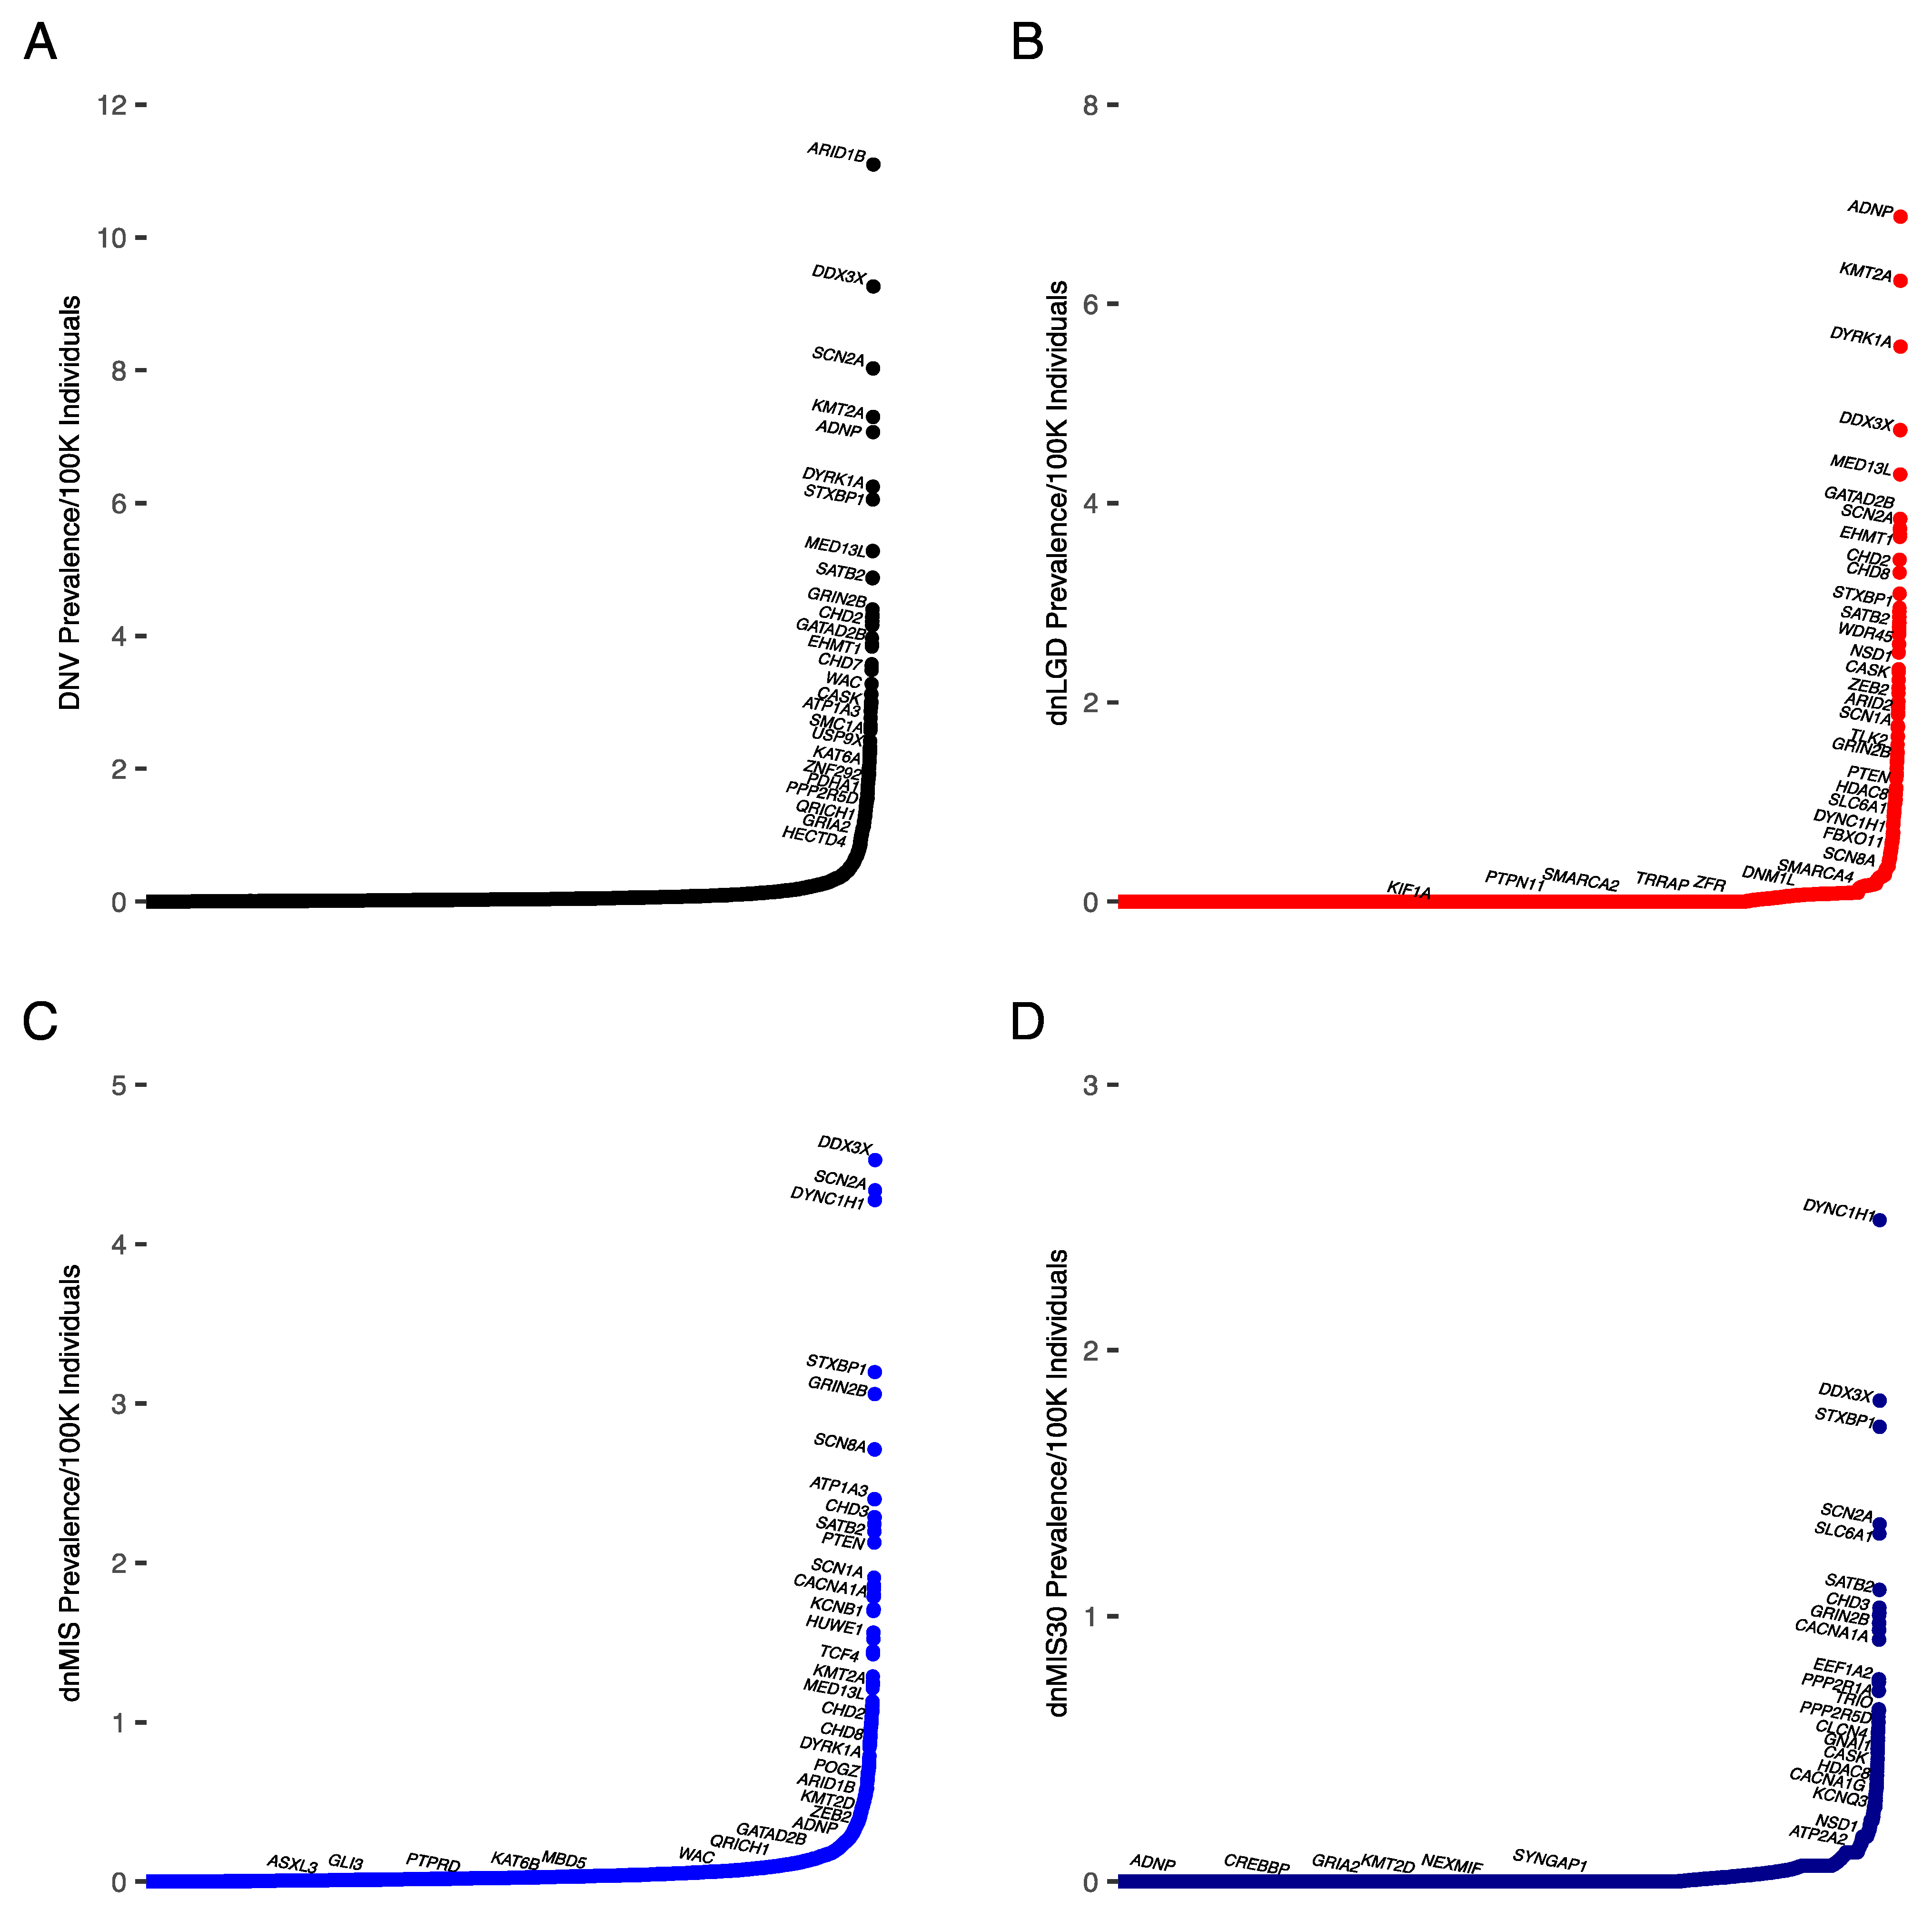
Figure 1. Prevalence of DNVs by gene extrapolated from percent of cases in total NDD cohort. Genes are indicated along the x-axis, with prevalence of each variant type on the y-axis. (A) NDD DNV cases, (B) NDD dnLGD cases, (C) NDD dnMIS cases, and (D) NDD dnMIS30 cases. The proportion of each gene and mutation type in our cohort was multiplied by the estimated prevalence of NDDs (DD/ID, ASD, and epilepsy) from Zablotsky and Black, 2020.
Biomedicines 10 02865 g001
Figure 2. Prevalence of DNVs by gene extrapolated from number of cases in DD/ID cohort. Genes are indicated along the x-axis, with prevalence of each variant type on the y-axis. (A) DD/ID DNV cases, (B) DD/ID dnLGD cases, (C) DD/ID dnMIS cases, and (D) DD/ID dnMIS30 cases. The proportion of each gene and mutation type in our cohort was multiplied by the estimated prevalence of DD (DD/ID) from Zablotsky and Black, 2020.
Biomedicines 10 02865 g002
Figure 3. Prevalence of DNVs by gene extrapolated from number of cases in ASD cohort. Genes are indicated along the x-axis, with prevalence of each variant type on the y-axis. (A) ASD DNV cases, (B) ASD dnLGD cases, (C) ASD dnMIS cases, and (D) ASD dnMIS30 cases. The proportion of each gene and mutation type in our cohort was multiplied by the estimated prevalence of ASD from Zablotsky and Black, 2020.
Biomedicines 10 02865 g003
Figure 4. Prevalence of DNVs by gene versus incidence estimates from [14]. (A) NDD DNV cases (p < 0.0001 with Bonferroni correction), (B) NDD dnLGD cases (p < 0.0001), and (C) NDD dnMIS cases (p < 0.0001). All variant types had a positive correlation with previous incidence estimates, shown with Pearson’s correlation coefficients (PCC). Notably, some genes without clinical relevance, such as TTN, are also shown. Corrected p values and confidence intervals are shown in Table S6.
Biomedicines 10 02865 g004
Table 1. Prevalence estimates from Zablotsky and Black, 2020 of each disorder among 3- to 17-year old children in the US.
Zablotsky and Black (2020) Prevalence %95% Confidence IntervalCurrent Study n
All NDDs4.5%4–5%50,377
DD/ID1.2%1.1–1.4%31,191
ASD2.5%2.2–2.7%16,125
Epilepsy0.8%0.7–0.9%1389
Table 2. Top 10 most prevalent genes with variation among NDDs. Prevalence figures are normalized by constraint scores, thus may account a higher percentage of our cohort.
NDDs
(Prevalence/100,000; % in Cohort)
DNVdnLGD dnMIS dnMIS30
ARID1B (11.1; 0.3%)ARID1B (10.7; 0.25%)DDX3X (4.5; 0.14%)DYNC1H1 (2.5; 0.09%)
DDX3X (9.3; 0.3%)ADNP (6.9; 0.16%)SCN2A (4.3; 0.17%)DDX3X (1.8; 0.06%)
SCN2A (8; 0.3%)KMT2A (6.2; 0.14%)DYNC1H1 (4.3; 0.16%)STXBP1 (1.7; 0.06%)
KMT2A (7.3; 0.22%)DYRK1A (5.6; 0.13%)STXBP1 (3.2; 0.11%)SCN2A (1.3; 0.05%)
ADNP (7.1; 0.17%)CTNNB1 (5.5, 0.13%)GRIN2B (3.1; 0.13%)SLC6A1 (1.3; 0.05%)
DYRK1A (6.2.; 0.18%)DDX3X (4.7; 0.11%)SCN8A (2.7; 0.09%)SATB2 (1.1; 0.04%)
STXBP1 (6.1; 0.23%)MED13L (4.3; 0.1%)ATP1A3 (2.4; 0.08%)CHD3 (1; 0.05%)
CTNNB1 (5.7; 0.13%)GATAD2B (3.8; 0.09%)CHD3 (2.3, 0.1%)SMARCA4 (1; 0.04%)
MED13L (5.3; 0.18%)POGZ (3.7; 0.09%)KCNQ2 (2.2, 0.1%)KIF1A (1; 0.05%)
SATB2 (4.9; 0.19%)SETD5 (3.7; 0.1%)SATB2 (2.2, 0.09%)GRIN2B (1; 0.4%)
Values for all genes analyzed and their 95% confidence intervals are in Table S3.
Table 3. Comparison of our prevalence estimates to previous estimates.
Gene/SyndromeCurrent Cohort Estimate (All NDDs)López-Rivera EstimatePrevious Estimates (Citation)
ARID1B/Coffin-Siris syndrome 1Most are due to LGD variants:
1/9009
Most are due to LGD variants:
1/61,884
1/10,000–1/100,000 [47]
EHMT1/KMT2C/Kleefstra syndromeLGD and MIS:
EHMT1: 1/27,927
KMT2C: 1/90,759
LGD and MIS:
1/33,686
LGD and MIS:
1/22,373
At least 1/120,000 in those with NDDs [48]
STXBP1/STXBP1 encephalopathyLGD and MIS:
1/16,516
LGD and MIS:
1/27,664
1/91,862 [49]
CHD7/CHARGE syndromeLGD and MIS:
1/30,513
LGD and MIS:
1/17,642
1/8500–1/15,000 newborns [50,51]
KMT2D/KDM6A/Kabuki syndromeLGD and MIS:
KMT2D: 1/34,054
KDM6A: 1/77,272
LGD and MIS:
KMT2D: 1/11,061
KDM6A: 1/38,153
1/32,000–1/86,000 [52]
NSD1/Sotos syndromeLGD and MIS:
1/34,843
LGD and MIS:
1/16,552.5
1/14,000 [53]
ZEB2/Mowat-Wilson syndromeLGD and MIS:
1/43,906
LGD and MIS:
1/25,112
1/50,000–1/100,000 [54]
MECP2/Rett syndromeLGD and MIS:
1/87,826
LGD and MIS:
1/486,085
1/10,000–1/23,000 female births [55]
KANSL1/Koolen-de Vries syndrome syndromeLGD and MIS:
1/65,049
LGD and MIS:
1/59,802
May be as frequent as deletion (1/55,000) [56,57]
SCN1A/Dravet syndromeLGD and MIS:
1/28,161
LGD and MIS:
1/13,877
1/22,000 incidence in Danish population [58]
SLC2A1/GLUT1 deficiency syndromeMIS:
1/295,848
MIS:
1/58,766.5
1/33,898–1/83,333 [59,60]
KCNQ2/KCNQ2 encephalopathyMIS:
1/44,573
MIS:
1/30,534
1/84,746 [60]
CREBBP/EP300/Rubinstein-Taybi syndromeLGD and MIS:
CREBBP: 1/56,126
EP300: 1/32,028
LGD and MIS:
CREBBP: 1/16,201
EP300: 1/25,862
1/100,000–1/125,000 [61]
Table 4. Top 10 most prevalent genes with variation among DD.
DD
(Prevalence/100,000; % in Cohort)
DNVdnLGDdnMIS dnMIS30
ARID1B (4; 0.38%)ARID1B (3.9; 0.2)DDX3X (1.7; 0.2%)DYNC1H1 (1; 0.13%)
DDX3X (3.6; 0.37%)KMT2A (2.3; 0.18%)DYNC1H1 (1.4; 0.2%)DDX3X (0.8; 0.09%)
KMT2A (2.7; 0.28%)CTNNB1 (2.2; 0.18%)SCN2A (1.2; 0.2%)STXBP1 (0.54; 0.07%)
DYRK1A (2.4; 0.25%)DYRK1A (2.19; 0.17%)GRIN2B (1; 0.18%)SLC6A1 (0.5; 0.07%)
CTNNB1 (2.2; 0.2%)ADNP (2.1, 0.16%) STXBP1 (0.96; 0.14%)SATB2 (0.5; 0.07%)
ADNP (2.1; 0.19%)DDX3X (1.96; 0.13%)SCN8A (0.9; 0.12%)KIF1A (0.4; 0.08%)
STXBP1 (2.1; 0.23%)MED13L (1.7; 0.13%)KCNQ2 (0.8; 0.15%)CHD3 (0.4; 0.06%)
SCN2A (2.1; 0.28%)GATAD2B (1.6; 0.12%)CHD3 (0.8; 0.14%)ATP1A3 (0.4; 0.04%)
MED13L (2; 0.24%)SETD5 (1.4; 0.12%)SATB2 (0.7; 0.12%)CACNA1A (0.4; 0.07%)
SATB2 (1.9; 0.21%)EHMT1 (1.3; 0.11%)ATP1A3 (0.7; 0.1%) SMARCA4 (0.3; 0.05%)
Values for all genes analyzed and their 95% confidence intervals are in Table S5.
Table 5. Top 10 most prevalent genes with variation among ASD.
ASD
(Prevalence/100,000; % in Cohort)
DNV dnLGDdnMISdnMIS30
SCN2A (4.1; 0.22%)ADNP (3, 0.12%)SCN2A (1.7; 0.12%)SCN2A (0.7; 0.05%)
CHD8 (3.5, 0.19%)CHD8 (2.7; 0.11%)PTEN (1.2; 0.07%)DYNC1H1 (0.5; 0.03%)
ADNP (3.2; 0.16%)SCN2A (2.3; 0.1%)DYNC1H1 (1.1; 0.07%)STXBP1 (0.4; 0.03%)
ASH1L (2.3; 0.1%)ASH1L (2.3; 0.09%)CHD8 (0.8; 0.07%)TRRAP (0.4, 0.03%)
POGZ (2.2; 0.12%)ARID1B (1.8; 0.07%) TRRAP (0.7; 0.06%)CHD8 (0.3; 0.03%)
CHD2 (2.2; 0.12%)POGZ (1.8; 0.07%)CHD2 (0.65; 0.06%)GRIN2B (0.3; 0.03%)
ARID1B (2.1; 0.14%)KMT5B (1.6; 0.06%)NALCN (0.6; 0.06%)CLCN4 (0.3; 0.02%)
DYNC1H1 (2; 0.11%) CHD2 (1.5; 0.06%)PABPC1 (0.6; 0.04%)CHD2 (0.3; 0.02%)
WDFY3 (1.7; 0.1%)SYNGAP1 (1.2; 0.05%)CYFIP2 (0.58; 0.04%)SLC6A1 (0.28; 0.02%)
KMT5B (1.7; 0.08%)WDFY3 (1.2; 0.05%)TBL1XR1 (0.56; 0.03%)SMARCA4 (0.27; 0.02%)
Values for all genes analyzed and their 95% confidence intervals are in Table S6.
Publisher’s Note: MDPI stays neutral with regard to jurisdictional claims in published maps and institutional affiliations.