
Non-Invasive Evaluation of Kidney Elasticity and Viscosity in a Healthy Cohort
 , ,
, , 
 , , ,
, , ,  ,
,
Abstract
1. Introduction
2. Materials and Methods
2.1. Study Population
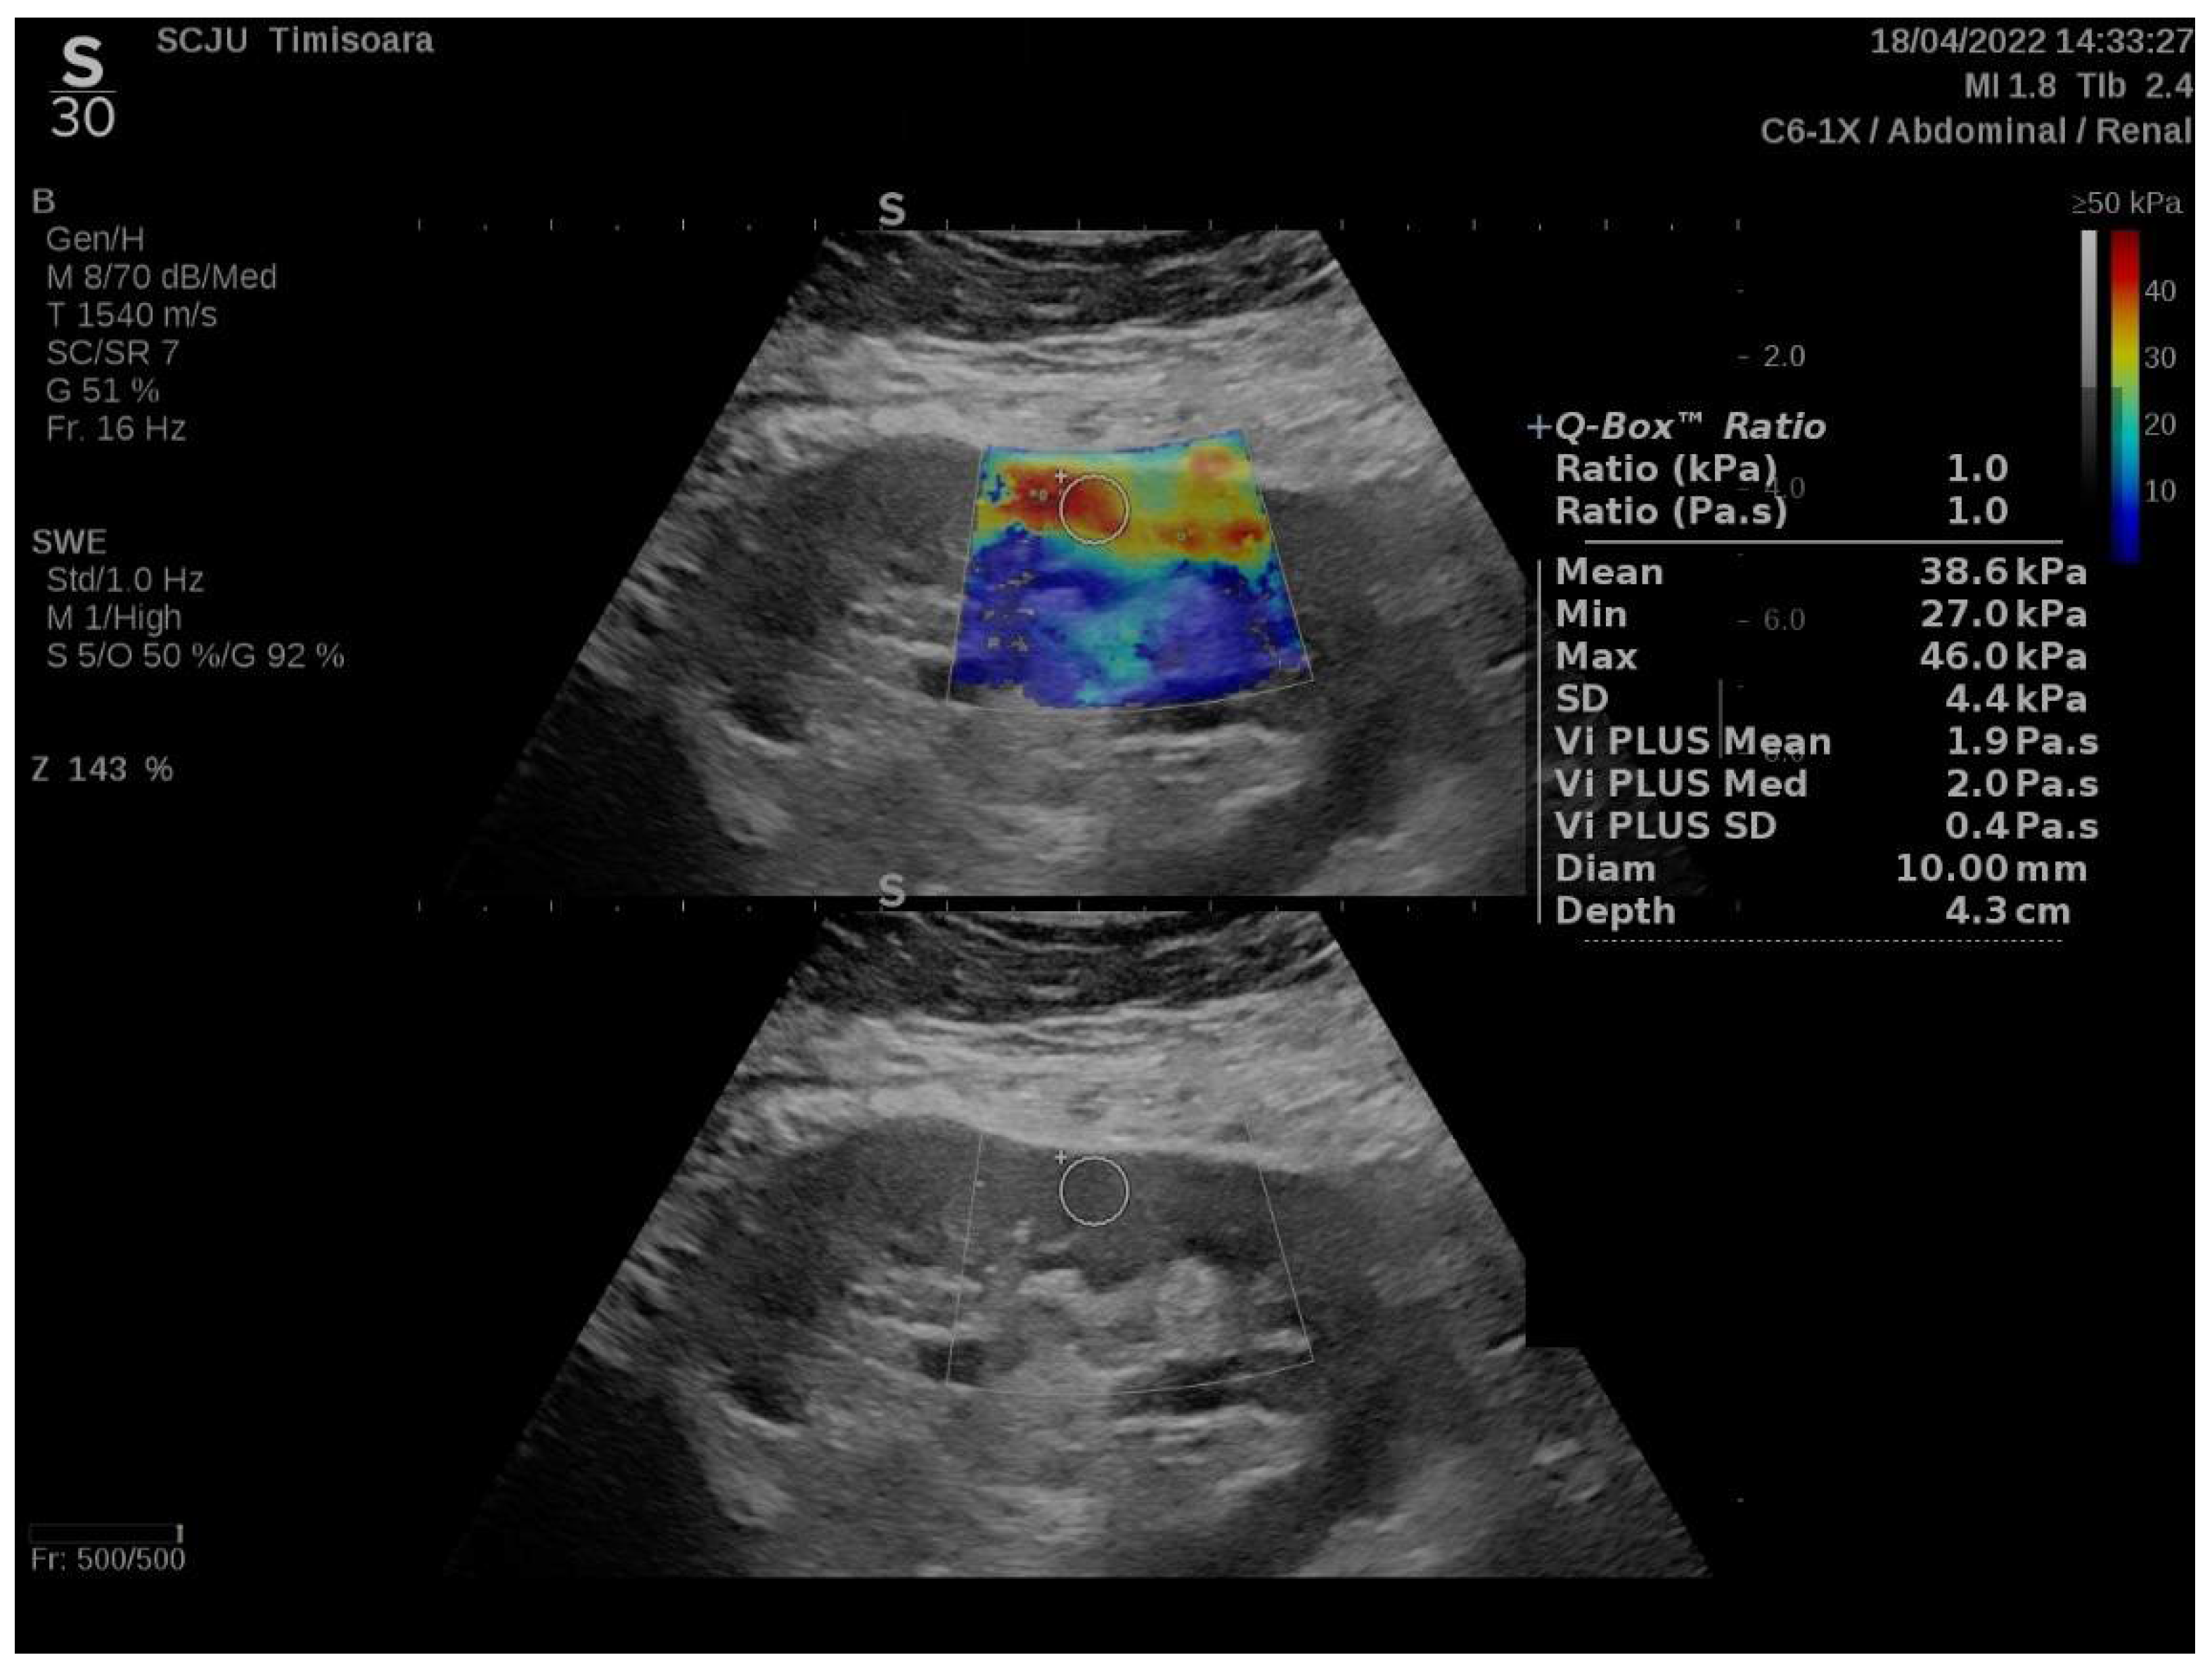
2.2. Elastography Using 2D-SWE PLUS and Vi PLUS
2.3. Statistical Analysis
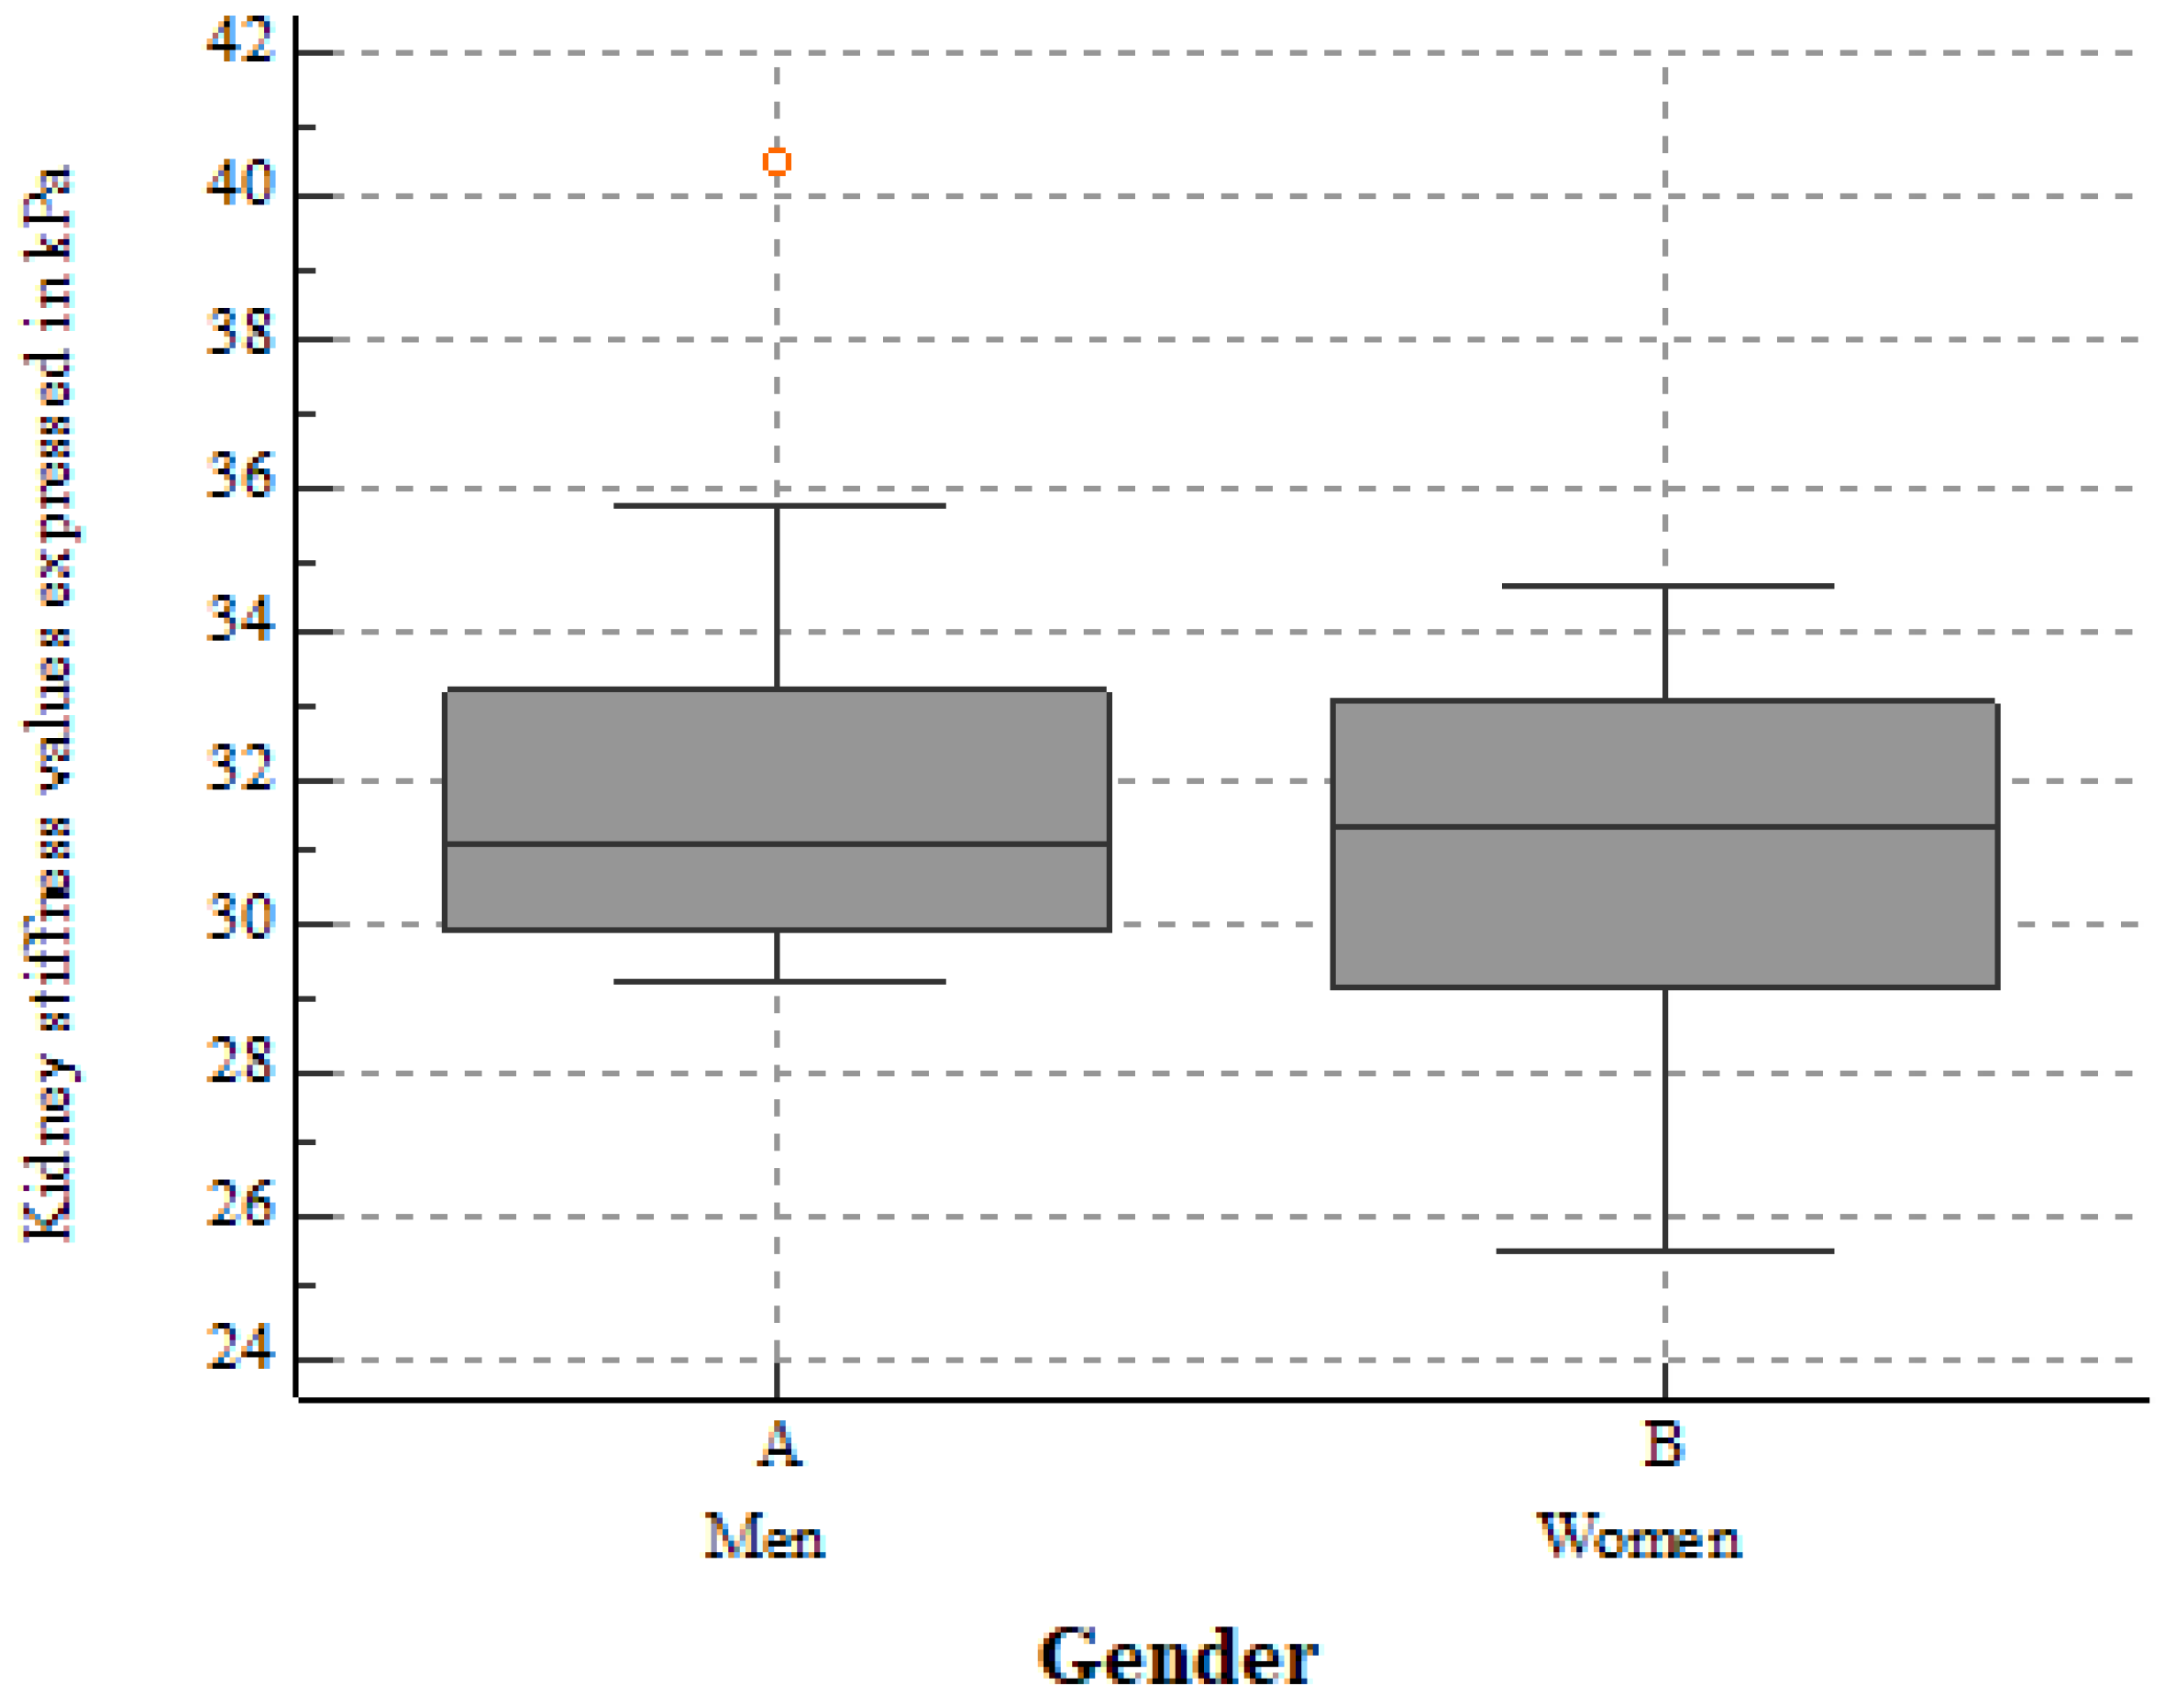
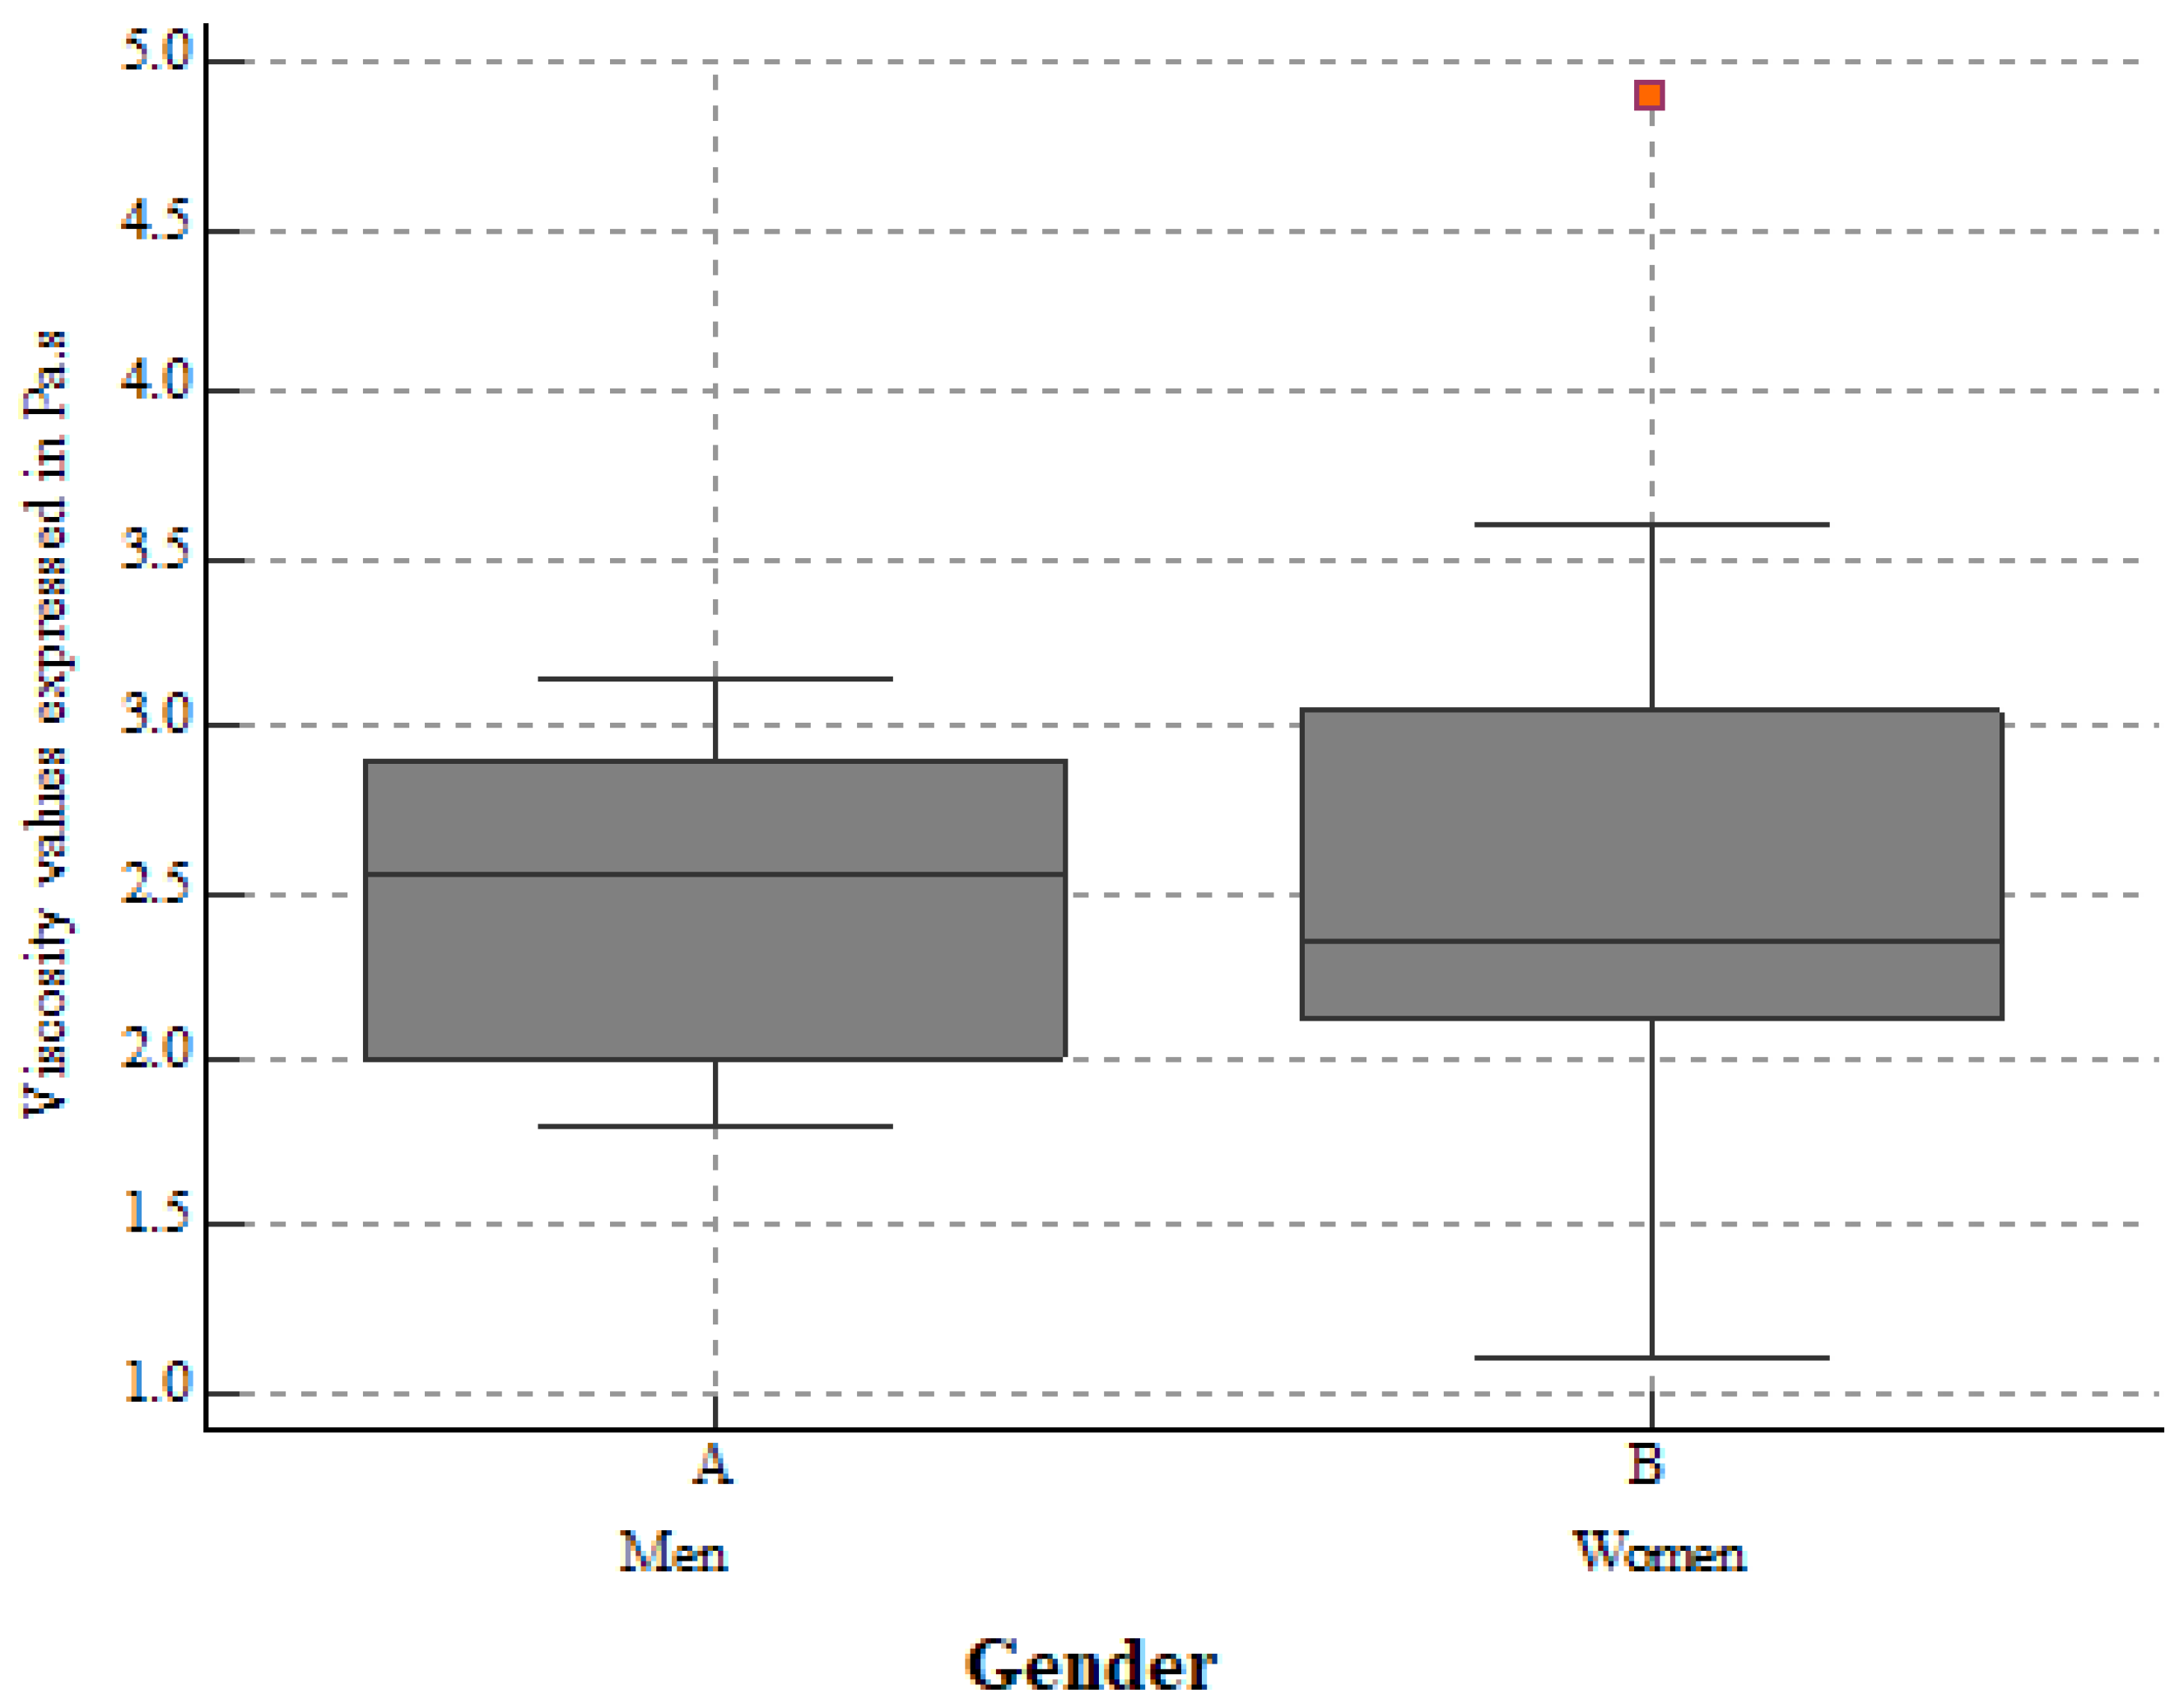
3. Results
4. Discussion
5. Conclusions
Author Contributions
Funding
Institutional Review Board Statement
Informed Consent Statement
Data Availability Statement
Conflicts of Interest
References
- Turner, N.; Lameire, N.; Goldsmith, D.J.; Winearls, C.G.; Himmelfarb, J.; Remuzzi, G. Oxford Textbook of Clinical Nephrology, 4th ed.; Oxford University Press: Oxford, UK, 2016. [Google Scholar]
- Hu, Q.; Zhang, W.J.; Lin, Z.Q.; Wang, X.Y.; Zheng, H.Y.; Wei, H.M.; He, H.G. Combined Acoustic Radiation Force Impulse and Conventional Ultrasound in the Quantitative Assessment of Immunoglobulin a Nephropathy. Ultrasound Med. Biol. 2019, 45, 2309–2316. [Google Scholar] [CrossRef] [PubMed]
- Moghazi, S.; Jones, E.; Schroepple, J.; Arya, K.; Mcclellan, W.; Hennigar, R.A.; O’Neill, W.C. Correlation of renal histopathology with sonographic findings. Kidney Int. 2005, 67, 1515–1520. [Google Scholar] [CrossRef] [PubMed]
- Ophir, J.; Ccspedes, I.; Ponnekanti, H.; Yazdi, Y.; Li, X. Elastography: A Quantitative Method for Imaging the Elasticity of Biological Tissues. Ultrason. Imaging 1991, 13, 111–134. [Google Scholar] [CrossRef] [PubMed]
- Chen, C.; Wang, C.; Hu, C.; Han, Y.; Zhao, L.; Zhu, X.; Xiao, L.; Sun, L. Normoalbuminuric diabetic kidney disease. Front. Med. 2017, 11, 310–318. [Google Scholar] [CrossRef] [PubMed]
- Arndt, R.; Schmidt, S.; Loddenkemper, C.; Grünbaum, M.; Zidek, W.; van der Giet, M.; Westhoff, T.H. Noninvasive evaluation of renal allograft fibrosis by transient elastography—A pilot study. Transpl. Int. 2010, 23, 871–877. [Google Scholar] [CrossRef]
- Lukenda, V.; Mikolasevic, I.; Racki, S.; Jelic, I.; Stimac, D.; Orlic, L. Transient elastography: A new noninvasive diagnostic tool for assessment of chronic allograft nephropathy. Int. Urol. Nephrol. 2014, 46, 1435–1440. [Google Scholar] [CrossRef]
- Nakao, T.; Ushigome, H.; Nakamura, T.; Harada, S.; Koshino, K.; Suzuki, T.; Ito, T.; Nobori, S.; Yoshimura, N. Evaluation of renal allograft fibrosis by transient elastography (fibro scan). Transplant. Proc. 2015, 47, 640–643. [Google Scholar] [CrossRef]
- Sommerer, C.; Scharf, M.; Seitz, C.; Millonig, G.; Seitz, H.K.; Zeier, M.; Mueller, S. Assessment of renal allograft fibrosis by transient elastography. Transpl. Int. 2013, 26, 545–551. [Google Scholar] [CrossRef]
- Guo, L.H.; Xu, H.X.; Fu, H.J.; Peng, A.; Zhang, Y.F.; Liu, L.N. Acoustic Radiation Force Impulse Imaging for Noninvasive Evaluation of Renal Parenchyma Elasticity: Preliminary Findings. PLoS ONE 2013, 8, e68925. [Google Scholar] [CrossRef]
- Stock, K.; Klein, B.; Cong, M.V.; Regenbogen, C.; Kemmner, S.; Büttner, M.; Wagenpfeil, S.; Matevossian, E.; Renders, L.; Heemann, U.; et al. ARFI-based tissue elasticity quantification and kidney graft dysfunction: First clinical experiences. Clin. Hemorheol. Microcirc. 2011, 49, 527–535. [Google Scholar] [CrossRef]
- Syversveen, T.; Brabrand, K.; Midtvedt, K.; Strøm, E.H.; Hartmann, A.; Jakobsen, J.A.; Berstad, A.E. Assessment of renal allograft fibrosis by acoustic radiation force impulse quantification—A pilot study. Transpl. Int. 2011, 24, 100–105. [Google Scholar] [CrossRef] [PubMed]
- Asano, K.; Ogata, A.; Tanaka, K.; Ide, Y.; Sankoda, A.; Kawakita, C.; Nishikawa, M.; Ohmori, K.; Kinomura, M.; Shimada, N.; et al. Acoustic radiation force impulse elastography of the kidneys: Is shear wave velocity affected by tissue fibrosis or renal blood flow? J. Ultrasound Med. 2014, 33, 793–801. [Google Scholar] [CrossRef] [PubMed]
- Wang, L. New insights on the role of anisotropy in renal ultrasonic elastography: From trash to treasure. Med. Hypotheses 2020, 143, 110146. [Google Scholar] [CrossRef] [PubMed]
- Samir, A.E.; Allegretti, A.S.; Zhu, Q.; Dhyani, M.; Anvari, A.; Sullivan, D.A.; Trottier, C.A.; Dougherty, S.; Williams, W.W.; Babitt, J.L.; et al. Shear wave elastography in chronic kidney disease: A pilot experience in native kidneys. BMC Nephrol. 2015, 16, 119. [Google Scholar] [CrossRef] [PubMed]
- Radulescu, D.; Peride, I.; Petcu, L.C.; Niculae, A.; Checherita, I.A. Supersonic Shear Wave Ultrasonography for Assessing Tissue Stiffness in Native Kidney. Ultrasound Med. Biol. 2018, 44, 2556–2568. [Google Scholar] [CrossRef] [PubMed]
- Barr, R.G. Can Accurate Shear Wave Velocities Be Obtained in Kidneys? J. Ultrasound Med. 2020, 39, 1097–1105. [Google Scholar] [CrossRef]
- Zhao, J.; Zhai, F.; Cheng, J.; He, Q.; Luo, J.; Yang, X.; Shao, J.; Xing, H. Evaluating the significance of viscoelasticity in diagnosing early-stage liver fibrosis with transient elastography. PLoS ONE 2017, 12, e0170073. [Google Scholar] [CrossRef]
- Ferraioli, G.; Wong, V.W.-S.; Castera, L.; Berzigotti, A.; Sporea, I.; Dietrich, C.F.; Choi, B.I.; Wilson, S.R.; Kudo, M.; Barr, R.G. Liver Ultrasound Elastography: An Update to the World Federation for Ultrasound in Medicine and Biology Guidelines and Recommendations. Ultrasound Med. Biol. 2018, 44, 2419–2440. [Google Scholar] [CrossRef]
- Hudson, J.M.; Milot, L.; Parry, C.; Williams, R.; Burns, P.N. Inter- and Intra-Operator Reliability and Repeatability of Shear Wave Elastography in the Liver: A Study in Healthy Volunteers. Ultrasound Med. Biol. 2013, 39, 950–955. [Google Scholar] [CrossRef]
- Cassinotto, C.; Lapuyade, B.; Mouries, A.; Hiriart, J.-B.; Vergniol, J.; Gaye, D.; Castain, C.; Le Bail, B.; Chermak, F.; Foucher, J.; et al. Non-invasive assessment of liver fibrosis with impulse elastography: Comparison of Supersonic Shear Imaging with ARFI and FibroScan®. J. Hepatol. 2014, 61, 550–557. [Google Scholar] [CrossRef]
- Herrmann, E.; De Lédinghen, V.; Cassinotto, C.; Chu, W.C.W.; Leung, V.Y.-F.; Ferraioli, G.; Filice, C.; Castera, L.; Vilgrain, V.; Ronot, M.; et al. Assessment of biopsy-proven liver fibrosis by two-dimensional shear wave elastography: An individual patient data-based meta-analysis. Hepatology 2018, 67, 260–272. [Google Scholar] [CrossRef] [PubMed]
- Maralescu, F.-M.; Bende, F.; Sporea, I.; Popescu, A.; Șirli, R.; Schiller, A.; Petrica, L.; Moga, T.V.; Mare, R.; Grosu, I.; et al. Assessment of Renal Allograft Stiffness and Viscosity Using 2D SWE PLUS and Vi PLUS Measures—A Pilot Study. J. Clin. Med. 2022, 11, 4370. [Google Scholar] [CrossRef] [PubMed]
- Popa, A.; Sporea, I.; Bende, F.; Popescu, A.; Fofiu, R.; Borlea, A.; Bâldea, V.; Pascu, A.; Foncea, C.G.; Cotrău, R.; et al. The Non-Invasive Ultrasound-Based Assessment of Liver Viscosity in a Healthy Cohort. Diagnostics 2022, 12, 1451. [Google Scholar] [CrossRef] [PubMed]
- Popa, A.; Bende, F.; Șirli, R.; Popescu, A.; Bâldea, V.; Lupușoru, R.; Cotrău, R.; Fofiu, R.; Foncea, C.; Sporea, I. Quantification of liver fibrosis, steatosis, and viscosity using multiparametric ultrasound in patients with non-alcoholic liver disease: A “real-life” cohort study. Diagnostics 2021, 11, 783. [Google Scholar] [CrossRef]
- Nowicki, A.; Dobruch-Sobczak, K. Wprowadzenie do ultradźwiękowej elastografii. J. Ultrason. 2016, 16, 113–124. [Google Scholar] [CrossRef]
- Bercoff, J.; Tanter, M.; Fink, M. Supersonic Shear Imaging: A New Technique for Soft Tissue Elasticity Mapping. IEEE Trans. Ultrason. Ferroelectr. Freq. Control 2004, 51, 396–409. [Google Scholar] [CrossRef]
- Bob, F.; Bota, S.; Sporea, I.; Sirli, R.; Petrica, L.; Schiller, A. Kidney shear wave speed values in subjects with and without renal pathology and inter-operator reproducibility of acoustic radiation force impulse Elastography (ARFI)—Preliminary results. PLoS ONE 2014, 9, e113761. [Google Scholar] [CrossRef]
- Takata, T.; Koda, M.; Sugihara, T.; Sugihara, S.; Okamoto, T.; Miyoshi, K.; Matono, T.; Hosho, K.; Mae, Y.; Iyama, T.; et al. Renal shear wave velocity by acoustic radiation force impulse did not reflect advanced renal impairment. Nephrology 2016, 21, 1056–1062. [Google Scholar] [CrossRef]
- Alan, B.; Göya, C.; Aktan, A.; Alan, S. Renal acoustic radiation force impulse elastography in the evaluation of coronary artery disease. Acta Radiol. 2017, 58, 156–163. [Google Scholar] [CrossRef]
- Bilgici, M.C.; Bekci, T.; Genc, G.; Tekcan, D.; Tomak, L. Acoustic Radiation Force Impulse Quantification in the Evaluation of Renal Parenchyma Elasticity in Pediatric Patients With Chronic Kidney Disease: Preliminary Results. J. Ultrasound. Med. 2017, 36, 1555–1561. [Google Scholar] [CrossRef]
- Lee, J.; Oh, Y.T.; Joo, D.J.; Ma, B.G.; Lee, A.L.; Lee, J.G.; Song, S.H.; Kim, S.U.; Jung, D.C.; Chung, Y.E.; et al. Acoustic radiation force impulse measurement in renal transplantation: A prospective, longitudinal study with protocol biopsies. Medicine 2015, 94, e1590. [Google Scholar] [CrossRef] [PubMed]
- Grosu, I.; Bob, F.; Sporea, I.; Popescu, A.; Şirli, R.; Schiller, A. Correlation of point shear wave velocity and kidney function in chronic kidney disease. J. Ultrasound Med. 2018, 37, 2613–2620. [Google Scholar] [CrossRef] [PubMed]
- Yu, N.; Zhang, Y.; Xu, Y. Value of Virtual Touch tissue quantification in stages of diabetic kidney disease. J. Ultrasound Med. 2014, 33, 787–792. [Google Scholar] [CrossRef] [PubMed]
- Cui, G.; Yang, Z.; Zhang, W.; Li, B.; Sun, F.; Xu, C.; Wang, K. Evaluation of acoustic radiation force impulse imaging for the clinicopathological typing of renal fibrosis. Exp. Ther. Med. 2013, 7, 233–235. [Google Scholar] [CrossRef] [PubMed]
- Yang, X.; Yu, N.; Yu, J.; Wang, H.; Li, X. Virtual Touch Tissue Quantification for Assessing Renal Pathology in Idiopathic Nephrotic Syndrome. Ultrasound Med. Biol. 2018, 44, 1318–1326. [Google Scholar] [CrossRef]
- Yoǧurtçuoǧlu, B.; Damar, Ç. Renal elastography measurements in children with acute glomerulonephritis. Ultrasonography 2021, 40, 575–583. [Google Scholar] [CrossRef]
- Maralescu, F.-M.; Chiodan, M.; Sircuta, A.; Schiller, A.; Petrica, L.; Bob, F. Are the Currently Available Elastography Methods Useful in the Assessment of Chronic Kidney Disease? A Systematic Review and a Meta-Analysis. Appl. Sci. 2022, 12, 2359. [Google Scholar] [CrossRef]
- Leong, S.S.; Wong, J.H.D.; Shah, M.N.M.; Vijayananthan, A.; Jalalonmuhali, M.; Sharif, N.H.M.; Abas, N.K.; Ng, K.H. Stiffness and Anisotropy Effect on Shear Wave Elastography: A Phantom and in Vivo Renal Study. Ultrasound Med. Biol. 2020, 46, 34–45. [Google Scholar] [CrossRef]
- Bob, F.; Grosu, I.; Sporea, I.; Timar, R.; Lighezan, D.; Popescu, A.; Sirli, R.; Buzas, R.; Petrica, L.; Munteanu, M.; et al. Is Kidney Stiffness Measured Using Elastography Influenced Mainly by Vascular Factors in Patients with Diabetic Kidney Disease? Ultrason. Imaging 2018, 40, 300–309. [Google Scholar] [CrossRef]
- Cosgrove, D.; Piscaglia, F.; Bamber, J.; Bojunga, J.; Correas, J.M.; Gilja, O.H.; Klauser, A.S.; Sporea, I.; Calliada, F.; Cantisani, V.; et al. EFSUMB Guidelines and Recommendations on the clinical use of ultrasound elastographypart 2, Clinical applications. Ultraschall Der Med. 2013, 34, 238–253. [Google Scholar] [CrossRef]
- Czaja, A.J. Hepatic inflammation and progressive liver fibrosis in chronic liver disease. World J. Gastroenterol. 2014, 20, 2515–2532. [Google Scholar] [CrossRef] [PubMed]
- Sugimoto, K.; Moriyasu, F.; Oshiro, H.; Takeuchi, H.; Yoshimasu, Y.; Kasai, Y.; Furuichi, Y.; Itoi, T. Viscoelasticity Measurement in Rat Livers Using Shear-Wave US Elastography. Ultrasound Med. Biol. 2018, 44, 2018–2024. [Google Scholar] [CrossRef] [PubMed]
- Deffieux, T.; Gennisson, J.-L.; Bousquet, L.; Corouge, M.; Cosconea, S.; Amroun, D.; Tripon, S.; Terris, B.; Mallet, V.; Sogni, P.; et al. Investigating liver stiffness and viscosity for fibrosis, steatosis and activity staging using shear wave elastography. J. Hepatol. 2015, 62, 317–324. [Google Scholar] [CrossRef] [PubMed]
- Hwang, J.; Kim, H.W.; Kim, P.H.; Suh, C.H.; Yoon, H.M. Technical Performance of Acoustic Radiation Force Impulse Imaging for Measuring Renal Parenchymal Stiffness: A Systematic Review and Meta-Analysis. J. Ultrasound Med. 2021, 40, 2639–2653. [Google Scholar] [CrossRef] [PubMed]
- Albai, O.; Frandes, M.; Timar, B.; Paun, D.L.; Roman, D.; Timar, R. Long-term risk of malignant neoplastic disorders in type 2 diabetes mellitus patients with metabolic syndrome. Diabetes Metab. Syndr. Obes. 2020, 13, 1317–1326. [Google Scholar] [CrossRef]


| Variable | Subjects (n = 50; 29 Women/21 Men) |
|---|---|
| Age (years) | 42.22 ± 13.17 |
| eGFR (mL/min/1.73m2) | 97.12 ± 11 |
| Kidney length (cm) | 10.16 ± 0.66 |
| BMI (kg/m2) | 24.24 ± 3.98 |
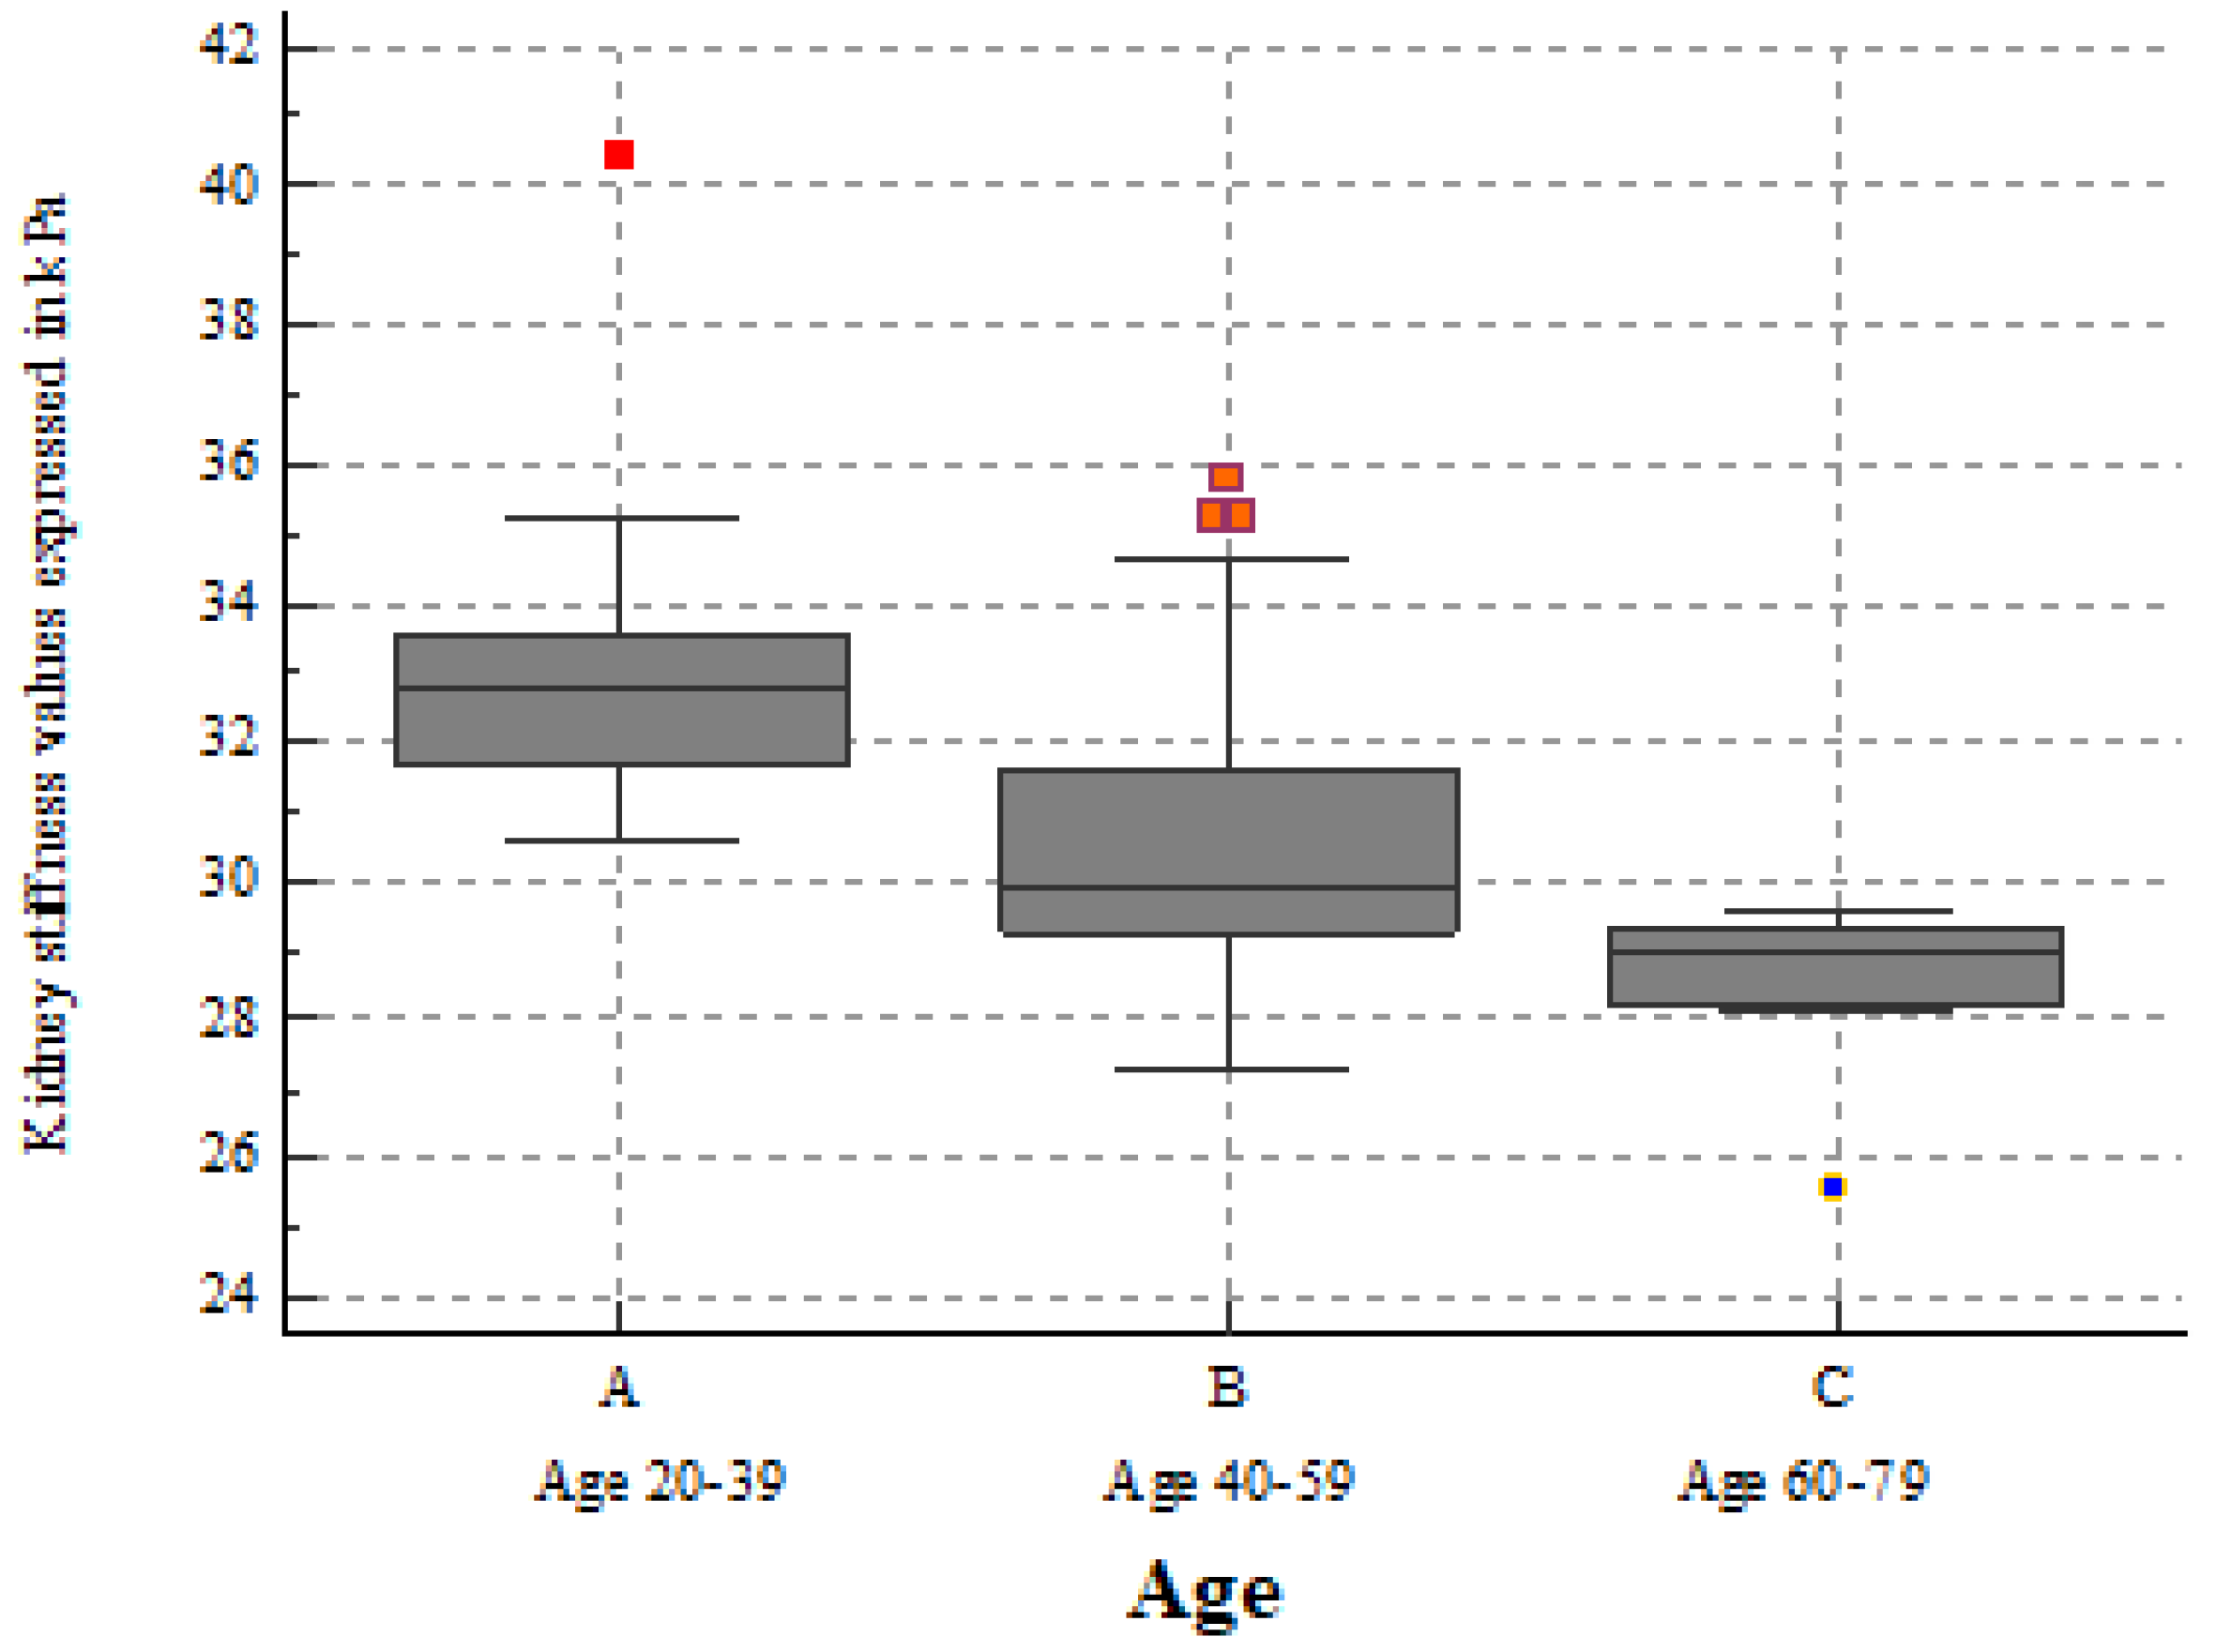
| Factor (Age Sub-Group) | n | Mean 2D-SWE PLUS Values (kPa) | SD | Different (p < 0.05) from Factor no. |
|---|---|---|---|---|
| n = 23 | 32.9630 | 2.0425 | (2)(3) |
| n = 18 | 30.9278 | 2.5677 | (1)(3) |
| n = 9 | 28.5187 | 1.2970 | (1)(2) |
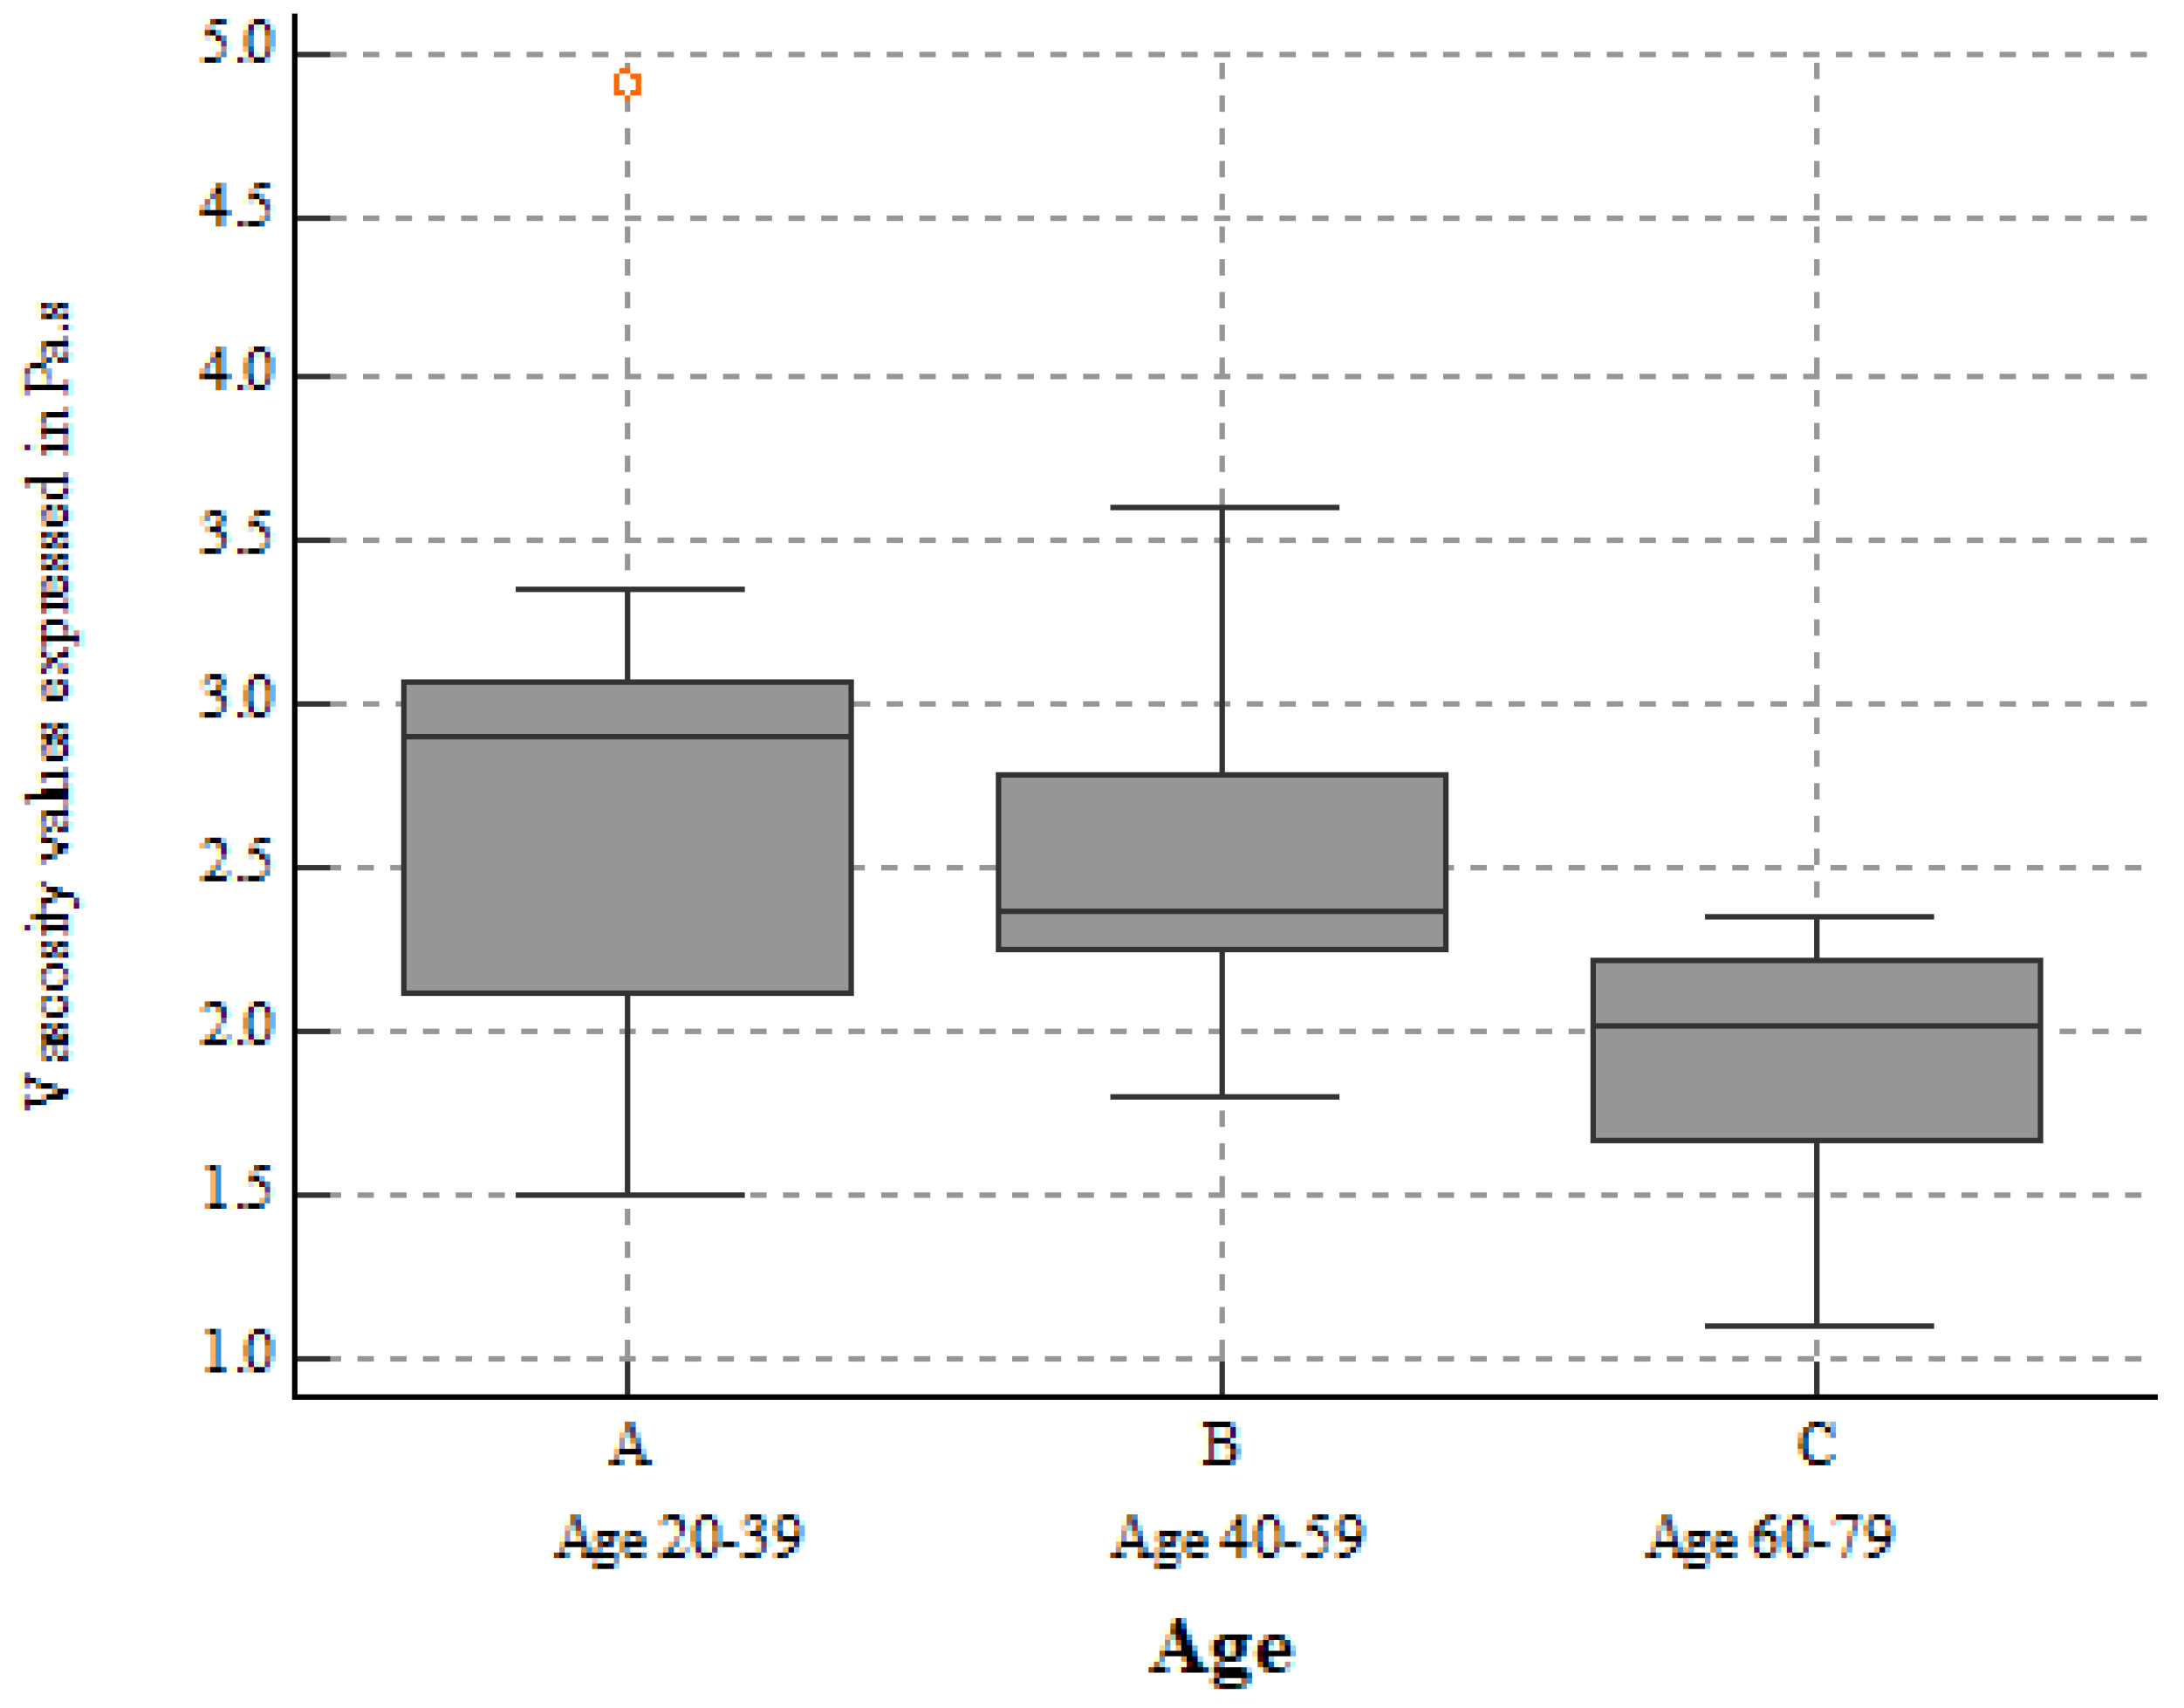
| Factor (Age Sub-Group) | n | Mean Vi PLUS Values (Pa.s) | SD | Different (p < 0.05) from Factor no. |
|---|---|---|---|---|
| n = 23 | 2.6891 | 0.7274 | (3) |
| n = 18 | 2.5528 | 0.5524 | - |
| n = 9 | 1.9125 | 0.4241 | (1) |
Publisher’s Note: MDPI stays neutral with regard to jurisdictional claims in published maps and institutional affiliations. |
© 2022 by the authors. Licensee MDPI, Basel, Switzerland. This article is an open access article distributed under the terms and conditions of the Creative Commons Attribution (CC BY) license (https://creativecommons.org/licenses/by/4.0/).
Share and Cite
Maralescu, F.-M.; Bende, F.; Sporea, I.; Popescu, A.; Sirli, R.; Schiller, A.; Petrica, L.; Miutescu, B.; Borlea, A.; Popa, A.; et al. Non-Invasive Evaluation of Kidney Elasticity and Viscosity in a Healthy Cohort. Biomedicines 2022, 10, 2859. https://doi.org/10.3390/biomedicines10112859
Maralescu F-M, Bende F, Sporea I, Popescu A, Sirli R, Schiller A, Petrica L, Miutescu B, Borlea A, Popa A, et al. Non-Invasive Evaluation of Kidney Elasticity and Viscosity in a Healthy Cohort. Biomedicines. 2022; 10(11):2859. https://doi.org/10.3390/biomedicines10112859
Chicago/Turabian StyleMaralescu, Felix-Mihai, Felix Bende, Ioan Sporea, Alina Popescu, Roxana Sirli, Adalbert Schiller, Ligia Petrica, Bogdan Miutescu, Andreea Borlea, Alexandru Popa, and et al. 2022. "Non-Invasive Evaluation of Kidney Elasticity and Viscosity in a Healthy Cohort" Biomedicines 10, no. 11: 2859. https://doi.org/10.3390/biomedicines10112859
APA StyleMaralescu, F.-M., Bende, F., Sporea, I., Popescu, A., Sirli, R., Schiller, A., Petrica, L., Miutescu, B., Borlea, A., Popa, A., Bodea, M., & Bob, F. (2022). Non-Invasive Evaluation of Kidney Elasticity and Viscosity in a Healthy Cohort. Biomedicines, 10(11), 2859. https://doi.org/10.3390/biomedicines10112859