
Physical Exercise Promotes DNase Activity Enhancing the Capacity to Degrade Neutrophil Extracellular Traps
 , ,
, ,  , ,
, ,  and
and
Abstract
1. Introduction
2. Materials and Methods
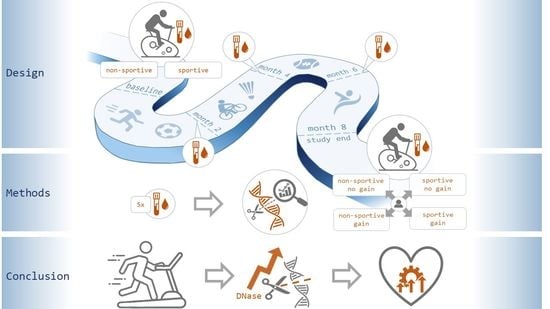
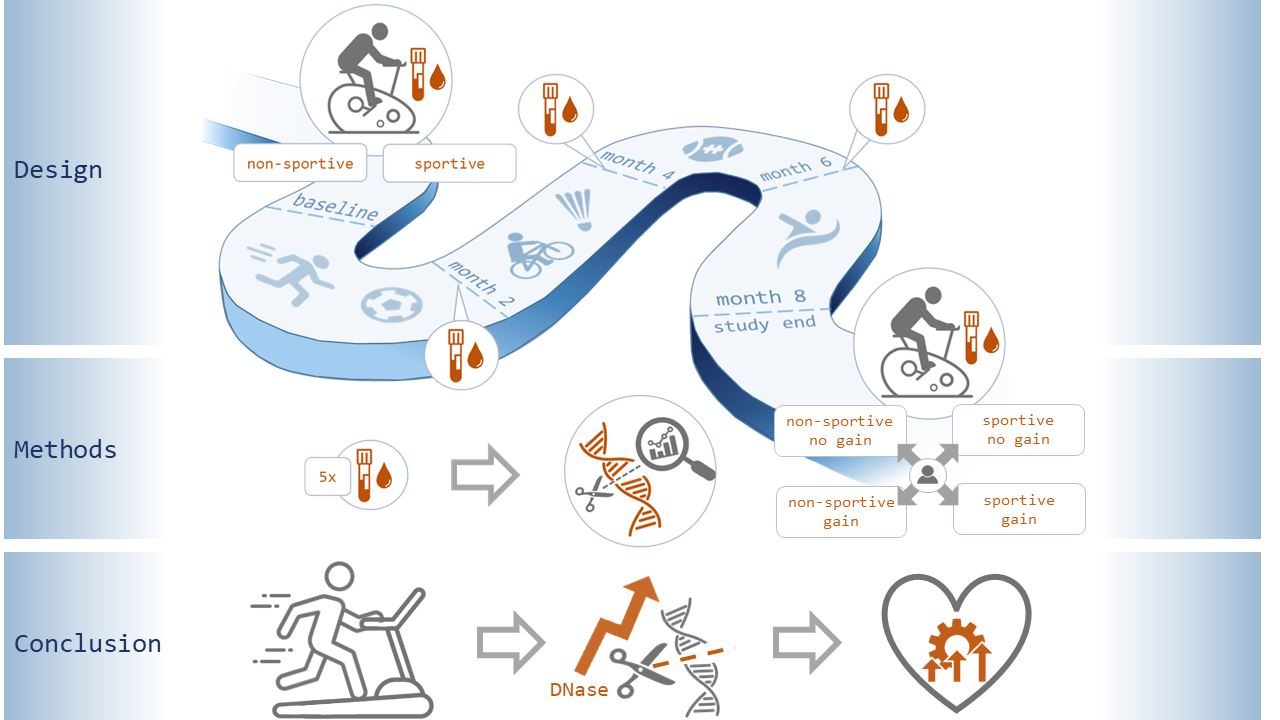
2.1. Study Protocol
- Diagnosed chronic heart disease with prior myocardial infarction, CABG, PCI or stroke.
- A positive family anamnesis of first-degree relatives (mother or father) regarding CVD or stroke.
- The presence of one or more metabolic risk factors, including overweight (BMI > 25), diabetes mellitus (HbA1c > 6.5% or the presence of antidiabetic medication), dyslipidemia (marked by statin intake) and arterial hypertension (resting SBP > 140 mmHg/resting DBP > 85 mmHg or the presence of antihypertensive medication).
- A positive smoking status.
2.2. Assessment of Patient Medical History and Definitions
2.3. Bicycle Stress Test (Ergometry) and Continous Endurance Training
2.4. Blood Collection and Routine Laboratory Testing
2.5. Measurement of cfDNA and DNase Activity
2.6. Statistical Analysis
3. Results
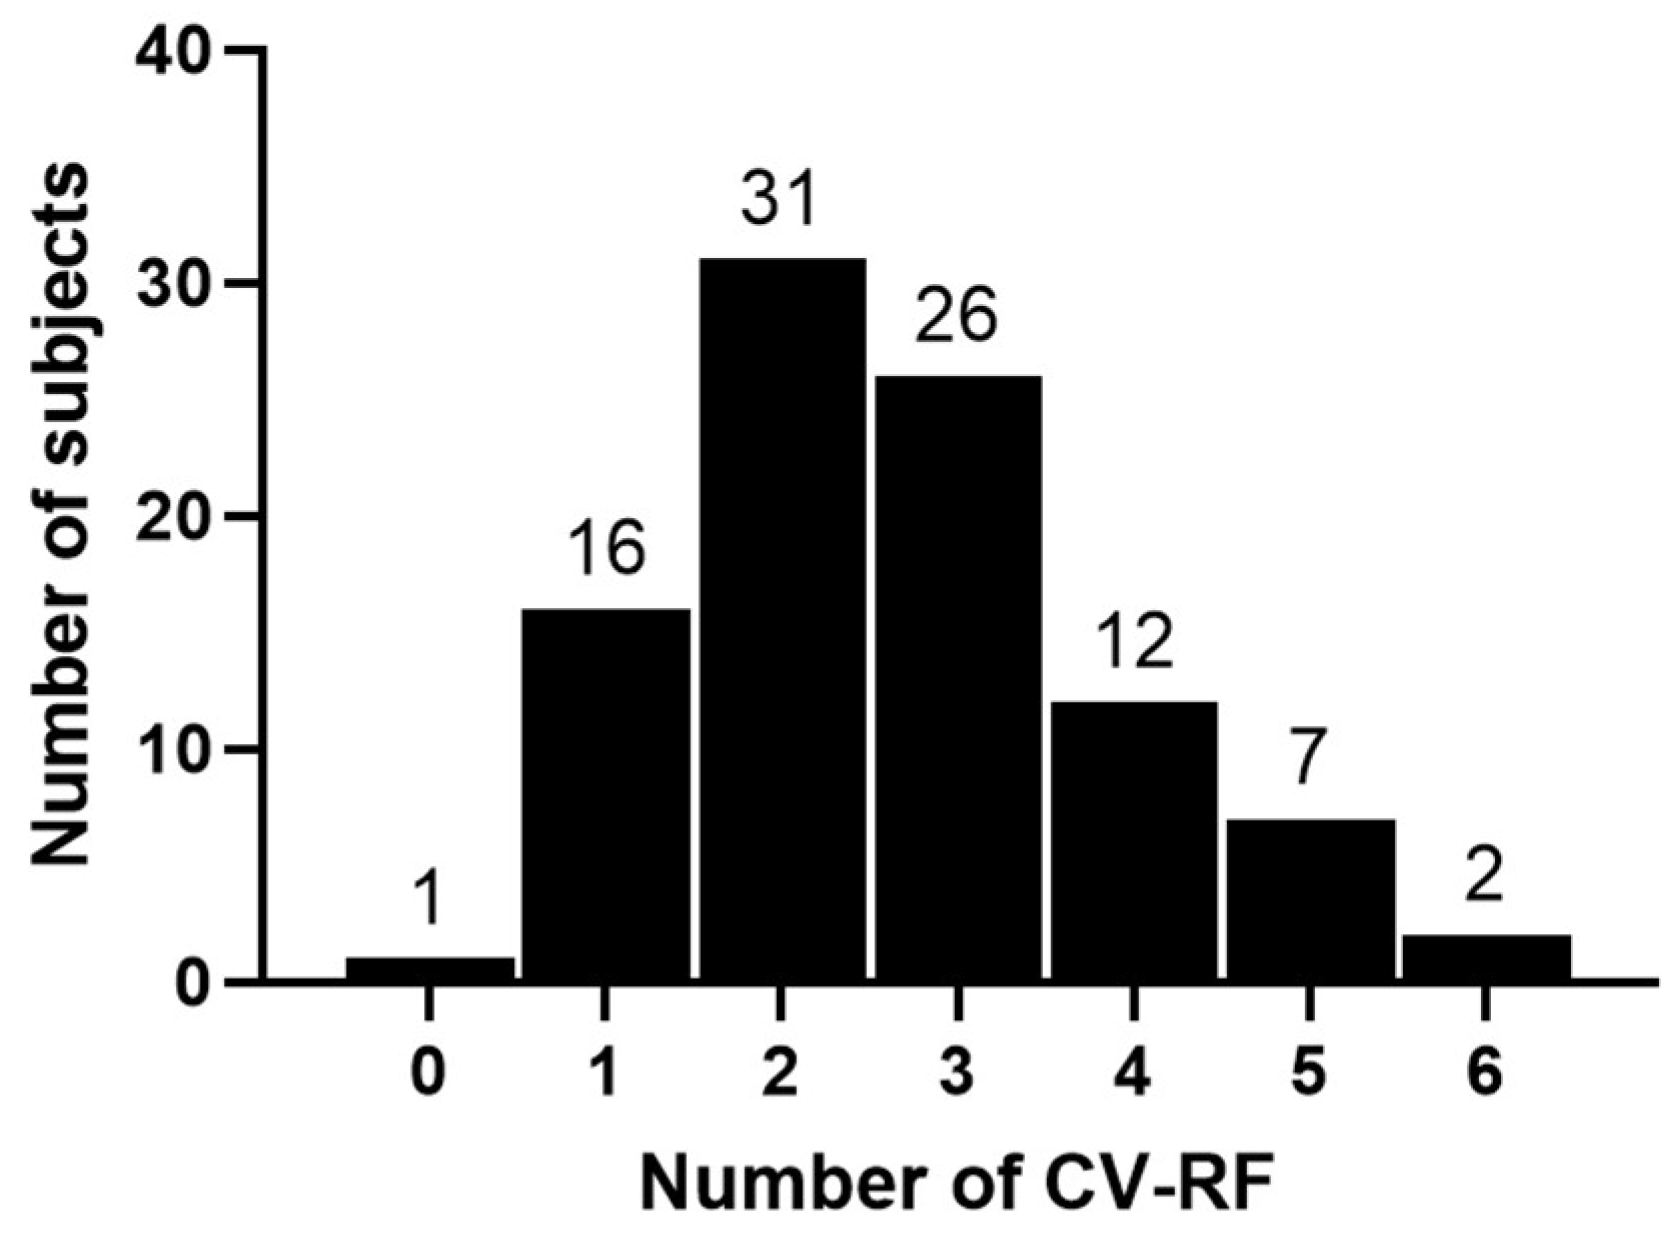
3.1. Patient Baseline Characteristics
3.2. Predictors of cfDNA Levels and DNase Activity at Baseline
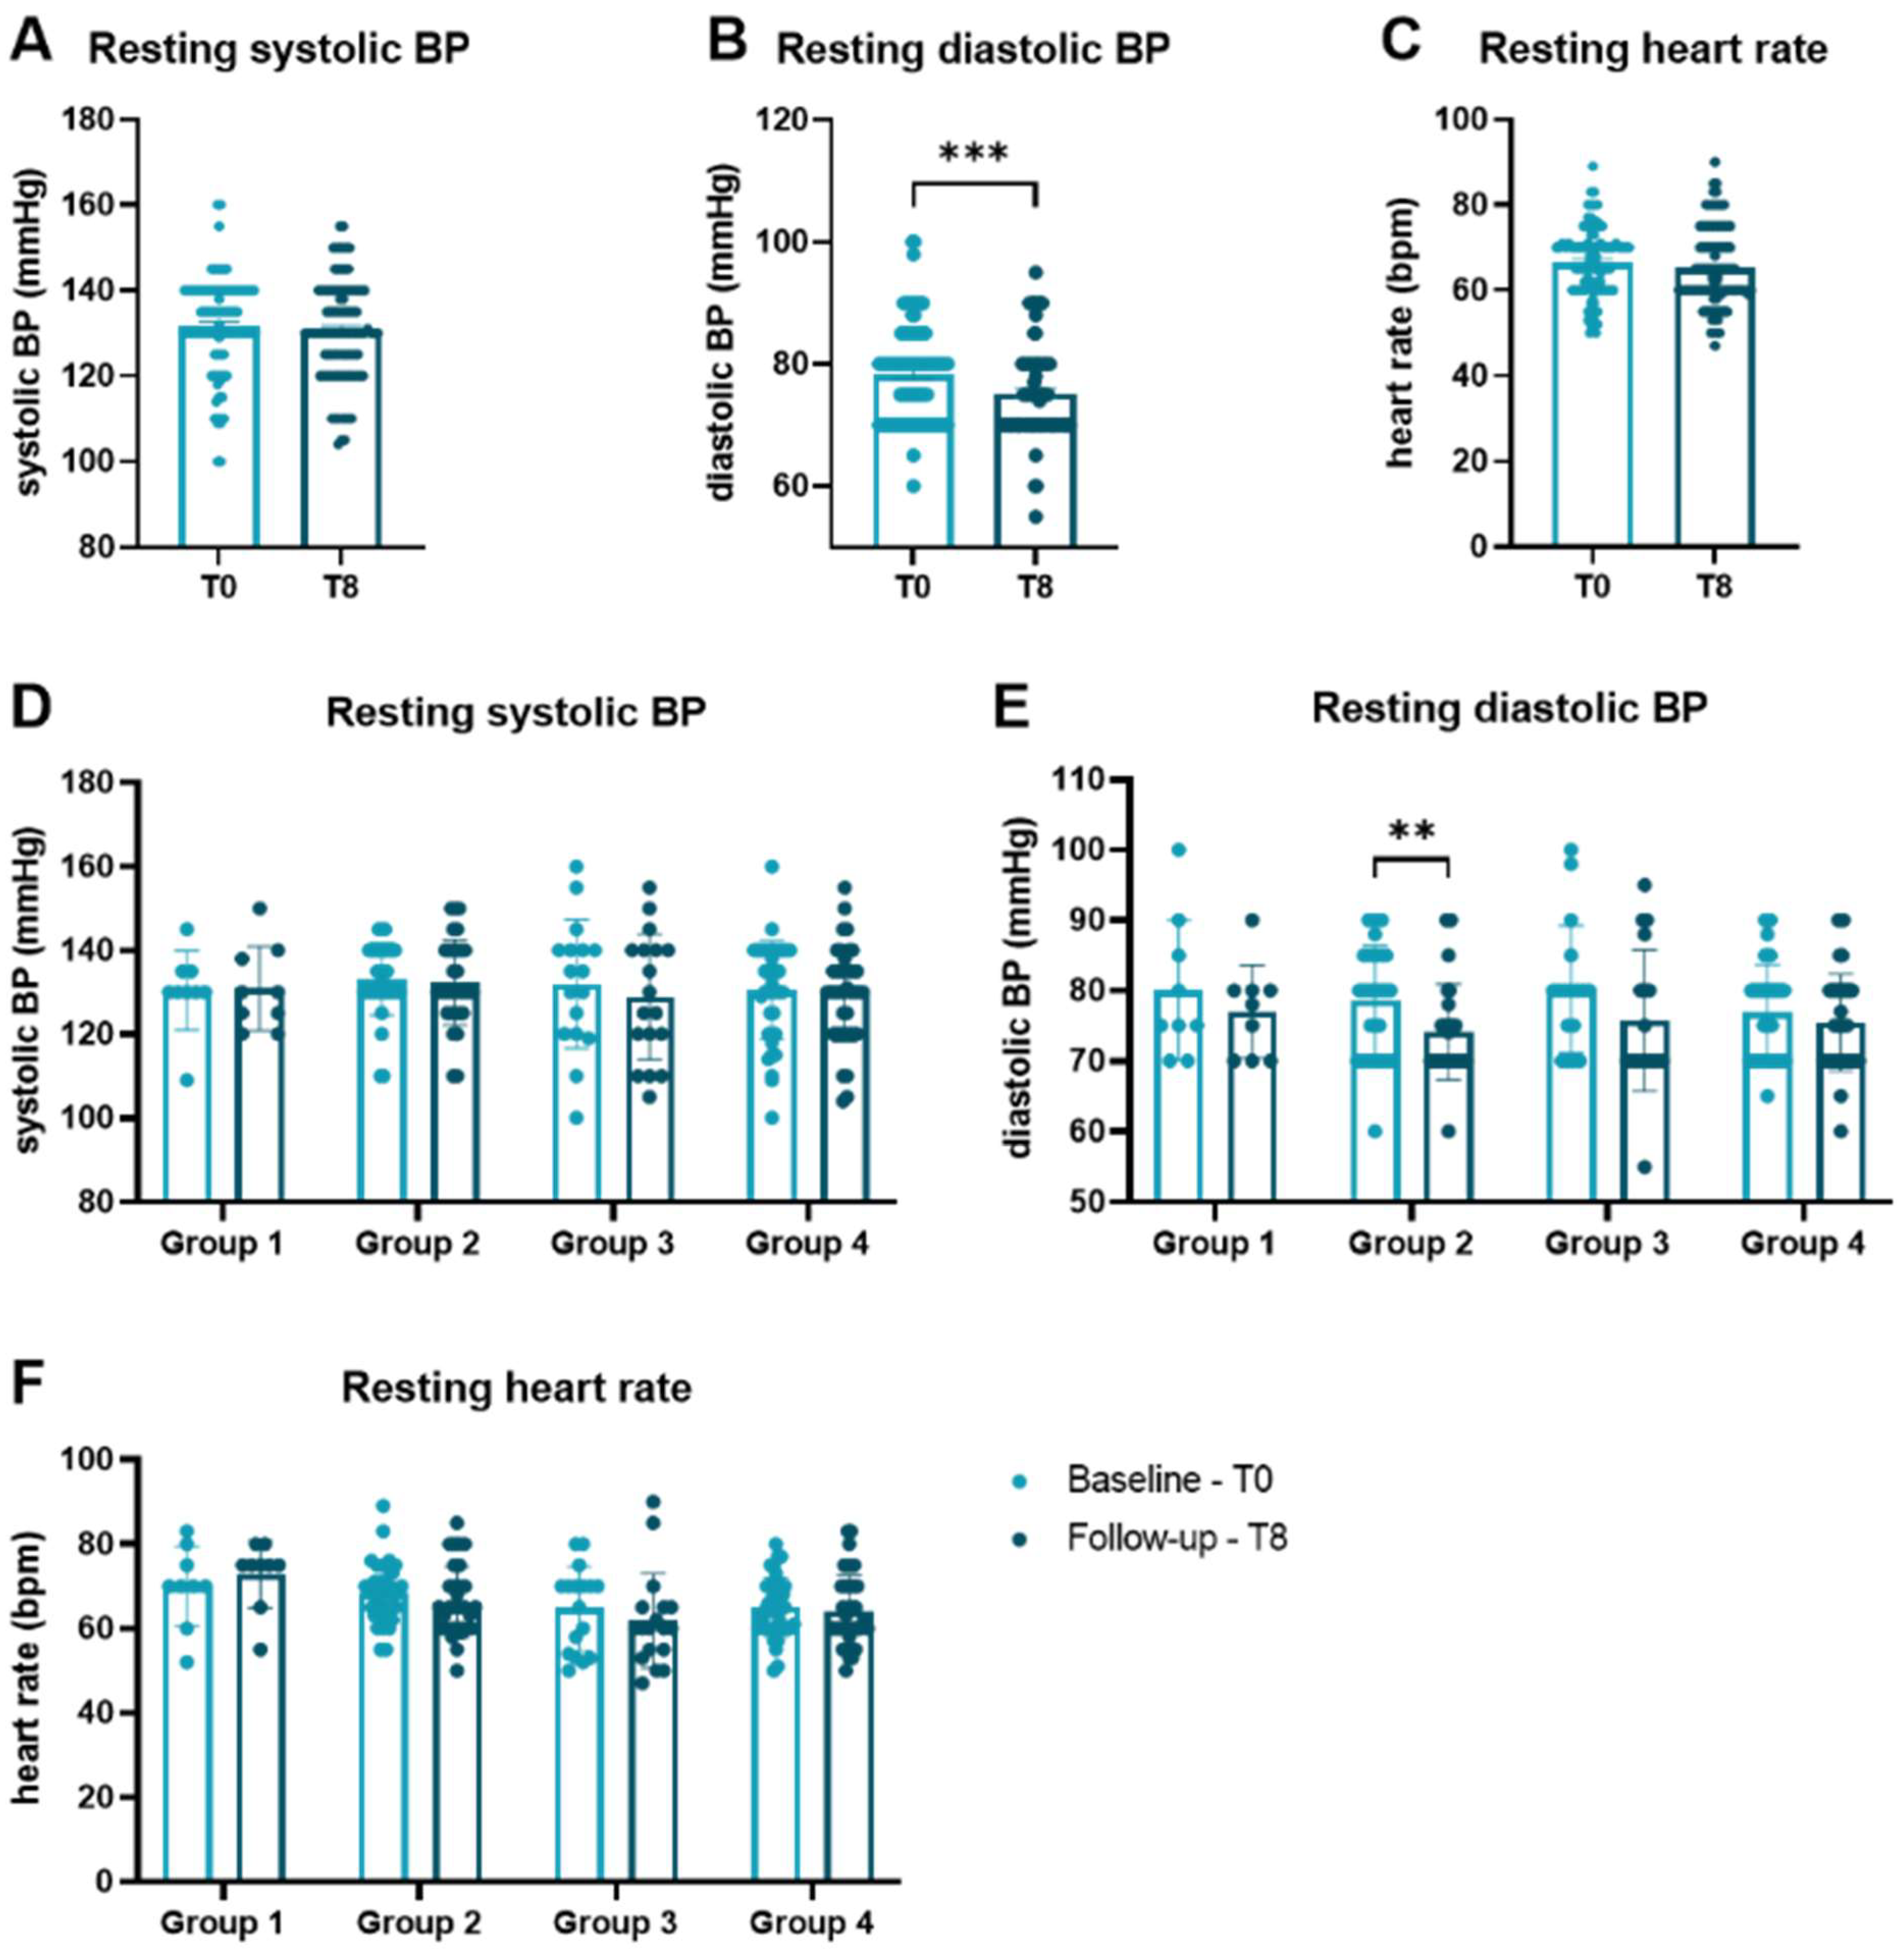
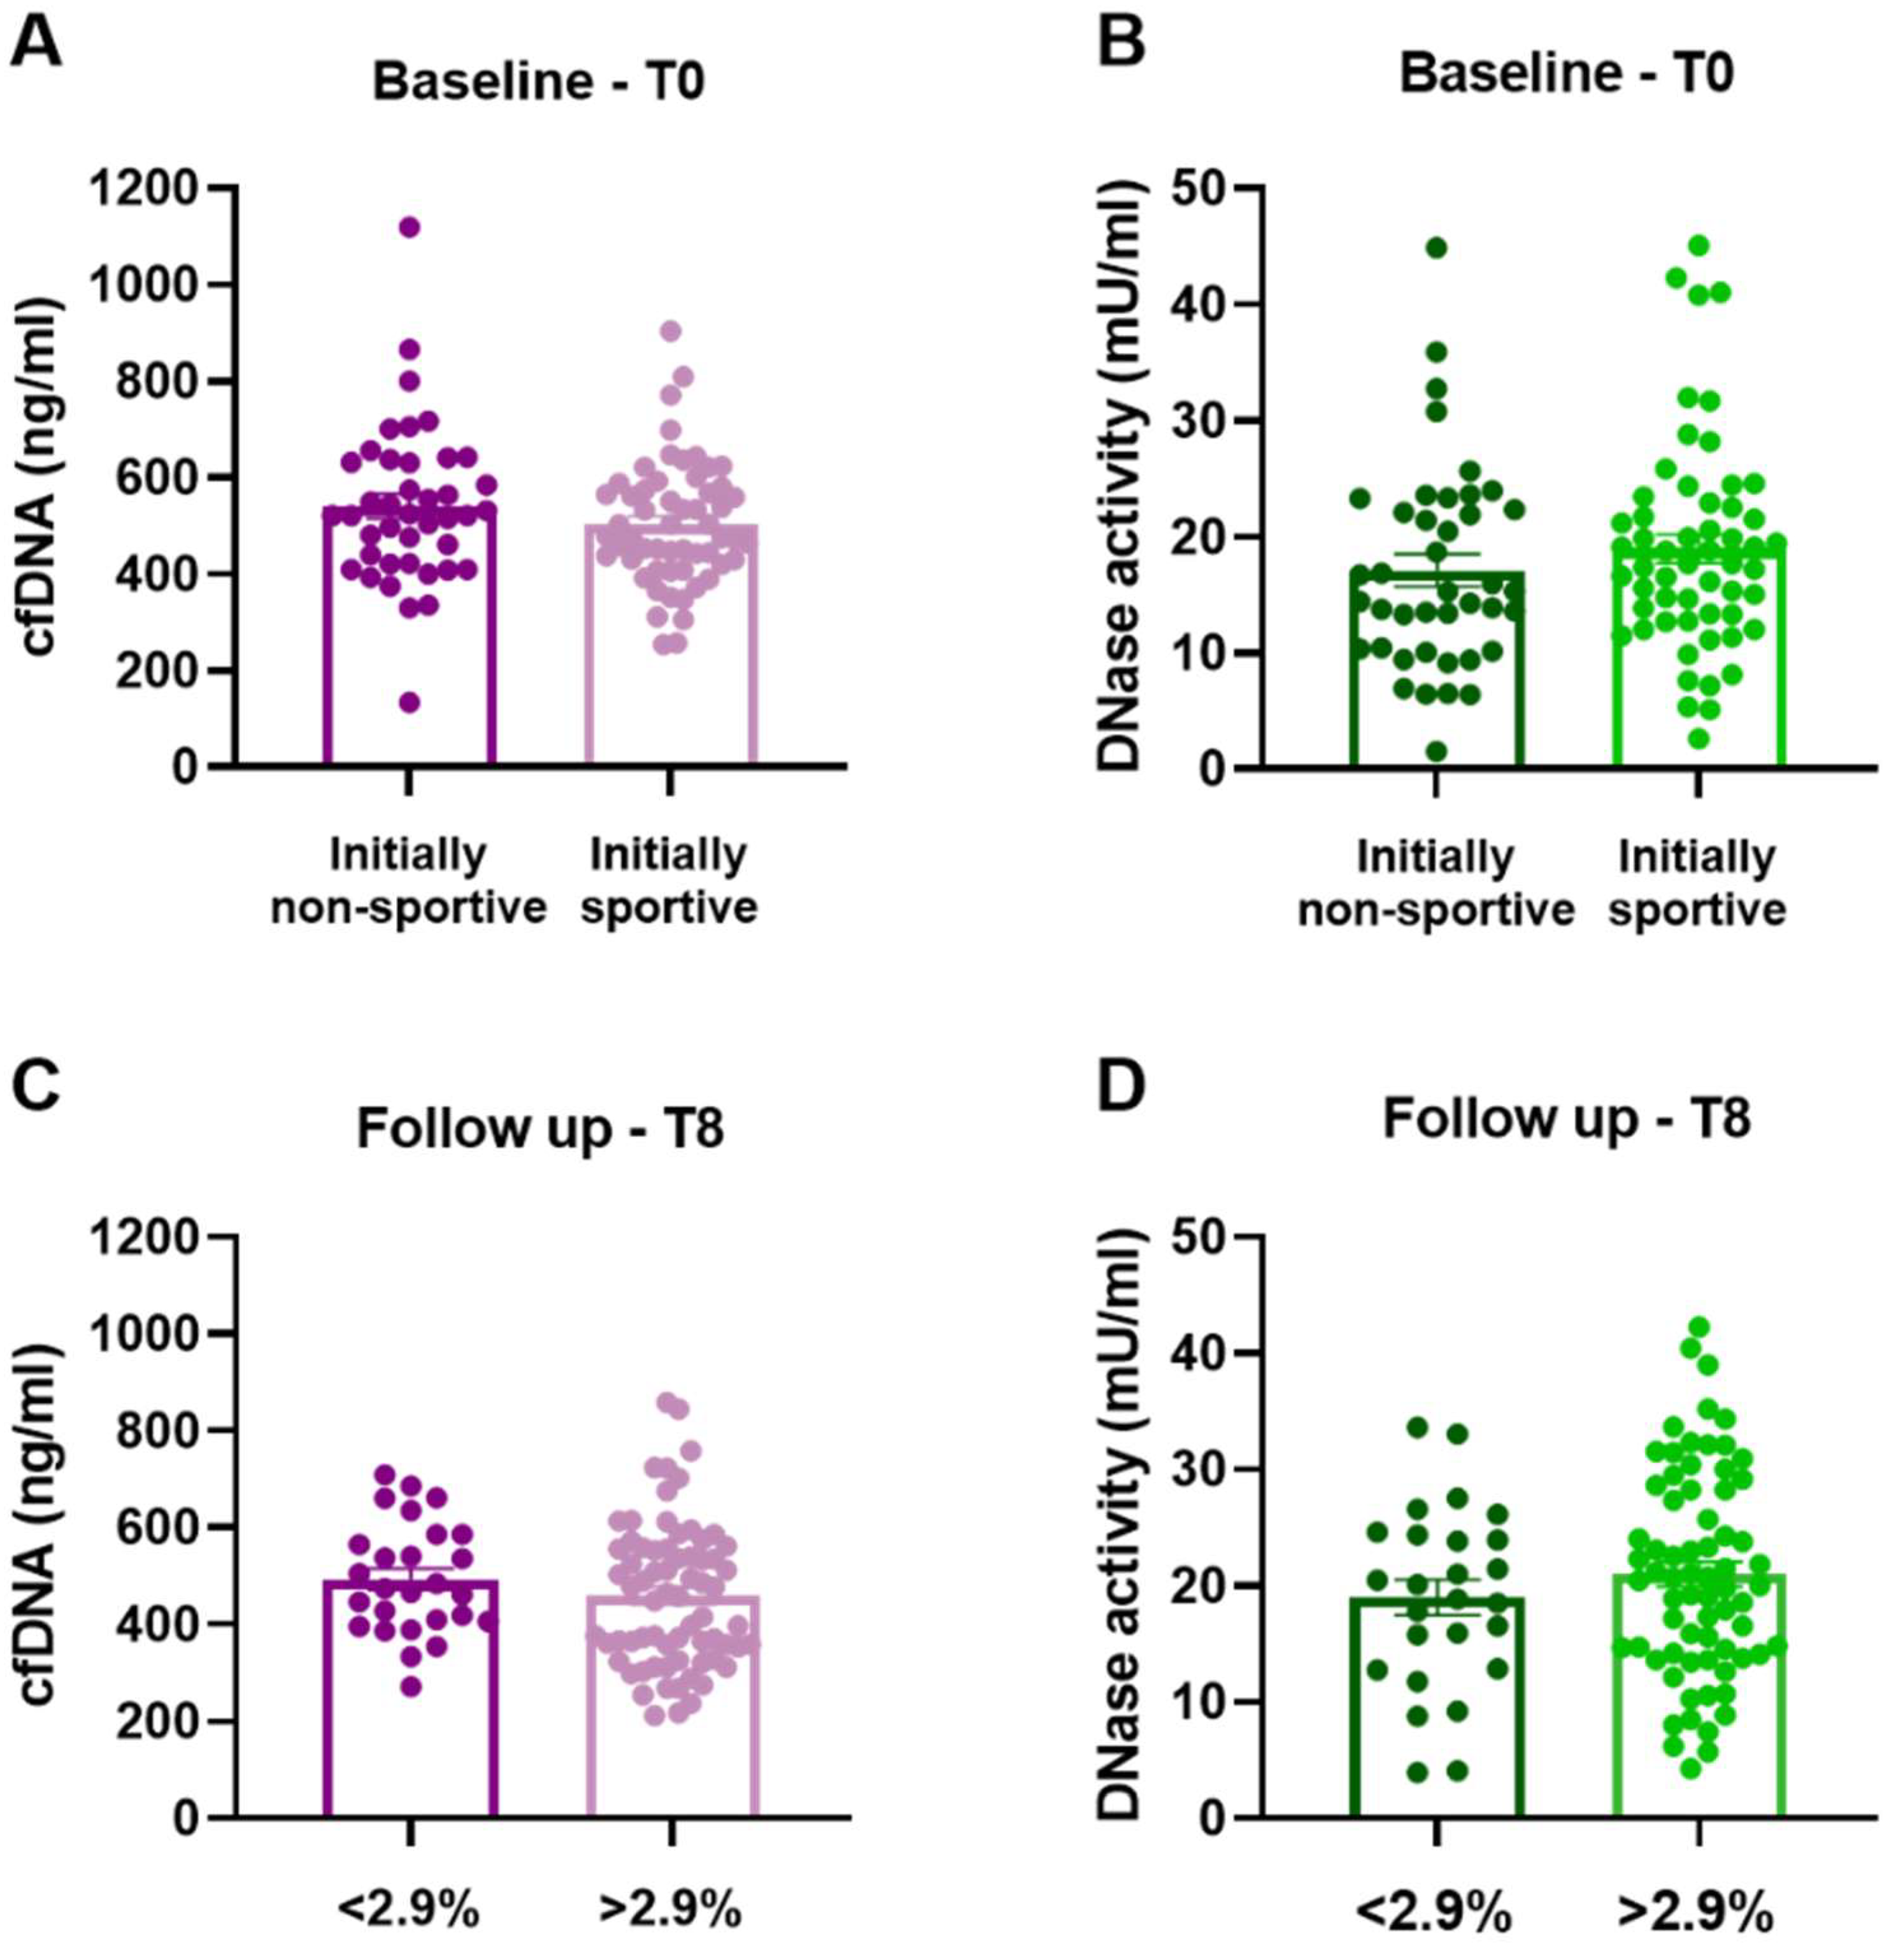
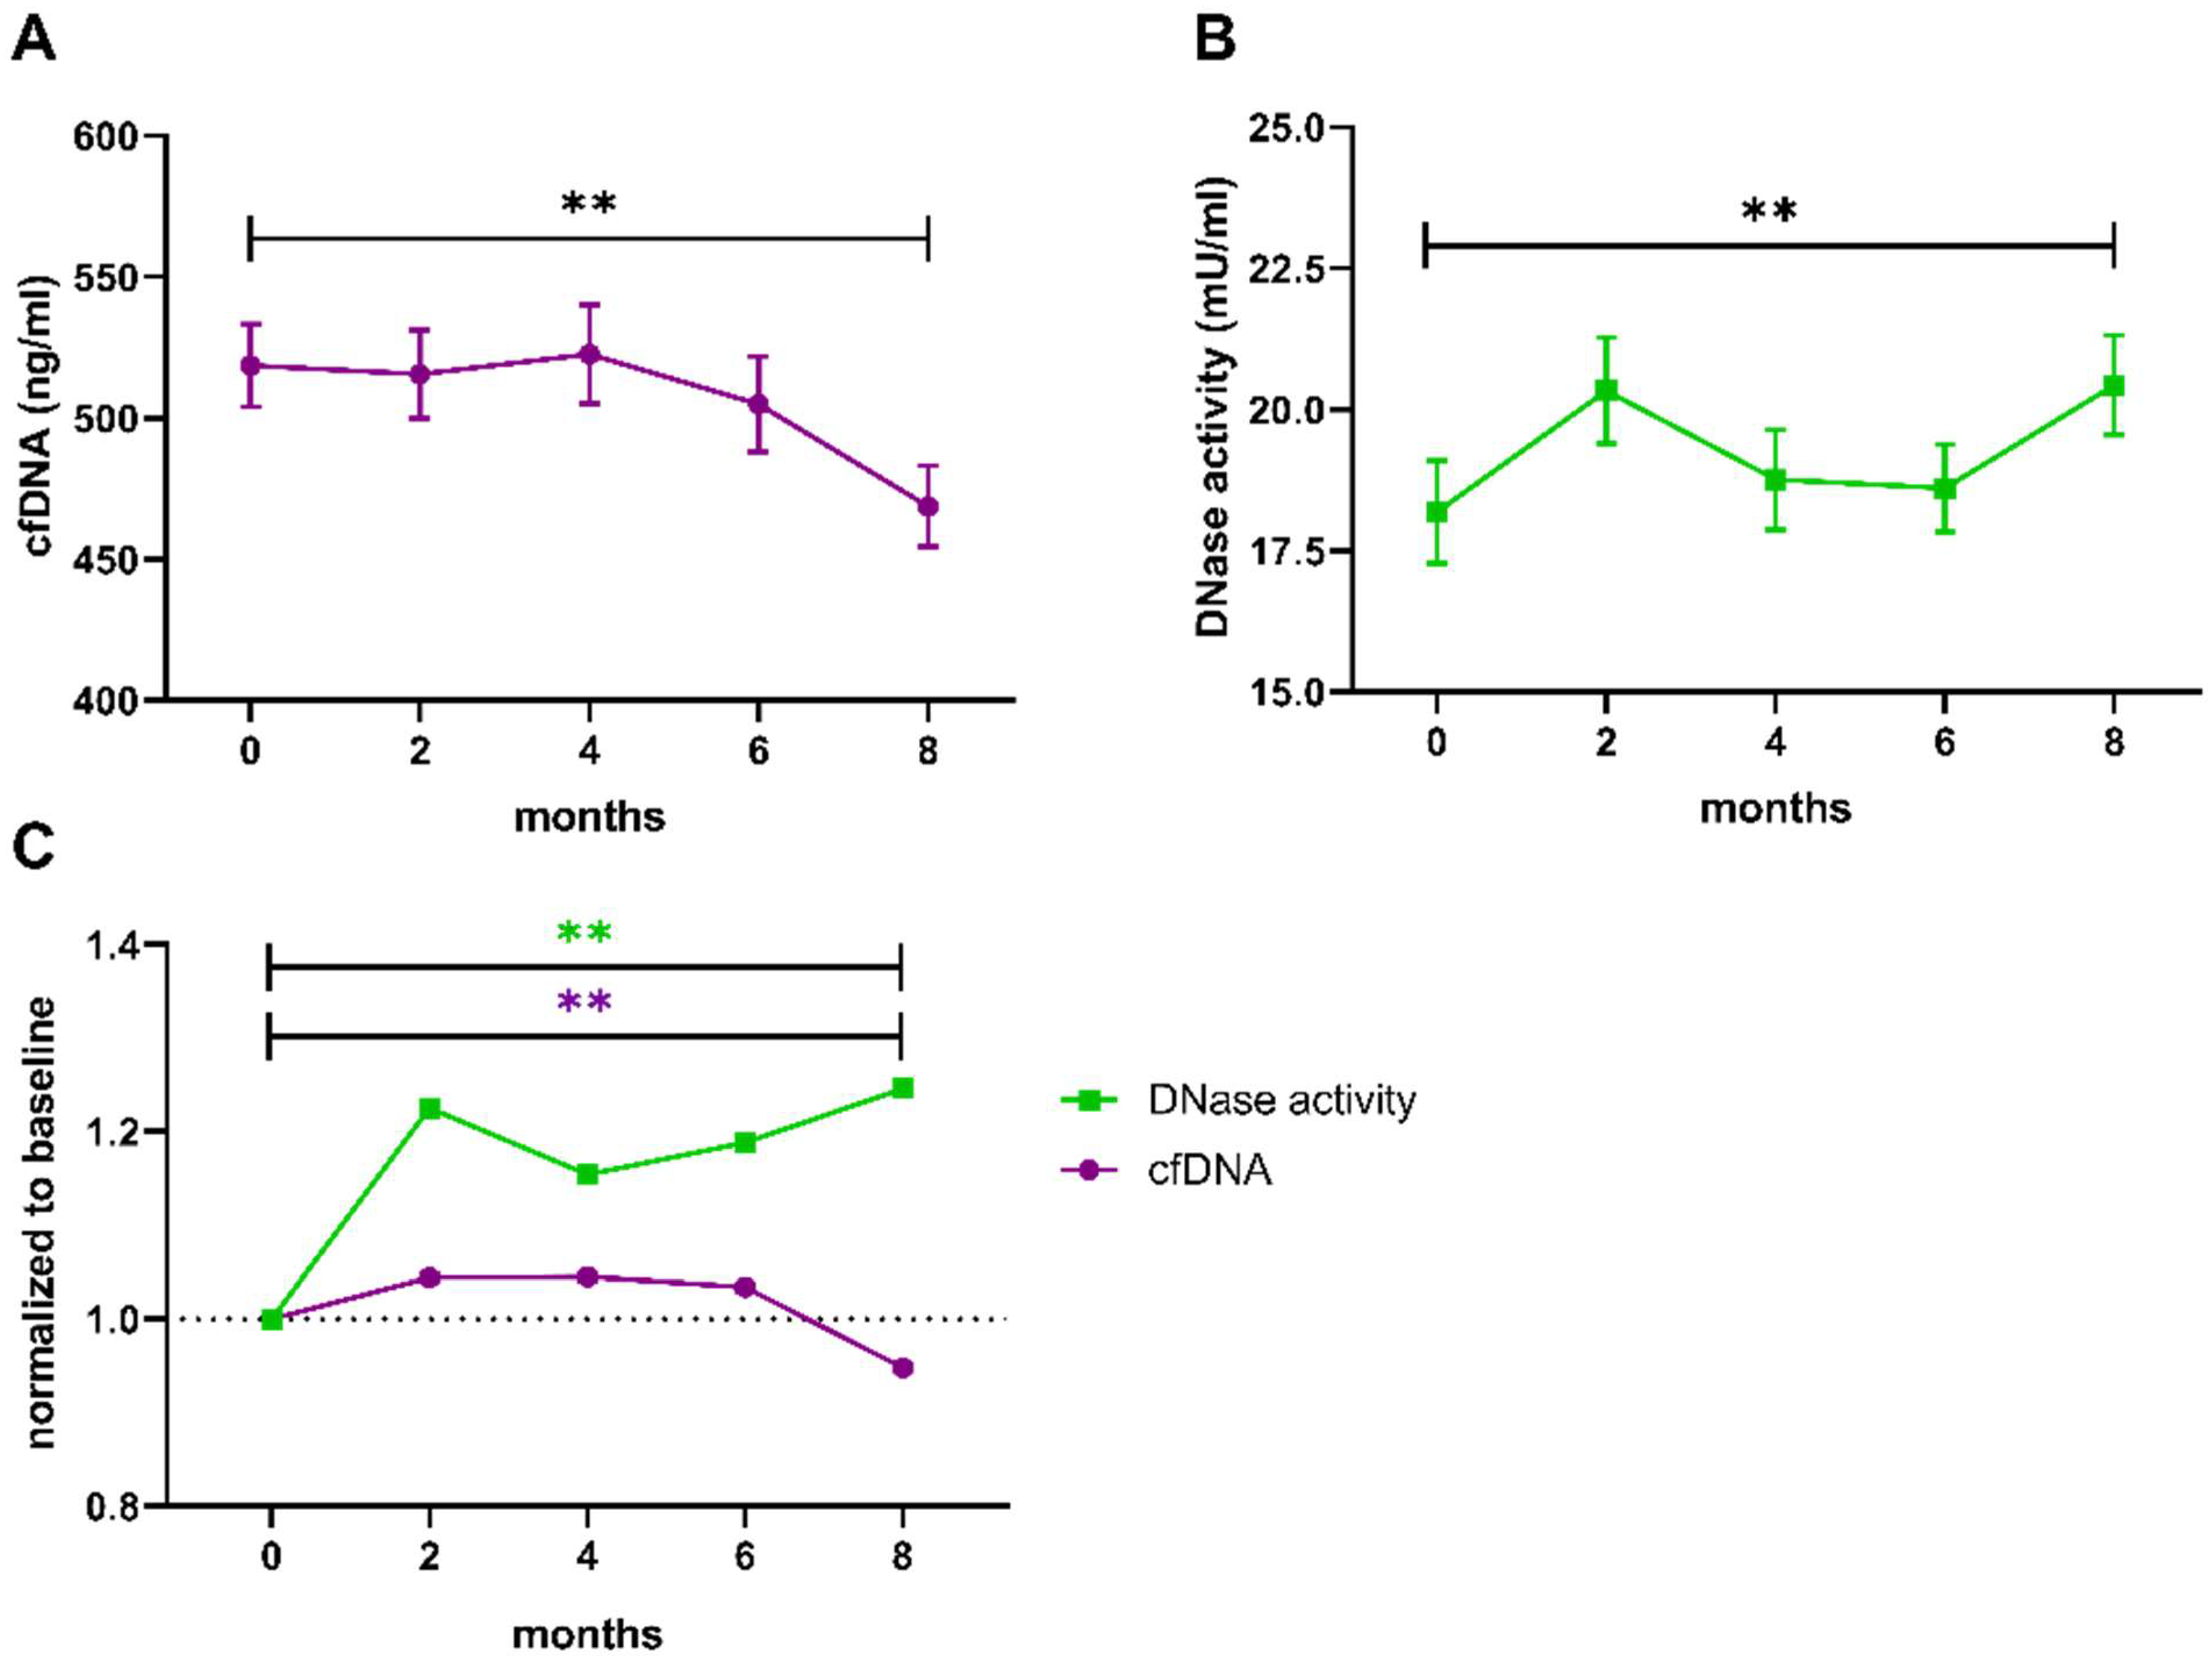
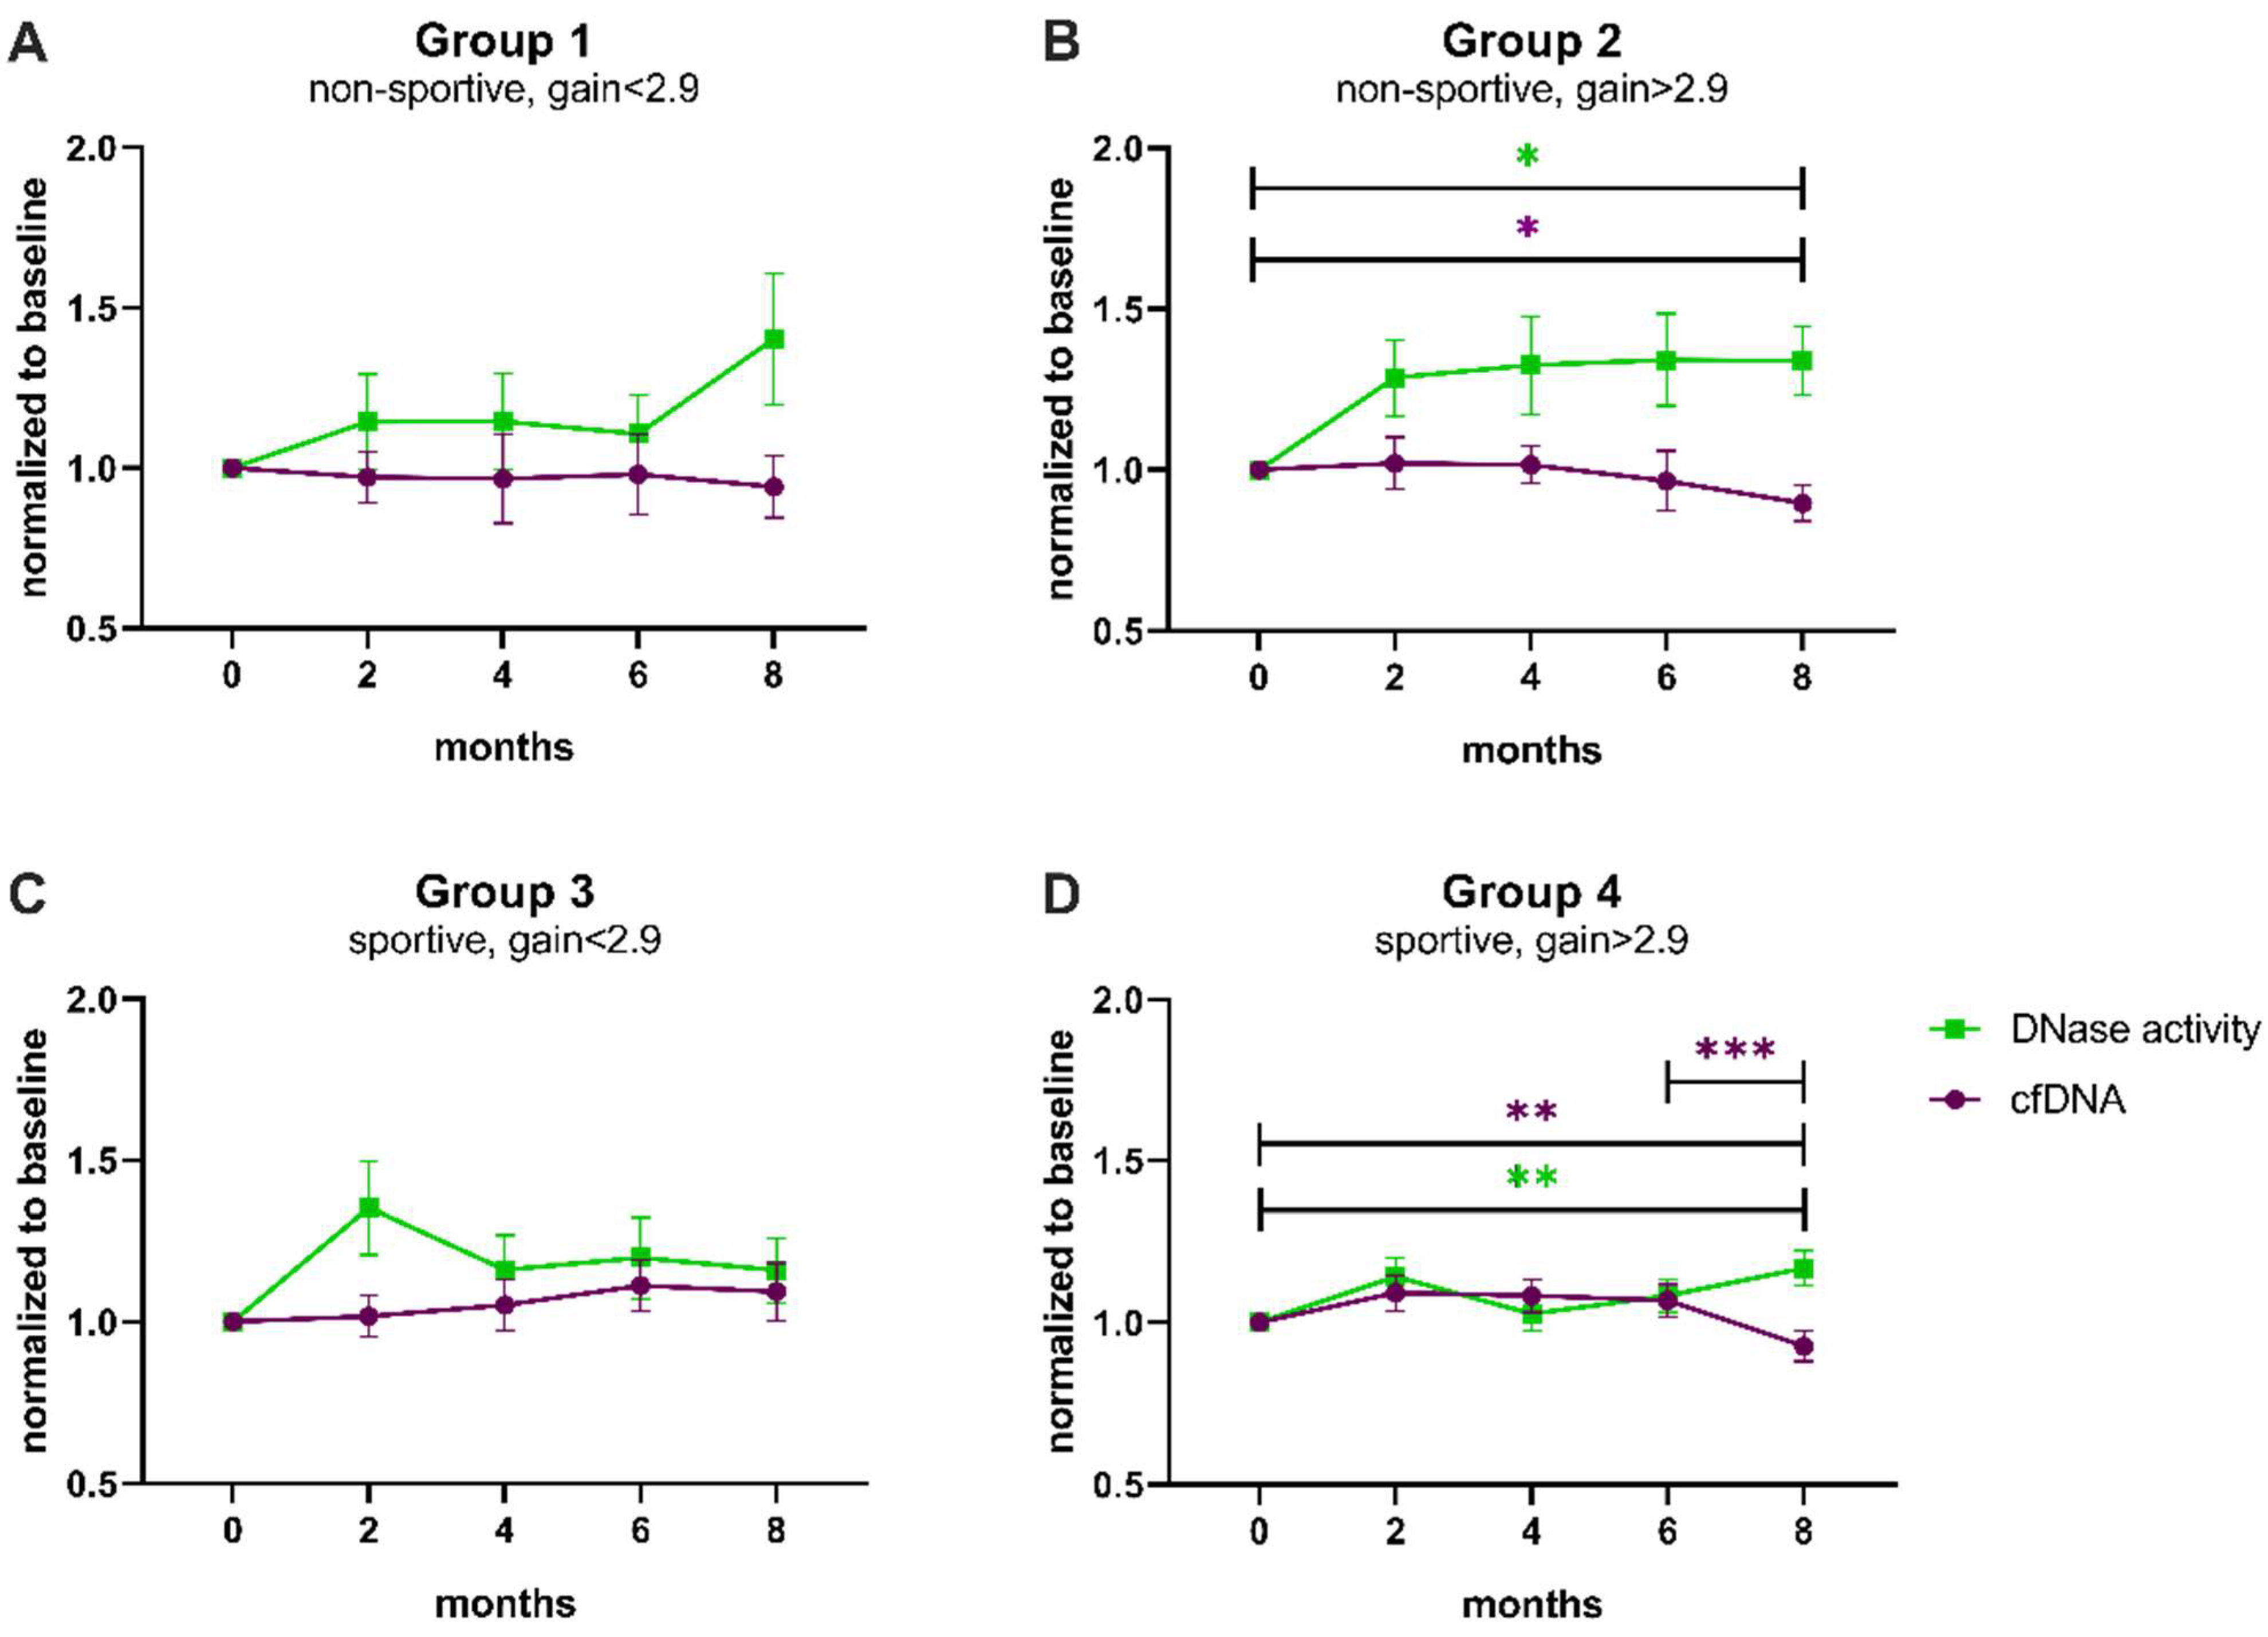
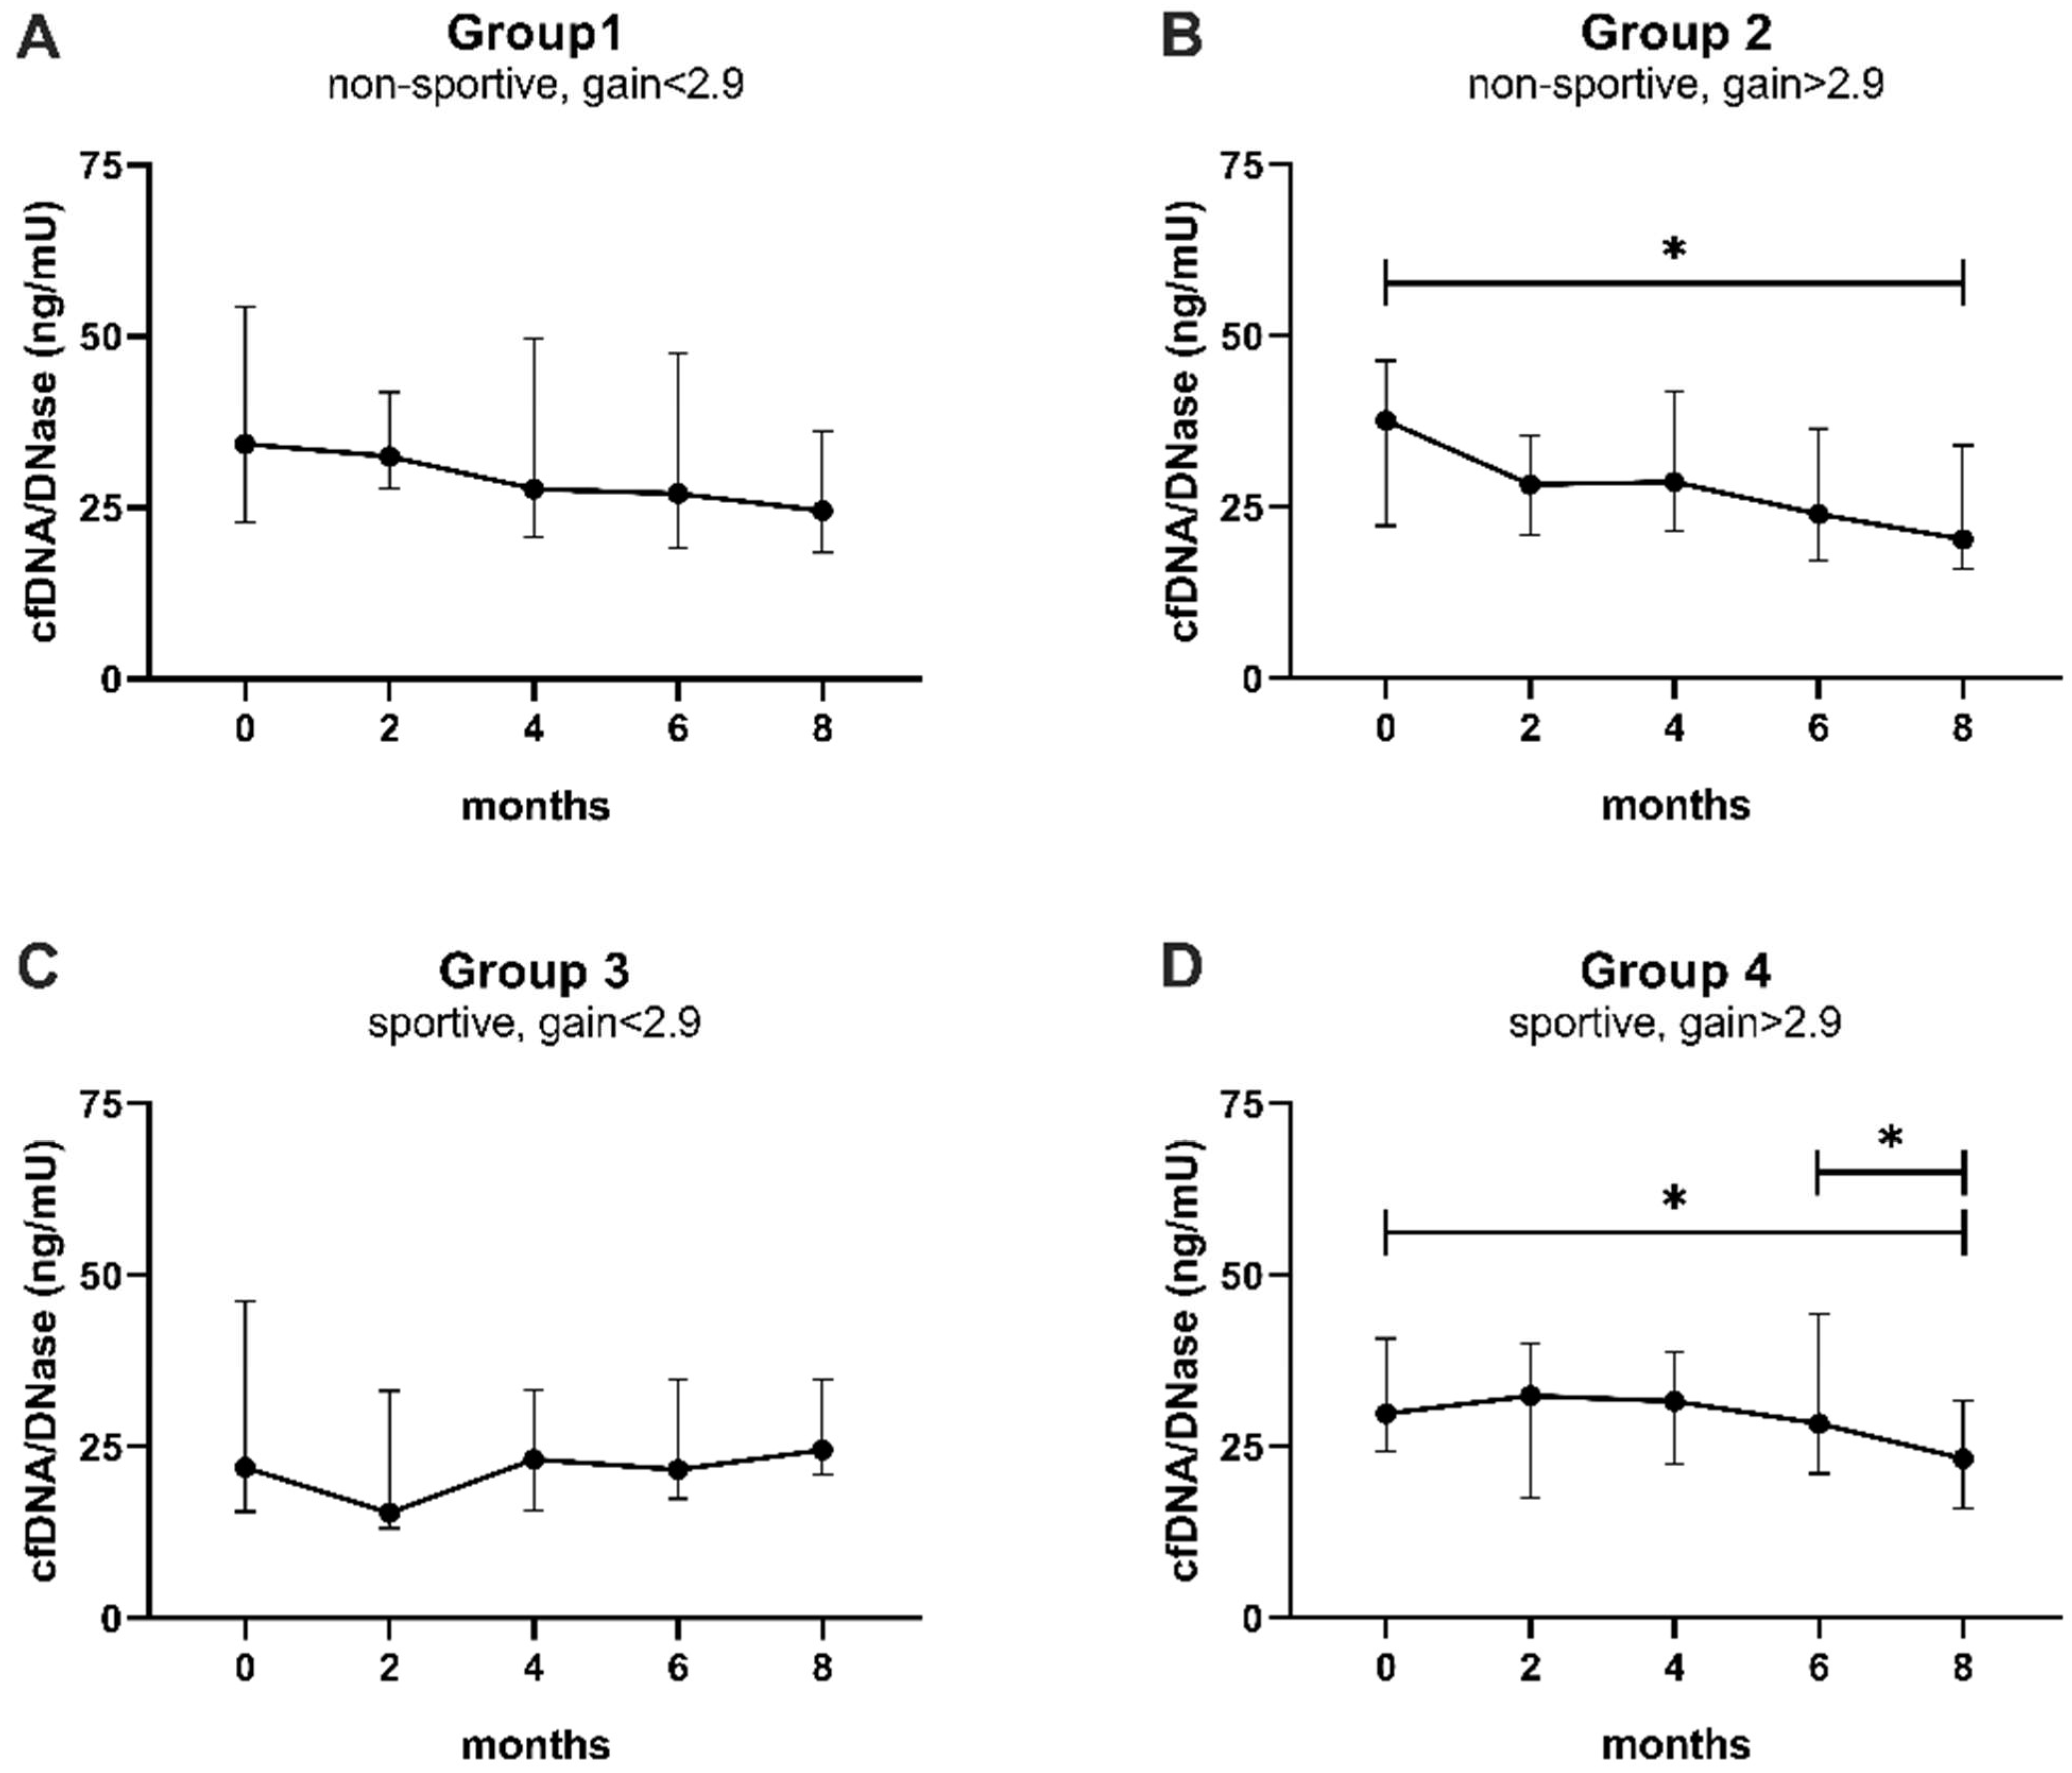
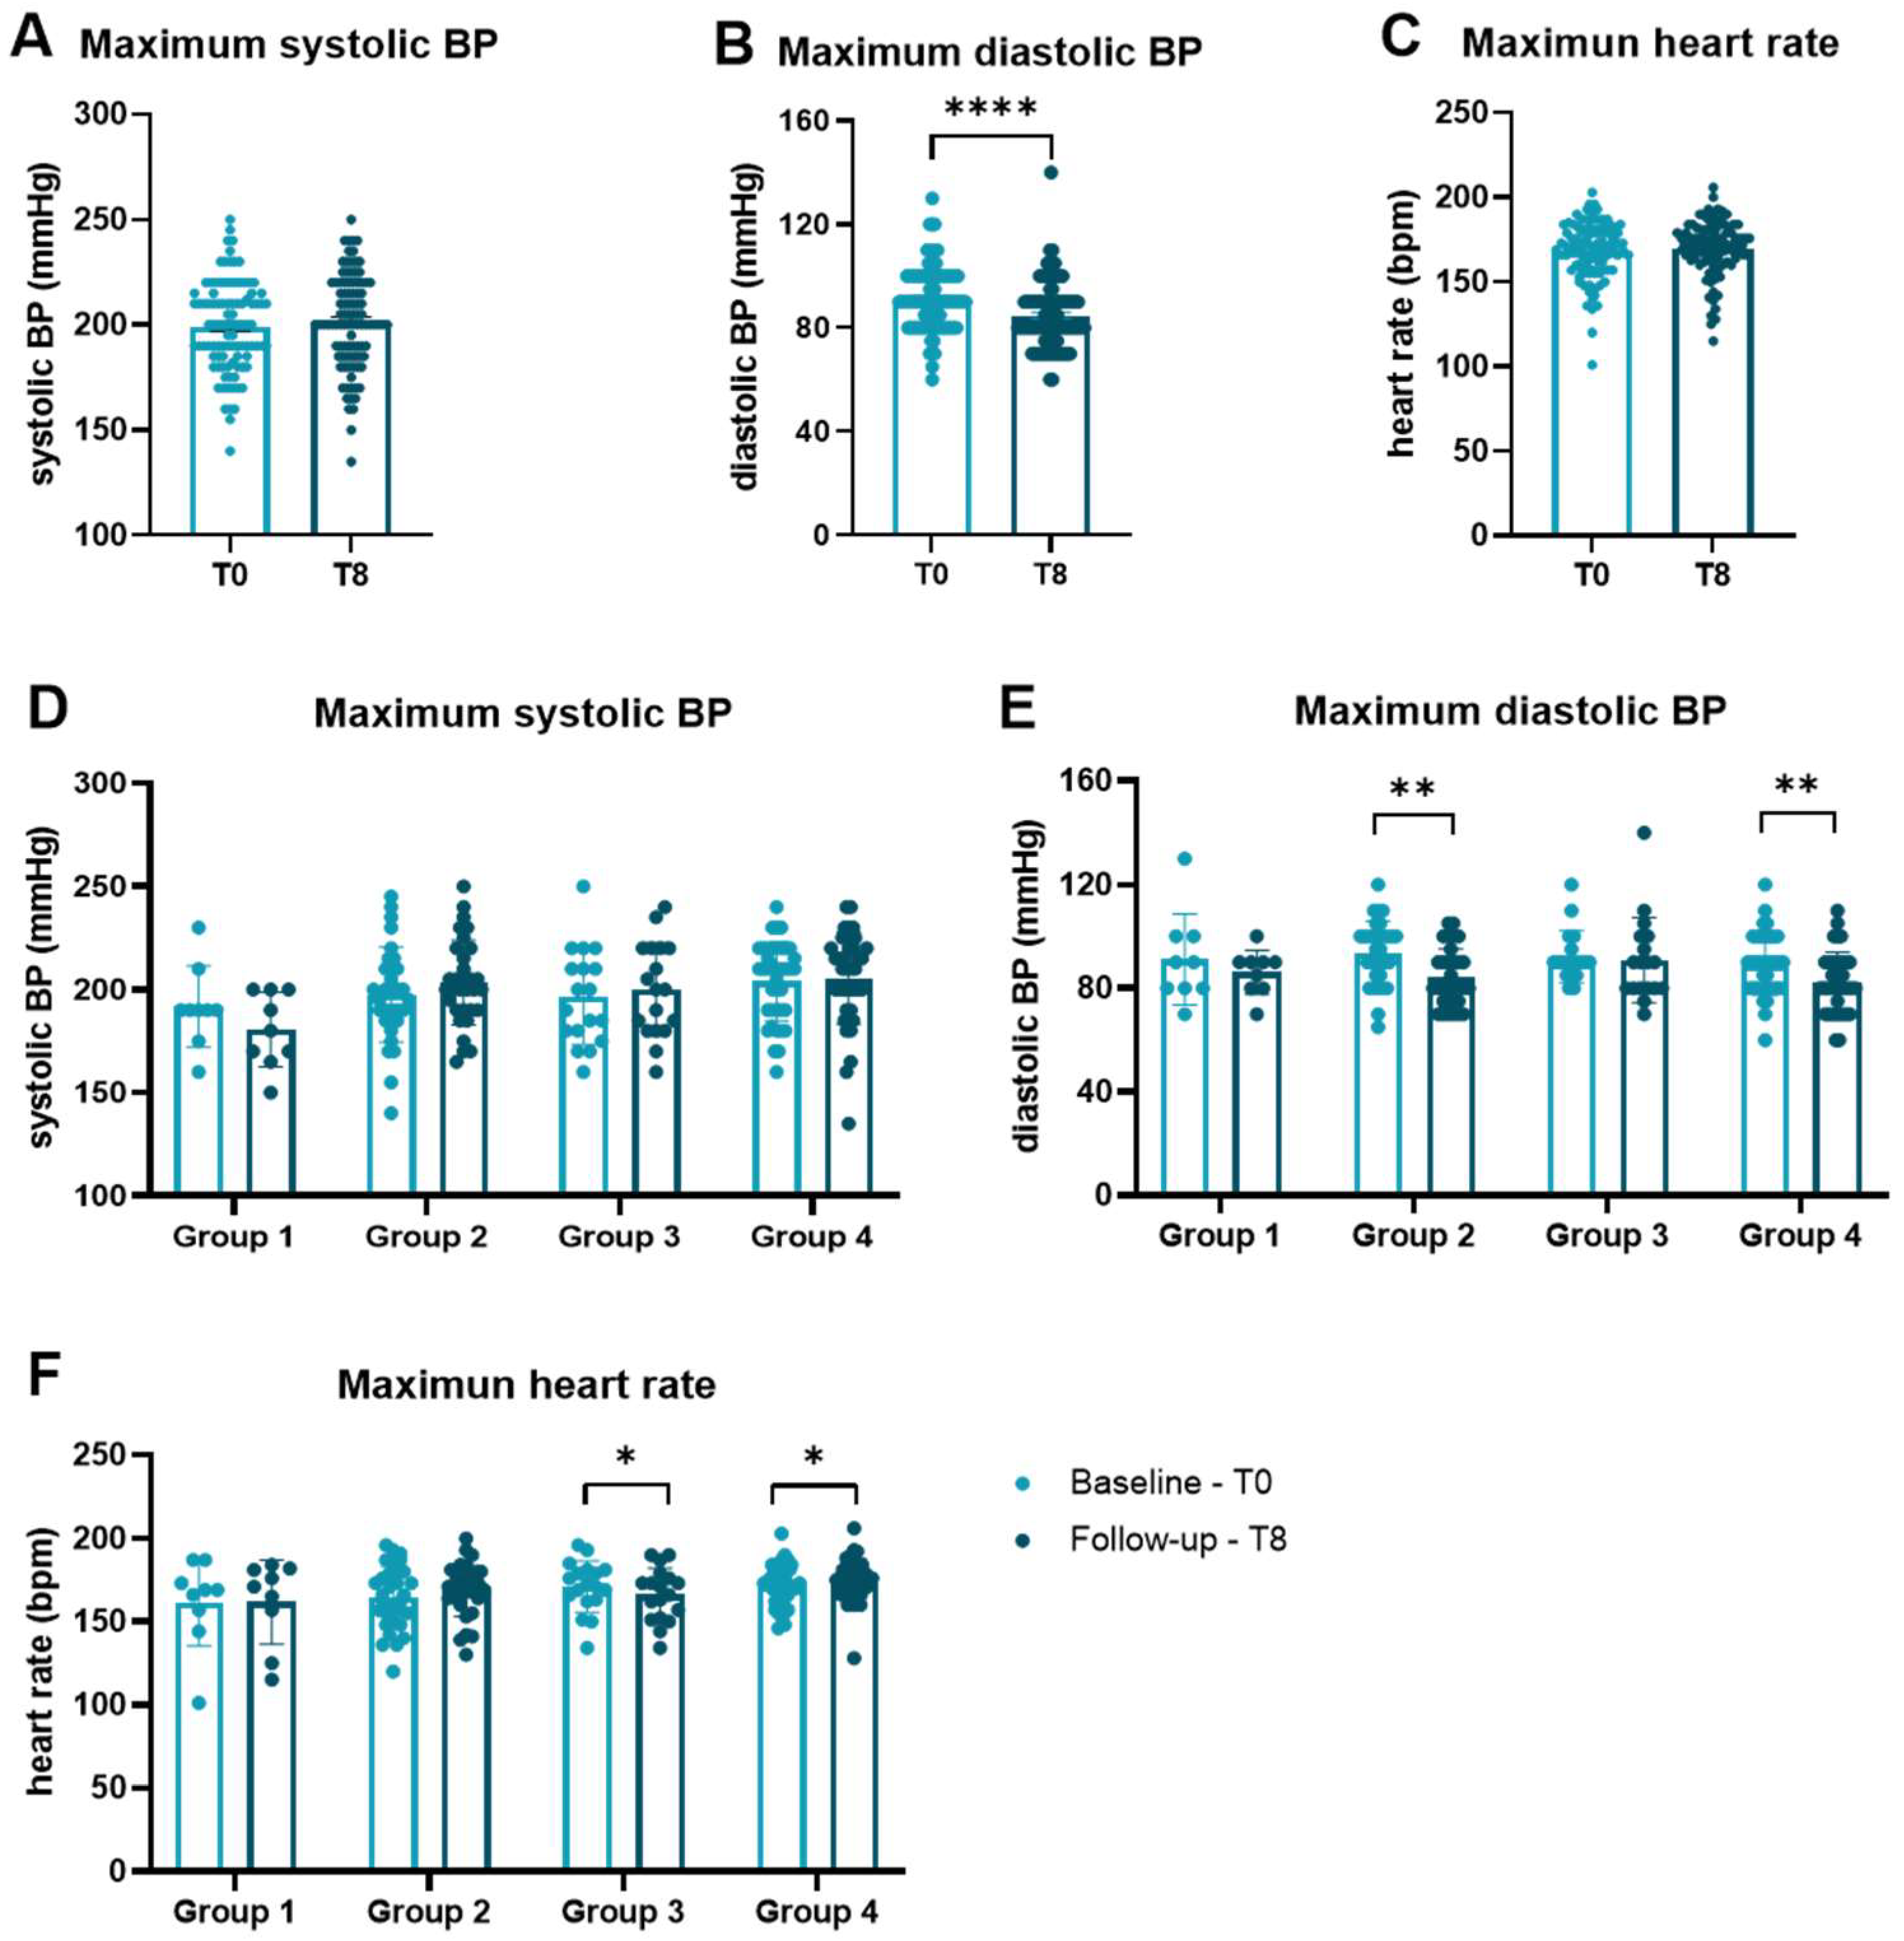
3.3. Influence of Physical Exercise on Levels of cfDNA and Activity of DNase
4. Discussion
Author Contributions
Funding
Institutional Review Board Statement
Informed Consent Statement
Data Availability Statement
Conflicts of Interest
Appendix A


| Parameter | cfDNA | DNase | ||||
|---|---|---|---|---|---|---|
| Rs | p-Value | Sig. | Rs | p-Value | Sig. | |
| CFD, pg/mL | 0.029 | 0.781 | 0.270 | 0.008 | ** | |
| suPAR, pg/mL | 0.238 | 0.019 | * | −0.065 | 0.525 | |
| H-FABP, ng/mL | 0.201 | 0.048 | * | −0.188 | 0.065 | |
| sRAGE, pg/mL | −0.210 | 0.039 | * | 0.066 | 0.522 | |
| Osteoprotegerin, pmol/L | −0.222 | 0.029 | * | −0.202 | 0.047 | * |
| Body Muscle, % | 0.222 | 0.029 | * | −0.071 | 0.491 | |
| Haematocrit, % | 0.209 | 0.041 | * | 0.003 | 0.978 | |
| Platelets, G/L | −0.079 | 0.444 | −0.246 | 0.016 | * | |
| Uric acid, mg/dL | 0.249 | 0.014 | * | 0.135 | 0.188 | |
| total amylase, U/L | −0.221 | 0.031 | * | 0.087 | 0.401 | |
| ASAT, U/L | 0.171 | 0.096 | 0.207 | 0.043 | * | |
| gGT, U/L | 0.280 | 0.006 | ** | −0.037 | 0.720 | |
| LDL-cholesterol, mg/dL | 0.010 | 0.921 | −0.300 | 0.003 | ** | |
| Apolipoprotein B, mg/dL | −0.021 | 0.842 | −0.235 | 0.021 | * | |
| Ferritin, µg/L | 0.203 | 0.047 | * | 0.250 | 0.014 | * |
| Testosterone, ng/mL | 0.282 | 0.005 | ** | 0.092 | 0.374 | |
| Androstenedione, ng/mL | 0.281 | 0.006 | ** | −0.018 | 0.862 | |
| Group | Paired Comparison | Mean | T | p-Value | Correction Factor | Corrected p-Value | Sig. |
|---|---|---|---|---|---|---|---|
| 1 | 0 vs. 8 | 51.88 | 0.920 | 0.385 | 3 | 1.154 | |
| 1 | 6 vs. 8 | 19.54 | 0.482 | 0.643 | 2 | 1.286 | |
| 1 | 0 vs. 2 | 19.99 | 0.459 | 0.658 | 1 | 0.658 | |
| 2 | 0 vs. 8 | 77.59 | 2.835 | 0.008 | 3 | 0.024 | * |
| 2 | 6 vs. 8 | 39.29 | 1.694 | 0.102 | 2 | 0.203 | |
| 2 | 0 vs. 2 | 31.89 | 0.939 | 0.355 | 1 | 0.355 | |
| 3 | 6 vs. 8 | 28.06 | 0.760 | 0.458 | 3 | 1.374 | |
| 3 | 0 vs. 2 | 6.66 | 0.207 | 0.839 | 2 | 1.678 | |
| 3 | 0 vs. 8 | −7.00 | −0.195 | 0.848 | 1 | 0.848 | |
| 4 | 6 vs. 8 | 84.65 | 4.433 | <0.001 | 3 | <0.001 | *** |
| 4 | 0 vs. 8 | 48.89 | 3.125 | 0.002 | 2 | 0.005 | ** |
| 4 | 0 vs. 2 | −28.88 | −1.171 | 0.249 | 1 | 0.249 |
| Group | Paired Comparison | Mean | T | p-Value | Correction Factor | Corrected p-Value | Sig. |
|---|---|---|---|---|---|---|---|
| 1 | 0 vs. 8 | −2.870 | −1.531 | 0.164 | 3 | 0.493 | |
| 1 | 6 vs. 8 | −3.549 | −1.491 | 0.174 | 2 | 0.348 | |
| 1 | 0 vs. 2 | 0.567 | 0.382 | 0.712 | 1 | 0.712 | |
| 2 | 0 vs. 8 | −3.280 | −2.631 | 0.013 | 3 | 0.039 | * |
| 2 | 6 vs. 8 | −1.863 | −1.553 | 0.132 | 2 | 0.264 | |
| 2 | 0 vs. 2 | −2.010 | −1.333 | 0.193 | 1 | 0.193 | |
| 3 | 0 vs. 2 | −3.465 | −2.122 | <0.050 | 3 | 0.149 | n.s. |
| 3 | 6 vs. 8 | 1.621 | 0.782 | 0.447 | 2 | 0.893 | |
| 3 | 0 vs. 8 | 0.242 | 0.129 | 0.899 | 1 | 0.899 | |
| 4 | 0 vs. 8 | −2.301 | −3.482 | 0.001 | 3 | 0.002 | ** |
| 4 | 6 vs. 8 | −2.175 | −2.104 | 0.043 | 2 | 0.086 | n.s. |
| 4 | 0 vs. 2 | −1.550 | −1.645 | 0.109 | 1 | 0.109 |

| Group 1 | Group 2 | Group 3 | Group 4 | |
|---|---|---|---|---|
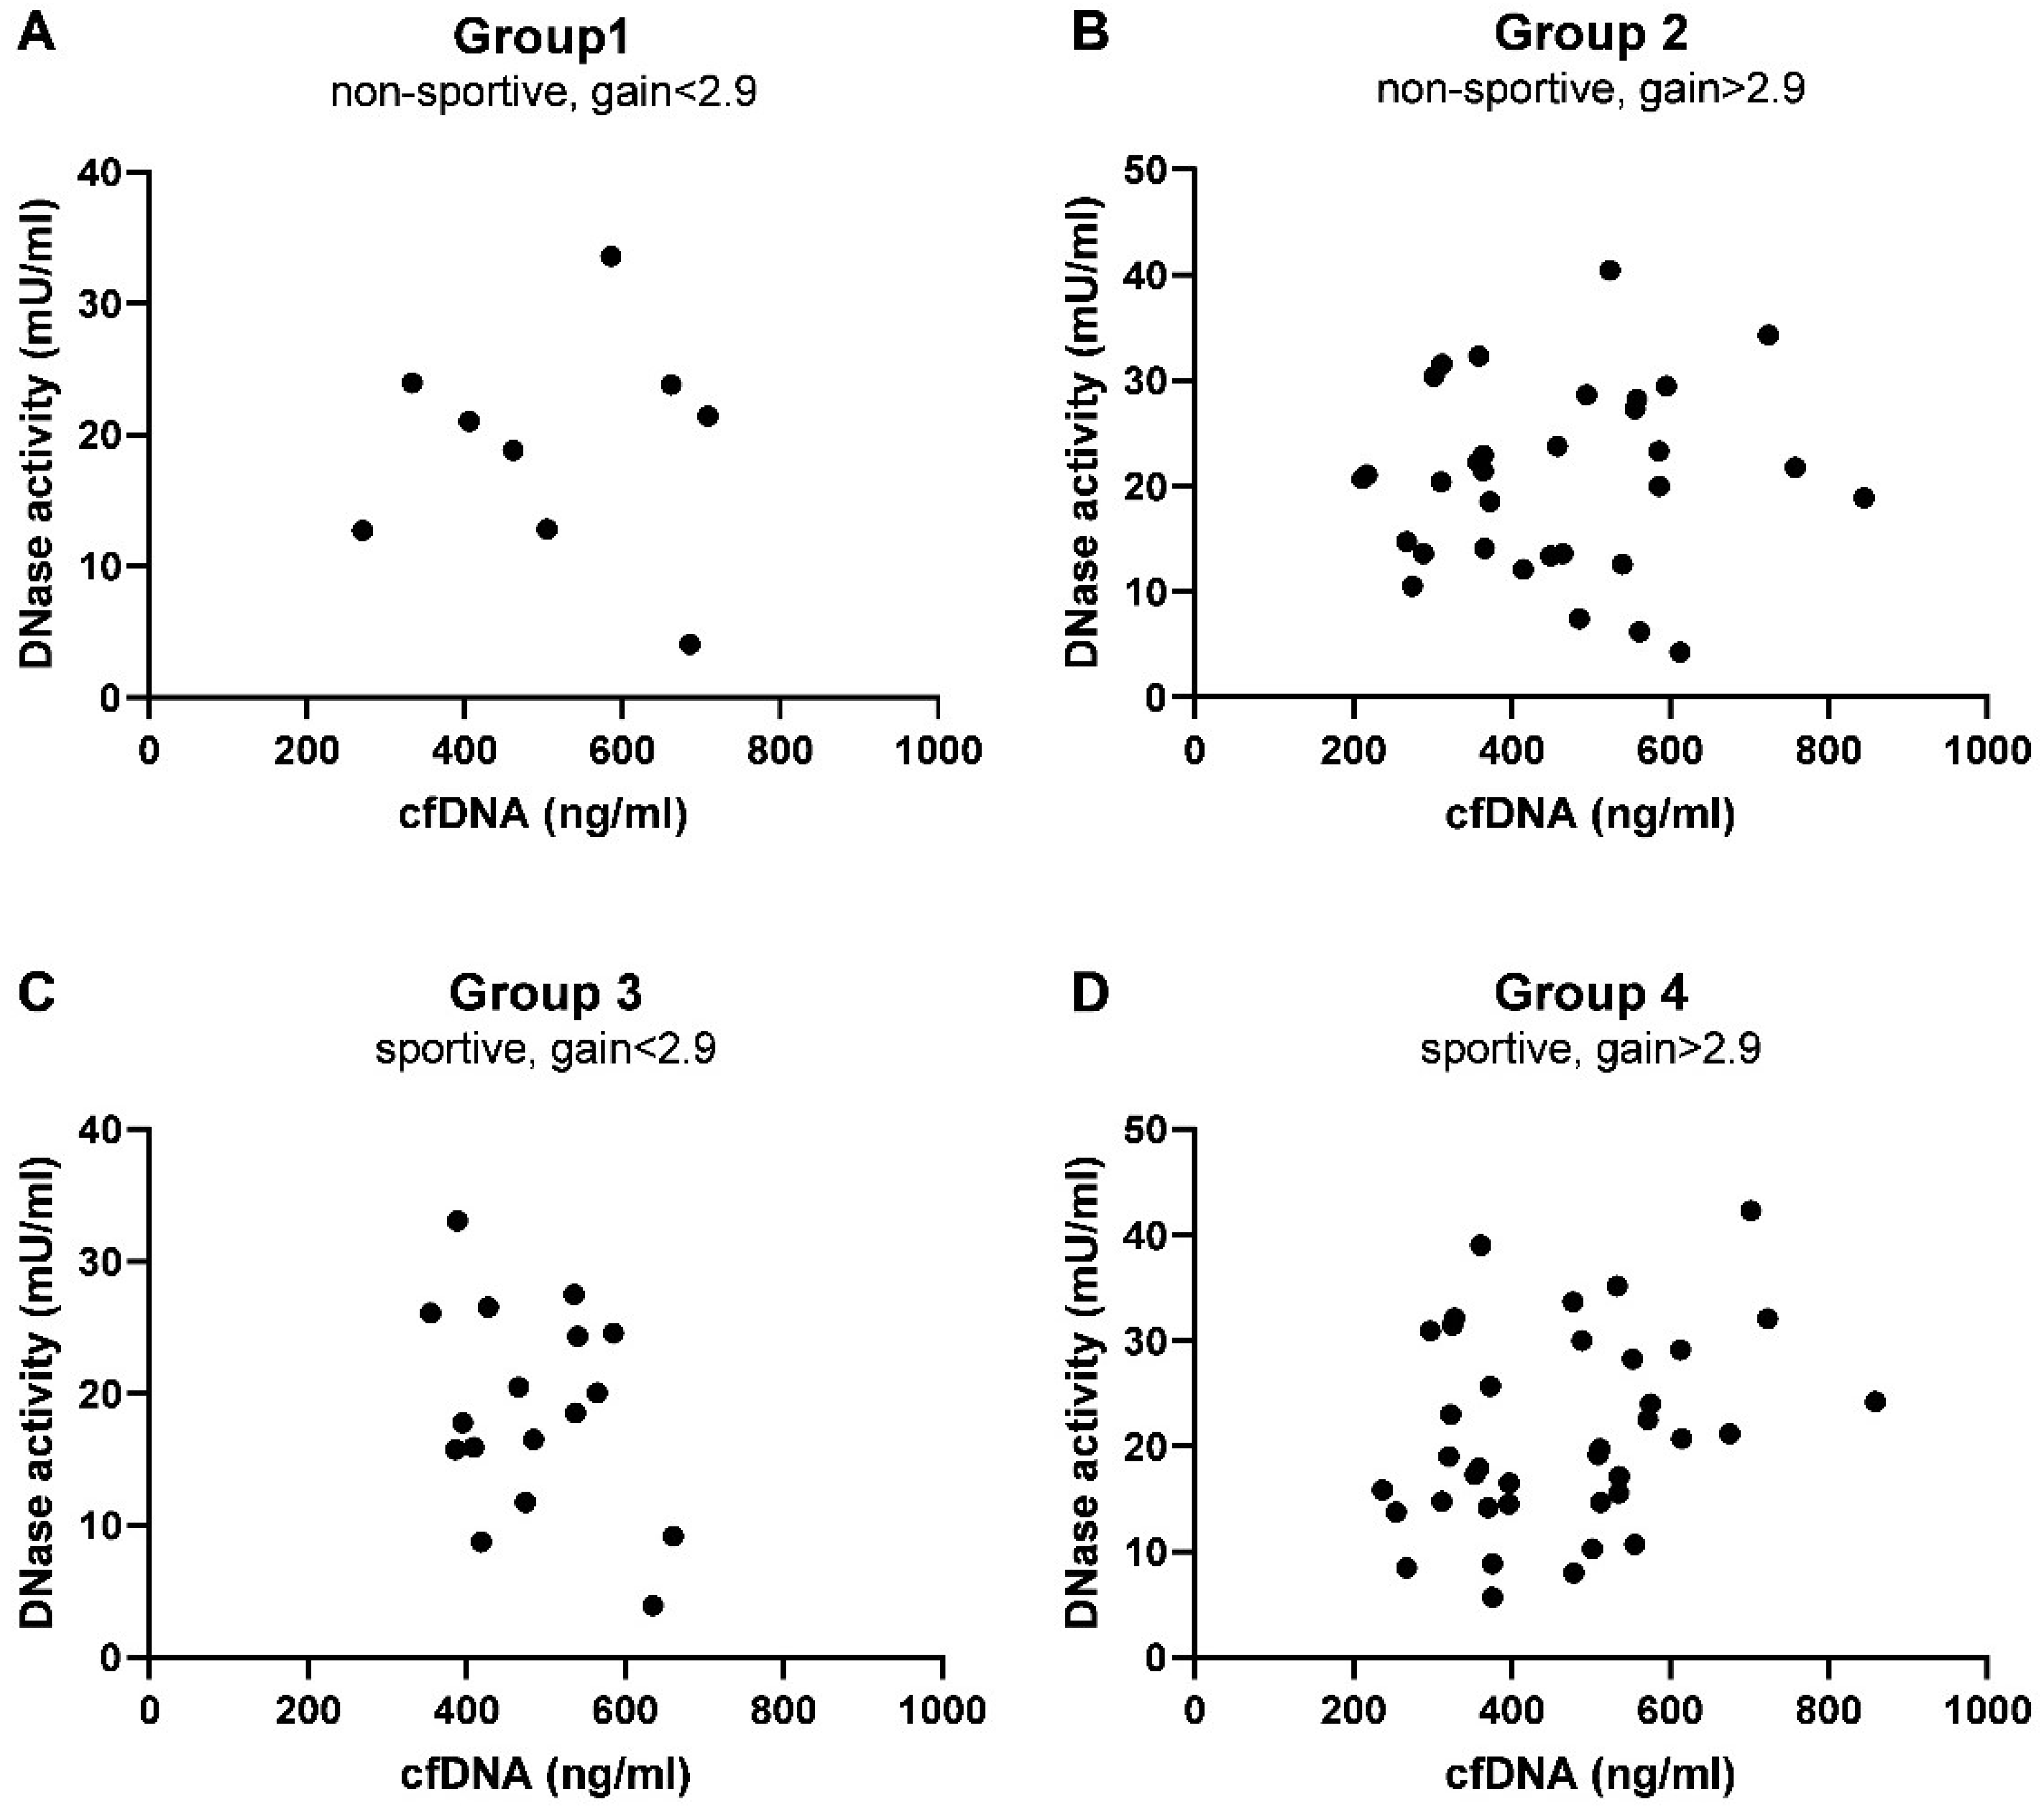
| Pearson r | 0.014 | 0.077 | −0.349 | 0.286 |
| p-value (two-tailed) | 0.973 | 0.675 | 0.170 | 0.082 |
| Number of pairs | 9 | 32 | 17 | 38 |
| Group | Paired Comparison | p-Value | Correction Factor | Corrected p-Value | Sig. |
|---|---|---|---|---|---|
| 1 | 0 vs. 8 | 0.164 | 3 | 0.492 | |
| 1 | 6 vs. 8 | 0.203 | 2 | 0.406 | |
| 1 | 0 vs. 2 | 0.496 | 1 | 0.496 | |
| 2 | 0 vs. 8 | 0.005 | 3 | 0.014 | * |
| 2 | 0 vs. 2 | 0.027 | 2 | 0.055 | n.s. |
| 2 | 6 vs. 8 | 0.086 | 1 | 0.086 | |
| 3 | 0 vs. 2 | 0.080 | 3 | 0.239 | |
| 3 | 0 vs. 8 | 0.464 | 2 | 0.927 | |
| 3 | 6 vs. 8 | 0.782 | 1 | 0.782 | |
| 4 | 6 vs. 8 | 0.006 | 3 | 0.019 | * |
| 4 | 0 vs. 8 | 0.024 | 2 | 0.049 | * |
| 4 | 0 vs. 2 | 0.819 | 1 | 0.819 |
References
- Lopez, A.D.; Mathers, C.D.; Ezzati, M.; Jamison, D.T.; Murray, C.J. Global and regional burden of disease and risk factors, 2001: Systematic analysis of population health data. Lancet 2006, 367, 1747–1757. [Google Scholar] [CrossRef]
- Ahmad, F.B.; Anderson, R.N. The Leading Causes of Death in the US for 2020. JAMA 2021, 325, 1829–1830. [Google Scholar] [CrossRef] [PubMed]
- Heron, M. Deaths: Leading Causes for 2018. Natl. Vital Stat. Rep. 2021, 70, 1–115. [Google Scholar] [PubMed]
- GBD 2015 Risk Factors Collaborators. Global, regional, and national comparative risk assessment of 79 behavioural, environmental and occupational, and metabolic risks or clusters of risks, 1990–2015: A systematic analysis for the Global Burden of Disease Study 2015. Lancet 2016, 388, 1659–1724. [Google Scholar] [CrossRef]
- WHO Guidelines Approved by the Guidelines Review Committee. In Global Recommendations on Physical Activity for Health; World Health Organization: Geneva, Switzerland, 2010.
- Bull, F.C.; Al-Ansari, S.S.; Biddle, S.; Borodulin, K.; Buman, M.P.; Cardon, G.; Carty, C.; Chaput, J.P.; Chastin, S.; Chou, R.; et al. World Health Organization 2020 guidelines on physical activity and sedentary behaviour. Br. J. Sports Med. 2020, 54, 1451–1462. [Google Scholar] [CrossRef] [PubMed]
- Schönbauer, R.; Lichtenauer, M.; Paar, V.; Emich, M.; Fritzer-Szekeres, M.; Schukro, C.; Strametz-Juranek, J.; Sponder, M. Regular Training Increases sTWEAK and Its Decoy Receptor sCD163-Does Training Trigger the sTWEAK/sCD163-Axis to Induce an Anti-Inflammatory Effect? J. Clin. Med. 2020, 9, 1899. [Google Scholar] [CrossRef]
- Sponder, M.; Campean, I.A.; Emich, M.; Fritzer-Szekeres, M.; Litschauer, B.; Graf, S.; Dalos, D.; Strametz-Juranek, J. Long-term physical activity leads to a significant increase in serum sRAGE levels: A sign of decreased AGE-mediated inflammation due to physical activity? Heart Vessels 2018, 33, 893–900. [Google Scholar] [CrossRef]
- Sponder, M.; Fritzer-Szekeres, M.; Marculescu, R.; Litschauer, B.; Strametz-Juranek, J. Physical inactivity increases endostatin and osteopontin in patients with coronary artery disease. Heart Vessels 2016, 31, 1603–1608. [Google Scholar] [CrossRef]
- Ruegsegger, G.N.; Booth, F.W. Health Benefits of Exercise. Cold Spring Harb. Perspect. Med. 2018, 8, a029694. [Google Scholar] [CrossRef]
- Walsh, N.P.; Gleeson, M.; Pyne, D.B.; Nieman, D.C.; Dhabhar, F.S.; Shephard, R.J.; Oliver, S.J.; Bermon, S.; Kajeniene, A. Position statement. Part two: Maintaining immune health. Exerc. Immunol. Rev. 2011, 17, 64–103. [Google Scholar]
- Walsh, N.P.; Gleeson, M.; Shephard, R.J.; Gleeson, M.; Woods, J.A.; Bishop, N.C.; Fleshner, M.; Green, C.; Pedersen, B.K.; Hoffman-Goetz, L.; et al. Position statement. Part one: Immune function and exercise. Exerc. Immunol. Rev. 2011, 17, 6–63. [Google Scholar] [PubMed]
- Shephard, R.J.; Shek, P.N. Potential impact of physical activity and sport on the immune system—A brief review. Br. J. Sports Med. 1994, 28, 247–255. [Google Scholar] [CrossRef] [PubMed]
- Tug, S.; Mehdorn, M.; Helmig, S.; Breitbach, S.; Ehlert, T.; Simon, P. Exploring the Potential of Cell-Free-DNA Measurements After an Exhaustive Cycle-Ergometer Test as a Marker for Performance-Related Parameters. Int. J. Sports Physiol. Perform. 2017, 12, 597–604. [Google Scholar] [CrossRef]
- Haller, N.; Helmig, S.; Taenny, P.; Petry, J.; Schmidt, S.; Simon, P. Circulating, cell-free DNA as a marker for exercise load in intermittent sports. PLoS ONE 2018, 13, e0191915. [Google Scholar] [CrossRef] [PubMed]
- Atamaniuk, J.; Vidotto, C.; Tschan, H.; Bachl, N.; Stuhlmeier, K.M.; Müller, M.M. Increased concentrations of cell-free plasma DNA after exhaustive exercise. Clin. Chem. 2004, 50, 1668–1670. [Google Scholar] [CrossRef]
- Brinkmann, V.; Reichard, U.; Goosmann, C.; Fauler, B.; Uhlemann, Y.; Weiss, D.S.; Weinrauch, Y.; Zychlinsky, A. Neutrophil extracellular traps kill bacteria. Science 2004, 303, 1532–1535. [Google Scholar] [CrossRef]
- Luo, L.; Zhang, S.; Wang, Y.; Rahman, M.; Syk, I.; Zhang, E.; Thorlacius, H. Proinflammatory role of neutrophil extracellular traps in abdominal sepsis. Am. J. Physiol. Lung Cell. Mol. Physiol. 2014, 307, L586–L596. [Google Scholar] [CrossRef]
- Saffarzadeh, M.; Juenemann, C.; Queisser, M.A.; Lochnit, G.; Barreto, G.; Galuska, S.P.; Lohmeyer, J.; Preissner, K.T. Neutrophil extracellular traps directly induce epithelial and endothelial cell death: A predominant role of histones. PLoS ONE 2012, 7, e32366. [Google Scholar] [CrossRef]
- Silvestre-Roig, C.; Braster, Q.; Wichapong, K.; Lee, E.Y.; Teulon, J.M.; Berrebeh, N.; Winter, J.; Adrover, J.M.; Santos, G.S.; Froese, A.; et al. Externalized histone H4 orchestrates chronic inflammation by inducing lytic cell death. Nature 2019, 569, 236–240. [Google Scholar] [CrossRef]
- Fuchs, T.A.; Brill, A.; Duerschmied, D.; Schatzberg, D.; Monestier, M.; Myers, D.D., Jr.; Wrobleski, S.K.; Wakefield, T.W.; Hartwig, J.H.; Wagner, D.D. Extracellular DNA traps promote thrombosis. Proc. Natl. Acad. Sci. USA 2010, 107, 15880–15885. [Google Scholar] [CrossRef]
- Hofbauer, T.M.; Ondracek, A.S.; Lang, I.M. Neutrophil Extracellular Traps in Atherosclerosis and Thrombosis. In Prevention and Treatment of Atherosclerosis; Handbook of Experimental Pharmacology; Springer: Cham, Switzerland, 2020. [Google Scholar] [CrossRef]
- Villanueva, E.; Yalavarthi, S.; Berthier, C.C.; Hodgin, J.B.; Khandpur, R.; Lin, A.M.; Rubin, C.J.; Zhao, W.; Olsen, S.H.; Klinker, M.; et al. Netting neutrophils induce endothelial damage, infiltrate tissues, and expose immunostimulatory molecules in systemic lupus erythematosus. J. Immunol. 2011, 187, 538–552. [Google Scholar] [CrossRef]
- Eilenberg, W.; Zagrapan, B.; Bleichert, S.; Ibrahim, N.; Knöbl, V.; Brandau, A.; Martelanz, L.; Grasl, M.T.; Hayden, H.; Nawrozi, P.; et al. Histone citrullination as a novel biomarker and target to inhibit progression of abdominal aortic aneurysms. Transl. Res. 2021, 233, 32–46. [Google Scholar] [CrossRef] [PubMed]
- Ng, H.; Havervall, S.; Rosell, A.; Aguilera, K.; Parv, K.; von Meijenfeldt, F.A.; Lisman, T.; Mackman, N.; Thålin, C.; Phillipson, M. Circulating Markers of Neutrophil Extracellular Traps Are of Prognostic Value in Patients with COVID-19. Arterioscler. Thromb. Vasc. Biol. 2021, 41, 988–994. [Google Scholar] [CrossRef] [PubMed]
- Veras, F.P.; Pontelli, M.C.; Silva, C.M.; Toller-Kawahisa, J.E.; de Lima, M.; Nascimento, D.C.; Schneider, A.H.; Caetité, D.; Tavares, L.A.; Paiva, I.M.; et al. SARS-CoV-2-triggered neutrophil extracellular traps mediate COVID-19 pathology. J. Exp. Med. 2020, 217, e20201129. [Google Scholar] [CrossRef] [PubMed]
- Warnatsch, A.; Ioannou, M.; Wang, Q.; Papayannopoulos, V. Inflammation. Neutrophil extracellular traps license macrophages for cytokine production in atherosclerosis. Science 2015, 349, 316–320. [Google Scholar] [CrossRef] [PubMed]
- Al-Mayouf, S.M.; Sunker, A.; Abdwani, R.; Abrawi, S.A.; Almurshedi, F.; Alhashmi, N.; Al Sonbul, A.; Sewairi, W.; Qari, A.; Abdallah, E.; et al. Loss-of-function variant in DNASE1L3 causes a familial form of systemic lupus erythematosus. Nat. Genet. 2011, 43, 1186–1188. [Google Scholar] [CrossRef]
- Hofbauer, T.M.; Mangold, A.; Ondracek, A.S.; Panzenböck, A.; Scherz, T.; Müller, J.; Distelmaier, K.; Seidl, V.; Kastl, S.; Müller-Nurasyid, M.; et al. Deoxyribonuclease 1 Q222R single nucleotide polymorphism and long-term mortality after acute myocardial infarction. Basic Res. Cardiol. 2021, 116, 29. [Google Scholar] [CrossRef]
- Mangold, A.; Alias, S.; Scherz, T.; Hofbauer, M.; Jakowitsch, J.; Panzenböck, A.; Simon, D.; Laimer, D.; Bangert, C.; Kammerlander, A.; et al. Coronary neutrophil extracellular trap burden and deoxyribonuclease activity in ST-elevation acute coronary syndrome are predictors of ST-segment resolution and infarct size. Circ. Res. 2015, 116, 1182–1192. [Google Scholar] [CrossRef]
- Barnes, B.J.; Adrover, J.M.; Baxter-Stoltzfus, A.; Borczuk, A.; Cools-Lartigue, J.; Crawford, J.M.; Daßler-Plenker, J.; Guerci, P.; Huynh, C.; Knight, J.S.; et al. Targeting potential drivers of COVID-19: Neutrophil extracellular traps. J. Exp. Med. 2020, 217, e20200652. [Google Scholar] [CrossRef]
- Valeria Oliveira de Sousa, B.; de Freitas, D.F.; Monteiro-Junior, R.S.; Mendes, I.H.R.; Sousa, J.N.; Guimarães, V.H.D.; Santos, S.H.S. Physical exercise, obesity, inflammation and neutrophil extracellular traps (NETs): A review with bioinformatics analysis. Mol. Biol. Rep. 2021, 48, 4625–4635. [Google Scholar] [CrossRef]
- Syu, G.D.; Chen, H.I.; Jen, C.J. Acute severe exercise facilitates neutrophil extracellular trap formation in sedentary but not active subjects. Med. Sci. Sports Exerc. 2013, 45, 238–244. [Google Scholar] [CrossRef] [PubMed]
- Beiter, T.; Fragasso, A.; Hudemann, J.; Schild, M.; Steinacker, J.; Mooren, F.C.; Niess, A.M. Neutrophils release extracellular DNA traps in response to exercise. J. Appl. Physiol. 2014, 117, 325–333. [Google Scholar] [CrossRef] [PubMed]
- Beiter, T.; Fragasso, A.; Hartl, D.; Nieß, A.M. Neutrophil extracellular traps: A walk on the wild side of exercise immunology. Sports Med. 2015, 45, 625–640. [Google Scholar] [CrossRef]
- Breitbach, S.; Tug, S.; Simon, P. Circulating cell-free DNA: An up-coming molecular marker in exercise physiology. Sports Med. 2012, 42, 565–586. [Google Scholar] [CrossRef]
- Velders, M.; Treff, G.; Machus, K.; Bosnyák, E.; Steinacker, J.; Schumann, U. Exercise is a potent stimulus for enhancing circulating DNase activity. Clin. Biochem. 2014, 47, 471–474. [Google Scholar] [CrossRef]
- Mangold, A.; Ondracek, A.S.; Hofbauer, T.M.; Artner, T.; Nechvile, J.; Panagiotides, N.G.; Mirna, M.; Hammerer, M.; Fejzic, D.; Hoppe, U.; et al. Deoxyribonuclease is prognostic in patients undergoing transcatheter aortic valve replacement. Eur. J. Clin. Investig. 2021, 51, e13595. [Google Scholar] [CrossRef] [PubMed]
- Ondracek, A.S.; Hofbauer, T.M.; Wurm, R.; Arfsten, H.; Seidl, V.; Früh, A.; Seidel, S.; Hubner, P.; Mangold, A.; Goliasch, G.; et al. Imbalance between plasma double-stranded DNA and deoxyribonuclease activity predicts mortality after out-of-hospital cardiac arrest. Resuscitation 2020, 151, 26–32. [Google Scholar] [CrossRef] [PubMed]
- Döring, Y.; Libby, P.; Soehnlein, O. Neutrophil Extracellular Traps Participate in Cardiovascular Diseases: Recent Experimental and Clinical Insights. Circ. Res. 2020, 126, 1228–1241. [Google Scholar] [CrossRef]
- Andreatta, M.V.; Curty, V.M.; Coutinho, J.V.S.; Santos MÂ, A.; Vassallo, P.F.; de Sousa, N.F.; Barauna, V.G. Cell-Free DNA as an Earlier Predictor of Exercise-Induced Performance Decrement Related to Muscle Damage. Int. J. Sports Physiol. Perform. 2018, 13, 953–956. [Google Scholar] [CrossRef]
- Jiménez-Alcázar, M.; Limacher, A.; Panda, R.; Méan, M.; Bitterling, J.; Peine, S.; Renné, T.; Beer, J.H.; Aujesky, D.; Lämmle, B.; et al. Circulating extracellular DNA is an independent predictor of mortality in elderly patients with venous thromboembolism. PLoS ONE 2018, 13, e0191150. [Google Scholar] [CrossRef]
- Margeli, A.; Skenderi, K.; Tsironi, M.; Hantzi, E.; Matalas, A.L.; Vrettou, C.; Kanavakis, E.; Chrousos, G.; Papassotiriou, I. Dramatic elevations of interleukin-6 and acute-phase reactants in athletes participating in the ultradistance foot race spartathlon: Severe systemic inflammation and lipid and lipoprotein changes in protracted exercise. J. Clin. Endocrinol. Metab. 2005, 90, 3914–3918. [Google Scholar] [CrossRef] [PubMed]
- Lenz, M.; Schönbauer, R.; Stojkovic, S.; Lee, J.; Gatterer, C.; Lichtenauer, M.; Paar, V.; Emich, M.; Fritzer-Szekeres, M.; Strametz-Juranek, J.; et al. RANTES and CD40L under Conditions of Long-Term Physical Exercise: A Potential Link to Adaptive Immunity. Int. J. Environ. Res. Public Health 2022, 19, 8658. [Google Scholar] [CrossRef] [PubMed]
- Sponder, M.; Campean, I.A.; Emich, M.; Fritzer-Szekeres, M.; Litschauer, B.; Bergler-Klein, J.; Graf, S.; Strametz-Juranek, J. Long-term endurance training increases serum cathepsin S and decreases IL-6 and hsCRP levels. J. Sports Sci. 2017, 35, 2129–2134. [Google Scholar] [CrossRef] [PubMed]
- Seo, N.; Nakamura, J.; Kaneda, T.; Tateno, H.; Shimoda, A.; Ichiki, T.; Furukawa, K.; Hirabayashi, J.; Akiyoshi, K.; Shiku, H. Distinguishing functional exosomes and other extracellular vesicles as a nucleic acid cargo by the anion-exchange method. J. Extracell. Vesicles 2022, 11, e12205. [Google Scholar] [CrossRef]
- Chrysanthopoulou, A.; Gkaliagkousi, E.; Lazaridis, A.; Arelaki, S.; Pateinakis, P.; Ntinopoulou, M.; Mitsios, A.; Antoniadou, C.; Argyriou, C.; Georgiadis, G.S.; et al. Angiotensin II triggers release of neutrophil extracellular traps, linking thromboinflammation with essential hypertension. JCI Insight 2021, 6, e148668. [Google Scholar] [CrossRef]
- Felux, J.; Erbacher, A.; Breckler, M.; Hervé, R.; Lemeiter, D.; Mannherz, H.G.; Napirei, M.; Rammensee, H.G.; Decker, P. Deoxyribonuclease 1-Mediated Clearance of Circulating Chromatin Prevents From Immune Cell Activation and Pro-inflammatory Cytokine Production, a Phenomenon Amplified by Low Trap1 Activity: Consequences for Systemic Lupus Erythematosus. Front. Immunol. 2021, 12, 613597. [Google Scholar] [CrossRef]
- Napirei, M.; Ricken, A.; Eulitz, D.; Knoop, H.; Mannherz, H.G. Expression pattern of the deoxyribonuclease 1 gene: Lessons from the Dnase1 knockout mouse. Biochem. J. 2004, 380 Pt 3, 929–937. [Google Scholar] [CrossRef]
- Yang, C.; Montgomery, M. Dornase alfa for cystic fibrosis. Cochrane Database Syst. Rev. 2018, 9, Cd001127. [Google Scholar] [CrossRef]
- Napirei, M.; Karsunky, H.; Zevnik, B.; Stephan, H.; Mannherz, H.G.; Möröy, T. Features of systemic lupus erythematosus in Dnase1-deficient mice. Nat. Genet. 2000, 25, 177–181. [Google Scholar] [CrossRef]
- Alekseeva, L.A.; Sen’kova, A.V.; Zenkova, M.A.; Mironova, N.L. Targeting Circulating SINEs and LINEs with DNase I Provides Metastases Inhibition in Experimental Tumor Models. Mol. Ther. Nucleic Acids 2020, 20, 50–61. [Google Scholar] [CrossRef]
- Jiménez-Alcázar, M.; Rangaswamy, C.; Panda, R.; Bitterling, J.; Simsek, Y.J.; Long, A.T.; Bilyy, R.; Krenn, V.; Renné, C.; Renné, T.; et al. Host DNases prevent vascular occlusion by neutrophil extracellular traps. Science 2017, 358, 1202–1206. [Google Scholar] [CrossRef] [PubMed]
- Inokuchi, S.; Mitoma, H.; Kawano, S.; Nakano, S.; Ayano, M.; Kimoto, Y.; Akahoshi, M.; Arinobu, Y.; Tsukamoto, H.; Akashi, K.; et al. Homeostatic Milieu Induces Production of Deoxyribonuclease 1-like 3 from Myeloid Cells. J. Immunol. 2020, 204, 2088–2097. [Google Scholar] [CrossRef]
- Dhawan, U.K.; Bhattacharya, P.; Narayanan, S.; Manickam, V.; Aggarwal, A.; Subramanian, M. Hypercholesterolemia Impairs Clearance of Neutrophil Extracellular Traps and Promotes Inflammation and Atherosclerotic Plaque Progression. Arterioscler. Thromb. Vasc. Biol. 2021, 41, 2598–2615. [Google Scholar] [CrossRef] [PubMed]
- Räber, L.; Ueki, Y.; Otsuka, T.; Losdat, S.; Häner, J.D.; Lonborg, J.; Fahrni, G.; Iglesias, J.F.; van Geuns, R.J.; Ondracek, A.S.; et al. Effect of Alirocumab Added to High-Intensity Statin Therapy on Coronary Atherosclerosis in Patients with Acute Myocardial Infarction: The PACMAN-AMI Randomized Clinical Trial. JAMA 2022, 327, 1771–1781. [Google Scholar] [CrossRef] [PubMed]
- Kubukeli, Z.N.; Noakes, T.D.; Dennis, S.C. Training techniques to improve endurance exercise performances. Sport. Med. 2002, 32, 489–509. [Google Scholar] [CrossRef] [PubMed]


| Parameters | Group 1 Non-Sportive Gain ≤ 2.9% (n = 9) | Group 2 Non-Sportive Gain > 2.9% (n = 32) | Group 3 Sportive Gain ≤ 2.9% (n = 18) | Group 4 Sportive Gain > 2.9% (n = 39) | Total Population (n = 98) |
|---|---|---|---|---|---|
| Age (years) | 50.3 ± 6.1 | 48.6 ± 7.9 | 50.4 ± 6.5 | 49.1 ± 6.0 | 49.3 ± 6.7 |
| BMI (kg/m2) | 27.8 ± 4.2 | 28.5 ± 5.2 | 27.2 ± 3.8 | 26.8 ± 3.3 | 27.5 ± 4.2 |
| Body fat (%) | 33.9 ± 3.3 | 31.6 ± 6.7 | 26.8 ± 9.1 | 27.8 ± 11.8 | 29.4 ± 9.5 |
| Body muscle (%) | 32.4 ± 3.3 | 33.9 ± 4.1 | 34.3 ± 3.8 | 36.1 ± 4.0 | 34.7 ± 4.1 |
| Body water (%) | 48.6 ± 2.4 | 50.3 ± 4.9 | 53.8 ± 6.7 | 54.2 ± 5.9 | 52.3 ± 5.9 |
| Performance baseline (%) | 87.4 ± 9.9 | 88.8 ± 7.1 | 122.0 ± 16.8 | 116.0 ± 15.9 | 105.6 ± 19.7 |
| Performance study end (%) | 87.0 ± 9.1 | 101.0 ± 10.0 | 118.2 ± 18.0 | 128.2 ± 15.6 | 113.7 ± 20.0 |
| Performance gain (%) | −2.7 ± 4.3 | 12.2 ± 7.1 | −3.8 ± 4.9 | 12.1 ± 5.6 | 7.8 ± 9.1 |
| Pack years | 22.4 ± 21.4 | 18.9 ± 15.8 | 12.2 ± 9.2 | 16.3 ± 14.6 | 17.1 ± 14.9 |
| Alcohol intake (units/week) | 0.7 ± 1.0 | 2.8 ± 3.2 | 3.4 ± 4.0 | 3.2 ± 4.4 | 2.9 ± 3.8 |
| Male sex (%) | 44.4 | 53.1 | 61.1 | 71.8 | 61.2 |
| Active smoking (%) | 55.6 | 25.0 | 16.7 | 10.3 | 20.4 |
| Cardiac history (%) | 11.1 | 15.6 | 5.6 | 23.1 | 16.3 |
| Diabetes mellitus (%) | 11.1 | 3.1 | 5.6 | 0 | 3.1 |
| Hypertension (%) | 33.3 | 43.8 | 33.3 | 23.1 | 32.7 |
| Dyslipidemia (%) | 33.3 | 25.0 | 38.9 | 28.2 | 29.6 |
| Overweight (%) | 66.8 | 68.8 | 66.7 | 63.2 | 65.9 |
| Positive family history (%) | 66.8 | 43.8 | 50.0 | 38.5 | 44.9 |
| Erythrocytes (T/L) | 4.6 ± 0.4 | 4.8 ± 0.5 | 4.6 ± 0.4 | 4.7 ± 0.4 | 4.7 ± 0.4 |
| Haemoglobin (g/dL) | 13.3 ± 1.5 | 14.2 ± 1.5 | 13.8 ± 1.0 | 14.2 ± 1.2 | 14.0 ± 1.3 |
| Sodium (mmol/L) | 141 ± 2 | 141 ± 2 | 141 ± 2 | 142 ± 2 | 141 ± 1.7 |
| Potassium (mmol/L) | 4.2 ± 0.2 | 4.1 ± 0.2 | 4.2 ± 0.3 | 4.2 ± 0.2 | 4.2 ± 0.3 |
| Creatinine (mg/dL) | 0.8 ± 0.1 | 0.8 ± 0.2 | 0.9 ± 0.2 | 0.9 ± 0.2 | 0.9 ± 0.2 |
| ASAT (U/L) | 23 ± 4 | 26 ± 10 | 27 ± 7 | 24 ± 5 | 25 ± 7 |
| Triglycerides (mg/dL) | 154 ± 86 | 149 ± 100 | 111 ± 72 | 119 ± 62 | 131 ± 81 |
| Cholesterol (mg/dL) | 209 ± 54 | 200 ± 37 | 196 ± 29 | 201 ± 39 | 200 ± 38 |
| HDL-cholesterol (mg/dL) | 52 ± 19 | 56 ± 22 | 62 ± 12 | 60 ± 15 | 59 ± 17 |
| LDL-cholesterol (mg/dL) | 126 ± 50 | 117 ± 32 | 112 ± 29 | 116 ± 35 | 117 ± 34 |
| HbA1c (rel.%) | 5.5 ± 0.4 | 5.4 ± 0.8 | 5.5 ± 0.9 | 5.2 ± 0.3 | 5.3 ± 0.6 |
| proBNP (pg/mL) | 39 ± 27 | 59 ± 54 | 50 ± 35 | 32 ± 21 | 45 ± 39 |
| cfDNA | Standardized B | T | p Value | 95% CI |
|---|---|---|---|---|
| suPAR, pg/mL | 0.239 | 2.770 | 0.007 | 0.021; 0.129 |
| H-FABP, ng/mL | 0.234 | 2.669 | 0.009 | 9.073; 61.95 |
| Body muscle, % | 0.159 | 1.695 | 0.093 | −0.984; 12.43 |
| Osteoprotegerin, pmol/L | −0.199 | −2.351 | 0.021 | −23.42; −1.966 |
| Uric acid, mg/dL | 0.204 | 2.107 | 0.038 | 1.231; 41.89 |
| Androstendion, ng/mL | 0.200 | 2.335 | 0.022 | 7.246; 89.92 |
| DNase Activity | Standardized B | T | p Value | 95% CI |
|---|---|---|---|---|
| CFD, pg/mL | 0.181 | 1.957 | 0.053 | 0.000; 0.000 |
| Ferritin, µg/L | 0.338 | 3.670 | <0.001 | 0.014; 0.048 |
| LDL cholesterol, mg/dL | −0.261 | −2.848 | 0.005 | −0.114; 0.020 |
Publisher’s Note: MDPI stays neutral with regard to jurisdictional claims in published maps and institutional affiliations. |
© 2022 by the authors. Licensee MDPI, Basel, Switzerland. This article is an open access article distributed under the terms and conditions of the Creative Commons Attribution (CC BY) license (https://creativecommons.org/licenses/by/4.0/).
Share and Cite
Ondracek, A.S.; Aszlan, A.; Schmid, M.; Lenz, M.; Mangold, A.; Artner, T.; Emich, M.; Fritzer-Szekeres, M.; Strametz-Juranek, J.; Lang, I.M.; et al. Physical Exercise Promotes DNase Activity Enhancing the Capacity to Degrade Neutrophil Extracellular Traps. Biomedicines 2022, 10, 2849. https://doi.org/10.3390/biomedicines10112849
Ondracek AS, Aszlan A, Schmid M, Lenz M, Mangold A, Artner T, Emich M, Fritzer-Szekeres M, Strametz-Juranek J, Lang IM, et al. Physical Exercise Promotes DNase Activity Enhancing the Capacity to Degrade Neutrophil Extracellular Traps. Biomedicines. 2022; 10(11):2849. https://doi.org/10.3390/biomedicines10112849
Chicago/Turabian StyleOndracek, Anna S., Adrienne Aszlan, Martin Schmid, Max Lenz, Andreas Mangold, Tyler Artner, Michael Emich, Monika Fritzer-Szekeres, Jeanette Strametz-Juranek, Irene M. Lang, and et al. 2022. "Physical Exercise Promotes DNase Activity Enhancing the Capacity to Degrade Neutrophil Extracellular Traps" Biomedicines 10, no. 11: 2849. https://doi.org/10.3390/biomedicines10112849
APA StyleOndracek, A. S., Aszlan, A., Schmid, M., Lenz, M., Mangold, A., Artner, T., Emich, M., Fritzer-Szekeres, M., Strametz-Juranek, J., Lang, I. M., & Sponder, M. (2022). Physical Exercise Promotes DNase Activity Enhancing the Capacity to Degrade Neutrophil Extracellular Traps. Biomedicines, 10(11), 2849. https://doi.org/10.3390/biomedicines10112849