

Imaging Technologies for Cerebral Pharmacokinetic Studies: Progress and Perspectives
Abstract
:
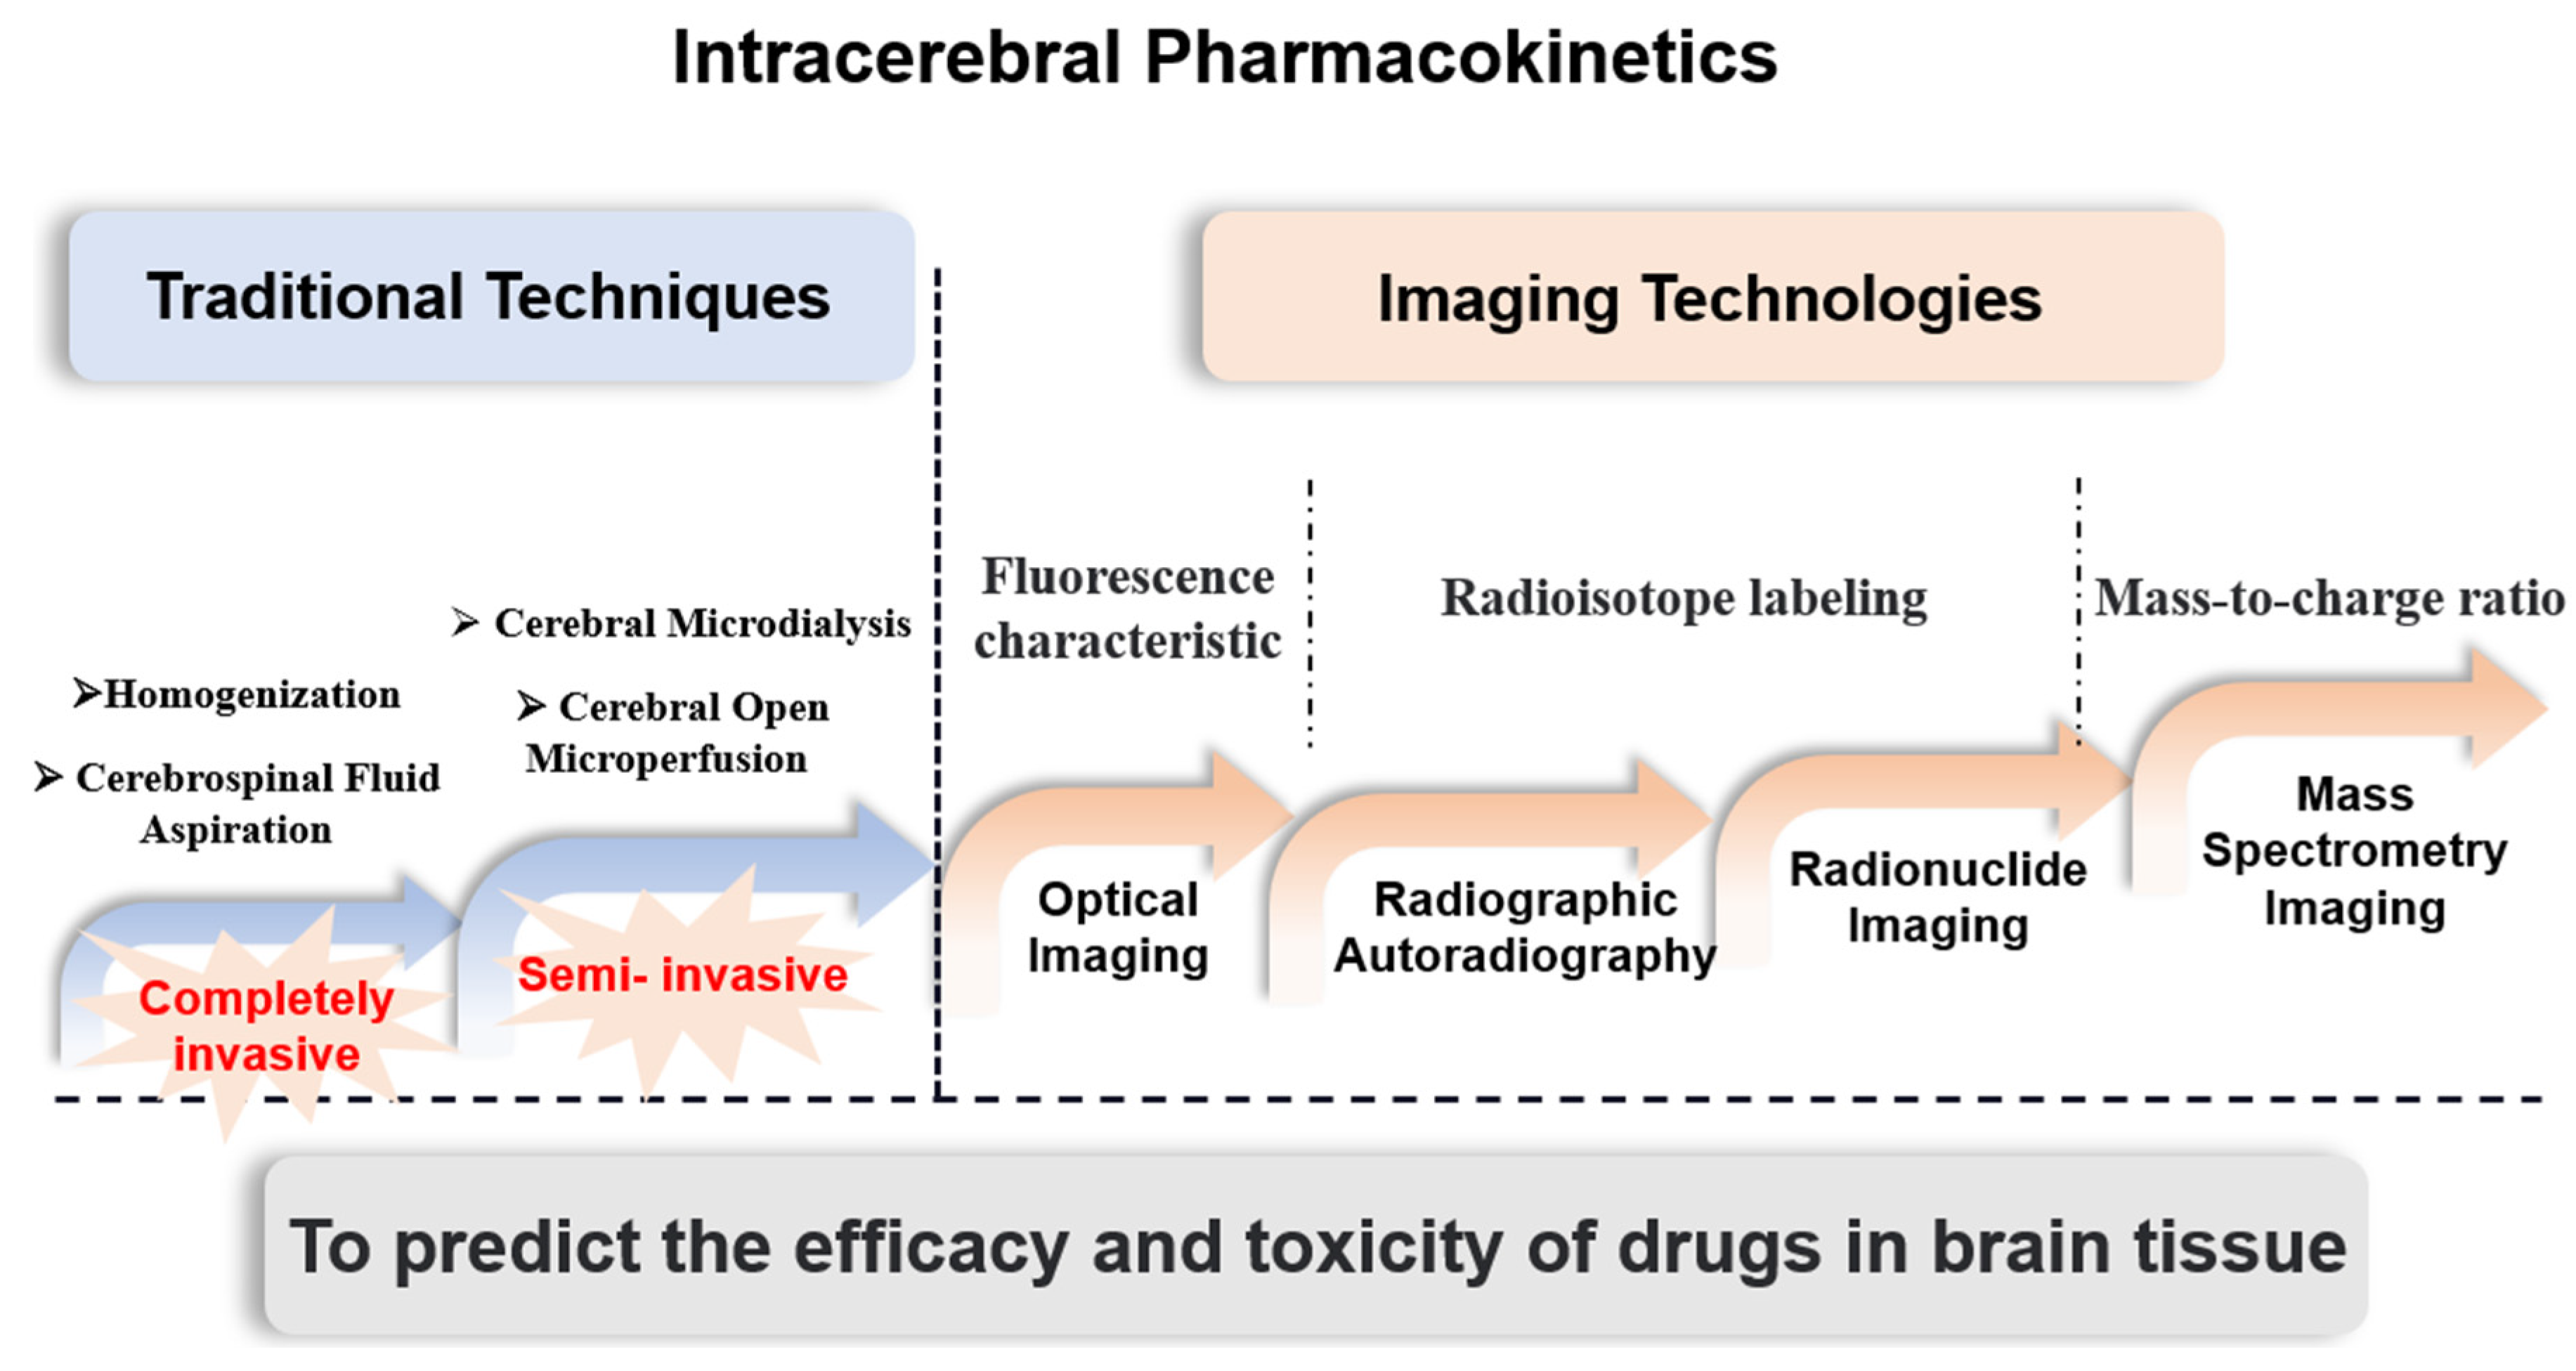
1. Introduction
2. Optical Imaging for Assessing Intracerebral Pharmacokinetics
2.1. Ex Vivo Imaging of the Brain
2.2. In Vivo Imaging of the Brain
2.2.1. NIR-I Imaging
2.2.2. NIR-II Imaging

3. Autoradiography for Assessing Intracerebral Pharmacokinetics
3.1. Whole-Body Autoradiography (WBA)
3.2. Microautoradiography (MARG)
4. Radionuclide Imaging for Assessing Intracerebral Pharmacokinetics
4.1. Positron Emission Tomography (PET)
4.2. Magnetic Resonance Imaging (MRI)
4.3. Combined Application of Nuclear Imaging Techniques
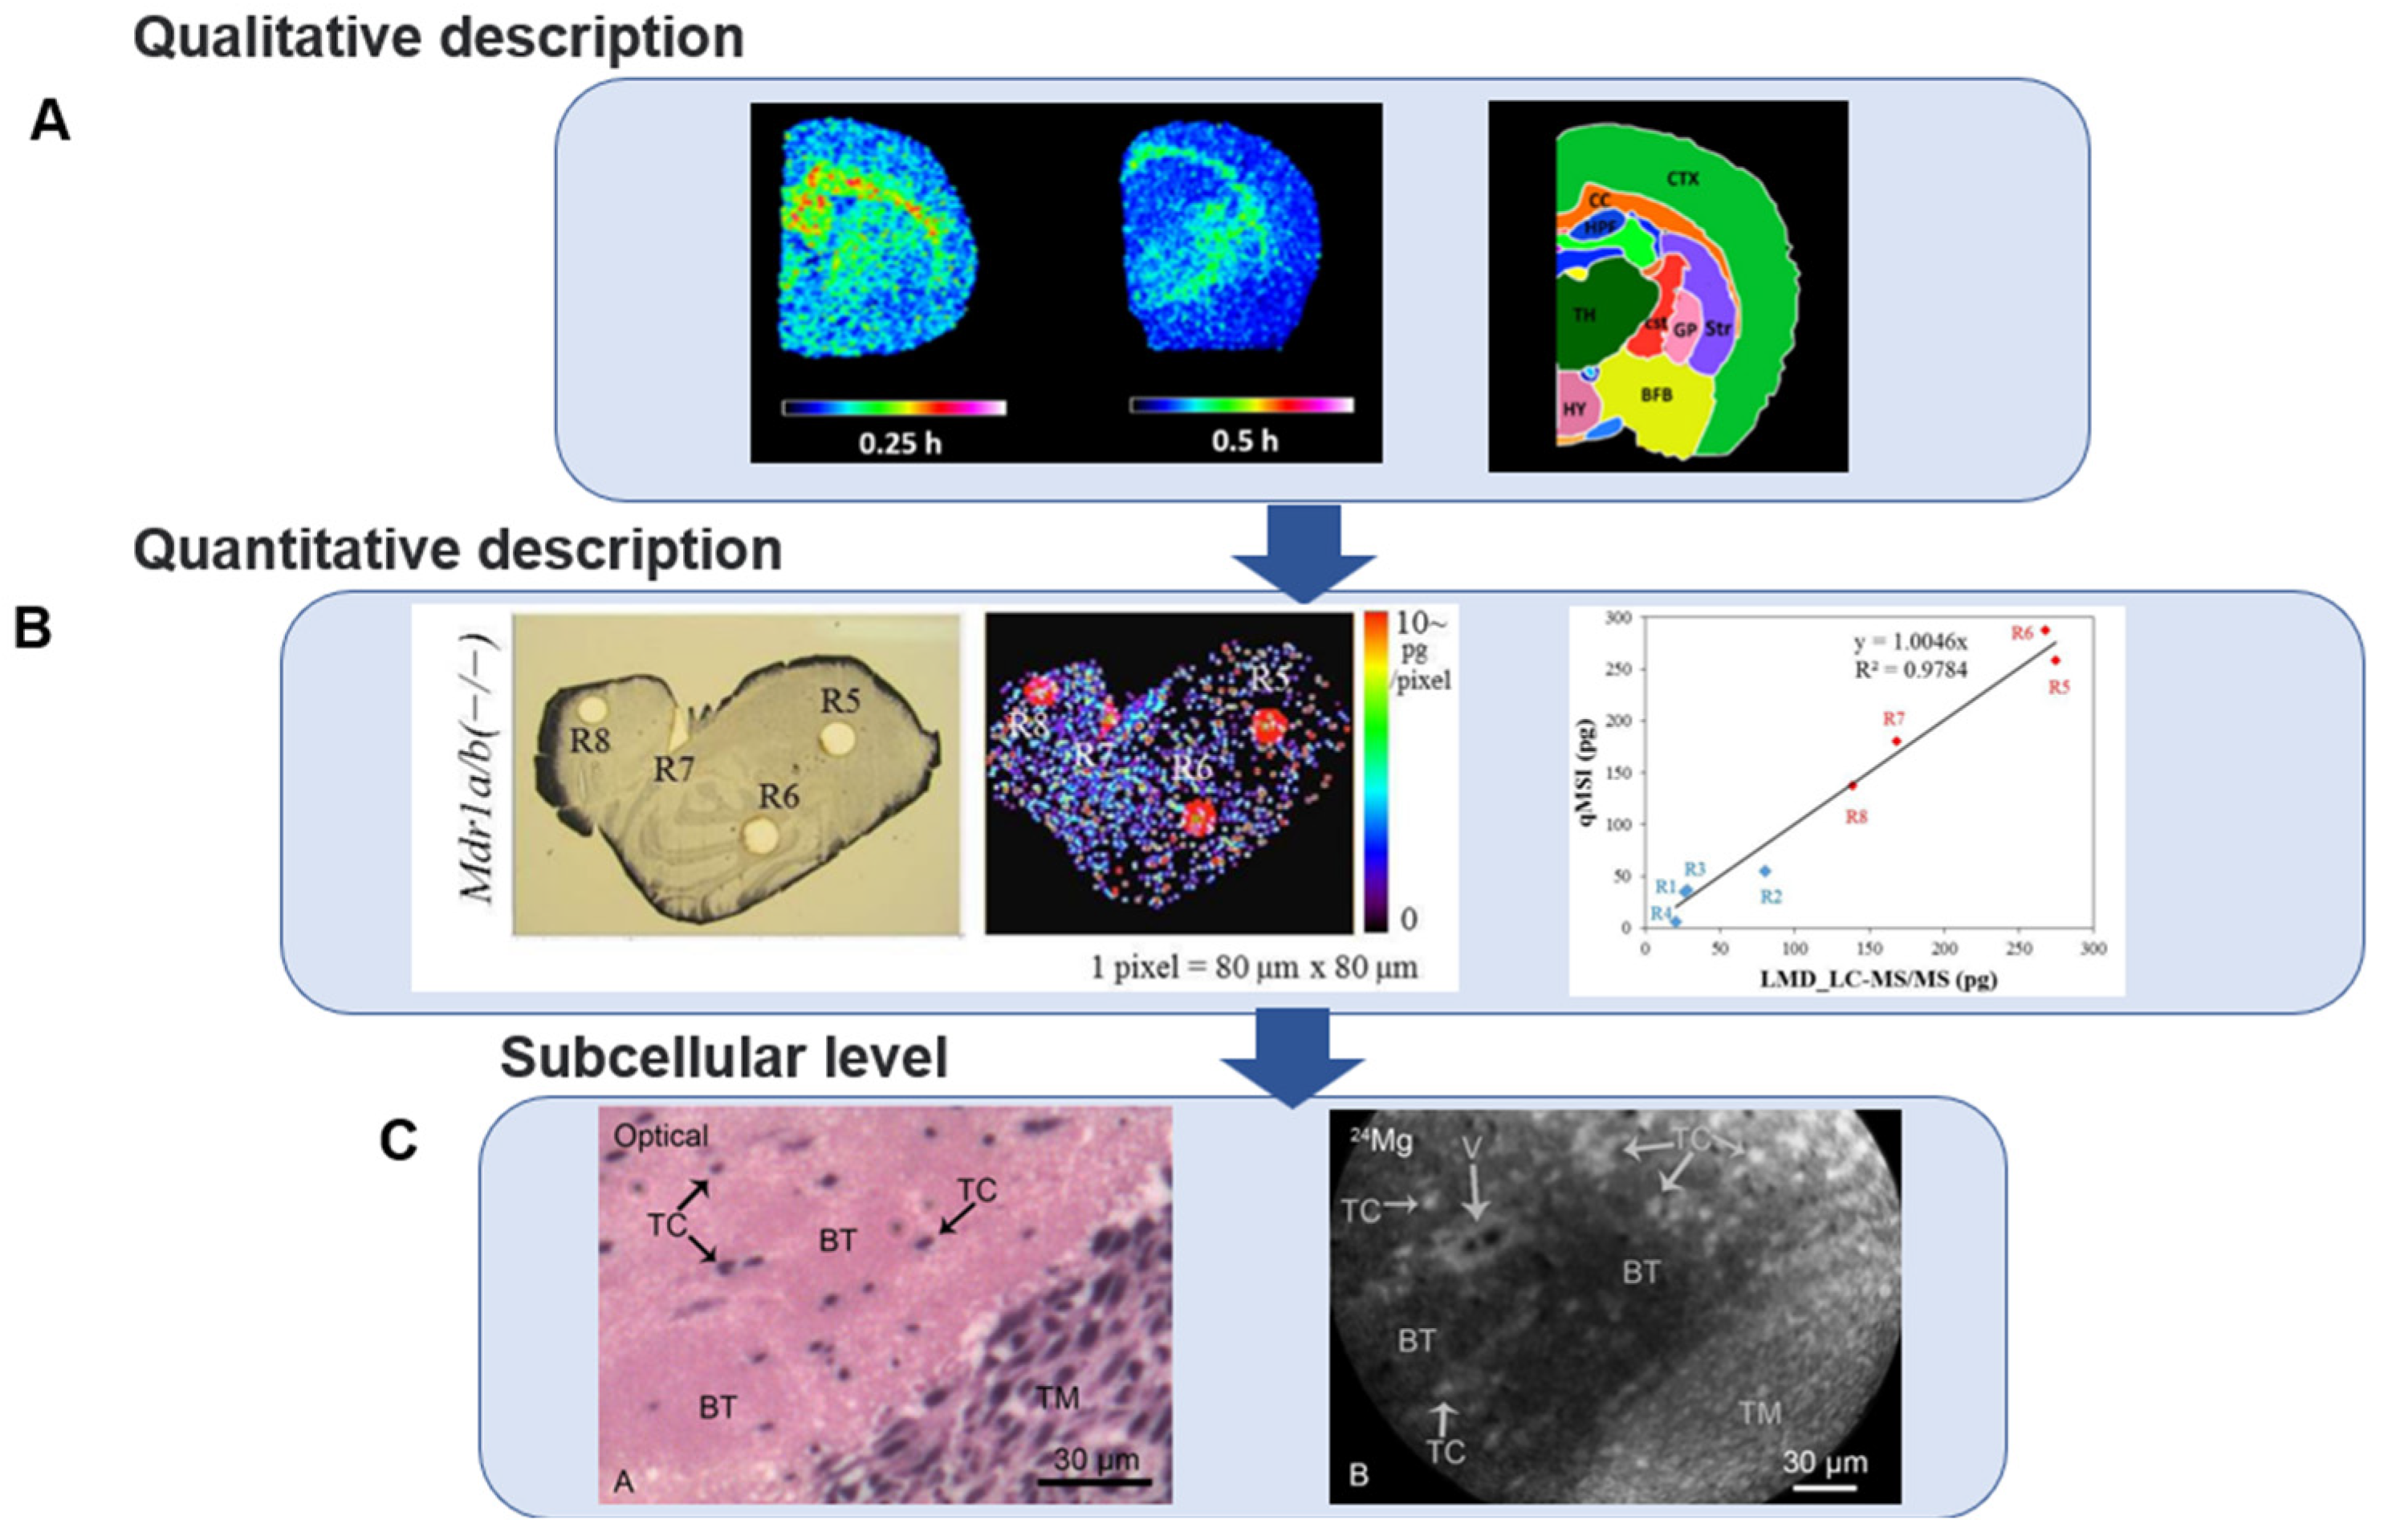
5. Mass Spectrometry Imaging for Assessing Intracerebral Pharmacokinetics
5.1. Analysis of Single-Compound Mass Spectrometry Imaging
5.2. Co-Localization Imaging with Endogenous Molecules
5.3. Microscopic Imaging
6. Conclusions and Future Direction
Author Contributions
Funding
Institutional Review Board Statement
Informed Consent Statement
Acknowledgments
Conflicts of Interest
References
- De Boer, A.G.; Gaillard, P.J. Drug targeting to the brain. Annu. Rev. Pharmacol. Toxicol. 2007, 47, 323–355. [Google Scholar] [CrossRef] [PubMed]
- Veiga, R.P.; Paiva, J.A. Pharmacokinetics-pharmacodynamics issues relevant for the clinical use of beta-lactam antibiotics in critically ill patients. Crit. Care 2018, 22, 233. [Google Scholar] [CrossRef] [PubMed]
- Lonsdale, D.O.; Udy, A.A.; Roberts, J.A.; Lipman, J. Antibacterial therapeutic drug monitoring in cerebrospinal fluid: Difficulty in achieving adequate drug concentrations. J. Neurosurg. 2013, 118, 297–301. [Google Scholar] [CrossRef] [PubMed]
- Birngruber, T.; Ghosh, A.; Hochmeister, S.; Asslaber, M.; Kroath, T.; Pieber, T.R.; Sinner, F. Long-term implanted cOFM probe causes minimal tissue reaction in the brain. PLoS ONE 2014, 9, e90221. [Google Scholar]
- Weissleder, R. Scaling down imaging: Molecular mapping of cancer in mice. Nat. Rev. Cancer 2002, 2, 11–18. [Google Scholar] [CrossRef] [PubMed]
- Tsurubuchi, T.; Zaboronok, A.; Yamamoto, T.; Nakai, K.; Yoshida, F.; Shirakawa, M.; Matsuda, M.; Matsumura, A. The optimization of fluorescence imaging of brain tumor tissue differentiated from brain edema--in vivo kinetic study of 5-aminolevulinic acid and talaporfin sodium. Photodiagnosis Photodyn. Ther. 2009, 6, 19–27. [Google Scholar] [CrossRef] [PubMed]
- Meng, Q.; Meng, H.; Pan, Y.; Liu, J.; Li, J.; Qi, Y.; Huang, Y. Influence of nanoparticle size on blood-brain barrier penetration and the accumulation of anti-seizure medicines in the brain. J. Mater. Chem. B 2022, 10, 271–281. [Google Scholar] [CrossRef]
- Park, J.S.; Kim, T.; Kim, D.; Jeong, Y.I. The effect of oxidative stress and memantine-incorporated reactive oxygen species-sensitive nanoparticles on the expression of n-methyl-d-aspartate receptor subunit 1 in brain cancer cells for Alzheimer’s disease application. Int. J. Mol. Sci. 2021, 22, 12309. [Google Scholar] [CrossRef]
- Alata, W.; Yogi, A.; Brunette, E.; Delaney, C.E.; Van faassen, H.; Hussack, G.; Iqbal, U.; Kemmerich, K.; Haqqani, A.S.; Moreno, M.J.; et al. Targeting insulin-like growth factor-1 receptor (IGF1R) for brain delivery of biologics. FASEB J. 2022, 36, e22208. [Google Scholar] [CrossRef]
- Israel, L.L.; Braubach, O.; Galstyan, A.; Chiechi, A.; Shatalova, E.S.; Grodzinski, Z.; Ding, H.; Black, K.L.; Ljubimova, J.Y.; Holler, E. A combination of tri-leucine and angiopep-2 drives a polyanionic polymalic acid nanodrug platform across the blood-brain barrier. ACS Nano 2019, 13, 1253–1271. [Google Scholar] [CrossRef]
- Taylor, A.; Sharkey, J.; Plagge, A.; Wilm, B.; Murray, P. Multicolour in vivo bioluminescence imaging using a nanoluc-based BRET reporter in combination with firefly luciferase. Contrast Media. Mol. Imaging 2018, 2018, 2514796. [Google Scholar] [CrossRef] [Green Version]
- Quick, K.; Dugan, L. Superoxide stress identifies neurons at risk in a model of ataxia-telangiectasia. Ann. Neurol. 2001, 49, 627–635. [Google Scholar] [CrossRef] [PubMed]
- Hall, D.J.; Han, S.H.; Chepetan, A.; Inui, E.G.; Rogers, M.; Dugan, L.L. Dynamic optical imaging of metabolic and NADPH oxidase-derived superoxide in live mouse brain using fluorescence lifetime unmixing. J. Cereb. Blood Flow Metab. 2012, 32, 23–32. [Google Scholar] [CrossRef] [PubMed]
- Zhou, Y.; Zhu, F.; Liu, Y.; Zheng, M.; Wang, Y.; Zhang, D.; Anraku, Y.; Zou, Y.; Li, J.; Wu, H.; et al. Blood-brain barrier-penetrating siRNA nanomedicine for Alzheimer’s disease therapy. Sci. Adv. 2020, 6, eabc7031. [Google Scholar] [CrossRef] [PubMed]
- Moreno, M.J.; Ling, B.; Stanimirovic, D.B. In vivo near-infrared fluorescent optical imaging for CNS drug discovery. Expert Opin. Drug Discov. 2020, 15, 903–915. [Google Scholar] [CrossRef] [PubMed]
- Alabugin, A. Near-IR photochemistry for biology: Exploiting the optical window of tissue. Photochem. Photobiol. 2019, 95, 722–732. [Google Scholar] [CrossRef]
- Carr, J.A.; Aellen, M.; Franke, D.; So, P.T.C.; Bruns, O.T.; Bawendi, M.G. Absorption by water increases fluorescence image contrast of biological tissue in the shortwave infrared. Proc. Natl. Acad. Sci. USA 2018, 115, 9080–9085. [Google Scholar] [CrossRef]
- Hao, Y.; Wang, L.; Zhao, Y.; Meng, D.; Li, D.; Li, H.; Zhang, B.; Shi, J.; Zhang, H.; Zhang, Z.; et al. Targeted imaging and chemo-phototherapy of brain cancer by a multifunctional drug delivery system. Macromol. Biosci. 2015, 15, 1571–1585. [Google Scholar] [CrossRef] [PubMed]
- Irwin, R.W.; Escobedo, A.R.; Shih, J.C. Near-infrared monoamine oxidase inhibitor biodistribution in a glioma mouse model. Pharm. Res. 2021, 38, 461–471. [Google Scholar] [CrossRef]
- Patil, C.; Walker, D.; Miller, D.; Butte, P.; Morrison, B.; Kittle, D.; Hansen, S.; Nufer, K.; Byrnes-Blake, K.; Yamada, M.; et al. Phase 1 safety, pharmacokinetics, and fluorescence imaging study of Tozuleristide (BLZ-100) in adults with newly diagnosed or recurrent gliomas. Neurosurgery 2019, 85, e641–e649. [Google Scholar] [CrossRef]
- Smith, A.M.; Mancini, M.C.; Nie, S. Bioimaging: Second window for in vivo imaging. Nat. Nanotechnol. 2009, 4, 710–711. [Google Scholar] [CrossRef] [PubMed] [Green Version]
- Su, Y.; Yu, B.; Wang, S.; Cong, H.; Shen, Y. NIR-II bioimaging of small organic molecule. Biomaterials 2021, 271, 120717. [Google Scholar] [CrossRef]
- Zhu, S.; Hu, Z.; Tian, R.; Yung, B.C.; Yang, Q.; Zhao, S.; Kiesewetter, D.O.; Niu, G.; Sun, H.; Antaris, A.L.; et al. Repurposing cyanine NIR-I dyes accelerates clinical translation of near-infrared-II (NIR-II) bioimaging. Adv. Mater. 2018, 30, e1802546. [Google Scholar] [CrossRef] [PubMed]
- Yu, X.; Feng, Z.; Cai, Z.; Jiang, M.; Xue, D.; Zhu, L.; Zhang, Y.; Liu, J.; Que, B.; Yang, W.; et al. Deciphering of cerebrovasculatures via ICG-assisted NIR-II fluorescence microscopy. J. Mater. Chem. B 2019, 7, 6623–6629. [Google Scholar] [CrossRef] [PubMed]
- Antaris, A.L.; Chen, H.; Cheng, K.; Sun, Y.; Hong, G.; Qu, C.; Diao, S.; Deng, Z.; Hu, X.; Zhang, B.; et al. A small-molecule dye for NIR-II imaging. Nat. Mater. 2016, 15, 235–242. [Google Scholar] [CrossRef] [PubMed]
- Boghossian , A.A.; Zhang , J.; Barone, P.W.; Reuel, N.F.; Kim, J.H.; Heller, D.A.; Ahn, J.H.; Hilmer, A.J.; Rwei, A.; Arkalgud, J.R.; et al. Near-infrared fluorescent sensors based on single-walled carbon nanotubes for life sciences applications. Chemsuschem 2011, 4, 848–863. [Google Scholar] [CrossRef] [PubMed]
- Yu, W.W.; Chang, E.; Drezek, R.; Colvin, V.L. Water-soluble quantum dots for biomedical applications. Biochem. Biophys. Res. Commun. 2006, 348, 781–786. [Google Scholar] [CrossRef]
- Wan, H.; Yue, J.; Zhu, S.; Uno, T.; Zhang, X.; Yang, Q.; Yu, K.; Hong, G.; Wang, J.; Li, L.; et al. A bright organic NIR-II nanofluorophore for three-dimensional imaging into biological tissues. Nat. Commun. 2018, 9, 1171. [Google Scholar] [CrossRef]
- Chen, S.; Miao, H.; Jiang, X.; Sun, P.; Fan, Q.; Huang, W. Starlike polymer brush-based ultrasmall nanoparticles with simultaneously improved NIR-II fluorescence and blood circulation for efficient orthotopic glioblastoma imaging. Biomaterials 2021, 275, 120916. [Google Scholar] [CrossRef]
- Hironaka, T.; Inazawa, K.; Tanaka, Y.; Hasegawa, H. Simple methodology for ensuring the precision of measuring radioactivity at low concentrations in very small tissues using quantitative whole-body autoradiography. Regul. Toxicol. Pharmacol. 2021, 119, 104835. [Google Scholar] [CrossRef]
- Kertesz, V.; Van Berkel, G.; Vavrek, M.; Koeplinger, K.; Schneider, B.; Covey, T. Comparison of drug distribution images from whole-body thin tissue sections obtained using desorption electrospray ionization tandem mass spectrometry and autoradiography. Anal. Chem. 2008, 80, 5168–5177. [Google Scholar] [CrossRef] [PubMed]
- Pan, M.; Yao, Y.; Xu, Z.; Liu, Q. Distribution of d-methamphetamine in mice brains by quantitative whole-body autoradiography technique. World Clin. Drugs 2014, 35, 740–744. [Google Scholar]
- Perry, D.C. Autoradiography of [3H]quipazine in rodent brain. Eur. J. Pharmacol. 1990, 187, 75–85. [Google Scholar] [CrossRef]
- Faresjo, R.; Bonvicini, G.; Fang, X.T.; Aguilar, X.; Sehlin, D.; Syvanen, S. Brain pharmacokinetics of two BBB penetrating bispecific antibodies of different size. Fluids Barriers CNS 2021, 18, 26. [Google Scholar] [CrossRef] [PubMed]
- Penner, N.; Purushothama, S.; Pepinsky, B. Tissue distribution of 35S-metabolically labeled neublastin (BG00010) in rats. J. Pharm. Biomed. 2020, 184, 113154. [Google Scholar] [CrossRef] [PubMed]
- Stumpf, W.E. Whole-body and microscopic autoradiography to determine tissue distribution of biopharmaceuticals -- target discoveries with receptor micro-autoradiography engendered new concepts and therapies for vitamin d. Adv. Drug Deliv. Rev. 2013, 65, 1086–1097. [Google Scholar] [CrossRef] [PubMed]
- Baumann, A.; Piel, I.; Hucke, F.; Sandmann, S.; Hetzel, T.; Schwarz, T. Pharmacokinetics, excretion, distribution, and metabolism of 60-kDa polyethylene glycol used in BAY 94-9027 in rats and its value for human prediction. Eur. J. Pharm. Sci. 2019, 130, 11–20. [Google Scholar] [CrossRef]
- Belanger, L.; Leblond, C. A method for locating radioactive elements in tissues by covering histological sections with a photographic emulsion. Endocrinology 1946, 39, 8–13. [Google Scholar] [CrossRef]
- Pelc, S. Autoradiograph technique. Nature 1947, 160, 749. [Google Scholar] [CrossRef]
- Wang, H.; Liao, A.; Deng, W. Evaluation of 4-borono-2-18F-fluoro-LPhenylalanine-fructose as a probe for boron neutron capture therapy in a glioma-bearing rat model. J. Nucl. Med. 2004, 45, 302–308. [Google Scholar]
- Mizoguchi, K.; Kanno, H.; Ikarashi, Y.; Kase, Y. Specific binding and characteristics of 18beta-glycyrrhetinic acid in rat brain. PLoS ONE 2014, 9, e95760. [Google Scholar] [CrossRef] [PubMed]
- Farar, V.; Valuskova, P.; Sevcikova, M.; Myslivecek, J.; Slamberova, R. Mapping of the prenatal and postnatal methamphetamine effects on D1-like dopamine, M1 and M2 muscarinic receptors in rat central nervous system. Brain Res. Bull. 2018, 137, 17–22. [Google Scholar] [CrossRef] [PubMed]
- Hounsfield, G. Computerized transverse axial scanning (tomography). 1. Description of system. Br. J. Radiol. 1973, 46, 1016–1022. [Google Scholar] [CrossRef] [PubMed]
- Raichle, M.; Mintun, M. Brain work and brain imaging. Annu. Rev. Neurosci. 2006, 29, 449–476. [Google Scholar] [CrossRef]
- Fowler, J.; Volkow, N.; Wang, G.; Ding, Y.; Dewey, S. PET and drug research and development. J. Nucl. Med. 1999, 40, 1154–1163. [Google Scholar]
- Damont, A.; Goutal, S.; Auvity, S.; Valette, H.; Kuhnast, B.; Saba, W.; Tournier, N. Imaging the impact of cyclosporin A and dipyridamole on P-glycoprotein (ABCD1) function at the blood-brain barrier: A [11C]-N-desmethyl-loperamide PET study in nonhuman primates. Eur. J. Pharm. Sci. 2016, 91, 98–104. [Google Scholar] [CrossRef]
- Xin, Y.; Gao, X.; Liu, L.; Ge, W.P.; Jain, M.K.; Cai, H. Evaluation of L-1-[18F]Fluoroethyl-Tryptophan for PET imaging of cancer. Mol. Imaging Biol. 2019, 21, 1138–1146. [Google Scholar] [CrossRef]
- Ogata, A.; Kimura, Y.; Ikenuma, H.; Yamada, T.; Abe, J.; Koyama, H.; Suzuki, M.; Ichise, M.; Kato, T.; Ito, K. Brain pharmacokinetics and biodistribution of 11C-labeled isoproterenol in rodents. Nucl. Med. Biol. 2020, 86–87, 52–58. [Google Scholar] [CrossRef]
- Lanz, B.; Poitry-Yamate, C.; Gruetter, R. Image-derived input function from the vena cava for 18F-FDG PET studies in rats and mice. J. Nucl. Med. 2014, 55, 1380–1388. [Google Scholar] [CrossRef]
- Jans, H.; Yang, X.; Brocks, D.; Kumar, P.; Wuest, M.; Wiebe, L. Positron emission tomography (PET) and pharmacokinetics: Classical blood sampling versus image-derived analysis of [18F]FAZA and [18F]FDG in a murine tumor bearing model. J. Pharm. Pharm. 2018, 21, 32s–47s. [Google Scholar] [CrossRef]
- Convert, L.; Lebel, R.; Gascon, S.; Fontaine, R.; Pratte, J.F.; Charette, P.; Aimez, V.; Lecomte, R. Real-time microfluidic blood-counting system for PET and SPECT preclinical pharmacokinetic studies. J. Nucl. Med. 2016, 57, 1460–1466. [Google Scholar] [CrossRef] [PubMed]
- Weber, B.; Burger, C.; Biro, P.; Buck, A. A femoral arteriovenous shunt facilitates arterial whole blood sampling in animals. Eur. J. Nucl. Med. Mol. Imaging 2002, 29, 319–323. [Google Scholar] [CrossRef] [PubMed]
- Warnock, G.; Bahri, M.; Goblet, D.; Giacomelli, F.; Lemaire, C.; Aerts, J.; Seret, A.; Langlois, X.; Luxen, A.; Plenevaux, A. Use of a beta microprobe system to measure arterial input function in PET via an arteriovenous shunt in rats. Ejnmmi Res. 2011, 1, 13. [Google Scholar] [CrossRef]
- Gunn, R.N.; Summerfield, S.G.; Salinas, C.A.; Read, K.D.; Guo, Q.; Searle, G.E.; Parker, C.A.; Jeffrey, P.; Laruelle, M. Combining PET biodistribution and equilibrium dialysis assays to assess the free brain concentration and BBB transport of CNS drugs. J. Cereb. Blood Flow Metab. 2012, 32, 874–883. [Google Scholar] [CrossRef] [PubMed] [Green Version]
- Aarnio, R.; Alzghool, O.M.; Wahlroos, S.; O’Brien-Brown, J.; Kassiou, M.; Solin, O.; Rinne, J.O.; Forsback, S.; Haaparanta-Solin, M. Novel plasma protein binding analysis method for a PET tracer and its radiometabolites: A case study with [11C]SMW139 to explain the high uptake of radiometabolites in mouse brain. J. Pharm. Biomed. 2022, 219, 114860. [Google Scholar] [CrossRef] [PubMed]
- Valdez, M.A.; Fernandez, E.; Matsunaga, T.; Erickson, R.P.; Trouard, T.P. Distribution and diffusion of macromolecule delivery to the brain via focused ultrasound using magnetic resonance and multispectral fluorescence imaging. Ultrasound Med. Biol. 2020, 46, 122–136. [Google Scholar] [CrossRef] [PubMed]
- Chai, W.Y.; Chu, P.C.; Tsai, M.Y.; Lin, Y.C.; Wang, J.J.; Wei, K.C.; Wai, Y.Y.; Liu, H.L. Magnetic-resonance imaging for kinetic analysis of permeability changes during focused ultrasound-induced blood-brain barrier opening and brain drug delivery. J. Control. Release 2014, 192, 1–9. [Google Scholar] [CrossRef]
- Lin, Y.L.; Wu, M.T.; Yang, F.Y. Pharmacokinetics of doxorubicin in glioblastoma multiforme following ultrasound-induced blood-brain barrier disruption as determined by microdialysis. J. Pharm. Biomed. 2018, 149, 482–487. [Google Scholar] [CrossRef]
- Marinkovic, I.; Tatlisumak, T.; Abo-Ramadan, U.; Brkic, B.G.; Aksic, M.; Marinkovic, S. A basic MRI anatomy of the rat brain in coronal sections for practical guidance to neuroscientists. Brain Res. 2020, 1747, 147021. [Google Scholar] [CrossRef]
- Tolosa, E.; Garrido, A.; Scholz, S.W.; Poewe, W. Challenges in the diagnosis of Parkinson’s disease. Lancet Neurol. 2021, 20, 385–397. [Google Scholar] [CrossRef]
- Matsuura, K.; Ii, Y.; Maeda, M.; Tabei, K.I.; Satoh, M.; Umino, M.; Miyashita, K.; Ishikawa, H.; Shindo, A.; Tomimoto, H. Neuromelanin-sensitive magnetic resonance imaging in disease differentiation for parkinsonism or neurodegenerative disease affecting the basal ganglia. Park. Relat. Disord. 2021, 87, 75–81. [Google Scholar] [CrossRef] [PubMed]
- Tan, S.; Hartono, S.; Welton, T.; Ann, C.N.; Lim, S.L.; Koh, T.S.; Li, H.; Setiawan, F.; Ng, S.; Chia, N.; et al. Utility of quantitative susceptibility mapping and diffusion kurtosis imaging in the diagnosis of early Parkinson’s disease. Neuroimage Clin. 2021, 32, 102831. [Google Scholar] [CrossRef] [PubMed]
- Caso, F.; Agosta, F.; Scamarcia, P.G.; Basaia, S.; Canu, E.; Magnani, G.; Volonte, M.A.; Filippi, M. A multiparametric MRI study of structural brain damage in dementia with lewy bodies: A comparison with Alzheimer’s disease. Park. Relat. Disord. 2021, 91, 154–161. [Google Scholar] [CrossRef] [PubMed]
- Ehman, E.C.; Johnson, G.B.; Villanueva-Meyer, J.E.; Cha, S.; Leynes, A.P.; Larson, P.E.Z.; Hope, T.A. PET/MRI: Where might it replace PET/CT? J. Magn. Reson. Imaging 2017, 46, 1247–1262. [Google Scholar] [CrossRef] [PubMed] [Green Version]
- Lesniak, W.G.; Chu, C.; Jablonska, A.; Du, Y.; Pomper, M.G.; Walczak, P.; Janowski, M. A distinct advantage to intraarterial delivery of (89)Zr-Bevacizumab in PET imaging of mice with and without osmotic opening of the blood-brain barrier. J. Nucl. Med. 2019, 60, 617–622. [Google Scholar] [CrossRef] [PubMed]
- Kang, B.T.; Son, Y.D.; Lee, S.R.; Jung, D.I.; Kim, D.E.; Chang, K.T.; Cho, Z.H.; Park, H.M. FDG uptake of normal canine brain assessed by high-resolution research tomography-positron emission tomography and 7 T-magnetic resonance imaging. J. Vet. Med. Sci. 2012, 74, 1261–1267. [Google Scholar] [CrossRef]
- Zhang, X.; Hou, Y.; Peng, C.; Wang, C.; Wang, X.; Liang, Z.; Lu, J.; Chen, B.; Dai, J.; Liu, B.; et al. Oligoethyleneoxy-modified 99mTc-labeled beta-amyloid imaging probes with improved brain pharmacokinetics for single-photon emission computed tomography. J. Med. Chem. 2018, 61, 1330–1339. [Google Scholar] [CrossRef]
- Mazur, C.; Powers, B.; Zasadny, K.; Sullivan, J.M.; Dimant, H.; Kamme, F.; Hesterman, J.; Matson, J.; Oestergaard, M.; Seaman, M.; et al. Brain pharmacology of intrathecal antisense oligonucleotides revealed through multimodal imaging. JCI Insight 2019, 4, e129240. [Google Scholar] [CrossRef]
- Baker, M. metabolomics: From small molecules to big ideas. Nat. Methods 2011, 8, 117–121. [Google Scholar] [CrossRef]
- Davoli, E.; Zucchetti, M.; Matteo, C.; Ubezio, P.; D’incalci, M.; Morosi, L. The space dimension at the micro level: Mass spectrometry imaging of drugs in tissues. Mass Spectrom. Rev. 2021, 40, 201–214. [Google Scholar] [CrossRef]
- Ntshangase, S.; Mdanda, S.; Naicker, T.; Kruger, H.G.; Baijnath, S.; Govender, T. Spatial distribution of elvitegravir and tenofovir in rat brain tissue: Application of matrix-assisted laser desorption/ionization mass spectrometry imaging and liquid chromatography/tandem mass spectrometry. Rapid Commun. Mass Spectrom. 2019, 33, 1643–1651. [Google Scholar] [CrossRef] [PubMed]
- Shobo, A.; Bratkowska, D.; Baijnath, S.; Naiker, S.; Somboro, A.M.; Bester, L.A.; Singh, S.D.; Naicker, T.; Kruger, H.G.; Govender, T. Tissue distribution of pretomanid in rat brain via mass spectrometry imaging. Xenobiotica 2016, 46, 247–252. [Google Scholar] [CrossRef] [PubMed]
- Mdanda, S.; Ntshangase, S.; Singh, S.D.; Naicker, T.; Kruger, H.G.; Baijnath, S.; Govender, T. Investigating time dependent brain distribution of nevirapine via mass spectrometric imaging. J. Mol. Histol. 2019, 50, 593–599. [Google Scholar] [CrossRef] [PubMed]
- Ntshangase, S.; Mdanda, S.; Naicker, T.; Kruger, H.G.; Govender, T.; Baijnath, S. Rilpivirine as a potential candidate for the treatment of HIV-associated neurocognitive disorders (HAND). J. Mol. Histol. 2019, 50, 295–303. [Google Scholar] [CrossRef]
- Aikawa, H.; Hayashi, M.; Ryu, S.; Yamashita, M.; Ohtsuka, N.; Nishidate, M.; Fujiwara, Y.; Hamada, A. Visualizing spatial distribution of alectinib in murine brain using quantitative mass spectrometry imaging. Sci. Rep. 2016, 6, 23749. [Google Scholar] [CrossRef] [PubMed]
- Tanaka, Y.; Hirata, M.; Shinonome, S.; Torii, M.; Nezasa, K.I.; Tanaka, H. Distribution analysis of epertinib in brain metastasis of HER2-positive breast cancer by imaging mass spectrometry and prospect for antitumor activity. Sci. Rep. 2018, 8, 343. [Google Scholar] [CrossRef]
- Prasad, M.; Postma, G.; Franceschi, P.; Morosi, L.; Giordano, S.; Falcetta, F.; Giavazzi, R.; Davoli, E.; Buydens, L.M.C.; Jansen, J. A methodological approach to correlate tumor heterogeneity with drug distribution profile in mass spectrometry imaging data. Gigascience 2020, 9, giaa131. [Google Scholar] [CrossRef] [PubMed]
- Pokorny, J.L.; Calligaris, D.; Gupta, S.K.; Iyekegbe, D.O.; Mueller, D.; Bakken, K.K.; Carlson, B.L.; Schroeder, M.A.; Evans, D.L.; Lou, Z.; et al. The efficacy of the wee1 inhibitor MK-1775 combined with temozolomide is limited by heterogeneous distribution across the blood-brain barrier in glioblastoma. Clin. Cancer Res. 2015, 21, 1916–1924. [Google Scholar] [CrossRef] [PubMed]
- Rzagalinski, I.; Hainz, N.; Meier, C.; Tschernig, T.; Volmer, D.A. Spatial and molecular changes of mouse brain metabolism in response to immunomodulatory treatment with teriflunomide as visualized by MALDI-MSI. Anal. Bioanal. Chem. 2019, 411, 353–365. [Google Scholar] [CrossRef] [PubMed]
- Passarelli, M.K.; Newman, C.F.; Marshall, P.S.; West, A.; Gilmore, I.S.; Bunch, J.; Alexander, M.R.; Dollery, C.T. Single-cell analysis: Visualizing pharmaceutical and metabolite uptake in cells with label-free 3D mass spectrometry imaging. Anal. Chem. 2015, 87, 6696–6702. [Google Scholar] [CrossRef]
- Chandra, s.; Parker, D.J.; Barth, R.F.; Pannullo, S.C. Quantitative imaging of magnesium distribution at single-cell resolution in brain tumors and infiltrating tumor cells with secondary ion mass spectrometry (SIMS). J. Neurooncol. 2016, 127, 33–41. [Google Scholar] [CrossRef] [PubMed]
- Passarelli, M.; Pirkl, A.; Moellers, R.; Grinfeld, D.; Kollmer, F.; Havelund, R.; Newman, C.; Marshall, P.; Arlinghaus, H.; Alexander, M.; et al. The 3D OrbiSIMS-label-free metabolic imaging with subcellular lateral resolution and high mass-resolving power. Nat. Methods 2017, 14, 1175–1183. [Google Scholar] [CrossRef] [PubMed]
- Zhou, F.; Zhang, J.; Li, P.; Niu, F.; Wu, X.; Wang, G.; Roberts, M.S. Toward a new age of cellular pharmacokinetics in drug discovery. Drug Metab. Rev. 2011, 43, 335–345. [Google Scholar] [CrossRef] [PubMed]
- Overington, J.; Al-Lazikani, B.; Hopkins, A. How many drug targets are there? Nat. Rev. Drug Discov. 2006, 5, 993–996. [Google Scholar] [CrossRef]
- Chu, X.; Korzekwa, K.; Elsby, R.; Fenner, K.; Galetin, A.; Lai, Y.; Matsson, P.; Moss, A.; Nagar, S.; Rosania, G.R.; et al. Intracellular drug concentrations and transporters: Measurement, modeling, and implications for the liver. Clin. Pharmacol. Ther. 2013, 94, 126–141. [Google Scholar] [CrossRef] [PubMed] [Green Version]

| Analysis Method | State of the Sample | Spatial Resolution | Cost | Safety | Application | |
|---|---|---|---|---|---|---|
| Optical Imaging | Microscopy | Isolated tissue | 10–200 μm | Low | Good | Visualization of drugs in whole or finer structured brain tissue |
| NIR-I | Living | 1–2 mm | Medium | Good | Overall/local brain tissue visualization | |
| NIR-II | Living | Range from 10 μm to 1–2 mm | Medium | Good | Visualization of cerebrovascular and intracerebral tumors | |
| Autoradiography | WBA | Frozen section | 50–100 μm | High (time) | Medium | Overall/local brain tissue visualization |
| MARG | Frozen section | Can reach 1 μm | High (time) | Medium | Cellular/receptor localization | |
| Radionuclide imaging | PET | Living | 1–2 mm | High | Medium | Joint application: overall/local brain tissue visualization |
| MRI | Living | 50–500 μm | High | Medium | ||
| CT | Living | 10–500 μm | Medium | Medium | ||
| MSI | Frozen section | Range from 50 nm to 200–300 μm | High | Good | Single/multiple molecules co-localization visualization | |
Publisher’s Note: MDPI stays neutral with regard to jurisdictional claims in published maps and institutional affiliations. |
© 2022 by the authors. Licensee MDPI, Basel, Switzerland. This article is an open access article distributed under the terms and conditions of the Creative Commons Attribution (CC BY) license (https://creativecommons.org/licenses/by/4.0/).
Share and Cite
Ban, W.; You, Y.; Yang, Z. Imaging Technologies for Cerebral Pharmacokinetic Studies: Progress and Perspectives. Biomedicines 2022, 10, 2447. https://doi.org/10.3390/biomedicines10102447
Ban W, You Y, Yang Z. Imaging Technologies for Cerebral Pharmacokinetic Studies: Progress and Perspectives. Biomedicines. 2022; 10(10):2447. https://doi.org/10.3390/biomedicines10102447
Chicago/Turabian StyleBan, Weikang, Yuyang You, and Zhihong Yang. 2022. "Imaging Technologies for Cerebral Pharmacokinetic Studies: Progress and Perspectives" Biomedicines 10, no. 10: 2447. https://doi.org/10.3390/biomedicines10102447
APA StyleBan, W., You, Y., & Yang, Z. (2022). Imaging Technologies for Cerebral Pharmacokinetic Studies: Progress and Perspectives. Biomedicines, 10(10), 2447. https://doi.org/10.3390/biomedicines10102447