1. Introduction
Programmed death proteins PD-1, PD-L1 and PD-L2 participate in an important immune regulatory signaling pathway. PD-1 (32 kDa) is a transmembrane receptor encoded in the Pdcd1 gene. Its highly glycolsylated profile is an important pattern for ligand interaction [
1,
2]. PD-L1 (33 kDa) and PD-L2 (31 kDA) serve as PD-1’s corresponding ligands and are encoded by the
Cd274 gene and
Pdcd1lg2 gene [
1]. Receptors and both ligands have been described to be present on immune cells as well as soluble markers in blood plasma and serum [
1,
3]. PD-1 is expressed on the surface of activated T-cells, B-cells, myeloid cells and macrophages [
3,
4,
5,
6]. The ligands are found on antigen-presenting cells and dendritic cells as well as a variety of other hematopoetic and non-hematopoetic cells [
7,
8]. Interaction of receptor and ligand downregulates T-cell activity and as such physiologically serves as an immune tolerance mechanism [
1,
9]. Numerous tumor cells have been shown to use the expression of ligand PD-L1 to evade elimination by the immune system [
1,
10,
11]. The understanding of this interaction has led to the development of immune checkpoint inhibitors (ICI) with pembrolizumab representing the first approved PD-1 inhibitor. The experienced efficacy and safety profile marked the starting point of the still ongoing development of various PD-1 and programmed death-ligand 1 (PD-L1) inhibitors by different companies.
Today, diverse ICIs are listed in therapy guidelines of different solid tumors including melanoma and non-small cell lung cancer (NSCLC) [
12]. Their application resulted in a longer progression-free period and overall survival and improved patients’ quality of life [
13,
14]. Currently, combination therapies are assessed [
15].
ICI medication is costly and bears the risk for severe side effects, while only between 10 and 40% of the patients benefit from the treatment [
16,
17]. Consequently, there is a strong need for inexpensive and reliable patient stratification and monitoring of efficacy in vivo. One of the currently available methods is immunohistochemistry (IHC) staining based on anti-PD-L1 antibodies. The limitations of IHC are widely discussed in the literature and foster the research on other biomarkers, such as tumor mutational burden (TMB), tumor-infiltrating lymphocytes (TILs), immune score and others [
17,
18,
19,
20,
21]. Limitations of this methods are the incorporation of expensive sequencing data and the lack of capturing tumor heterogeneity and longitudinal surveillance by using biopsy material. The aim of this work is to establish and validate a blood-based ELISA for the sensitive quantification of soluble biomarkers PD-1, PD-L1 and PD-L2. This approach will be able to combine inexpensive measurements on easily accessible sample material with the ability for longitudinal monitoring and individual in vivo efficacy testing, thereby improving oncoimmunology research and sensitive monitoring of anti-cancer immunotherapy.
2. Materials and Methods
The methods for all three programmed death protein markers (PD markers) were developed as ELISAs using monoclonal antibodies and recombinant protein standards (R&D Systems, Inc., Minneapolis, MN, USA). The assays were established as chemiluminescence detection methods on the MESO QuickPlex SQ 120 instrument (Meso Scale Discovery, LLC., Rockville, MD, USA), which provided an open platform for self-developed ELISAs. QUICKPLEX®96 well plates, SULFO-TAG Streptavidin and MSD GOLD Read Buffer were purchased from the manufacturer (Meso Scale Discovery, LLC., Rockville, MD, USA).
All assays were performed following the standard procedure. The carbon surface of the plate was coated with the capture antibody overnight at 2–8 °C. A blocking step with Albumin Fraction V (Carl Roth GmbH+Co.KG, Karlsruhe, Germany) reduced non-specific sample binding. In the next step, the standards, controls and samples were pipetted on the plate, followed by the biotin-coupled detection antibody. Finally, the streptavidin-coupled detection reagent was incubated. All incubation steps were followed by a three-times washing step using 0,05% TWEEN®20 in PBS (TWEEN®20, Merck KGaA, Darmstadt, Germany; ROTI®-CELL 10x PBS, Carl Roth GmbH+Co.KG, Karlsruhe, Germany). After application of the read buffer, the plate was measured within fifteen minutes on the MESO QuickPlex SQ 120. Data procession and analysis was performed with the supplied Discovery Workbench 4.0.12 (LSR_4_0_12) (Meso Scale Discovery, LLC., Rockville, MD, USA).
The established workflow comprised three main parts: (i) development and optimization of the assays, subsequently followed by standardization and introduction of appropriate quality controls; (ii) comprehensive analytical validation consisting of experiments for general assay settings, matrix effects, imprecision, dilution linearity, assay characteristics and selectivity; (iii) establishment of a workflow for a validated standard operating procedure (SOP) by combining and adapting different recommendations and guidelines.
2.1. Assay Development and Optimization
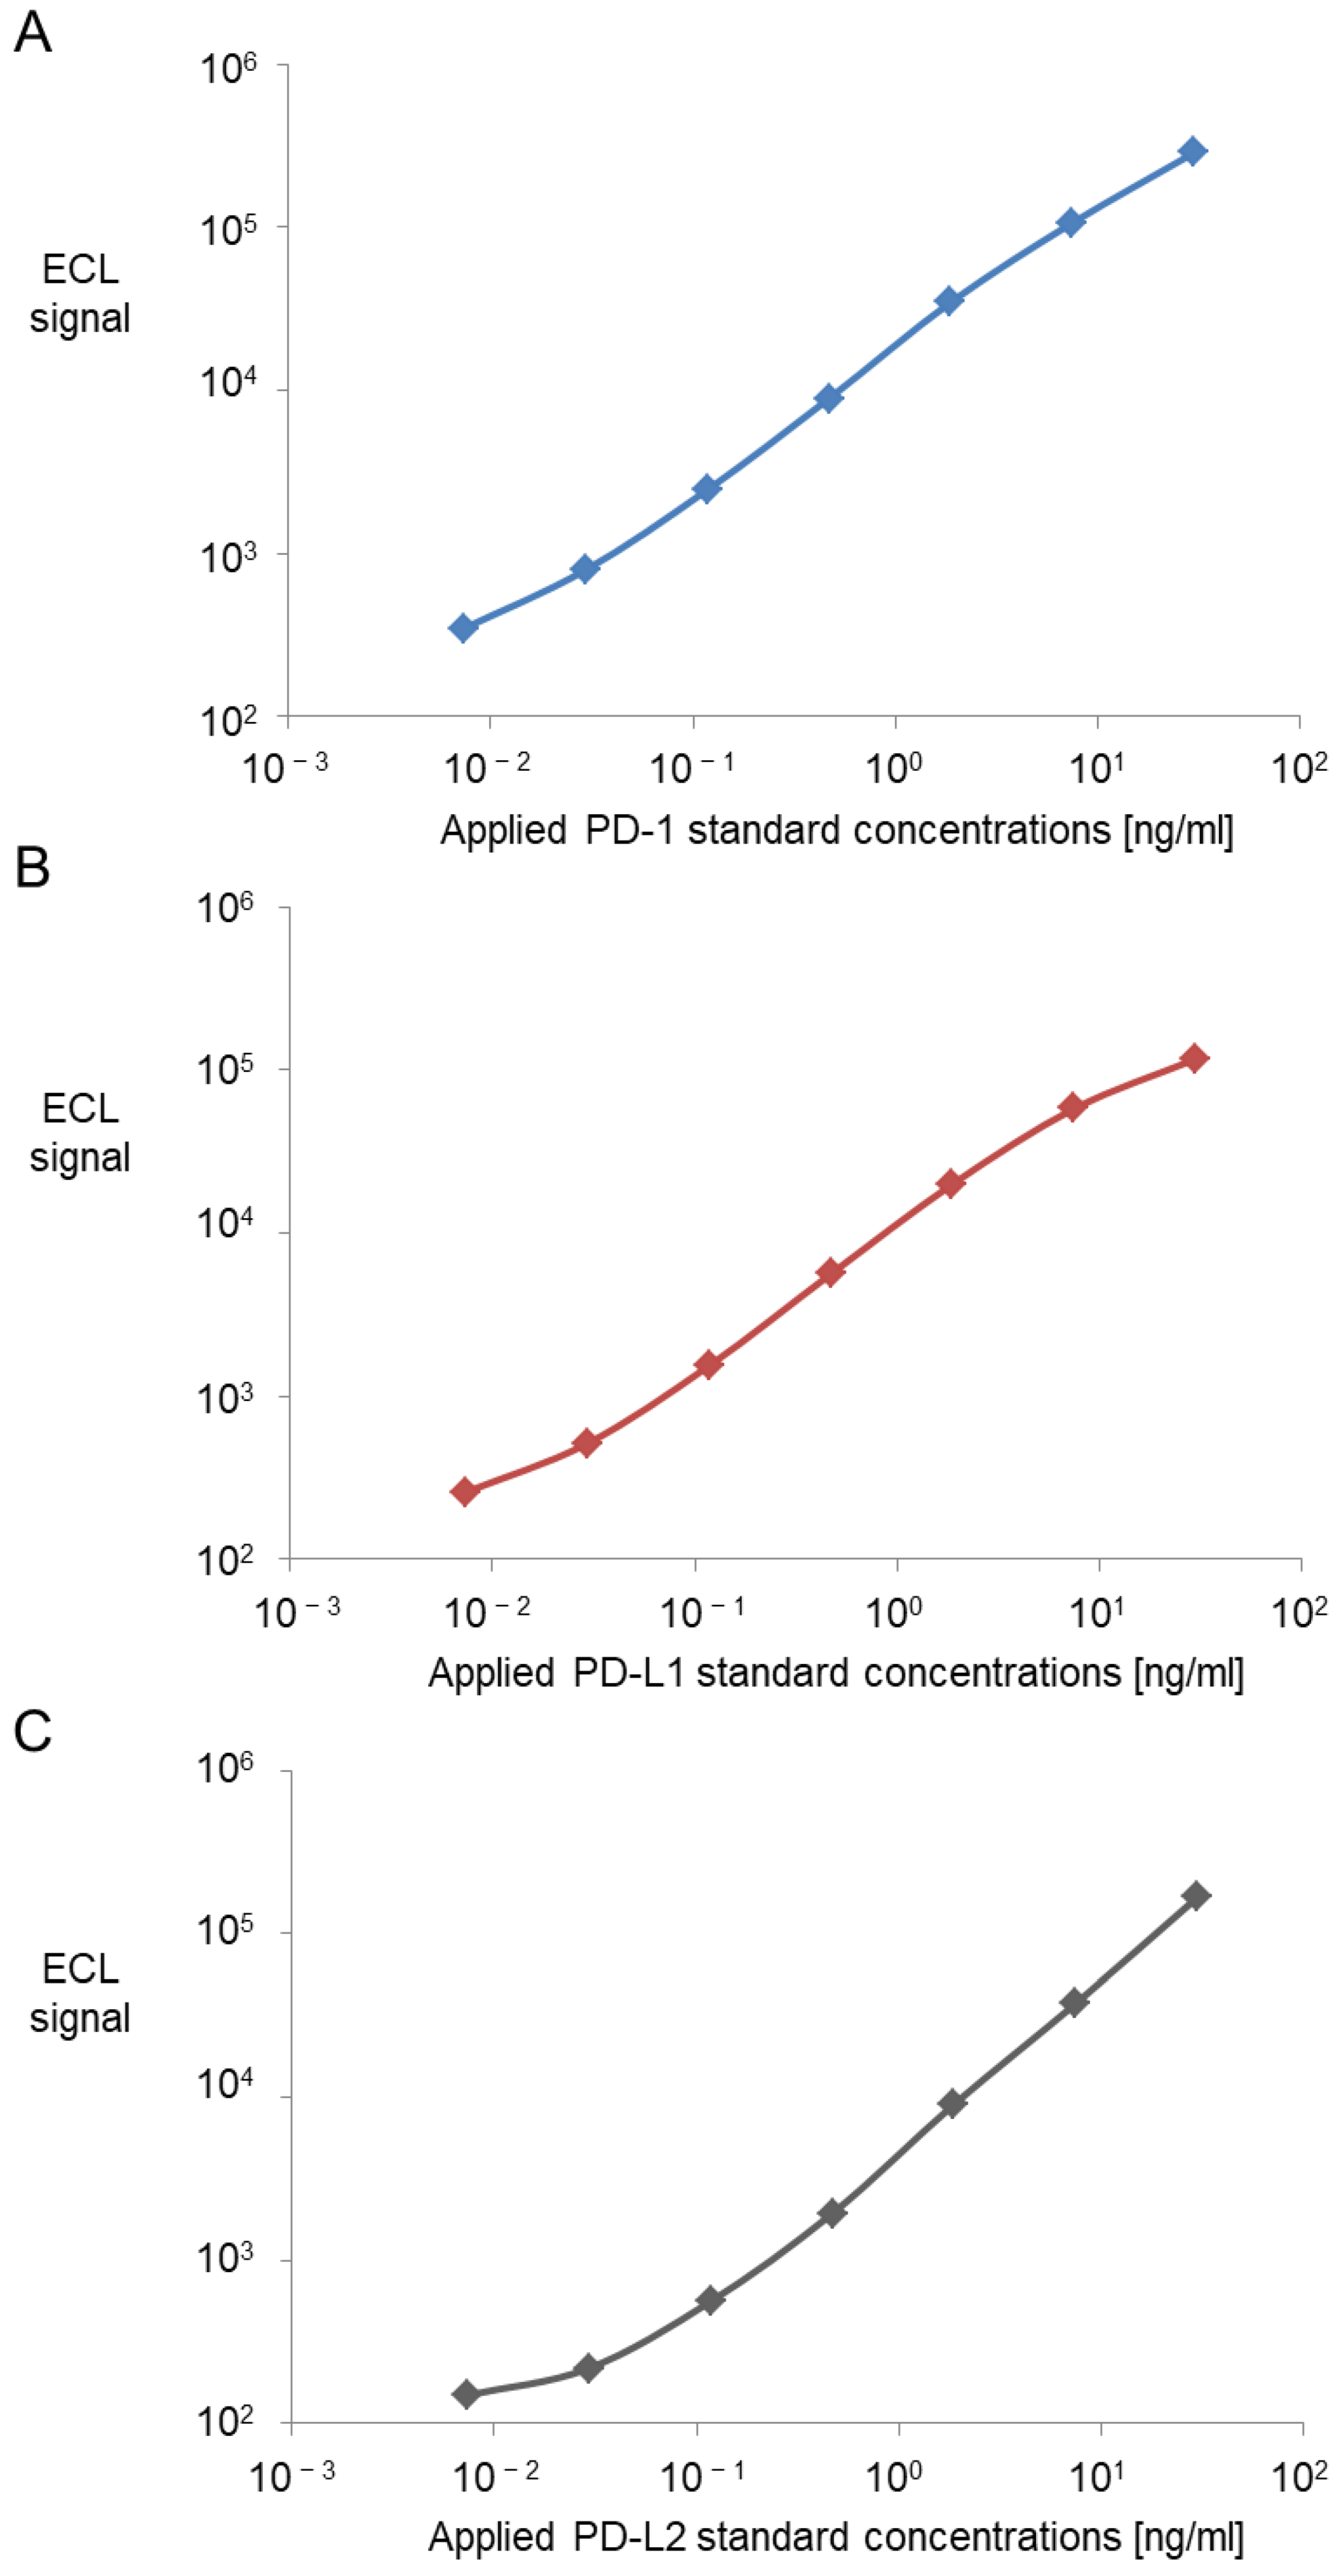
All three assays were based on antibodies and standards purchased from DuoSet® Development Systems (Human PD-1 DuoSet® ELISA: DY1086/ Human PD-L1 DuoSet® ELISA: DY156/ Human PD-L2/B7-DC DuoSet® ELISA: DY1224, R&D Systems, Inc., Minneapolis, MN, USA). The standard curves each consisted of a seven-point serial dilution of the recombinant protein. The highest standard equaled 30 ng/mL. The following six standards were prepared by a 1:4 dilution from the previous one until a concentration of 0.0073 ng/mL was reached. The eighth standard consisted of buffer and served as the blank value. The resulting calibration curves were calculated by fitting the signals from the standards to a 4-parameter logistic (or sigmoidal dose-response) model with a 1/Y2 weighting.
Best antibody combinations and concentrations were defined by so-called chessboard titration experiments of standard curves. Therefore, a grid was constructed to compare two capture antibody concentrations with three detection antibody concentrations (
Table S1,
Figure S1). The most suitable concentrations were identified by signal-to-noise ratio calculation. Signal optimization was performed by the use of other diluents than the reagent diluent on the standard curve and the detection antibody (Diluent 2/3/43, Meso Scale Discovery, LLC., Rockville, MD, USA). For PD-L1, R&D Systems recommended an addition of 2% heat inactivated normal goat serum (NGS) to the detection antibody diluent, which was tested, too. Additionally, both proffered plate types from Meso Scale Discovery (MSD), Standard plate and High-Bind plate, were compared. The standard plate has a hydrophobic surface, meanwhile, the High-Bind plate presents with a more hydrophilic surface.
2.2. Quality Control
To maintain constant quality control (QC), a set of lab-produced in-house controls were included in all plates. These were prepared from pooled patient serum samples in high, medium or low marker levels. To maintain high quality controls, the pools were aliquoted in multiple vials and stored at −80 °C. Endogenous levels of PD-L1 were usually very low, so two of the respective pools were spiked to a high and medium concentration with recombinant protein. These pools served also as experimental material in the course of the validation. The validation experiments were performed according to guidelines on biomarker assay validation [
22,
23].
2.3. Imprecision
For the intra-assay imprecision, three plasma pools with a high, medium and low value of the corresponding biomarker were chosen. This enabled a good coverage of the whole measuring range. Samples were measured in replicates of eleven to fifteen wells on the same plate. The inter-assay imprecision part consisted of a repetitive measurement of two sample pools on different plates. Measurements on up to 14 plates, which covered up to seven days, were included in the analysis.
2.4. Dilution Linearity
Primary experiments were performed in assay buffer and artificial matrices (SigMatrix (Serum Diluent, Merck KGaA, Darmstadt, Germany); SeraSubTM (CST Technologies, Inc., New York City, NY, USA)). Diluent 2 (Meso Scale Discovery, LLC., Rockville, MD, USA) for PD-1 and PD-L2 and PBS with 1% BSA for PD-L1 were used. In the second set of experiments, heparin plasma from up to eight donors was used. Probes were used native or spiked to a concentration of at least 10 ng/mL with recombinant protein from R&D Systems (R&D Systems, Inc., Minneapolis, MN, USA). After that, a serial 1:1 dilution row was prepared including dilutions 1:2; 1:4; 1:8 and, if applicable, 1:16 in the respective assay buffer or plasma.
2.5. Assay Measuring Range
The limit of detection (LOD) was based on the background signals. Mean and standard deviation both were calculated using 23 or more blank values from different days. The standard deviation was multiplied times 2.5 and added on the mean value to create the LOD [
24,
25]. The lower and upper limits of quantification (LLOQ; ULOQ) define the range in which the assay provides valid concentrations. Following this approach, for each standard, nine or more standard curves were compared regarding recovery and coefficient of variation (CV). The criteria for LLOQ and ULOQ requested a maximum CV of 20%, meanwhile, the recovery had to be within 80 to 120%.
2.6. Selectivity
Selectivity, as one of the crucial assay performance factors, was tested in several experiments. In the first step, standard curve dilutions of the corresponding other components (e.g., PD-L1 or PD-L2) were tested on the target antibody pair (e.g., PD-1). Next, a serial dilution was mixed for each potential disturbing component on its own (e.g., PD-L1 or PD-L2) and a combination of both (e.g., PD-L1 and PD-L2). As spike matrices, two different concentrations of the recombinant protein in buffer (standard 3 and 5) and two patient heparin samples were prepared.
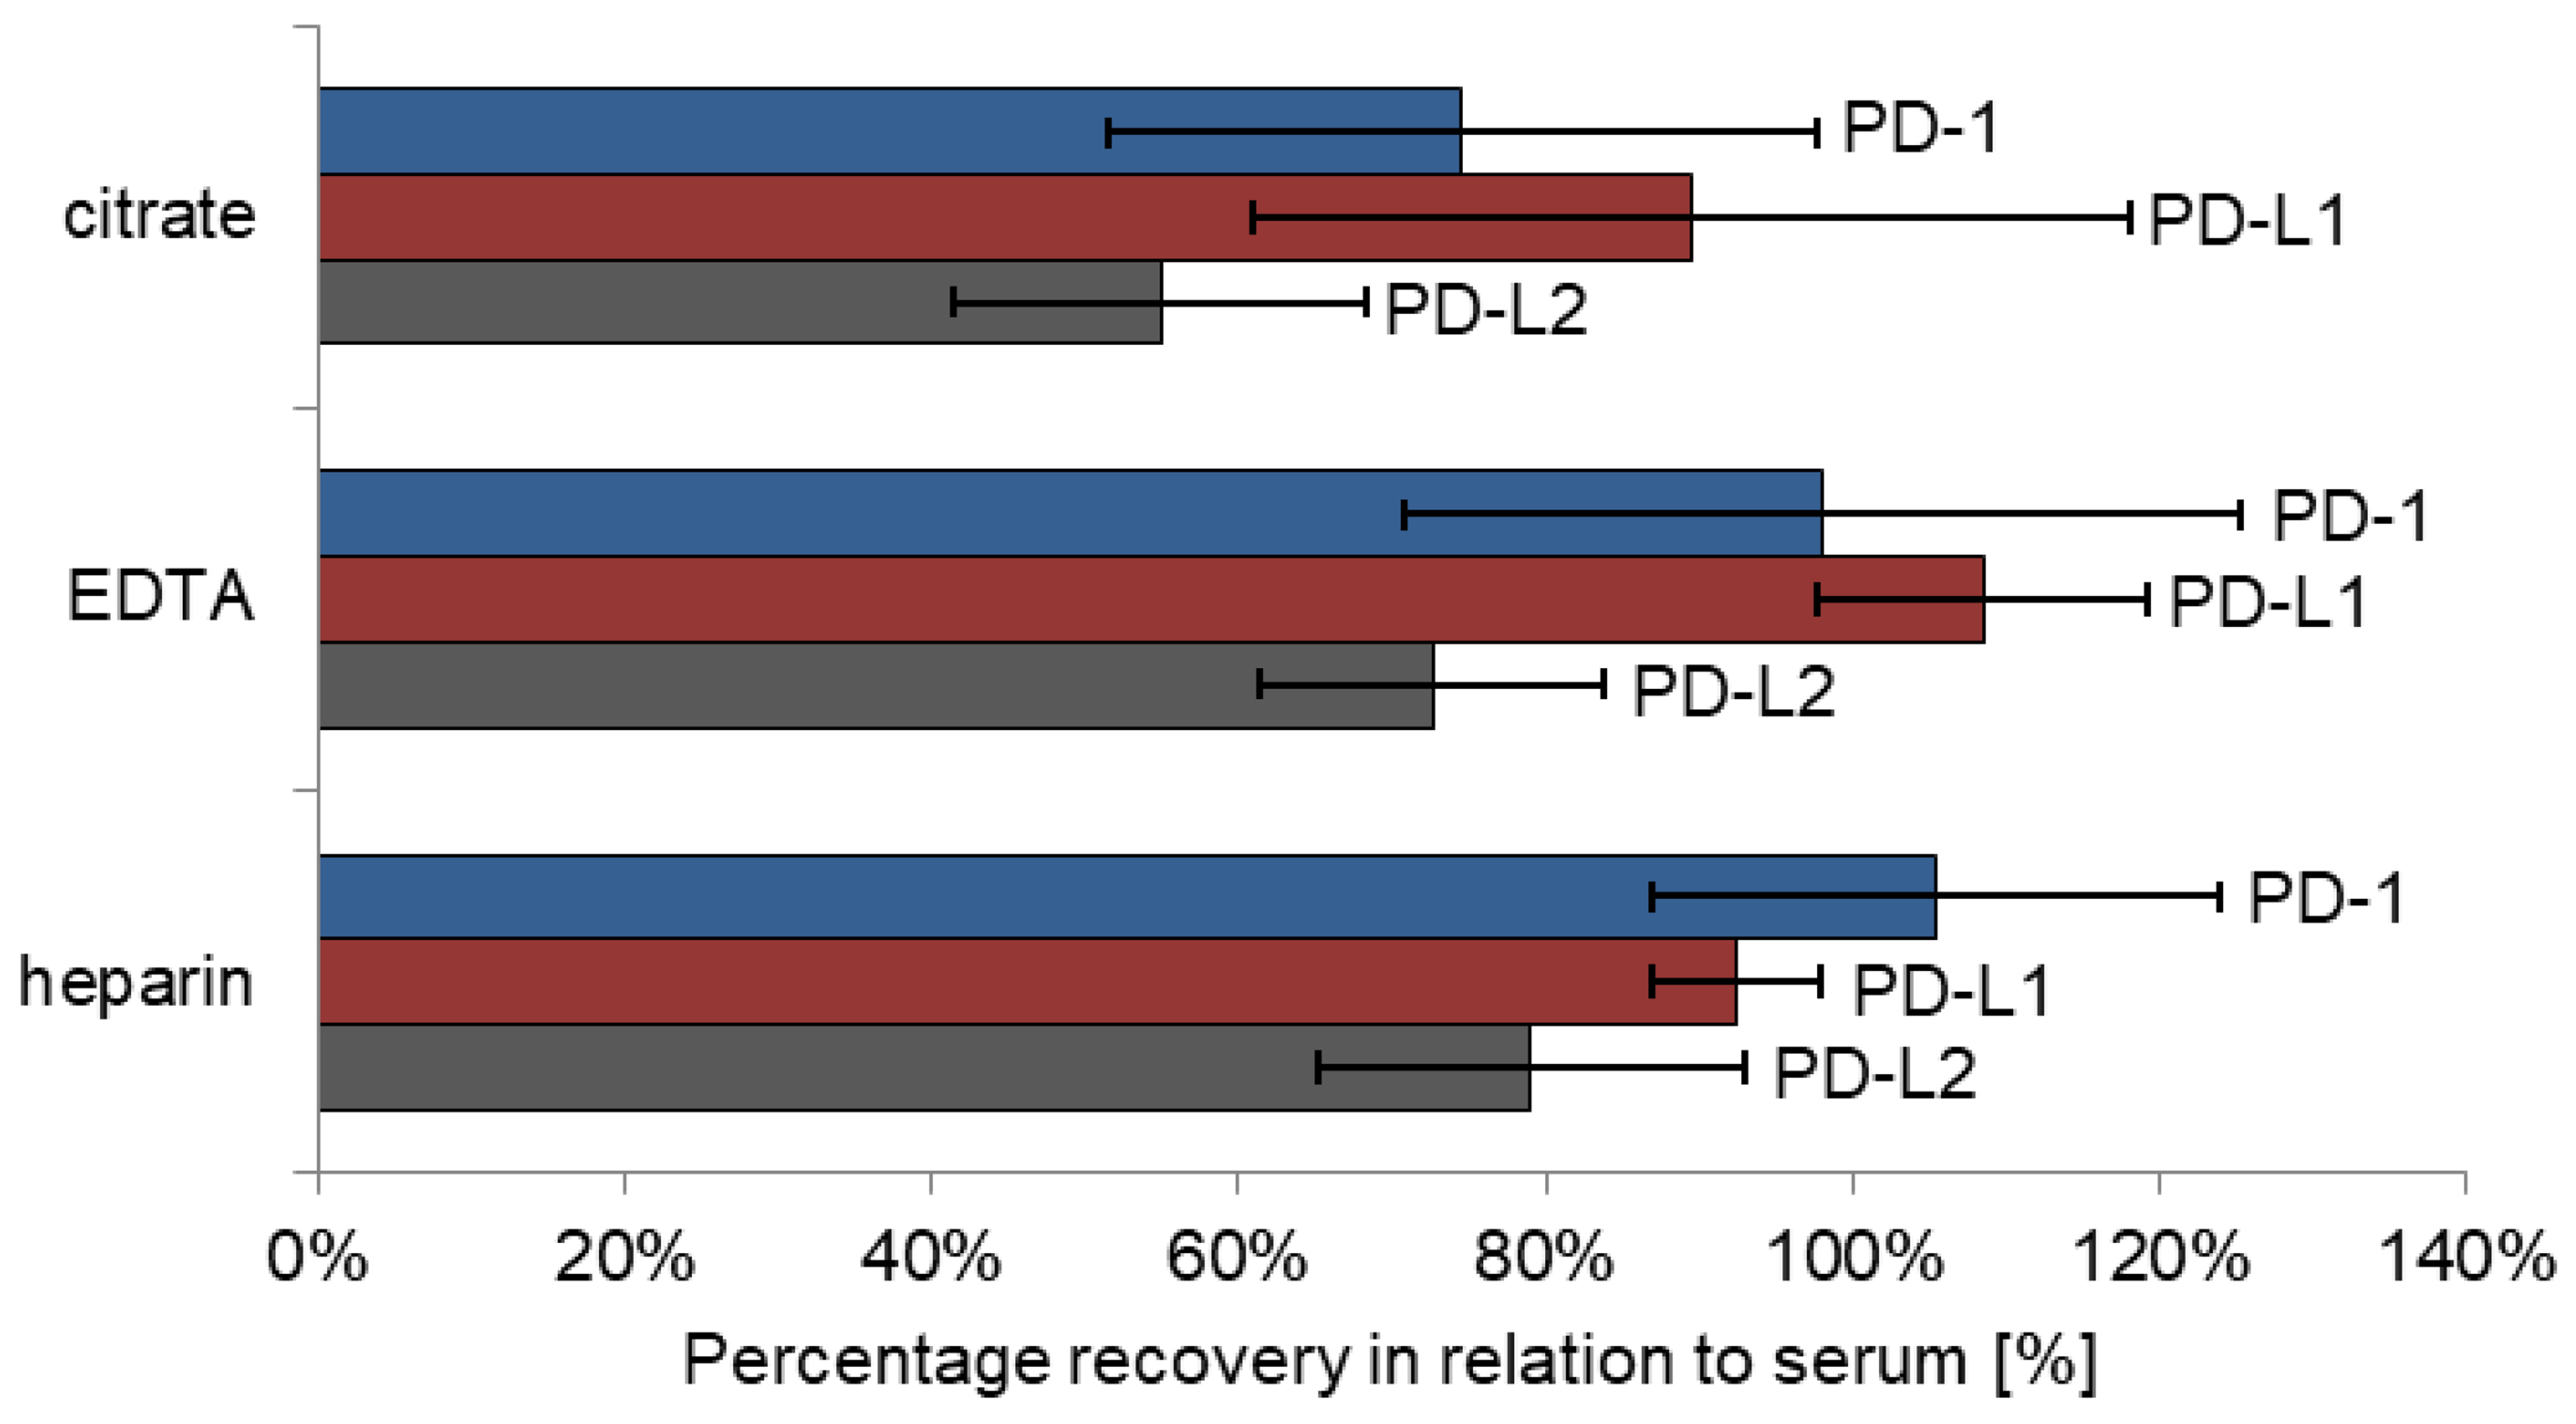
2.7. Matrix Effects
Matrix effects were tested on four different sample types: serum, heparin plasma, EDTA plasma and citrate plasma (S-Monovette® 5.5 mL Z, S-Monovette® 5.5 mL LH, S-Monovette® 9 mL K3E, S-Monovette® 5 mL 9NC; all: SARSTEDT AG&Co.KG, Nürmbrecht, Germany). Thereby, recovery of marker levels obtained in heparin, EDTA and citrate plasma was calculated against concentrations in serum. Five patients were included in this pilot study, each of whom contributed blood in all four aforementioned tubes for direct comparison.
2.8. Healthy Subjects
PD-1, PD-L1 and PD-L2 concentrations were measured in a cohort of 136 healthy male subjects (age: 32–71) applying the described assays.
2.9. Blood Sample Preparation
Whole blood was centrifuged for 10 min at 3000 rcf (3000 g) for plasma generation. The matrix comparison experiment included four matrices, serum, heparin plasma, EDTA plasma and citrate plasma (S-Monovette® 5.5 mL Z, S-Monovette® 5.5 mL LH, S-Monovette® 9 mL K3E, S-Monovette® 5 mL 9NC; all: SARSTEDT AG&Co.KG, Nürmbrecht, Germany), whereas all experiments were conducted in heparin plasma. Plasma samples were aliquoted and stored at −80 °C until analysis.
The majority of experiments were conducted in anonymized residual research samples. Samples for the matrix comparison experiment (maximum 25 mL) were collected as part of quality control for biobanked blood samples. Blood samples were taken from patients of the Department of Cardiology during routine venipuncture or from healthy individuals after informed consent for blood collection for the Cardiovascular Biobank of the German Heart Centre Munich was obtained. The blood collection for biobanking was approved by the Ethics Commission of the Technical University Munich (Nr. 5943/13; 16 October 2013).
2.10. Statistics and Data Interpretation
Data analysis was performed using Microsoft Excel 2010. Basic statistic tools comprised of calculation of mean, standard deviation, recovery and coefficient of variation (CV). The requested range of recoveries was between 80% and 120%. In general, the CV should not exceed ±20%, though it was narrowed to 10% for intra-assay imprecision data. For the analysis of dilution linearity, the undiluted sample value was set to 100%. Following dilution results were calculated as the percentage of previous dilution (target = 50%), which allowed a direct assessment of the quality of each dilution step. All obtained results were depicted as bar or line charts. Whenever applicable, error bars showing the CV were incorporated. All concentrations are provided in ng/mL, which equals 10–9 kg/L to ensure ease of readability.
4. Discussion
Programmed death-1 receptor PD-1 and its corresponding ligands PD-L1 and PD-L2 are key players in physiological immune tolerance and immune escape in cancer disease. As surface markers on tumor cells and diverse immune cells, but also as soluble markers circulating in the blood plasma and serum, they bear great potential to improve future oncoimmunology research and to be applied in monitoring immunotherapies in cancer patients. Applicability and clinical value of soluble PD markers have already been shown by studies on patients with diverse cancers, such as lung cancer, renal cell cancer and melanoma, receiving immune therapies [
26,
27].
For this purpose, high quality immunoassays are needed that enable the fast, reliable, robust and highly sensitive detection of these PD receptors and ligands in the blood plasma and serum. Therefore, the aim of the present work was the development of novel PD-1, PD-L1 and PD-L2 ELISAs and their comprehensive and thorough analytical validation as suggested by the European Medicine Agency (EMA) and a detailed description for biomarker validation of Andreasson et al. [
22,
23].
The methods were developed and optimized on a well-established chemiluminescent detection platform using commercially available, coordinated antibody pairs. The process was performed in a standardized way testing and defining appropriate antibody concentrations, buffers, type of plate, handling, standards, controls etc., resulting in robust and reliable detection methods. In a second step, the assay characteristics and performance were assessed by a comprehensive experimental setting. Good assay imprecision and dilution linearity, a wide measuring range, high sensitivity down to the pg/mL area, excellent selectivity of detection and a first application in healthy subjects have convincingly shown the fitness of the assays for use in oncoimmunologic research and clinical study settings.
Imprecision of all three assays was very good for the intra-assay comparison with CVs below 10% as well as for the inter-assay comparison with CVs below 20%. While during this early developmental stage all procedural steps were performed manually, further improvements are expected by future automatization of the processes.
Dilution linearity is especially important if very high results exceeding the measuring range are expected. Although the novel assays on the chemiluminescent platform were set up with a large dynamic range covering all of the pg/mL and ng/mL area, dilution may be relevant for extremely high values and to exclude high-dose-hooks effects. In our validation, experiments in assay diluent, artificial matrices and spiked samples showed recoveries close to the predefined values in all assays. Only in dilution of native heparin plasma were lower recoveries for PD-1 and PD-L2 observed in the first dilution step. As physiologically very low PD-L1 values are present in native samples, spike-in samples were used as starting material. Due to the wide measuring range and due to omitting any predilution steps of the samples before analysis, dilution remains of subordinate significance for assay performance.
However, analytical sensitivity of the assays indicated by LOD, LLOQ and ULOQ are important specifications for future clinical application, particularly to follow patients undergoing adjuvant therapies or monitoring minimal residual cancer disease. All three assays showed low to very low background signals (only 100 and 300 signal counts on the readout platform). Furthermore, low variation coefficients throughout the whole standard curve over different days proved a high reproducibility and robustness of the standards and the whole assay, enabling a broad quantification range over more than three orders of magnitude starting at below 10 pg/mL up to 30 ng/mL. This renders the assays highly sensitive tools for detecting also minimal amounts of the analytes of interest.
Analytical selectivity is an often neglected but highly important prerequisite for assay specificity. Consequently, it represents one of the key elements of the analytical validation in order to exclude any potential cross contamination of the measuring signal by analytes that are similar to the analyte of interest. To achieve high analytical selectivity, careful selection of highly specific antibodies is essential. As part of our study, a comprehensive set of experiments was carried out as especially the two ligands share a reasonable proportion of their protein structure. It has to be pointed out that all antibodies used in our assays proved high selectivity for their respective analytes in standard curve experiments. Influences on marker signals were only seen when non-physiological, extremely high concentrations of the related analytes were spiked into the samples investigated.
As a major influencing factor for analyte concentration, the choice of appropriate sample material and collection tubes has to be considered. As seen also for many other biomarkers, results for PD-1, PD-L1 and PD-L2 were quite comparable in serum and heparin plasma samples, respectively. In addition, levels of PD-1 and PD-L1 were similar in EDTA plasma samples; only PD-L2 levels were somewhat lower as compared with heparin plasma and serum. For all three analytes, recoveries measured in citrate plasma presents were considerably lower, which is partially explained by plasma volume reduction in the tubes due to prefilling with sodium citrate anticoagulant fluid. Nevertheless, it has to be emphasized that blood matrices should be maintained throughout studies to set optimal preconditions for comparable results.
As a summary of the analytical validation of three novel immunoassays for the quantification of PD-1, PD-L1 and PD-L2, all assays provide a robust basis for highly sensitive, specific and reliable measurement of the analytes in serum and plasma. They are based on commercially available coordinated antibody pairs which provide good quality and comparability, although batch stability has to be shown over time. Chemiluminescence detection has several advantages over color-based detection such as the precise quantification of minimal concentrations down to less than 10 pg/mL. Such excellent LLOQs are especially needed for PD-L1, as physiological marker levels are expected at these very low concentrations in blood serum and plasma. In addition, the broad dynamic measuring range with more than three orders of magnitude enables to capture low and high results at the same time and to avoid any predilution steps. This also facilitates the monitoring of individual marker courses over time, e.g., during or after immunotherapies in cancer patients as even large dynamic changes are easily detected. Recently, Goto et al. published a method using automated chemiluminescent immunoassays to determine concentrations of soluble PD-1 and PD-L1. The assays showed CVs lower than 10%, which can be explained by higher tested sample numbers and constant assay conditions by automatization. Obtained LODs and LOQs are comparable to the data calculated for the here-presented assays [
28].
The investigation in a comprehensive set of healthy subjects proved that PD-1 and PD-L2 concentration can be measured with the newly established assays. The concentrations of PD-L1 were lower in the healthy population and often below the detection limit. Nevertheless, it is expected to detect PD-L1 concentrations in subjects with diseases as rising levels have been reported by increasing numbers of studies. Meanwhile, other publications on assays for the quantification of soluble PD-1 and PD-L1 have been released stressing the high interest in the field [
26,
27,
28].
Although the assays have proven good analytical validity, their usage is so far limited to research applications and can be used for marker quantification in experimental and study settings. For in vitro diagnostics (IVD) qualification, further quality aspects as well as the potential influence of preanalytical factors have to be tested and fulfilled.

 ,
, 

