

Comparison of Diagnostic Values of Maternal Arginine Concentration for Different Pregnancy Complications: A Systematic Review and Meta-Analysis


Abstract
1. Introduction
2. Materials and Methods
2.1. Protocol and Registration
2.2. Search Strategy
2.3. Study Eligibility Criteria
2.4. Data Extraction
2.5. Quality Assessment
2.6. Statistical Analyses
3. Results
3.1. Study Selection and Characteristics
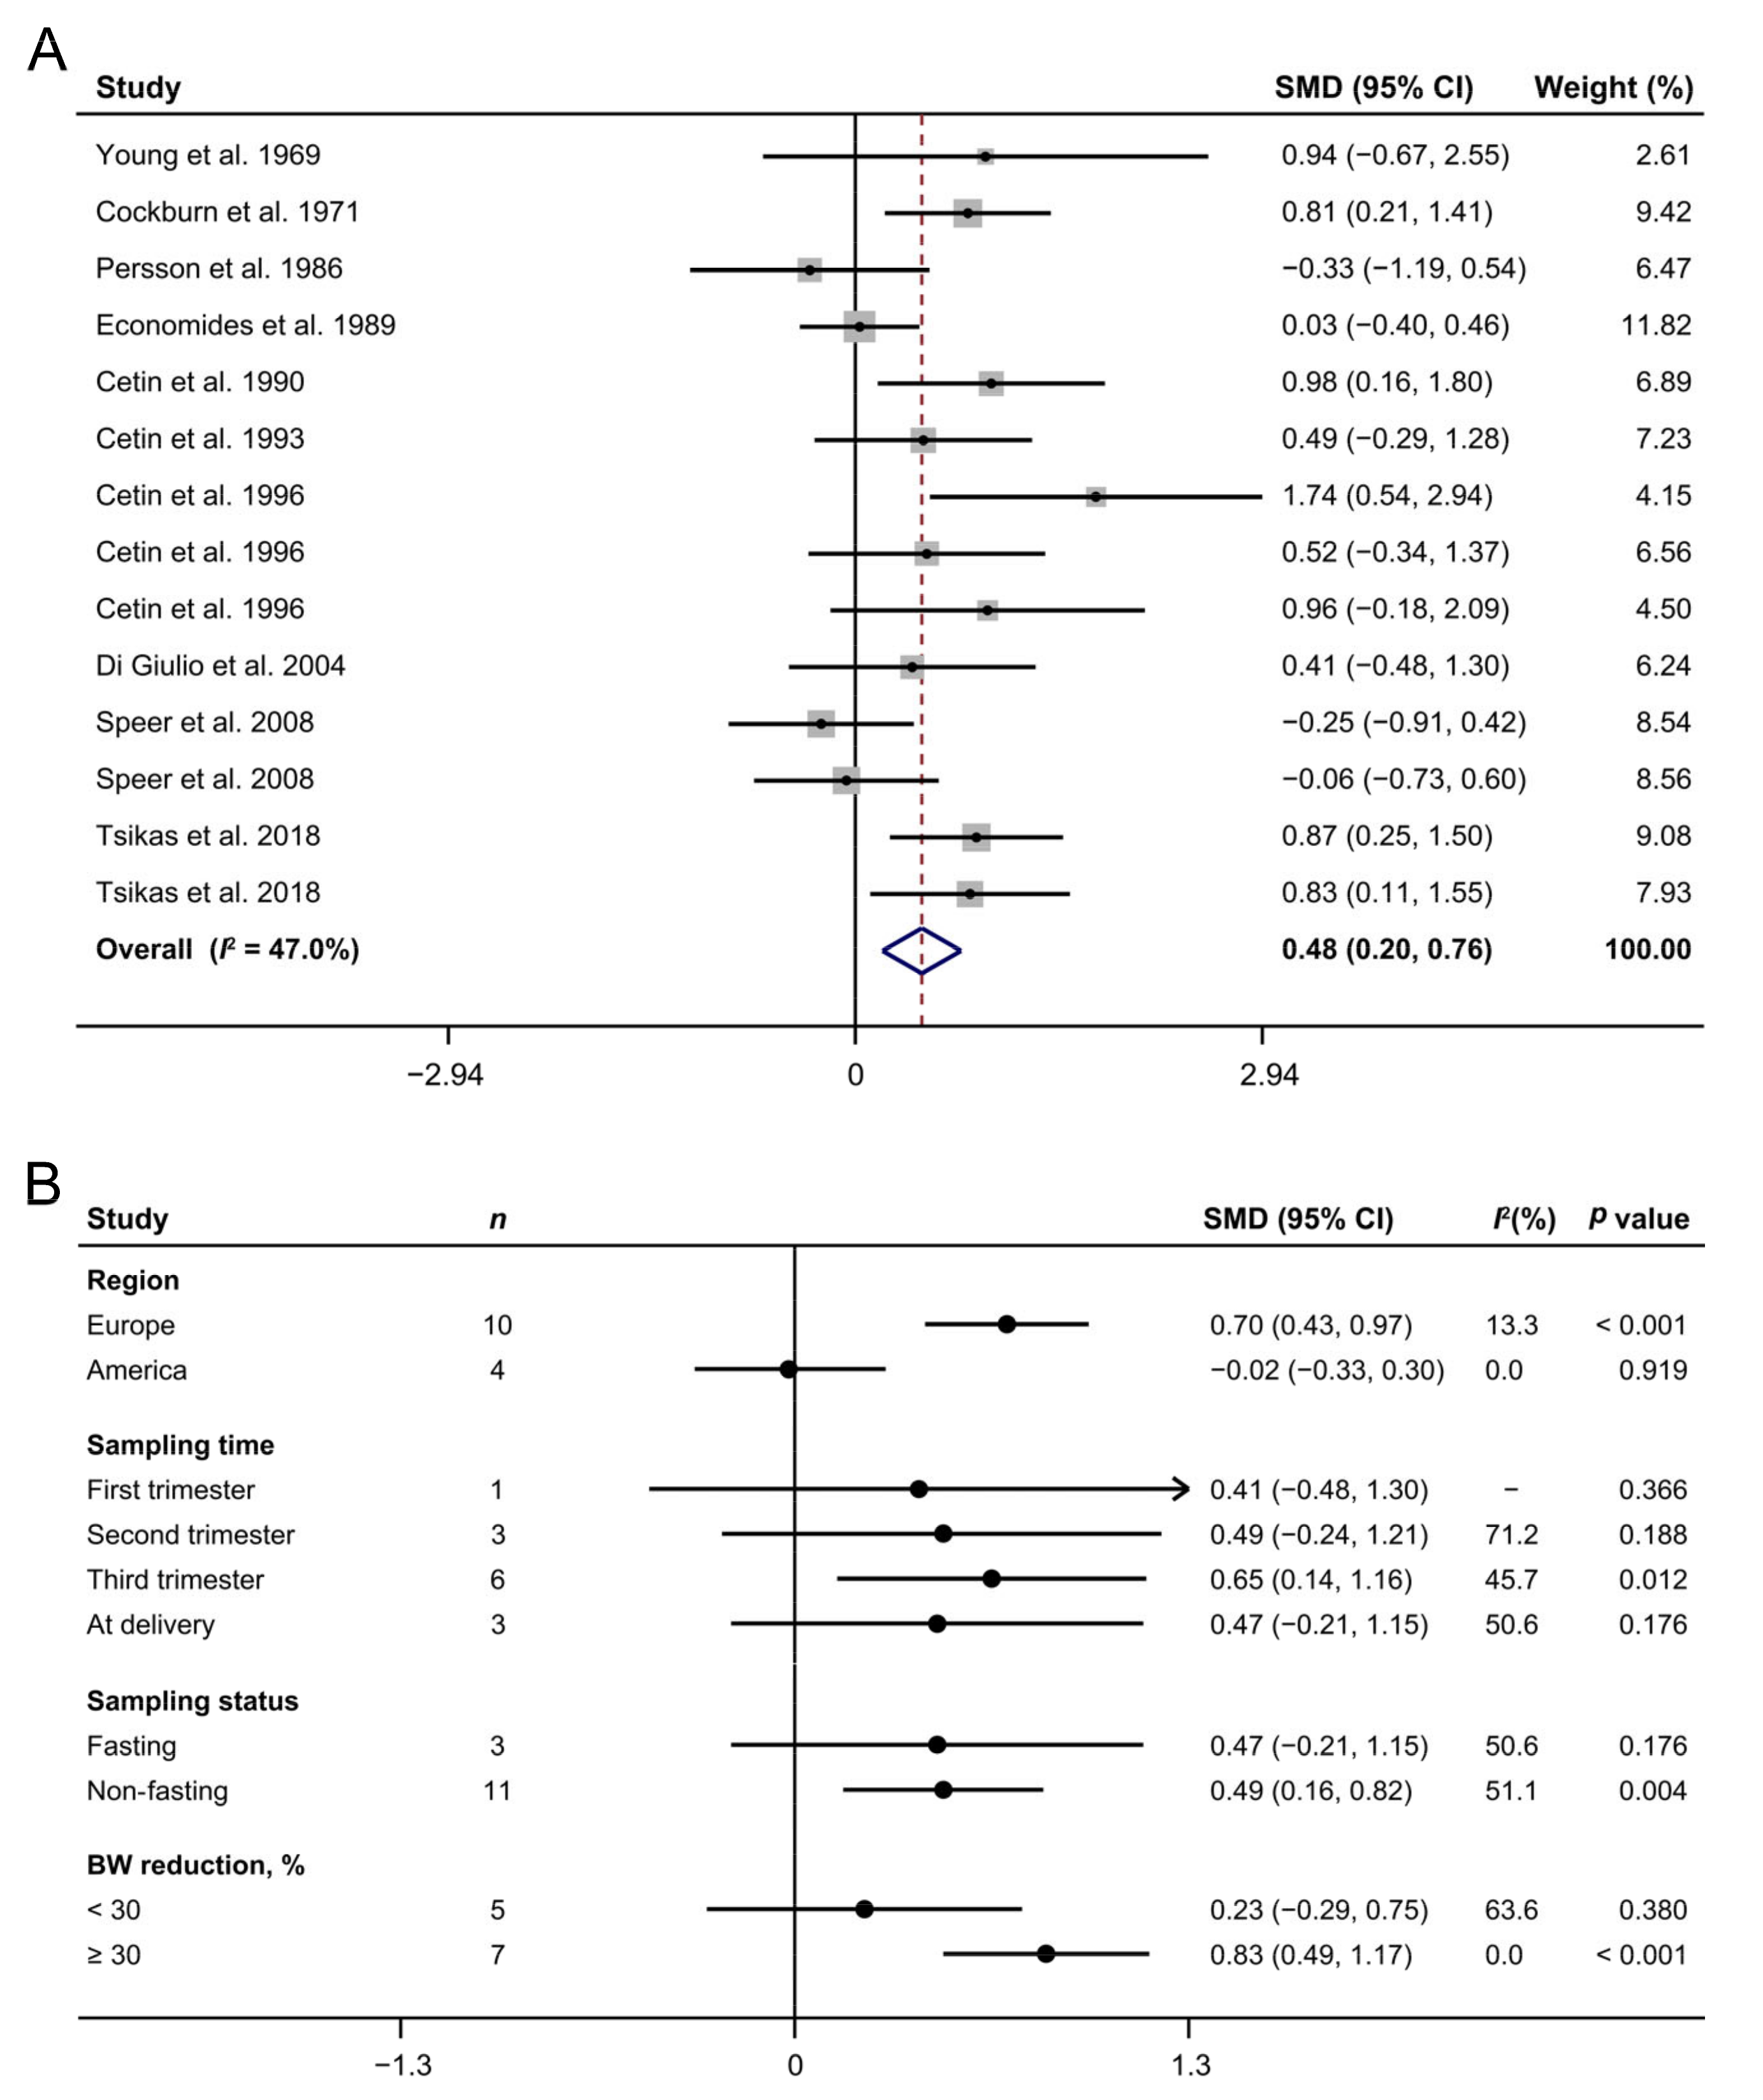
3.2. Maternal Arginine Concentration and IUGR
3.3. Maternal Arginine Concentration and PE
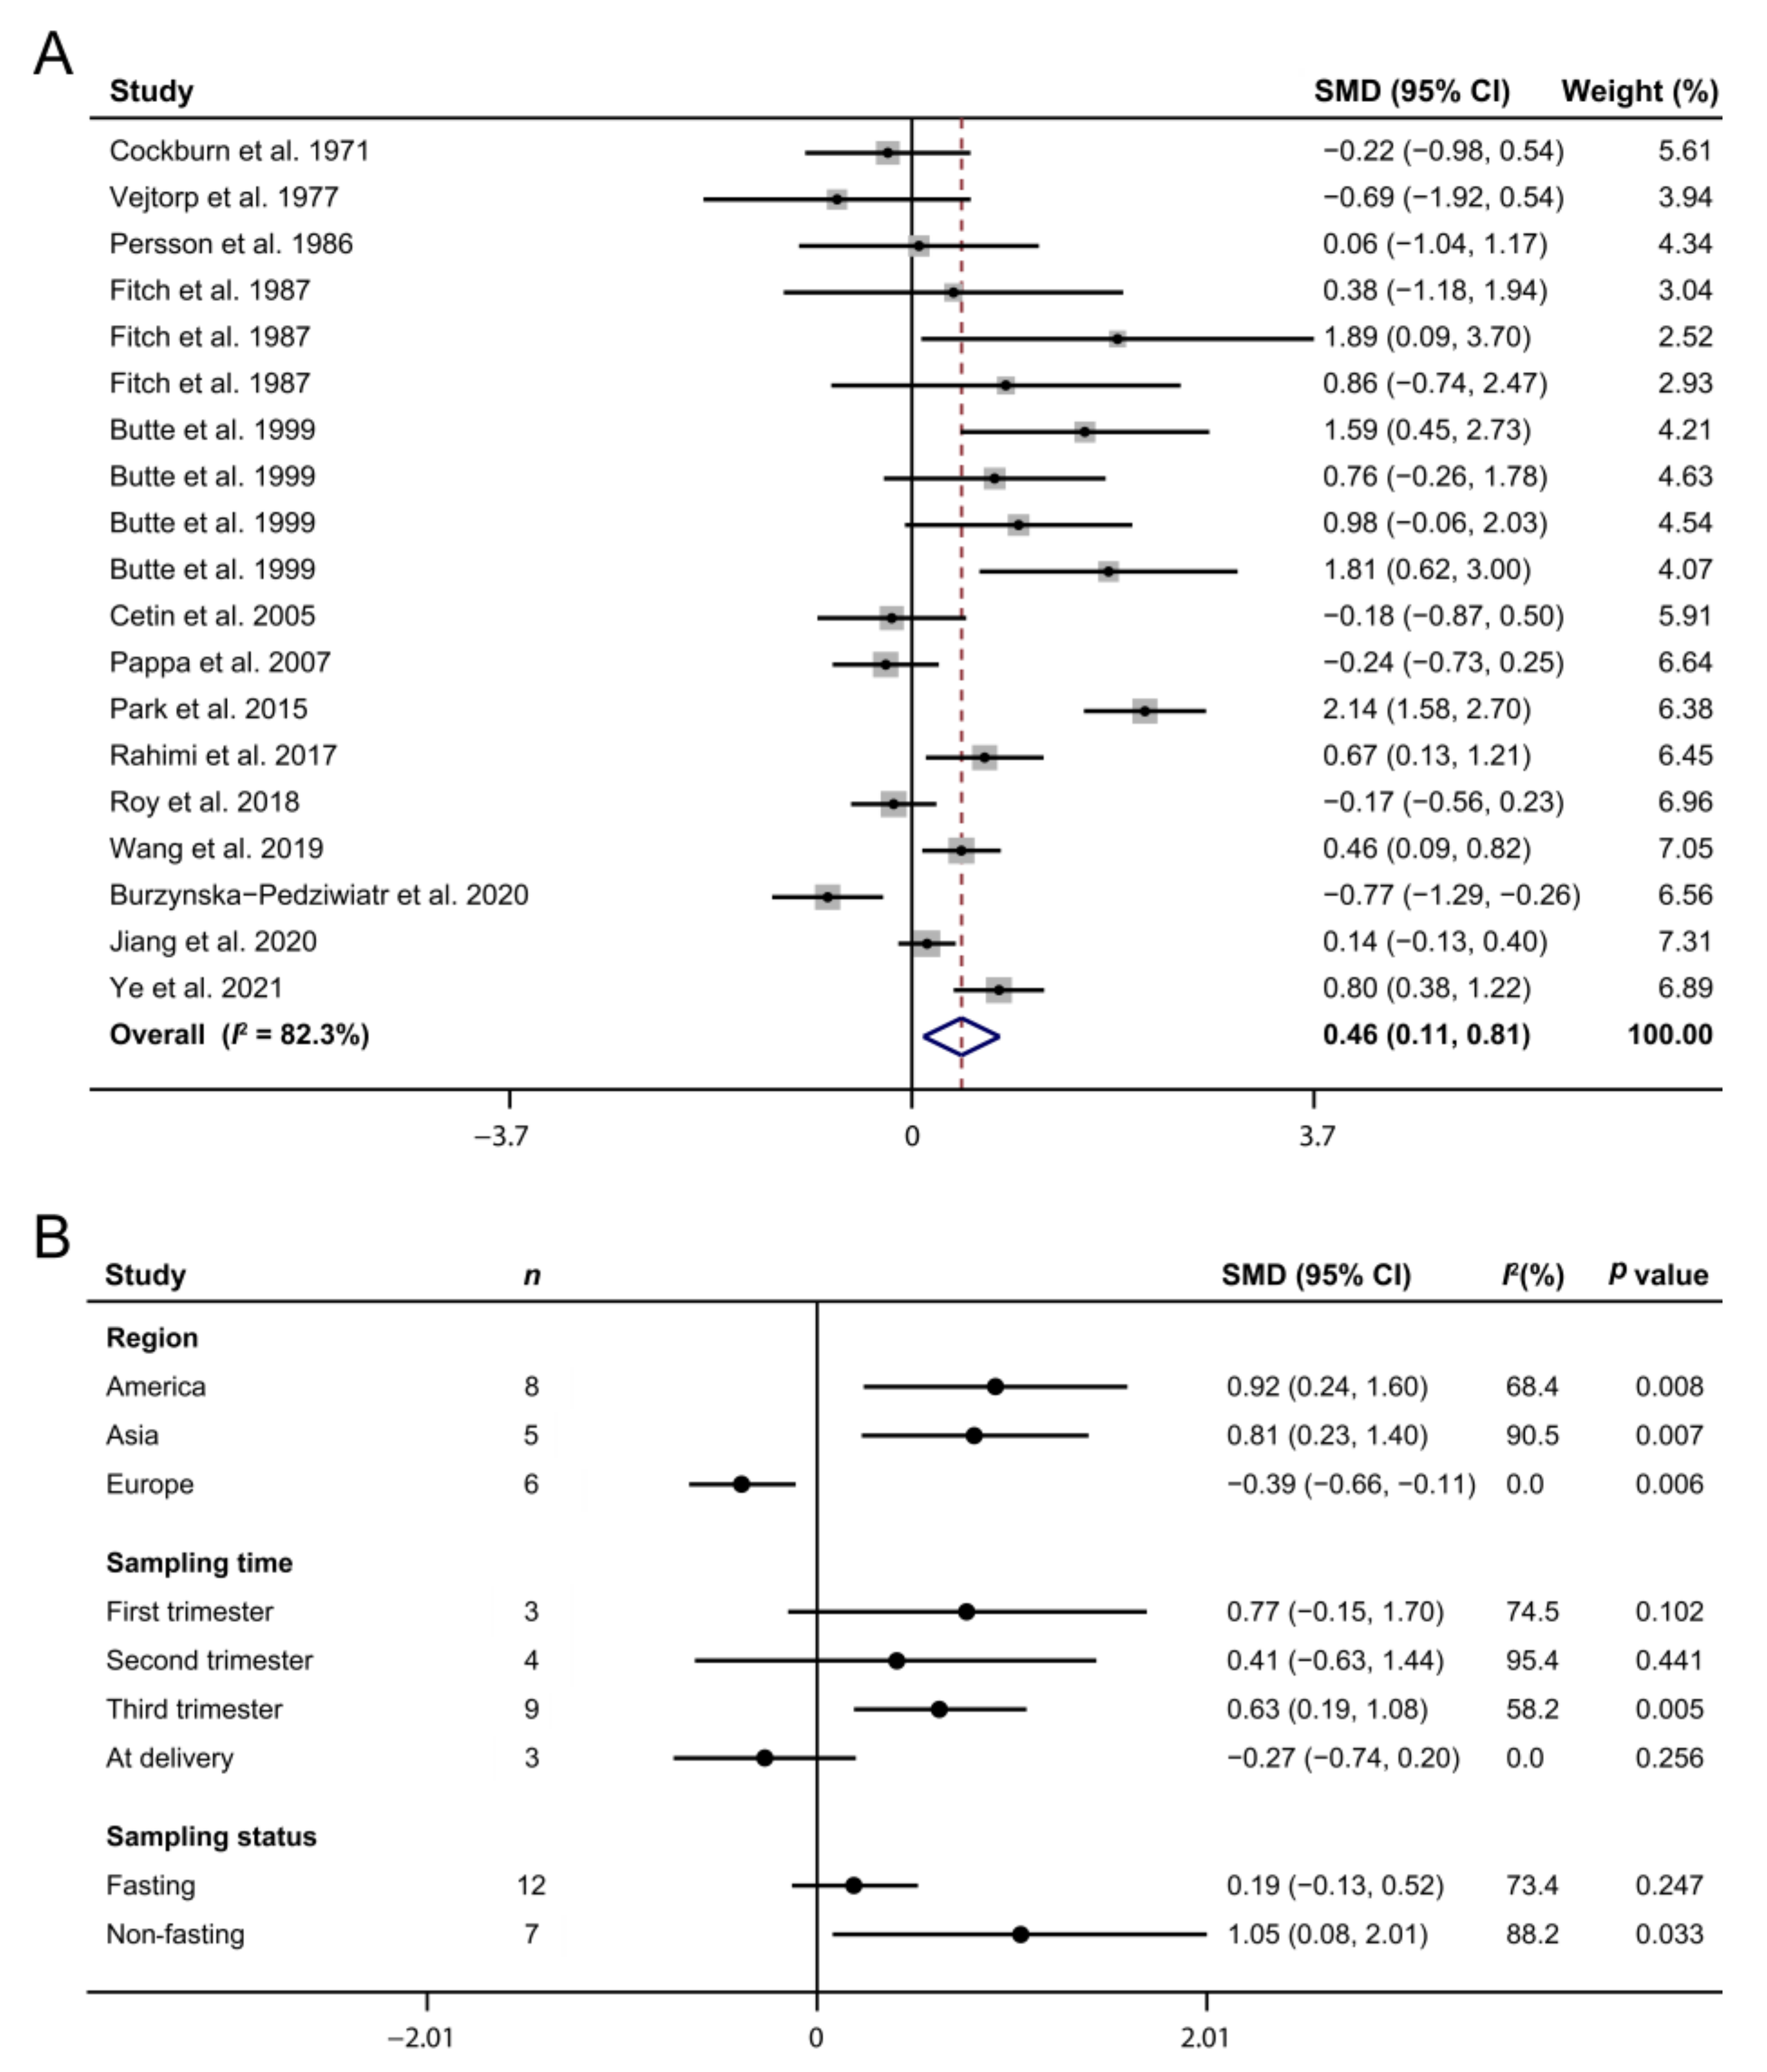
3.4. Maternal Arginine Concentration and GDM
3.5. Publication Bias and Sensitivity Analysis
4. Discussion
5. Conclusions
Author Contributions
Funding
Data Availability Statement
Conflicts of Interest
Correction Statement
References
- Murray, E.; Fernandes, M.C.; Fazel, M.; Kennedy, S.H.; Villar, J.; Stein, A. Differential effect of intrauterine growth restriction on childhood neurodevelopment: A systematic review. BJOG 2015, 122, 1062–1072. [Google Scholar] [CrossRef]
- Lawn, J.E.; Blencowe, H.M.; Waiswa, P.; Amouzou, A.; Mathers, C.; Hogan, D.; Flenady, V.; Frøen, J.F.; Qureshi, Z.U.; Calderwood, C.; et al. Stillbirths: Rates, risk factors, and acceleration towards 2030. Lancet 2016, 387, 587–603. [Google Scholar] [CrossRef]
- Phipps, E.; Prasanna, D.; Brima, W.; Jim, B. Preeclampsia: Updates in Pathogenesis, Definitions, and Guidelines. Clin. J. Am. Soc. Nephrol. 2016, 11, 1102–1113. [Google Scholar] [CrossRef] [PubMed]
- Campos, A.J.; Risch, L.; Baumann, M.; Purde, M.-T.; Neuber, S.; Renz, H.; Mosimann, B.; Raio, L.; Mohaupt, M.; Surbek, D.; et al. Shrunken pore syndrome, preeclampsia, and markers of NO metabolism in pregnant women during the first trimester. Scand. J. Clin. Lab. Investig. 2019, 79, 91–98. [Google Scholar] [CrossRef]
- Bentley-Lewis, R.; Powe, C.; Ankers, E.; Wenger, J.; Ecker, J.; Thadhani, R. Effect of race/ethnicity on hypertension risk sub-sequent to gestational diabetes mellitus. Am. J. Cardiol. 2014, 113, 1364–1370. [Google Scholar] [CrossRef]
- Esakoff, T.F.; Cheng, Y.W.; Sparks, T.; Caughey, A.B. The association between birthweight 4000 g or greater and perinatal outcomes in patients with and without gestational diabetes mellitus. Am. J. Obstet. Gynecol. 2009, 200, 672.e1–672.e4. [Google Scholar] [CrossRef] [PubMed]
- Wu, G.; Bazer, F.W.; Cudd, T.A.; Meininger, C.J.; Spencer, T.E. Maternal Nutrition and Fetal Development. J. Nutr. 2004, 134, 2169–2172. [Google Scholar] [CrossRef]
- Konje, J.C.; Howarth, E.S.; Kaufmann, P.; Taylor, D.J. Longitudinal quantification of uterine artery blood volume flow changes during gestation in pregnancies complicated by intrauterine growth restriction. BJOG 2003, 110, 301–305. [Google Scholar] [CrossRef] [PubMed]
- Böger, R.H.; Diemert, A.; Schwedhelm, E.; Lüneburg, N.; Maas, R.; Hecher, K. The Role of Nitric Oxide Synthase Inhibition by Asymmetric Dimethylarginine in the Pathophysiology of Preeclampsia. Gynecol. Obstet. Investig. 2010, 69, 1–13. [Google Scholar] [CrossRef]
- Krause, B.; Hanson, M.; CasanelloP. Role of nitric oxide in placental vascular development and function. Placenta 2011, 32, 797–805. [Google Scholar] [CrossRef]
- Bogdanski, P.; Suliburska, J.; Grabanska, K.; Musialik, K.M.; Cieslewicz, A.; Skoluda, A.; Jabłecka, A. Effect of 3-month L-arginine supplementation on insulin resistance and tumor necrosis factor activity in patients with visceral obesity. Eur. Rev. Med Pharmacol. Sci. 2012, 16, 816–823. [Google Scholar] [PubMed]
- Newsholme, P.; Cruzat, V.; Arfuso, F.; Keane, K.N. Nutrient regulation of insulin secretion and action. J. Endocrinol. 2014, 221, R105–R120. [Google Scholar] [CrossRef]
- Burzynska-Pedziwiatr, I.; Jankowski, A.; Kowalski, K.; Sendys, P.; Zieleniak, A.; Cypryk, K.; Zurawska-Klis, M.; Wozniak, L.A.; Bukowiecka-Matusiak, M. Associations of Arginine with Gestational Diabetes Mellitus in a Follow-Up Study. Int. J. Mol. Sci. 2020, 21, 7811. [Google Scholar] [CrossRef] [PubMed]
- Shamseer, L.; Moher, D.; Clarke, M.; Ghersi, D.; Liberati, A.; Petticrew, M.; Shekelle, P.; Stewart, L.A.; the PRISMA-P Group. Preferred reporting items for systematic review and meta-analysis protocols (PRISMA-P) 2015: Elaboration and explanation. BMJ 2015, 349, g7647. [Google Scholar] [CrossRef] [PubMed]
- StangA. Critical evaluation of the Newcastle-Ottawa scale for the assessment of the quality of nonrandomized studies in meta-analyses. Eur. J. Epidemiol. 2010, 25, 603–605. [Google Scholar] [CrossRef]
- Jackson, D.; White, I.; Riley, R.D. Quantifying the impact of between-study heterogeneity in multivariate meta-analyses. Stat. Med. 2012, 31, 3805–3820. [Google Scholar] [CrossRef]
- Egger, M.; Smith, G.D.; Schneider, M.; Minder, C. Bias in meta-analysis detected by a simple, graphical test. BMJ 1997, 315, 629–634. [Google Scholar] [CrossRef]
- Young, M.; Prenton, M.A. Maternal and Fetal Plasma Amino Acid Concentrations During Gestation and in Retarded Fetal Growth. BJOG Int. J. Obstet. Gynaecol. 1969, 76, 333–344. [Google Scholar] [CrossRef] [PubMed]
- Cockburn, F.; Blagden, A.; Michie, E.A.; Forfar, J.O. The Influence of Pre-Eclampsia and Diabetes Mellitus on Plasma Free Amino Acids in Maternal, Umbilical Vein and Infant Blood. J. Obstet. Gynaecol. Br. Commonw. 1971, 78, 215–231. [Google Scholar] [CrossRef]
- Persson, B.; Pschera, H.; Lunell, N.-O.; Barley, J.; Gumaa, K. Amino Acid Concentrations in Maternal Plasma and Amniotic Fluid in Relation to Fetal Insulin Secretion During the Last Trimester of Pregnancy in Gestational and Type I Diabetic Women and Women with Small-for-Gestational-Age Infants. Am. J. Perinatol. 1986, 3, 98–103. [Google Scholar] [CrossRef]
- Economides, D.; Nicolaides, K.; Gahl, W.; Bernardini, I.; Evans, M. Plasma amino acids in appropriate- and small-for-gestational-age fetuses. Am. J. Obstet. Gynecol. 1989, 161, 1219–1227. [Google Scholar] [CrossRef]
- Cetin, I.; Corbetta, C.; Sereni, L.P.; Marconi, A.M.; Bozzetti, P.; Pardi, G.; Battaglia, F.C. Umbilical amino acid concentrations in normal and growth-retarded fetuses sampled in utero by cordocentesis. Am. J. Obstet. Gynecol. 1990, 162, 253–261. [Google Scholar] [CrossRef]
- Cetin, I.; Marconi, A.M.; Corbetta, C.; Baggiani, A.M.; Pardi, G. Fetal-maternal amino acid relationships in normal and intra-uterine growth retarded (IUGR) pregnancies. Placenta 1993, 14, 11–23. [Google Scholar] [CrossRef]
- Cetin, I.; Ronzoni, S.; Marconi, A.M.; Perugino, G.; Corbetta, C.; Battaglia, F.C.; Pardi, G. Maternal concentrations and fe-tal-maternal concentration differences of plasma amino acids in normal and intrauterine growth-restricted pregnancies. Am. J. Obstet. Gynecol. 1996, 174, 1575–1583. [Google Scholar] [CrossRef]
- Di Giulio, A.M.; Carelli, S.; Castoldi, R.; Gorio, A.; Taricco, E.; Cetin, I. Plasma amino acid concentrations throughout normal pregnancy and early stages of intrauterine growth restricted pregnancy. J. Matern. Neonatal Med. 2004, 15, 356–362. [Google Scholar] [CrossRef]
- Speer, P.D.; Powers, R.W.; Frank, M.P.; Harger, G.; Markovic, N.; Roberts, J.M. Elevated asymmetric dimethylarginine con-centrations precede clinical preeclampsia, but not pregnancies with small-for-gestational-age infants. Am. J. Obstet. Gynecol. 2008, 198, 112.e1–e7. [Google Scholar] [CrossRef]
- Tsikas, D.; Bollenbach, A.; Savvidou, M.D. Inverse correlation between maternal plasma asymmetric dimethylarginine (ADMA) and birthweight percentile in women with impaired placental perfusion: Circulating ADMA as an NO-independent indicator of fetal growth restriction? Amino Acids 2018, 50, 341–351. [Google Scholar] [CrossRef]
- Kuutti-Savolainen, E.-R.; Ylöstalo, P.; Järvinen, P.; Jouppila, P. Amino acid composition of amniotic fluid, maternal and umbilical vein serum in intrahepatic cholestasis of pregnancy, pre-eclampsia and rhesus incompatibility. Eur. J. Obstet. Gynecol. Reprod. Biol. 1979, 9, 223–229. [Google Scholar] [CrossRef]
- Pettersson, A.; Hedner, T.; Milsom, I. Increased circulating concentrations of asymmetric dimethyl arginine (ADMA), an en-dogenous inhibitor of nitric oxide synthesis, in preeclampsia. Acta Obstet. Gynecol. Scand. 1998, 77, 808–813. [Google Scholar]
- Beinder, E.; Mohaupt, M.G.; Schlembach, D.; Fischer, T.; Sterzel, R.B.; Lang, N.; Baylis, C.; Fischer, T. Nitric Oxide Synthase Activity and Doppler Parameters in the Fetoplacental and Uteroplacental Circulation in Preeclampsia. Hypertens. Pregnancy 1999, 18, 115–127. [Google Scholar] [CrossRef] [PubMed]
- Evans, R.W.; Powers, R.W.; Ness, R.B.; Cropcho, L.J.; Daftary, A.R.; Harger, G.F.; Vergona, R.; Finegold, D.N. Maternal and fetal amino acid concentrations and fetal outcomes during pre-eclampsia. Reproduction 2003, 125, 785–790. [Google Scholar] [CrossRef] [PubMed]
- Glew, R.H.; Melah, G.; El-Nafaty, A.I.; Brandt, Y.; Morris, D.; VanderJagt, D.J. Plasma and urinary free amino acid concen-trations in preeclamptic women in northern Nigeria. Clin. Chim. Acta 2004, 342, 179–185. [Google Scholar] [CrossRef] [PubMed]
- Maas, R.; Böger, R.H.; Schwedhelm, E.; Casas, J.P.; López-Jaramillo, P.; Serrano, N.; Díaz, L.A. Plasma concentrations of asymmetric dimethylarginine (ADMA) in Colombian women with pre-eclampsia. JAMA 2004, 291, 823–824. [Google Scholar] [CrossRef] [PubMed]
- Hladunewich, M.A.; Derby, G.C.; Lafayette, R.A.; Blouch, K.L.; Druzin, M.L.; Myers, B.D. Effect of L-arginine therapy on the glomerular injury of preeclampsia: A randomized controlled trial. Obstet. Gynecol. 2006, 107, 886–895. [Google Scholar] [CrossRef]
- Kim, Y.; Park, H.; Lee, H.; Ha, E.; Suh, S.; Oh, S.; Yoo, H.-S. Reduced l-arginine Level and Decreased Placental eNOS Activity in Preeclampsia. Placenta 2006, 27, 438–444. [Google Scholar] [CrossRef]
- Siroen, M.P.; Teerlink, T.; Bolte, A.C.; Van Elburg, R.M.; Richir, M.C.; Nijveldt, R.J.; Van Der Hoven, B.; Van Leeuwen, P.A. No Compensatory Upregulation of Placental Dimethylarginine Dimethylaminohydrolase Activity in Preeclampsia. Gynecol. Obstet. Investig. 2006, 62, 7–13. [Google Scholar] [CrossRef] [PubMed]
- Braekke, K.; Ueland, P.M.; Harsem, N.K.; Staff, A.C. Asymmetric Dimethylarginine in the Maternal and Fetal Circulation in Preeclampsia. Pediatr. Res. 2009, 66, 411–415. [Google Scholar] [CrossRef] [PubMed]
- Mao, D.; Che, J.; Li, K.; Han, S.; Yue, Q.; Zhu, L.; Zhang, W.; Li, L. Association of homocysteine, asymmetric dimethylarginine, and nitric oxide with preeclampsia. Arch. Gynecol. Obstet. 2010, 282, 371–375. [Google Scholar] [CrossRef]
- Turan, F.; Ilhan, N.; Kaman, D.; Ateş, K.; Kafkaslı, A. Glu298Asp polymorphism of the endothelial nitric oxide synthase gene and plasma concentrations of asymmetric dimethylarginine in Turkish pre-eclamptic women without fetal growth retardation. J. Obstet. Gynaecol. Res. 2010, 36, 495–501. [Google Scholar] [CrossRef]
- Khalil, A.A.; Tsikas, D.; Akolekar, R.; Jordan, J.; Nicolaides, K. Asymmetric dimethylarginine, arginine and homoarginine at 11–13 weeks’ gestation and preeclampsia: A case–control study. J. Hum. Hypertens. 2011, 27, 38–43. [Google Scholar] [CrossRef]
- Anderssohn, M.; Maaß, L.M.; Diemert, A.; Lüneburg, N.; Atzler, D.; Hecher, K.; Böger, R.H. Severely decreased activity of placental dimethylarginine dimethylaminohydrolase in pre-eclampsia. Eur. J. Obstet. Gynecol. Reprod. Biol. 2012, 161, 152–156. [Google Scholar] [CrossRef]
- Tamás, P.; Bódis, J.; Sulyok, E.; Kovács, G.L.; Hantosi, E.; Molnar, G.; Martens-Lobenhoffer, J.; Bode-Böger, S.M. L-arginine metabolism in early-onset and late-onset pre-eclamptic pregnancies. Scand. J. Clin. Lab. Investig. 2013, 73, 436–443. [Google Scholar] [CrossRef]
- Vejtorp, M.; Pedersen, J.; Klebbe, J.G.; Lund, E. Low concentration of plasma amino acids in newborn babies of diabetic mothers. Acta Paediatr. Scand. 1977, 66, 53–58. [Google Scholar] [CrossRef]
- Fitch, W.L.; King, J.C. Plasma amino acid, glucose, and insulin responses to moderate-protein and high-protein test meals in pregnant, nonpregnant, and gestational diabetic women. Am. J. Clin. Nutr. 1987, 46, 243–249. [Google Scholar] [CrossRef] [PubMed]
- Butte, N.F.; Hsu, H.W.; Thotathuchery, M.; Wong, W.W.; Khoury, J.; Reeds, P. Protein metabolism in insulin-treated gestational diabetes. Diabetes Care 1999, 22, 806–811. [Google Scholar] [CrossRef]
- Cetin, I.; de Santis, M.S.N.; Taricco, E.; Radaelli, T.; Teng, C.; Ronzoni, S.; Spada, E.; Milani, S.; Pardi, G. Maternal and fetal amino acid concentrations in normal pregnancies and in pregnancies with gestational diabetes mellitus. Am. J. Obstet. Gynecol. 2005, 192, 610–617. [Google Scholar] [CrossRef] [PubMed]
- Pappa, K.I.; Vlachos, G.; Theodora, M.; Roubelaki, M.; Angelidou, K.; Antsaklis, A. Intermediate metabolism in association with the amino acid profile during the third trimester of normal pregnancy and diet-controlled gestational diabetes. Am. J. Obstet. Gynecol. 2007, 196, 65.e1–65.e5. [Google Scholar] [CrossRef]
- Park, S.; Park, J.Y.; Lee, J.H.; Kim, S. Plasma Levels of Lysine, Tyrosine, and Valine During Pregnancy Are Independent Risk Factors of Insulin Resistance and Gestational Diabetes. Metab. Syndr. Relat. Disord. 2015, 13, 64–70. [Google Scholar] [CrossRef]
- Rahimi, N.; Razi, F.; Nasli-Esfahani, E.; Qorbani, M.; Shirzad, N.; Larijani, B. Amino acid profiling in the gestational diabetes mellitus. J. Diabetes Metab. Disord. 2017, 16, 1–6. [Google Scholar] [CrossRef]
- Roy, C.; Tremblay, P.-Y.; Anassour-Laouan-Sidi, E.; Lucas, M.; Forest, J.-C.; Giguère, Y.; Ayotte, P. Risk of gestational diabetes mellitus in relation to plasma concentrations of amino acids and acylcarnitines: A nested case-control study. Diabetes Res. Clin. Pract. 2018, 140, 183–190. [Google Scholar] [CrossRef] [PubMed]
- Wang, Z.; Yue, X.; Mou, K. The changes of amino acids and acylcarnitine levels of women with gestational diabetes mellitus, and their relationship with insulin resistance of women. Chin. J. Fam. Plann. 2019, 27, 1494–1497. [Google Scholar]
- Jiang, R.; Wu, S.; Fang, C.; Wang, C.; Yang, Y.; Liu, C.; Hu, J.; Huang, Y. Amino acids levels in early pregnancy predict sub-sequent gestational diabetes. J. Diabetes 2020, 12, 503–511. [Google Scholar] [CrossRef] [PubMed]
- Ye, L.J.; Jiang, X.; Wei, X.Q. Changes of amino acid and acylcarnitine levels and insulin resistance in gestational diabetes mellitus. J. Clin. Exp. Med. 2021, 20, 364–367. [Google Scholar]
- Kim, Y.S.; Maruvada, P.; Milner, J.A. Metabolomics in biomarker discovery: Future uses for cancer prevention. Futur. Oncol. 2008, 4, 93–102. [Google Scholar] [CrossRef] [PubMed]
- Appleton, J. Arginine: Clinical potential of a semi-essential amino acid. Altern. Med. Rev. 2002, 7, 512–522. [Google Scholar]
- Holm, M.B.; Bastani, N.E.; Holme, A.M.; Zucknick, M.; Jansson, T.; Refsum, H.; Mørkrid, L.; Blomhoff, H.M.; Henriksen, T.; MichelsenT. M. Uptake and release of amino acids in the fetal-placental unit in human pregnancies. PLoS ONE 2017, 12, e0185760. [Google Scholar] [CrossRef]
- Dekker, G.A.; Van Geijn, H.P. Endothelial dysfunction in preeclampsia. Part I: Primary prevention. Therapeutic perspectives. J. Peérinat. Med. 1996, 24, 99–117. [Google Scholar]
- Lowe, D.T. Nitric Oxide Dysfunction in the Pathophysiology of Preeclampsia. Nitric Oxide 2000, 4, 441–458. [Google Scholar] [CrossRef] [PubMed]
- Ramírez-Zamora, S.; Méndez-Rodríguez, M.L.; Olguín-Martínez, M.; Sánchez-Sevilla, L.; Quintana-Quintana, M.; Gar-cía-García, N.; Hernández-Muñoz, R. Increased erythrocytes by-products of arginine catabolism are associated with hyper-glycemia and could be involved in the pathogenesis of type 2 diabetes mellitus. PLoS ONE 2013, 8, e66823. [Google Scholar]
- Mirzaei, H.; Suarez, J.A.; Longo, V.D. Protein and amino acid restriction, aging and disease: From yeast to humans. Trends Endocrinol. Metab. 2014, 25, 558–566. [Google Scholar] [CrossRef] [PubMed]
- Yin, J.; Ren, W.; Chen, S.; Li, Y.; Han, H.; Gao, J.; Liu, G.; Wu, X.; Li, T.; Kim, S.W.; et al. Metabolic Regulation of Methionine Restriction in Diabetes. Mol. Nutr. Food Res. 2018, 62, e1700951. [Google Scholar] [CrossRef] [PubMed]
- Koos, B.J.; Gornbein, J.A. Early pregnancy metabolites predict gestational diabetes mellitus: Implications for fetal programming. Am. J. Obstet. Gynecol. 2021, 224, 215.e1–215.e7. [Google Scholar] [CrossRef] [PubMed]
- Piatti, P.; Monti, L.D.; Valsecchi, G.; Magni, F.; Setola, E.; Marchesi, F.; Galli-Kienle, M.; Pozza, G.; Alberti, K.G.M. Long-Term Oral l-Arginine Administration Improves Peripheral and Hepatic Insulin Sensitivity in Type 2 Diabetic Patients. Diabetes Care 2001, 24, 875–880. [Google Scholar] [CrossRef] [PubMed]
- Hu, S.; Han, M.; Rezaei, A.; Li, D.; Wu, G.; Ma, X. L-Arginine Modulates Glucose and Lipid Metabolism in Obesity and Diabetes. Curr. Protein Pept. Sci. 2017, 18, 599–608. [Google Scholar] [CrossRef] [PubMed]
- Guzmán-Gutiérrez, E.; Abarzúa, F.; Belmar, C.; Nien, J.K.; Ramirez, M.A.; Arroyo, P.; Salomón, C.; Westermeier, F.; Puebla, C.; Leiva, A.; et al. Functional link between adenosine and insulin: A hypothesis for fetoplacental vascular endothelial dysfunction in gestational diabetes. Curr. Vasc. Pharmacol. 2011, 9, 750–762. [Google Scholar] [CrossRef] [PubMed]


| Reference | Country | Subjects | Sample | Age, Year | Sampling Time, wk | GA, wk | BW, kg | NOS 2 |
|---|---|---|---|---|---|---|---|---|
| Young et al., 1969 [18] | Canada | Control | 3 | At delivery | 37–40 | 2.90–3.50 | 7 | |
| IUGR | 4 | At delivery | 37–40 | 1.40–2.60 | ||||
| Cockburn et al., 1971 [19] | United Kingdom | Control | 26 | At delivery | 39.23 ± 2.61 | 3.30 ± 0.49 | 7 | |
| IUGR | 10 | At delivery | 36.00 ± 1.45 | 1.80 ± 0.23 | ||||
| Persson et al., 1986 [20] | Sweden | Control | 15 | 28.00 ± 4.67 | 36–39 | 39.29 ± 0.59 | 3.04 ± 0.23 | 7 |
| IUGR | 8 | 29.20 ± 6.36 | 36–39 | 38.14 ± 0.59 | 2.34 ± 0.32 | |||
| Economides et al., 1989 [21] | USA | Control | 62 | 16–36 | 9 | |||
| IUGR | 31 | 16–36 | ||||||
| Cetin et al., 1990 [22] | Italy | Control | 14 | 38.50 ± 0.75 | 3.22 ± 0.40 | 7 | ||
| IUGR | 12 | 33.70 ± 3.81 | 1.67 ± 0.65 | |||||
| Cetin et al., 1993 [23] | Italy | Control | 8 | 26–38 | 8 | |||
| IUGR | 31 | 27–38 | ||||||
| Cetin et al., 1996 [24] | Italy | Control | 10 | 26–40 | 8 | |||
| IUGR | 6 | 34.40 ± 1.96 | ||||||
| IUGR | 12 | 31.30 ± 3.46 | ||||||
| IUGR | 5 | 30.60 ± 2.91 | ||||||
| Di Giulio et al., 2004 [25] | Italy | Control | 13 | 32.50 ± 3.97 | 8.50 ± 1.80 | 38.57 ± 3.10 | 3.10 ± 0.61 | 9 |
| IUGR | 8 | 32.00 ± 1.98 | 8.80 ± 2.26 | 37.71 ± 2.43 | 2.12 ± 0.48 | |||
| Speer et al., 2008 [26] | USA | Control | 31 | 21.90 ± 4.70 | 18.30 ± 1.60 | 39.50 ± 1.40 | 3.26 ± 0.49 | 9 |
| IUGR | 12 | 22.90 ± 4.70 | 18.10 ± 1.80 | 39.70 ± 1.30 | 2.47 ± 0.22 | |||
| Control | 31 | 21.90 ± 4.70 | At delivery | 39.50 ± 1.40 | 3.26 ± 0.49 | |||
| IUGR | 12 | 22.90 ± 4.70 | At delivery | 39.70 ± 1.30 | 2.47 ± 0.22 | |||
| Tsikas et al., 2018 [27] | United Kingdom | Control | 43 | 29.00 ± 5.30 | 23–25 | 39.40 ± 1.60 | 3.33 ± 0.46 | 8 |
| Control | 19 | 27.10 ± 5.80 | 23–25 | 40.00 ± 1.70 | 3.21 ± 0.41 | |||
| IUGR | 14 | 26.30 ± 6.20 | 23–25 | 38.60 ± 4.00 | 2.30 ± 0.73 | |||
| Cockburn et al., 1971 [19] | United Kingdom | Control | 26 | At delivery | 39.23 ± 2.61 | 3.30 ± 0.49 | 8 | |
| PE | 12 | At delivery | 36.00 ± 1.45 | 1.80 ± 0.23 | ||||
| Kuutti-Savolainen et al., 1979 [28] | Finland | Control | 7 | 27.00 ± 5.40 | At delivery | 39.60 ± 1.10 | 3.62 ± 0.69 | 6 |
| PE | 4 | 23.30 ± 3.60 | At delivery | 40.00 ± 1.40 | 3.19 ± 0.26 | |||
| Pettersson et al., 1998 [29] | Sweden | Control | 12 | 30.30 ± 3.81 | 32–39 | 7 | ||
| PE | 12 | 29.10 ± 4.16 | 35.60 ± 2.77 | 35.60 ± 2.77 | 2.22 ± 0.89 | |||
| Beinder et al., 1999 [30] | Germany | Control | 8 | 31.40 ± 3.88 | At delivery | 38.20 ± 2.57 | 3.37 ± 0.74 | 6 |
| PE | 10 | 29.40 ± 5.25 | At delivery | 32.80 ± 4.88 | 1.95 ± 1.23 | |||
| Evans et al., 2003 [31] | USA | Control | 30 | 24.80 ± 4.93 | 38.80 ± 3.29 | 39.50 ± 1.10 | 3.58 ± 0.41 | 8 |
| PE | 29 | 27.00 ± 6.46 | At delivery | 35.50 ± 2.69 | 2.46 ± 0.82 | |||
| Glew et al., 2004 [32] | Nigeria | Control | 16 | 26.90 ± 7.20 | 35.30 ± 5.50 | 9 | ||
| PE | 37 | 25.00 ± 7.30 | 35.40 ± 3.90 | |||||
| Maas et al., 2004 [33] | Colombia | Control | 93 | 19.60 ± 3.70 | At delivery | 39.00 ± 3.70 | 3.21 ± 0.43 | 8 |
| PE | 67 | 20.10 ± 5.40 | At delivery | 36.00 ± 1.63 | 2.46 ± 0.78 | |||
| Hladunewich et al., 2006 [34] | USA | Control | 22 | 32.00 ± 5.00 | At delivery | 39.80 ± 0.90 | 7 | |
| PE | 23 | 28.00 ± 7.00 | At delivery | 34.40 ± 3.70 | ||||
| Kim et al., 2006 [35] | Korea | Control | 13 | 31.10 ± 3.70 | >20 | 39.10 ± 2.20 | 8 | |
| PE | 16 | 30.70 ± 4.70 | >20 | 35.90 ± 3.90 | ||||
| Siroen et al., 2006 [36] | The Netherlands | Control | 15 | 32.00 ± 5.00 | At delivery | 41.30 ± 1.10 | 3.52 ± 0.56 | 7 |
| PE | 16 | 31.00 ± 5.00 | At delivery | 37.10 ± 2.90 | 2.51 ± 0.86 | |||
| PE | 7 | 30.00 ± 6.00 | At delivery | 32.40 ± 5.90 | 1.70 ± 1.20 | |||
| Speer et al., 2008 [26] | USA | Control | 31 | 21.90 ± 4.70 | 18.30 ± 1.60 | 39.50 ± 1.40 | 3.26 ± 0.49 | 9 |
| PE | 15 | 25.10 ± 5.80 | 16.90 ± 3.20 | 35.90 ± 3.80 | 2.48 ± 0.85 | |||
| Control | 31 | 21.90 ± 4.70 | At delivery | 39.50 ± 1.40 | 3.26 ± 0.49 | |||
| PE | 15 | 25.10 ± 5.80 | At delivery | 35.90 ± 3.80 | 2.48 ± 0.85 | |||
| Braekke et al., 2009 [37] | Norway | Control | 51 | 32.50 ± 5.75 | At delivery | 38.70 ± 1.83 | 3.47 ± 0.47 | 7 |
| PE | 47 | 31.50 ± 5.75 | At delivery | 32.90 ± 3.45 | 1.72 ± 0.75 | |||
| Mao et al., 2010 [38] | China | Control | 30 | 7 | ||||
| PE | 24 | |||||||
| PE | 38 | |||||||
| Turan et al., 2010 [39] | Turkey | Control | 54 | 29.60 ± 5.90 | 33.90 ± 4.20 | 8 | ||
| PE | 55 | 32.00 ± 6.60 | 33.50 ± 4.10 | |||||
| Khalil et al., 2013 [40] | United Kingdom | Control | 300 | 32.50 ± 6.89 | 12.40 ± 0.89 | 40.00 ± 1.41 | 3.40 ± 0.44 | 9 |
| PE | 25 | 30.20 ± 8.67 | 12.40 ± 0.44 | 32.00 ± 2.52 | 1.40 ± 0.37 | |||
| PE | 50 | 32.40 ± 5.93 | 12.40 ± 0.59 | 38.90 ± 1.63 | 3.10 ± 0.74 | |||
| Anderssohn et al., 2012 [41] | Germany | Control | 28 | 31.70 ± 5.30 | 36.60 ± 3.50 | 39.00 ± 1.00 | 3.56 ± 0.43 | 7 |
| PE | 18 | 31.90 ± 6.20 | 33.90 ± 3.30 | 35.00 ± 3.50 | 2.22 ± 0.95 | |||
| Tamás et al., 2013 [42] | Hungary | Control | 15 | 30.10 ± 6.50 | 29.80–39.20 | 39.20 ± 1.30 | 3.41 ± 0.56 | 8 |
| PE | 36 | 30.00 ± 6.80 | 29.80–39.20 | 31.80 ± 2.90 | 1.45 ± 0.54 | |||
| PE | 17 | 31.20 ± 6.20 | 29.80–39.20 | 38.00 ± 1.60 | 3.03 ± 0.60 | |||
| Tsikas et al., 2018 [27] | United Kingdom | Control | 43 | 29.00 ± 5.30 | 23.00–25.00 | 39.40 ± 1.60 | 3.33 ± 0.46 | 8 |
| Control | 19 | 27.10 ± 5.80 | 23.00–25.00 | 40.00 ± 1.70 | 3.21 ± 0.41 | |||
| PE | 10 | 28.20 ± 4.70 | 23.00–25.00 | 34.80 ± 3.50 | 2.07 ± 0.72 | |||
| Campos et al., 2019 [4] | Switzerland | Control | 33 | 30.40 ± 3.93 | 12.40 ± 0.74 | 39.60 ± 1.06 | 3.43 ± 0.52 | 8 |
| PE | 33 | 31.00 ± 4.81 | 12.40 ± 0.53 | 37.90 ± 2.33 | 3.03 ± 0.74 | |||
| Control | 3 | 31.90 ± 2.07 | 12.29 ± 1.16 | 40.43 ± 0.11 | 3.01 ± 0.81 | |||
| PE | 5 | 27.00 ± 5.78 | 12.57 ± 0.32 | 37.43 ± 2.12 | 2.82 ± 1.02 | |||
| Cockburn et al., 1971 [19] | United Kingdom | Control | 26 | At delivery | 39.23 ± 2.61 | 3.30 ± 0.49 | 7 | |
| GDM | 9 | At delivery | 36.00 ± 1.15 | 3.80 ± 0.58 | ||||
| Vejtorp et al., 1977 [43] | Denmark | Control | 5 | 28.00 ± 2.03 | At delivery | 39.60 ± 1.17 | 3.90 ± 0.49 | 7 |
| GDM | 6 | 25.80 ± 2.34 | At delivery | 37.70 ± 0.87 | 2.80 ± 0.33 | |||
| Persson et al., 1986 [20] | Sweden | Control | 15 | 28.00 ± 4.67 | 36.00–39.00 | 39.29 ± 0.59 | 3.04 ± 0.23 | 7 |
| GDM | 4 | 30.80 ± 5.20 | 36.00–39.00 | 39.29 ± 0.28 | 3.66 ± 0.49 | |||
| Fitch et al., 1987 [44] | USA | Control | 8 | 26.80 ± 7.40 | 30.00–36.00 | 3.33 ± 0.59 | 7 | |
| GDM | 2 | 28.50 ± 7.80 | 30.00–36.00 | 3.65 ± 0.10 | ||||
| Butte et al., 1999 [45] | USA | Control | 8 | 23.00 ± 2.00 | 6.00 | 39.40 ± 1.80 | 3.70 ± 0.40 | 7 |
| GDM | 8 | 28.00 ± 5.00 | 6.00 | 39.50 ± 0.80 | 3.60 ± 0.40 | |||
| Control | 8 | 23.00 ± 2.00 | 32–36 | 39.40 ± 1.80 | 3.70 ± 0.40 | |||
| GDM | 8 | 28.00 ± 5.00 | 32–36 | 39.50 ± 0.80 | 3.60 ± 0.40 | |||
| Cetin et al., 2005 [46] | Italy | Control | 16 | At delivery | 9 | |||
| GDM | 17 | At delivery | ||||||
| Pappa et al., 2007 [47] | Greece | Control | 46 | 27.85 ± 4.99 | 30–33 | 8 | ||
| GDM | 25 | 27.84 ± 5.14 | 30–33 | |||||
| Park et al., 2015 [48] | Korea | Control | 25 | 33.30 ± 3.80 | 26.24 ± 2.07 | 9 | ||
| GDM | 64 | 33.70 ± 4.10 | 26.36 ± 1.87 | |||||
| Rahimi et al., 2017 [49] | Iran | Control | 25 | 29.46 ± 5.45 | >25 | 9 | ||
| GDM | 31 | 32.65 ± 5.56 | >25 | |||||
| Roy et al., 2018 [50] | Canada | Control | 50 | 31.00 ± 3.80 | 24–28 | 38.40 ± 1.70 | 3.15 ± 0.75 | 9 |
| GDM | 50 | 31.00 ± 3.70 | 24–28 | 39.30 ± 1.50 | 3.30 ± 0.52 | |||
| Wang et al., 2019 [51] | China | Control | 63 | 29.32 ± 3.61 | 26.06 ± 1.64 | 7 | ||
| GDM | 58 | 30.75 ± 4.23 | 26.04 ± 1.23 | |||||
| Burzynska-Pedziwiatr et al., 2020 [13] | Poland | Control | 35 | 28.00 ± 3.70 | 24–28 | 9 | ||
| GDM | 29 | 30.00 ± 4.44 | 24–28 | |||||
| Jiang et al., 2020 [52] | China | Control | 366 | 28.10 ± 3.60 | 12–16 | 9 | ||
| GDM | 65 | 29.80 ± 3.80 | 12–16 | |||||
| Ye et al., 2021 [53] | China | Control | 48 | 28.22 ± 3.02 | 39.12 ± 1.15 | 7 | ||
| GDM | 48 | 28.09 ± 3.35 | 39.17 ± 1.18 |
| Pregnancy Complication | p for Egger’s Test | p for Begg’s Test |
|---|---|---|
| IUGR | 0.109 | 0.511 |
| PE | 0.873 | 0.508 |
| GDM | 0.311 | 0.184 |
Publisher’s Note: MDPI stays neutral with regard to jurisdictional claims in published maps and institutional affiliations. |
© 2022 by the authors. Licensee MDPI, Basel, Switzerland. This article is an open access article distributed under the terms and conditions of the Creative Commons Attribution (CC BY) license (https://creativecommons.org/licenses/by/4.0/).
Share and Cite
Xu, L.; Zeng, J.; Wang, H.; Liu, H. Comparison of Diagnostic Values of Maternal Arginine Concentration for Different Pregnancy Complications: A Systematic Review and Meta-Analysis. Biomedicines 2022, 10, 166. https://doi.org/10.3390/biomedicines10010166
Xu L, Zeng J, Wang H, Liu H. Comparison of Diagnostic Values of Maternal Arginine Concentration for Different Pregnancy Complications: A Systematic Review and Meta-Analysis. Biomedicines. 2022; 10(1):166. https://doi.org/10.3390/biomedicines10010166
Chicago/Turabian StyleXu, Lianbin, Jia Zeng, Huanan Wang, and Hongyun Liu. 2022. "Comparison of Diagnostic Values of Maternal Arginine Concentration for Different Pregnancy Complications: A Systematic Review and Meta-Analysis" Biomedicines 10, no. 1: 166. https://doi.org/10.3390/biomedicines10010166
APA StyleXu, L., Zeng, J., Wang, H., & Liu, H. (2022). Comparison of Diagnostic Values of Maternal Arginine Concentration for Different Pregnancy Complications: A Systematic Review and Meta-Analysis. Biomedicines, 10(1), 166. https://doi.org/10.3390/biomedicines10010166