
Toward the Decipherment of Molecular Interactions in the Diabetic Brain


Abstract
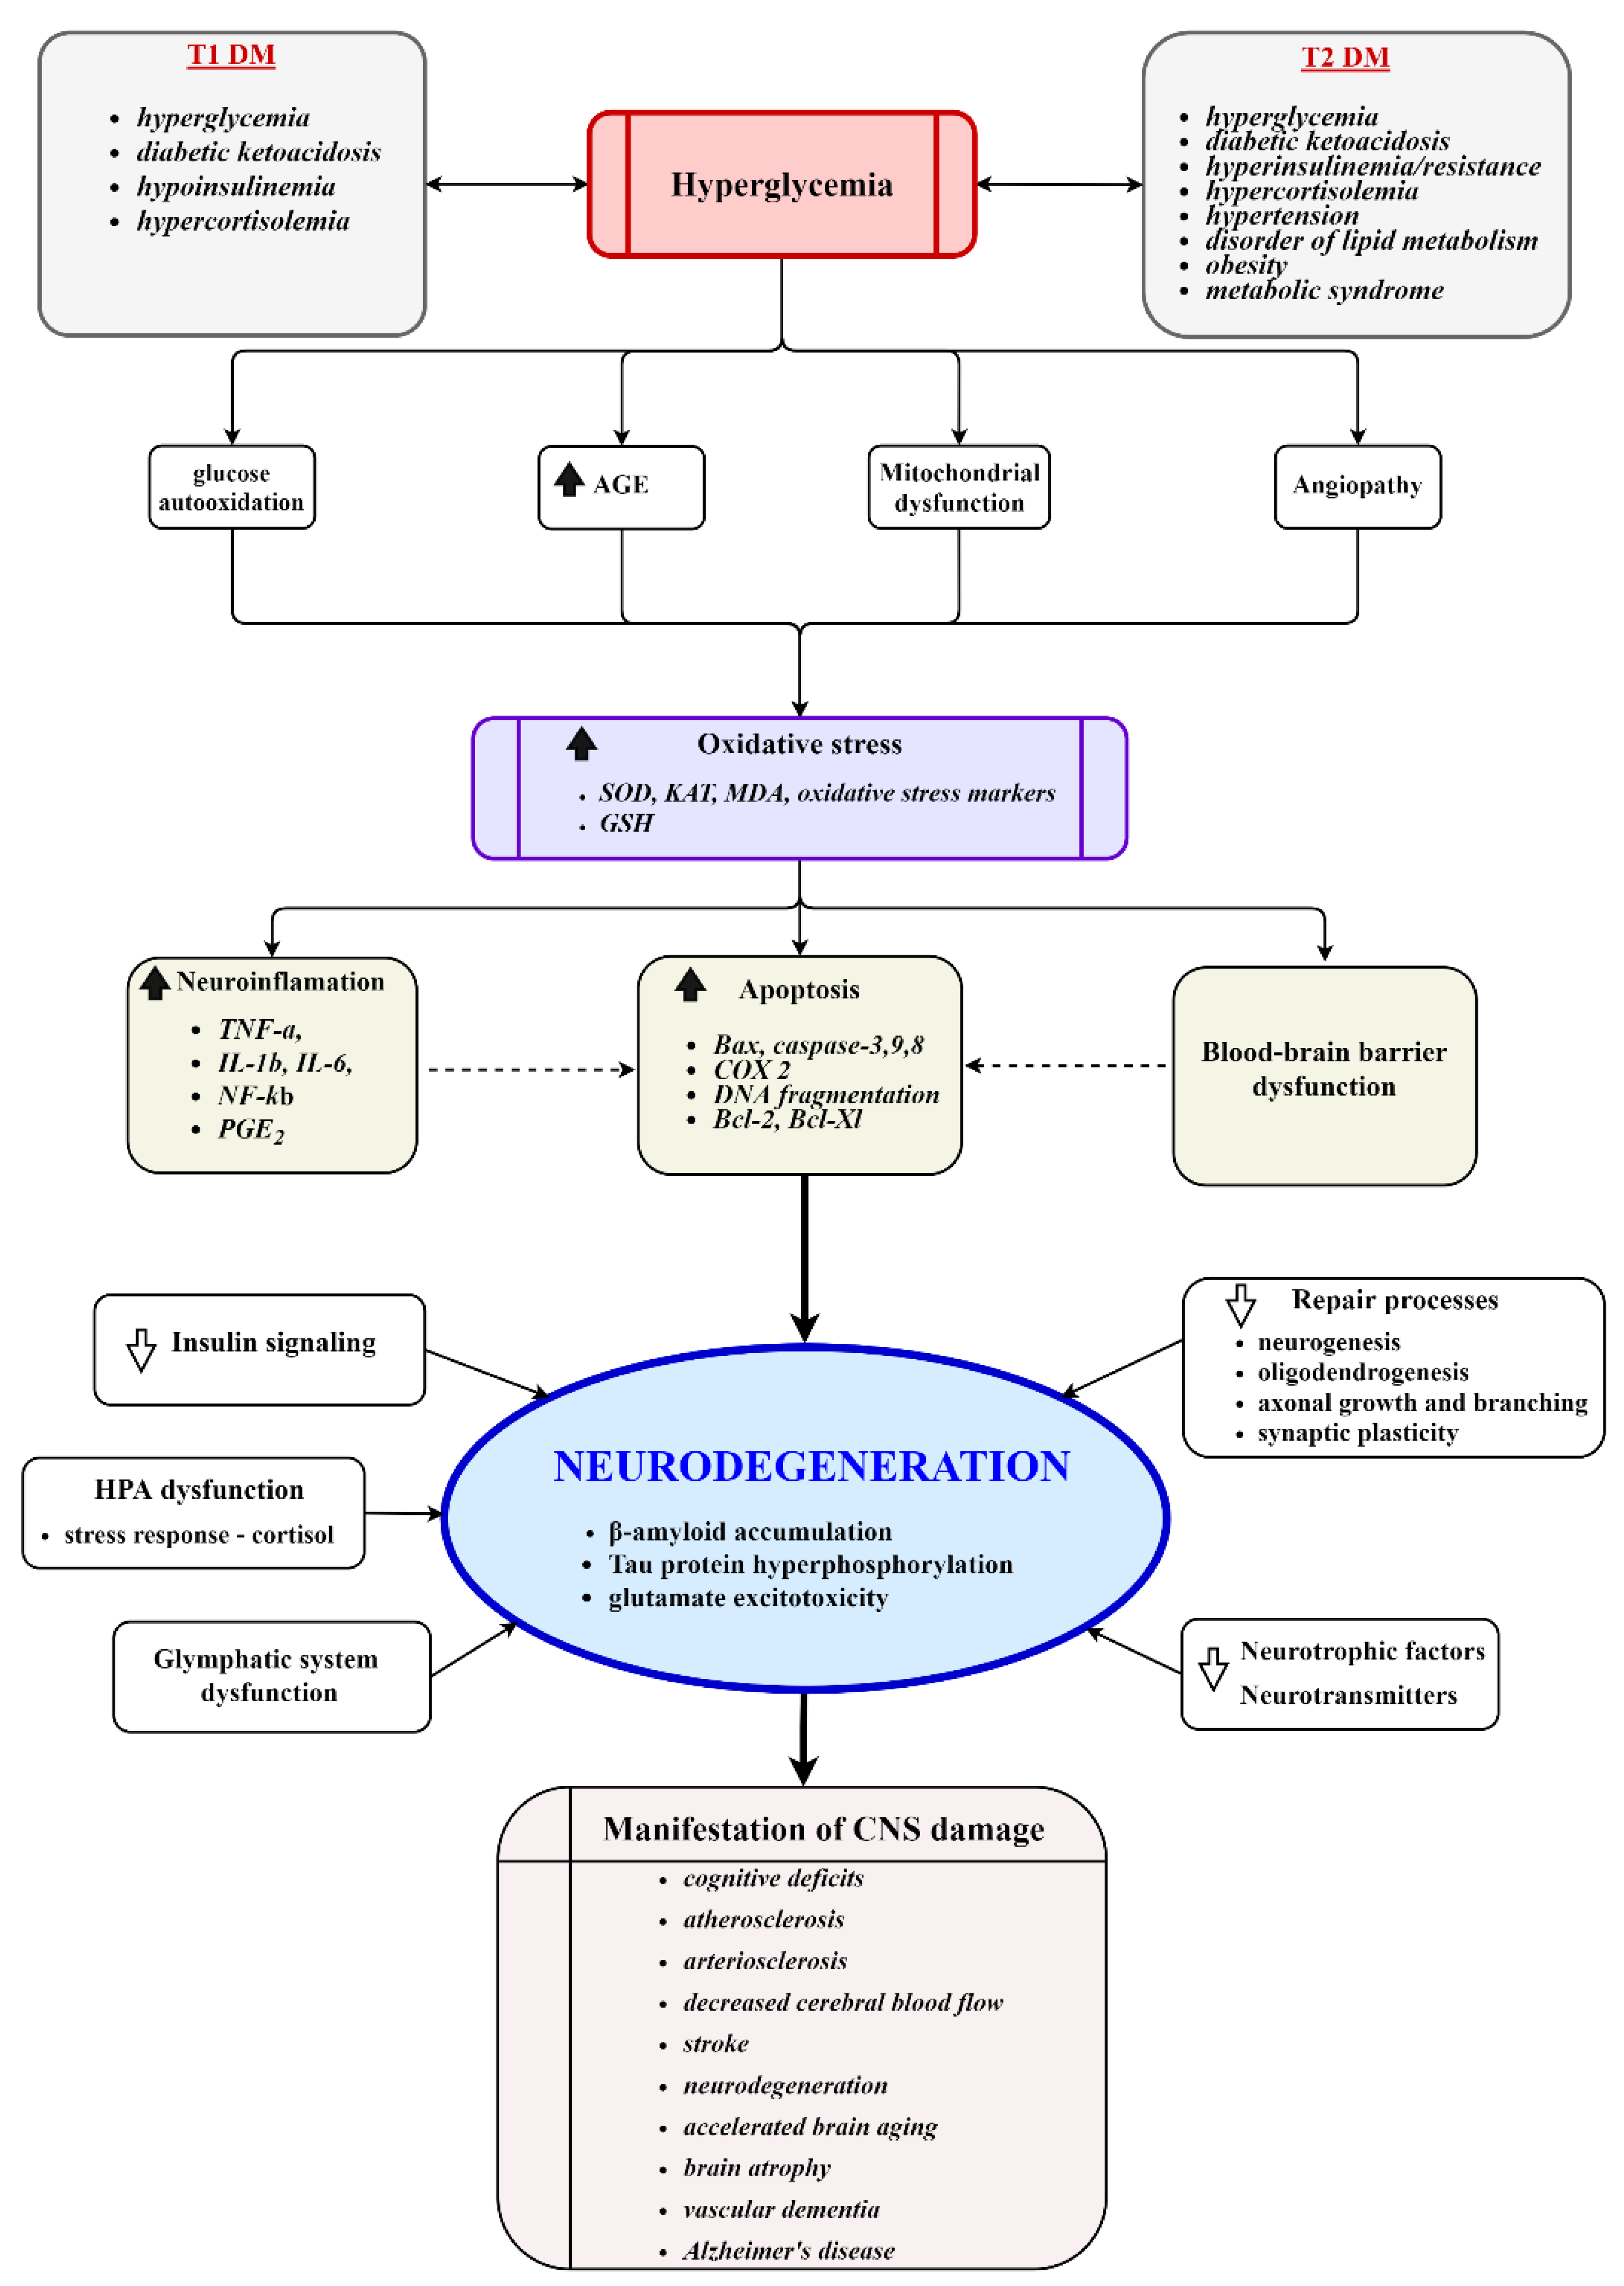
:1. Introduction
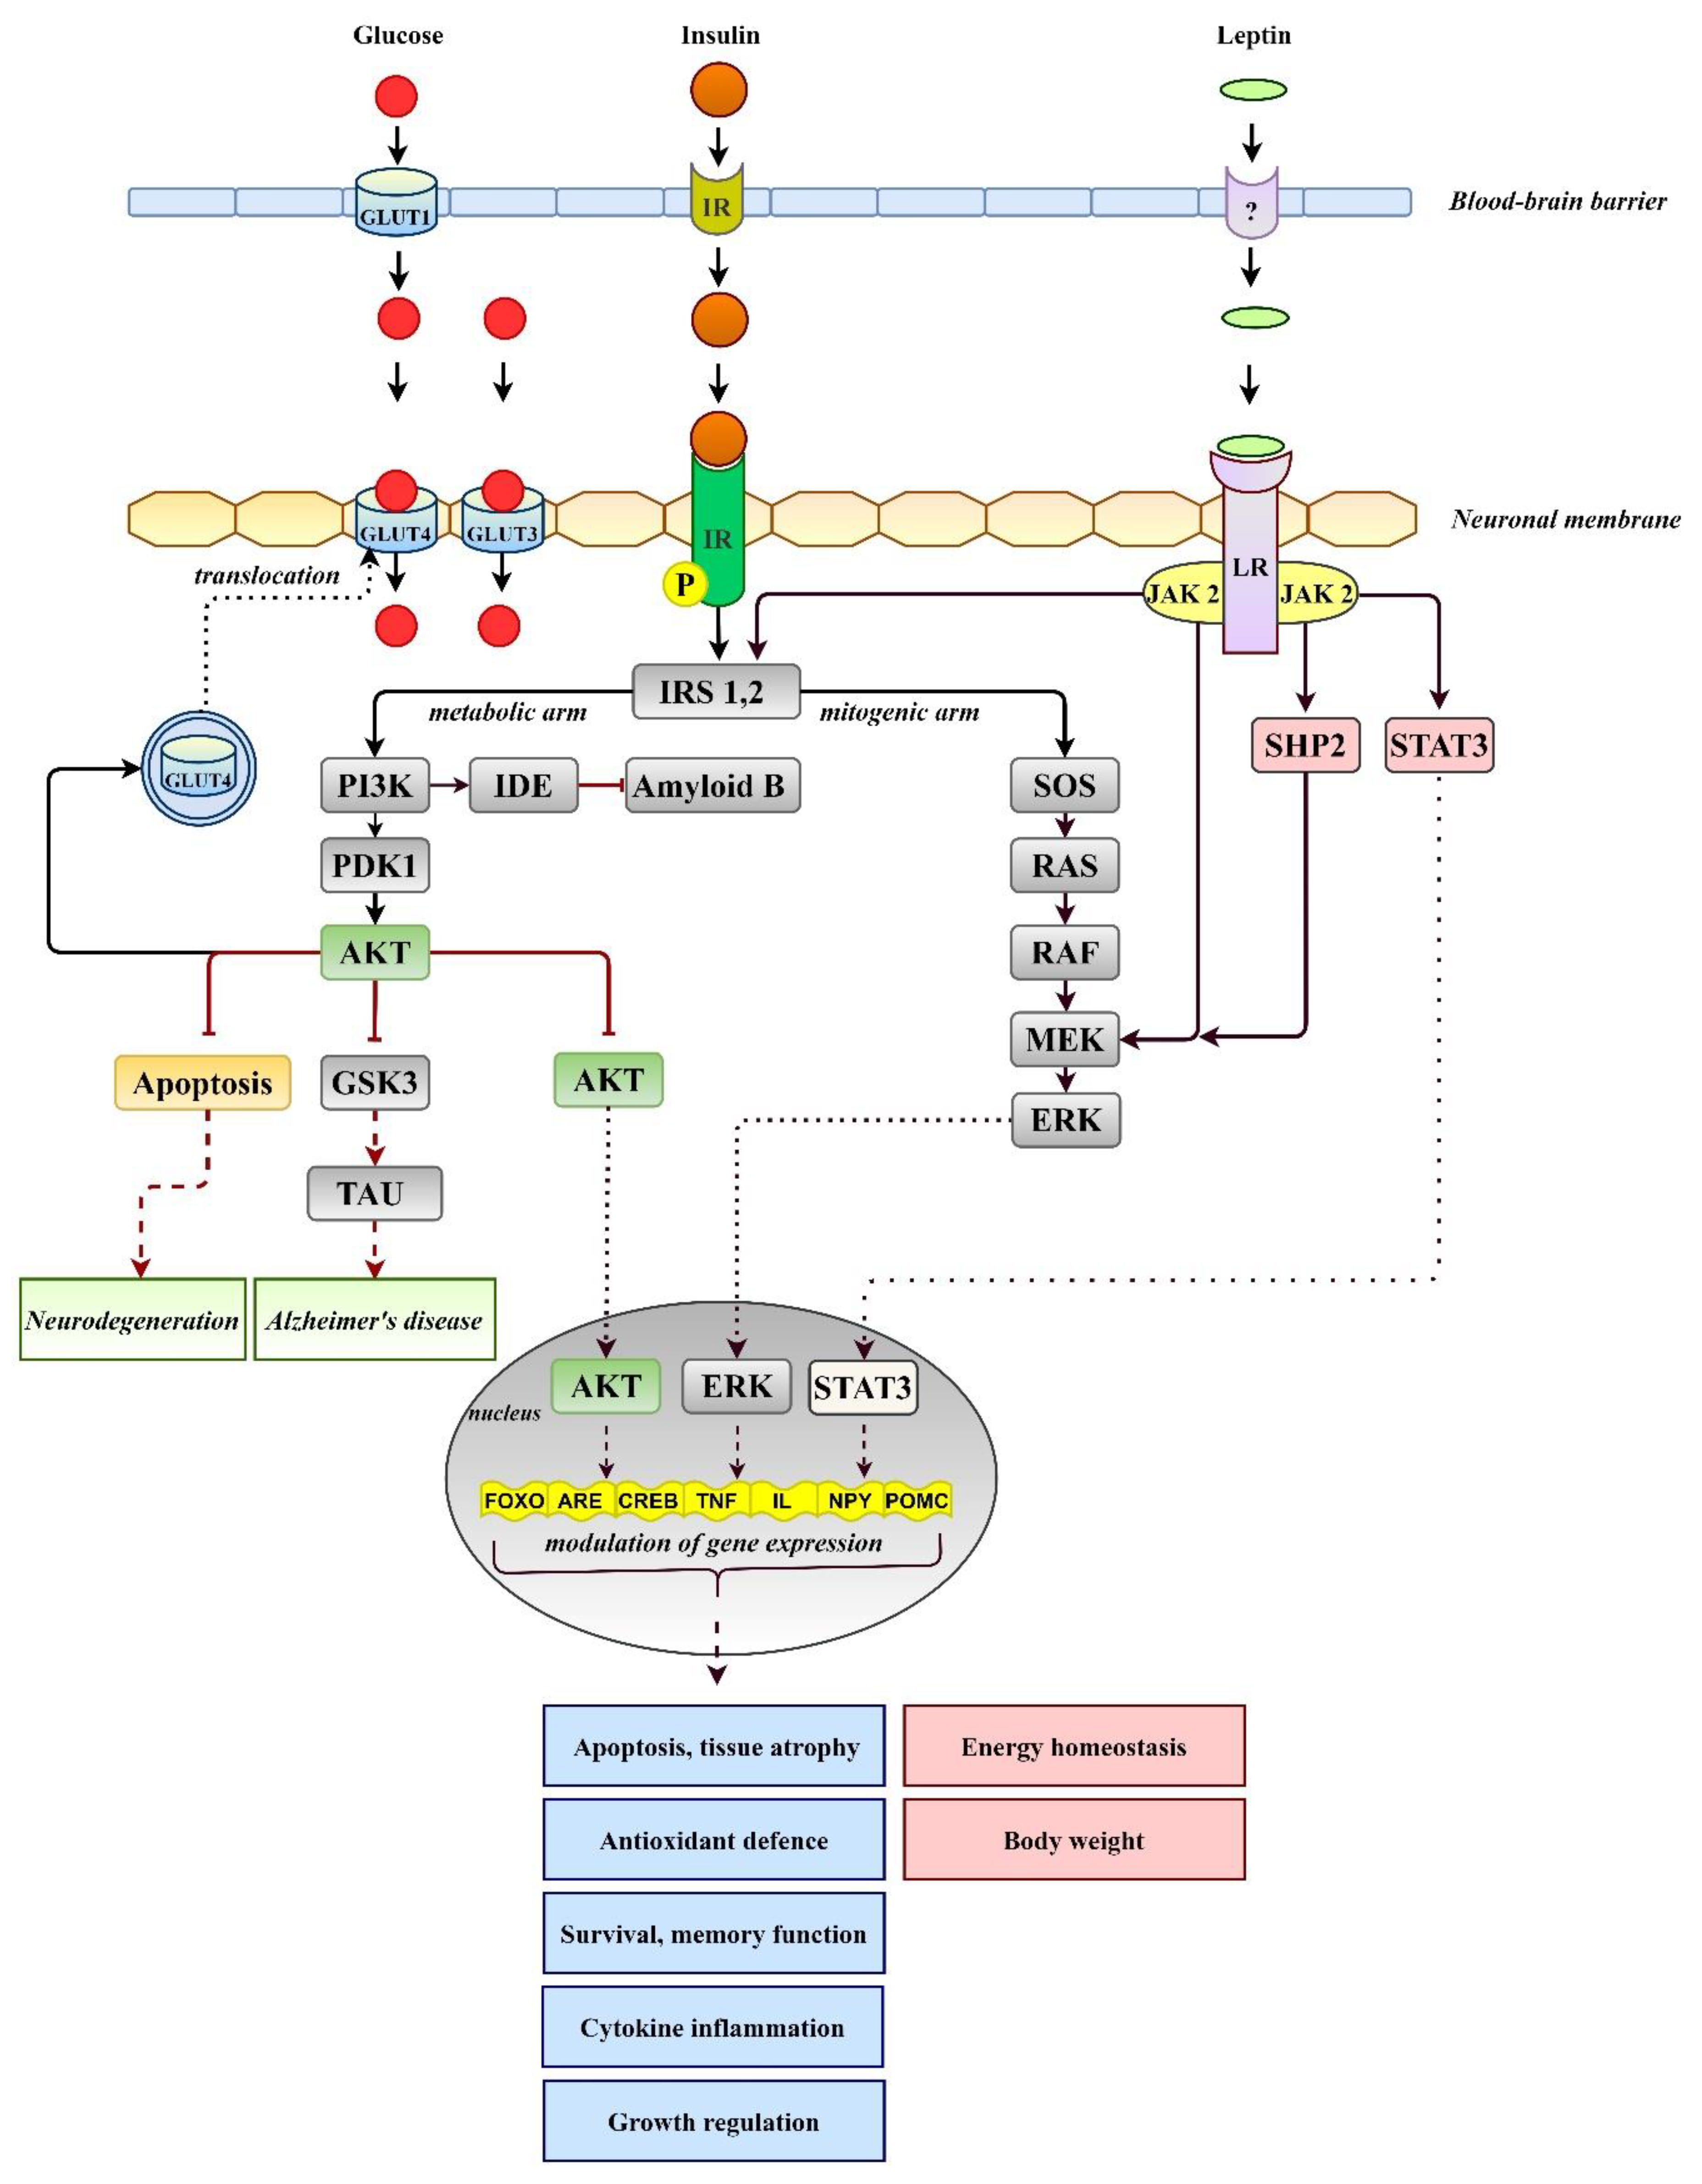
2. Cerebral Glucose Uptake in Diabetes
3. Brain Role in Maintenance of Glucose Homeostasis
3.1. Insulin-Dependent Mechanism
3.2. Insulin-Independent Mechanism
4. Insulin and the Brain
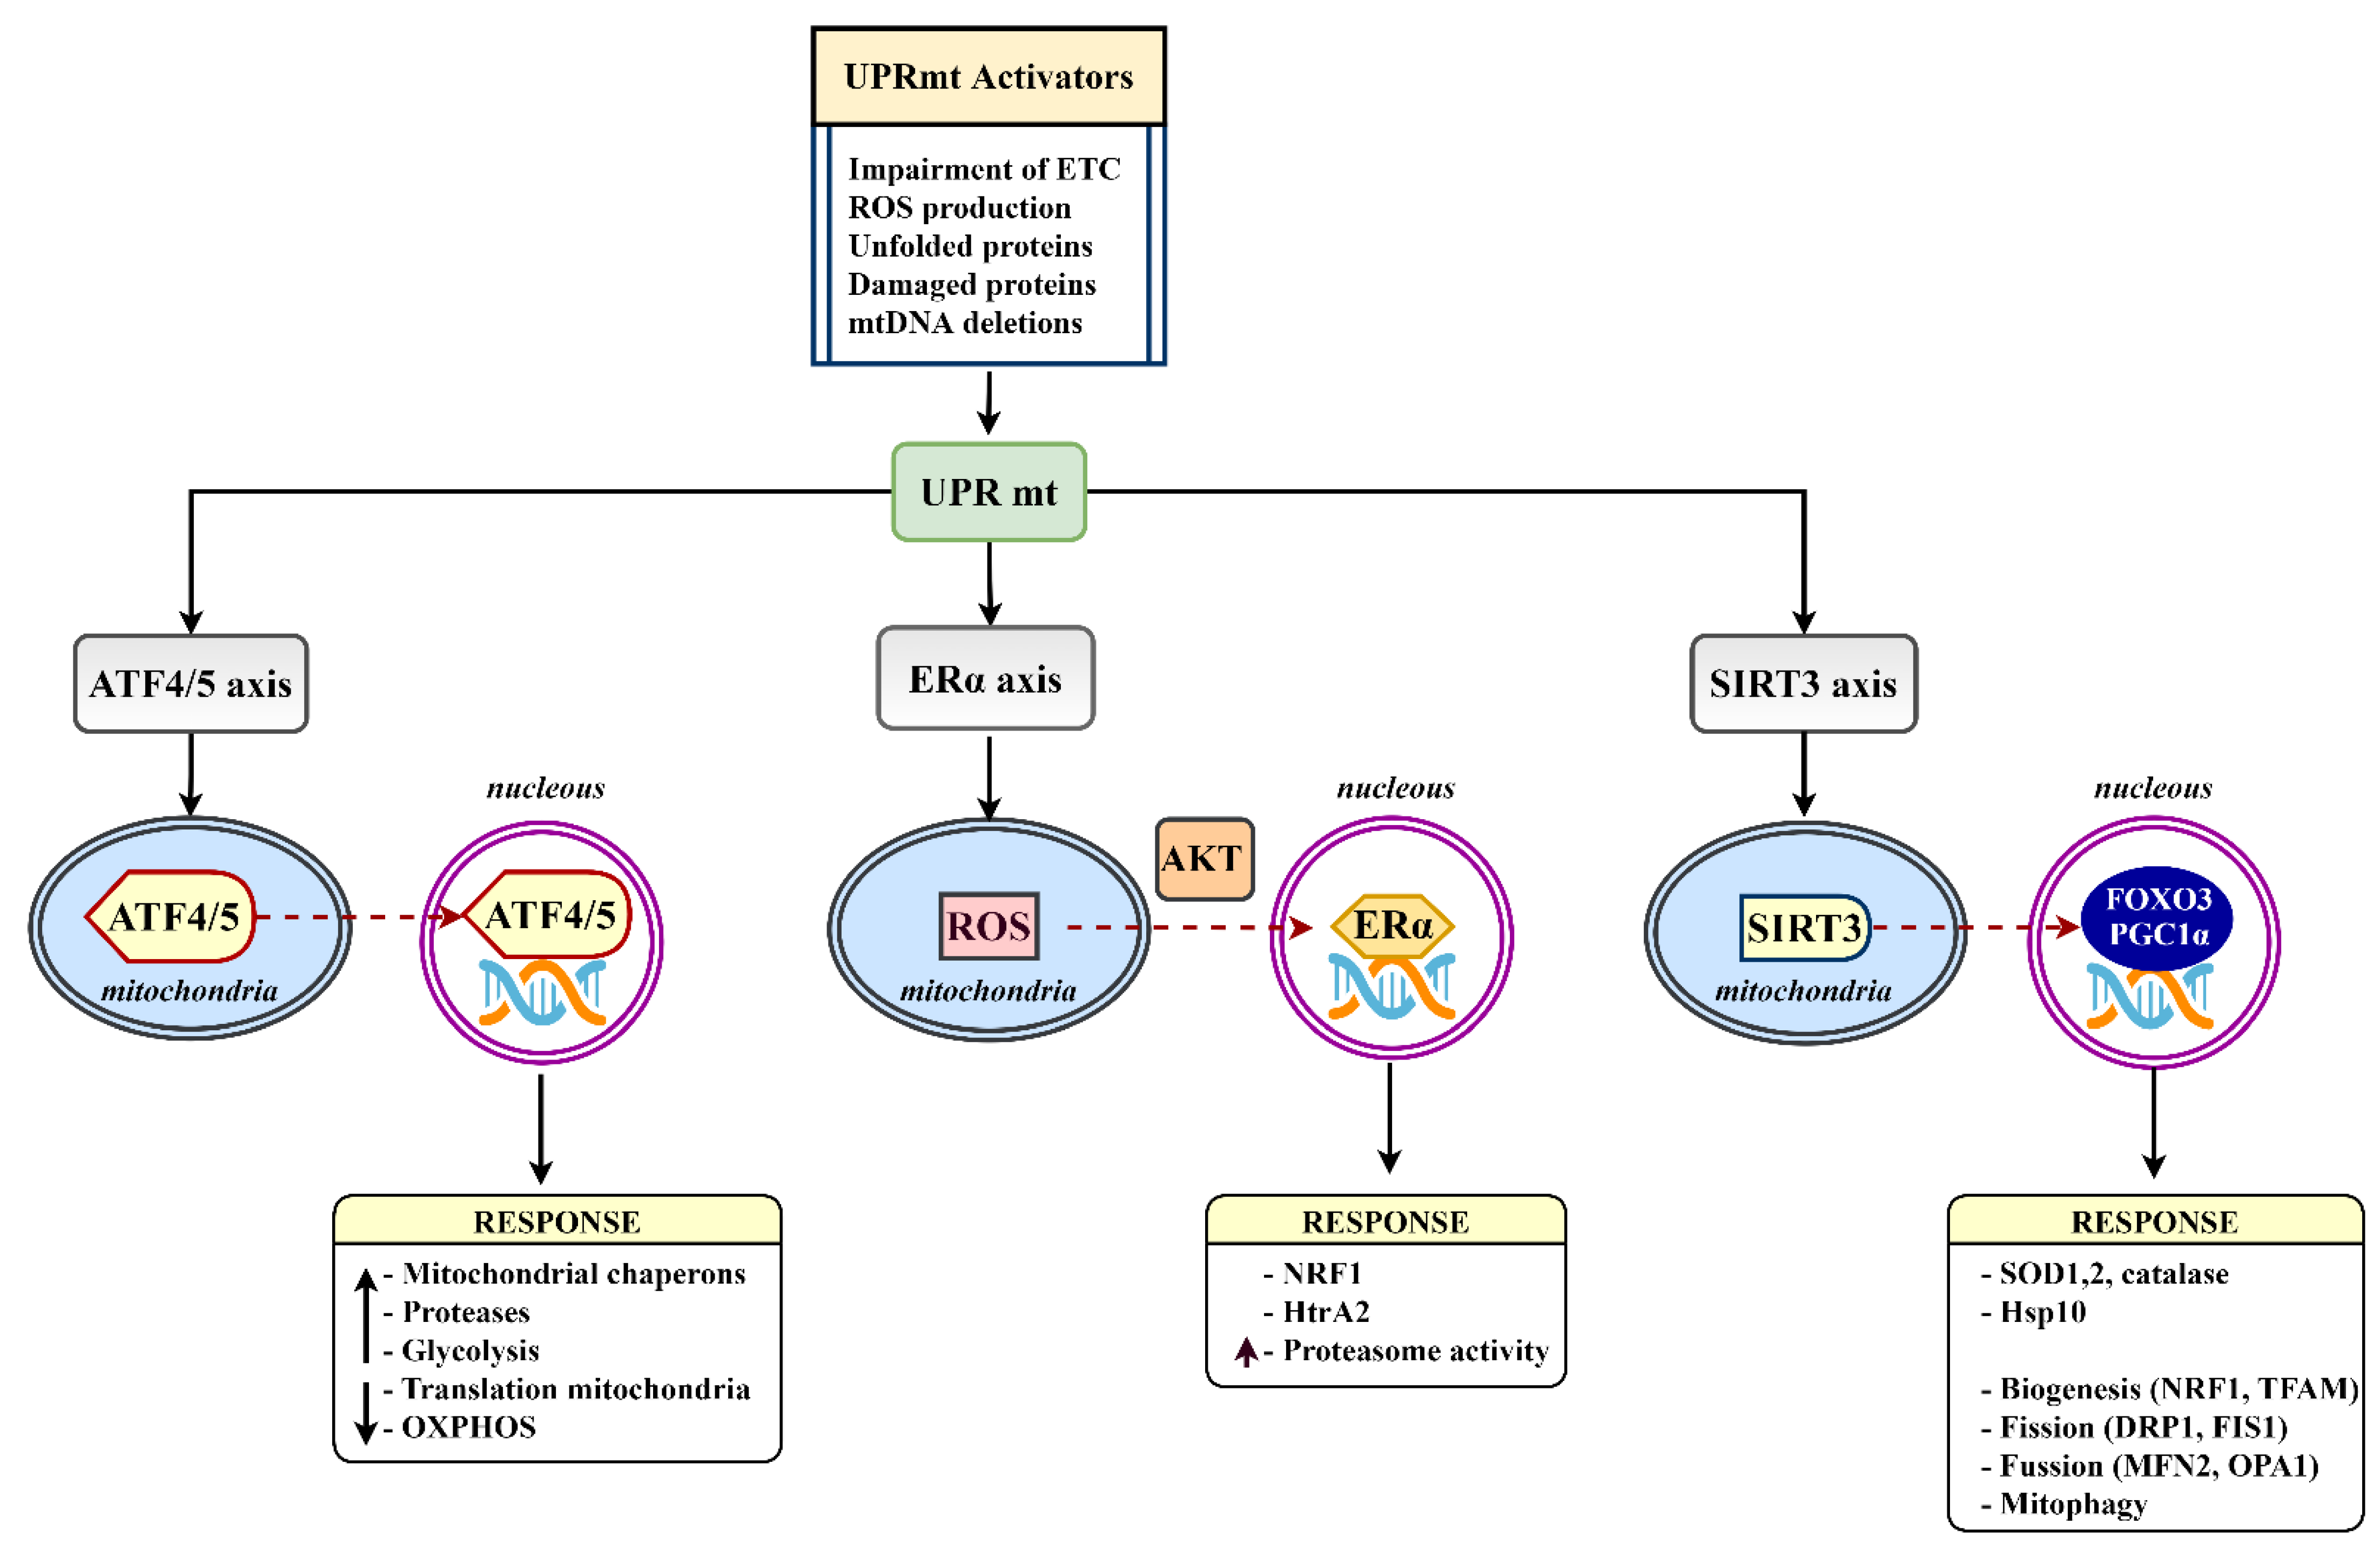
5. Insulin–Mitochondria–ROS Interplay
6. Mitochondrial Proteostasis in the Diabetic Brain
7. Conclusions
Funding
Institutional Review Board Statement
Informed Consent Statement
Conflicts of Interest
References
- Sima, A.A.F. Encephalopathies: The emerging diabetic complications. Acta Diabetol. 2010, 47, 279–293. [Google Scholar] [CrossRef]
- Nouwen, A.; Chambers, A.; Chechlacz, M.; Higgs, S.; Blissett, J.; Barrett, T.; Allen, H.A. Microstructural abnormalities in white and gray matter in obese adolescents with and without type 2 diabetes. NeuroImage Clin. 2017, 16, 43–51. [Google Scholar] [CrossRef]
- Chen, Z.; Li, L.; Sun, J.; Ma, L. Mapping the brain in type II diabetes: Voxel-based morphometry using DARTEL. Eur. J. Radiol. 2012, 81, 1870–1876. [Google Scholar] [CrossRef]
- Mangia, S.; Kumar, A.F.; Moheet, A.; Roberts, R.J.; Eberly, L.; Seaquist, E.R.; Tkac, I. Neurochemical Profile of Patients with Type 1 Diabetes Measured by 1H-MRS at 4 T. Br. J. Pharmacol. 2013, 33, 754–759. [Google Scholar] [CrossRef] [Green Version]
- Lin, A.; Northam, E.A.; Rankins, D.; Werther, G.A.; Cameron, F.J. Neuropsychological profiles of young people with type 1 diabetes 12 yr after disease onset. Pediatr. Diabetes 2010, 11, 235–243. [Google Scholar] [CrossRef]
- van Duinkerken, E.; Ryan, C.M. Diabetes mellitus in the young and the old: Effects on cognitive functioning across the life span. Neurobiol. Dis. 2020, 134, 104608. [Google Scholar] [CrossRef]
- Marseglia, A.; Fratiglioni, L.; Laukka, E.J.; Santoni, G.; Pedersen, N.L.; Bäckman, L.; Xu, W. Early Cognitive Deficits in Type 2 Diabetes: A Population-Based Study. J. Alzheimer’s Dis. 2016, 53, 1069–1078. [Google Scholar] [CrossRef] [Green Version]
- Chatterjee, S.; Peters, S.; Woodward, M.; Arango, S.M.; Batty, G.; Beckett, N.; Beiser, A.; Borenstein, A.R.; Crane, P.K.; Haan, M.N.; et al. Type 2 Diabetes as a Risk Factor for Dementia in Women Compared with Men: A Pooled Analysis of 2.3 Million People Comprising More Than 100,000 Cases of Dementia. Diabetes Care 2015, 39, 300–307. [Google Scholar] [CrossRef] [PubMed] [Green Version]
- Smolina, K.; Wotton, C.; Goldacre, M.J. Risk of dementia in patients hospitalized with type 1 and type 2 diabetes in England, 1998–2011: A retrospective national record linkage cohort study. Diabetologia 2015, 58, 942–950. [Google Scholar] [CrossRef] [PubMed] [Green Version]
- You, Y.; Liu, Z.; Chen, Y.; Xu, Y.; Qin, J.; Guo, S.; Huang, J.; Tao, J. The prevalence of mild cognitive impairment in type 2 diabetes mellitus patients: A systematic review and meta-analysis. Acta Diabetol. 2021, 58, 671–685. [Google Scholar] [CrossRef] [PubMed]
- Assunção, N.; Sudo, F.K.; Drummond, C.; De Felice, F.G.; Mattos, P. Metabolic Syndrome and cognitive decline in the elderly: A systematic review. PLoS ONE 2018, 13, e0194990. [Google Scholar] [CrossRef] [PubMed]
- Gruetter, R.; Novotny, E.; Boulware, S.D.; Rothman, D.L.; Mason, G.F.; Shulman, G.; Shulman, R.G.; Tamborlane, W.V. Direct measurement of brain glucose concentrations in humans by 13C NMR spectroscopy. Proc. Natl. Acad. Sci. USA 1992, 89, 1109–1112. [Google Scholar] [CrossRef] [Green Version]
- Patching, S.G. Glucose Transporters at the Blood-Brain Barrier: Function, Regulation and Gateways for Drug Delivery. Mol. Neurobiol. 2017, 54, 1046–1077. [Google Scholar] [CrossRef]
- Pellerin, L.; Magistretti, P.J. Sweet Sixteen for ANLS. J. Cereb. Blood Flow Metab. 2012, 32, 1152–1166. [Google Scholar] [CrossRef] [PubMed]
- Dakic, T.; Jevdjovic, T.; Lakic, I.; Djurasevic, S.; Djordjevic, J.; Vujovic, P. Food for Thought: Short-Term Fasting Upregulates Glucose Transporters in Neurons and Endothelial Cells, But Not in Astrocytes. Neurochem. Res. 2019, 44, 388–399. [Google Scholar] [CrossRef]
- Ashrafi, G.; Wu, Z.; Farrell, R.; Ryan, T.A. GLUT4 Mobilization Supports Energetic Demands of Active Synapses. Neuron 2017, 93, 606–615.e3. [Google Scholar] [CrossRef]
- Yu, A.S.; Hirayama, B.A.; Timbol, G.; Liu, J.; Diez-Sampedro, A.; Kepe, V.; Satyamurthy, N.; Huang, S.-C.; Wright, E.M.; Barrio, J.R. Regional distribution of SGLT activity in rat brain in vivo. Am. J. Physiol. Physiol. 2013, 304, C240–C247. [Google Scholar] [CrossRef] [PubMed]
- Yamada, N.; Horikawa, Y.; Oda, N.; Iizuka, K.; Shihara, N.; Kishi, S.; Takeda, J. Genetic Variation in the Hypoxia-Inducible Factor-1α Gene Is Associated with Type 2 Diabetes in Japanese. J. Clin. Endocrinol. Metab. 2005, 90, 5841–5847. [Google Scholar] [CrossRef]
- Koepsell, H. Glucose transporters in brain in health and disease. Pflug. Arch. 2020, 472, 1299–1343. [Google Scholar] [CrossRef] [PubMed]
- Jais, A.; Solas, M.; Backes, H.; Chaurasia, B.; Kleinridders, A.; Theurich, S.; Mauer, J.; Steculorum, S.M.; Hampel, B.; Goldau, J.; et al. Myeloid-Cell-Derived VEGF Maintains Brain Glucose Uptake and Limits Cognitive Impairment in Obesity. Cell 2016, 166, 1338–1340. [Google Scholar] [CrossRef] [PubMed] [Green Version]
- Chobanyan-Jürgens, K.; Jordan, J. Autonomic nervous system activity and inflammation: Good ideas, good treatments, or both? Am. J. Physiol. Heart Circ. Physiol. 2015, 309, H1999–H2001. [Google Scholar] [CrossRef] [PubMed] [Green Version]
- Reno, C.M.; Puente, E.C.; Sheng, Z.; Daphna-Iken, D.; Bree, A.J.; Routh, V.H.; Kahn, B.B.; Fisher, S.J. Brain GLUT4 Knockout Mice Have Impaired Glucose Tolerance, Decreased Insulin Sensitivity, and Impaired Hypoglycemic Counterregulation. Diabetes 2016, 66, 587–597. [Google Scholar] [CrossRef] [PubMed] [Green Version]
- van de Ven, K.C.; van der Graaf, M.; Tack, C.J.; Heerschap, A.; de Galan, B.E. Steady-State Brain Glucose Concentrations During Hypoglycemia in Healthy Humans and Patients with Type 1 Diabetes. Diabetes 2012, 61, 1974–1977. [Google Scholar] [CrossRef] [PubMed] [Green Version]
- Wardzinski, E.K.; Kistenmacher, A.; Melchert, U.H.; Jauch-Chara, K.; Oltmanns, K.M. Impaired brain energy gain upon a glucose load in obesity. Metabolism 2018, 85, 90–96. [Google Scholar] [CrossRef] [PubMed]
- Hwang, J.J.; Jiang, L.; Hamza, M.; Rangel, E.S.; Dai, F.; Belfort-DeAguiar, R.; Parikh, L.; Koo, B.B.; Rothman, D.L.; Mason, G.; et al. Blunted rise in brain glucose levels during hyperglycemia in adults with obesity and T2DM. JCI Insight 2017, 2, 95913. [Google Scholar] [CrossRef] [Green Version]
- Alonge, K.M.; D’Alessio, D.A.; Schwartz, M.W. Brain control of blood glucose levels: Implications for the pathogenesis of type 2 diabetes. Diabetologia 2021, 64, 5–14. [Google Scholar] [CrossRef]
- Schwartz, M.W.; Seeley, R.; Tschöp, M.H.; Woods, S.C.; Morton, G.J.; Myers, M.G.; D’Alessio, D. Cooperation between brain and islet in glucose homeostasis and diabetes. Nature 2013, 503, 59–66. [Google Scholar] [CrossRef]
- Guillod-Maximin, E.; Lorsignol, A.; Alquier, T.; Penicaud, L. Acute Intracarotid Glucose Injection towards the Brain Induces Specific c-fos Activation in Hypothalamic Nuclei: Involvement of Astrocytes in Cerebral Glucose-Sensing in Rats. J. Neuroendocrinol. 2004, 16, 464–471. [Google Scholar] [CrossRef]
- Osundiji, M.A.; Lam, D.D.; Shaw, J.; Yueh, C.-Y.; Markkula, S.P.; Hurst, P.; Colliva, C.; Roda, A.; Heisler, L.K.; Evans, M.L. Brain Glucose Sensors Play a Significant Role in the Regulation of Pancreatic Glucose-Stimulated Insulin Secretion. Diabetes 2012, 61, 321–328. [Google Scholar] [CrossRef] [Green Version]
- Obici, S.; Feng, Z.; Karkanias, G.; Baskin, D.G.; Rossetti, L. Decreasing hypothalamic insulin receptors causes hyperphagia and insulin resistance in rats. Nat. Neurosci. 2002, 5, 566–572. [Google Scholar] [CrossRef] [PubMed]
- Obici, S.; Zhang, B.B.; Karkanias, G.; Rossetti, L. Hypothalamic insulin signaling is required for inhibition of glucose production. Nat. Med. 2002, 8, 1376–1382. [Google Scholar] [CrossRef]
- Filippi, B.M.; Yang, C.S.; Tang, C.; Lam, T.K. Insulin Activates Erk1/2 Signaling in the Dorsal Vagal Complex to Inhibit Glucose Production. Cell Metab. 2012, 16, 500–510. [Google Scholar] [CrossRef] [Green Version]
- Lu, M.; Wan, M.; Leavens, K.F.; Chu, Q.; Monks, B.R.; Fernandez, S.; Ahima, R.S.; Ueki, K.; Kahn, C.R.; Birnbaum, M.J. Insulin regulates liver metabolism in vivo in the absence of hepatic Akt and Foxo1. Nat. Med. 2012, 18, 388–395. [Google Scholar] [CrossRef]
- Morton, G.J.; Muta, K.; Kaiyala, K.J.; Rojas, J.M.; Scarlett, J.M.; Matsen, M.E.; Nelson, J.T.; Acharya, N.K.; Piccinini, F.; Stefanovski, D.; et al. Evidence That the Sympathetic Nervous System Elicits Rapid, Coordinated, and Reciprocal Adjustments of Insulin Secretion and Insulin Sensitivity During Cold Exposure. Diabetes 2017, 66, 823–834. [Google Scholar] [CrossRef] [PubMed] [Green Version]
- D’Souza, A.M.; Neumann, U.H.; Glavas, M.M.; Kieffer, T.J. The glucoregulatory actions of leptin. Mol. Metab. 2017, 6, 1052–1065. [Google Scholar] [CrossRef]
- Oral, E.; Simha, V.; Ruiz, E.; Andewelt, A.; Premkumar, A.; Snell, P.; Wagner, A.J.; DePaoli, A.M.; Reitman, M.; Taylor, S.I.; et al. Leptin-Replacement Therapy for Lipodystrophy. N. Engl. J. Med. 2002, 346, 570–578. [Google Scholar] [CrossRef]
- Yu, X.; Park, B.-H.; Wang, M.-Y.; Wang, Z.V.; Unger, R.H. Making insulin-deficient type 1 diabetic rodents thrive without insulin. Proc. Natl. Acad. Sci. USA 2008, 105, 14070–14075. [Google Scholar] [CrossRef] [PubMed] [Green Version]
- German, J.P.; Thaler, J.P.; Wisse, B.E.; Oh-I, S.; Sarruf, D.A.; Matsen, M.E.; Fischer, J.D.; Taborsky, G.J.; Schwartz, M.W.; Morton, G.J. Leptin Activates a Novel CNS Mechanism for Insulin-Independent Normalization of Severe Diabetic Hyperglycemia. Endocrinology 2010, 152, 394–404. [Google Scholar] [CrossRef] [PubMed]
- Carmo, J.M.D.; Silva, A.; Gava, F.N.; Moak, S.P.; Dai, X.; Hall, J. Impact of leptin deficiency compared with neuronal-specific leptin receptor deletion on cardiometabolic regulation. Am. J. Physiol. Regul. Integr. Comp. Physiol. 2019, 317, R552–R562. [Google Scholar] [CrossRef] [PubMed]
- Sivitz, W.; Walsh, S.; Morgan, D.; Donohoue, P.; Haynes, W.; Leibel, R.L. Plasma leptin in diabetic and insulin-treated diabetic and normal rats. Metabolism 1998, 47, 584–591. [Google Scholar] [CrossRef]
- Pan, W.W.; Myers, M.G., Jr. Leptin and the maintenance of elevated body weight. Nat. Rev. Neurosci. 2018, 19, 95–105. [Google Scholar] [CrossRef]
- Carmo, J.M.D.; Da Silva, A.A.; Ebaady, S.E.; Sessums, P.O.; Abraham, R.S.; Elmquist, J.K.; Lowell, B.B.; Hall, J.E. Shp2 signaling in POMC neurons is important for leptin’s actions on blood pressure, energy balance, and glucose regulation. Am. J. Physiol. Regul. Integr. Comp. Physiol. 2014, 307, R1438–R1447. [Google Scholar] [CrossRef] [Green Version]
- Tooke, B.P.; Yu, H.; Adams, J.M.; Jones, G.L.; Sutton-Kennedy, T.; Mundada, L.; Qi, N.R.; Low, M.J.; Chhabra, K.H. Hypothalamic POMC or MC4R deficiency impairs counterregulatory responses to hypoglycemia in mice. Mol. Metab. 2019, 20, 194–204. [Google Scholar] [CrossRef] [PubMed]
- German, J.; Kim, F.; Schwartz, G.J.; Havel, P.J.; Rhodes, C.J.; Schwartz, M.W.; Morton, G.J. Hypothalamic Leptin Signaling Regulates Hepatic Insulin Sensitivity via a Neurocircuit Involving the Vagus Nerve. Endocrinology 2009, 150, 4502–4511. [Google Scholar] [CrossRef] [Green Version]
- Silva, A.; Hall, J.; Carmo, J.M.D. Leptin reverses hyperglycemia and hyperphagia in insulin deficient diabetic rats by pituitary-independent central nervous system actions. PLoS ONE 2017, 12, e0184805. [Google Scholar] [CrossRef]
- Bookout, A.L.; De Groot, M.H.M.; Owen, B.; Lee, S.; Gautron, L.; Lawrence, H.L.; Ding, X.; Elmquist, J.K.; Takahashi, J.; Mangelsdorf, D.; et al. FGF21 regulates metabolism and circadian behavior by acting on the nervous system. Nat. Med. 2013, 19, 1147–1152. [Google Scholar] [CrossRef]
- Hsuchou, H.; Pan, W.; Kastin, A.J. Fibroblast growth factor 19 entry into brain. Fluids Barriers CNS 2013, 10, 32. [Google Scholar] [CrossRef] [PubMed] [Green Version]
- Perry, R.J.; Lee, S.; Ma, L.; Zhang, D.; Schlessinger, J.; Shulman, G.I. FGF1 and FGF19 reverse diabetes by suppression of the hypothalamic–pituitary–adrenal axis. Nat. Commun. 2015, 6, 6980. [Google Scholar] [CrossRef] [PubMed] [Green Version]
- Scarlett, J.M.; Rojas, J.M.; Matsen, M.E.; Kaiyala, K.J.; Stefanovski, D.; Bergman, R.N.; Nguyen, H.T.; Dorfman, M.D.; Lantier, L.; Wasserman, D.H.; et al. Central injection of fibroblast growth factor 1 induces sustained remission of diabetic hyperglycemia in rodents. Nat. Med. 2016, 22, 800–806. [Google Scholar] [CrossRef] [Green Version]
- Kim, K.H.; Jeong, Y.T.; Kim, S.H.; Jung, H.S.; Park, K.S.; Lee, H.-Y.; Lee, M.-S. Metformin-induced inhibition of the mitochondrial respiratory chain increases FGF21 expression via ATF4 activation. Biochem. Biophys. Res. Commun. 2013, 440, 76–81. [Google Scholar] [CrossRef]
- Deem, J.D.; Muta, K.; Scarlett, J.M.; Morton, G.J.; Schwartz, M.W. How Should We Think About the Role of the Brain in Glucose Homeostasis and Diabetes? Diabetes 2017, 66, 1758–1765. [Google Scholar] [CrossRef] [Green Version]
- Banks, W.A. The source of cerebral insulin. Eur. J. Pharmacol. 2004, 490, 5–12. [Google Scholar] [CrossRef]
- Schulingkamp, R.; Pagano, T.; Hung, D.; Raffa, R. Insulin receptors and insulin action in the brain: Review and clinical implications. Neurosci. Biobehav. Rev. 2000, 24, 855–872. [Google Scholar] [CrossRef]
- Belfiore, A.; Malaguarnera, R.; Vella, V.; Lawrence, M.; Sciacca, L.; Frasca, F.; Morrione, A.; Vigneri, R. Insulin Receptor Isoforms in Physiology and Disease: An Updated View. Endocr. Rev. 2017, 38, 379–431. [Google Scholar] [CrossRef]
- Martinez-Rachadell, L.; Aguilera, A.; Perez-Domper, P.; Pignatelli, J.; Fernandez, A.; Torres-Aleman, I. Cell-specific expression of insulin/insulin-like growth factor-I receptor hybrids in the mouse brain. Growth Horm. IGF Res. 2019, 45, 25–30. [Google Scholar] [CrossRef] [PubMed]
- Shemesh, E.; Rudich, A.; Harman-Boehm, I.; Cukierman-Yaffe, T. Effect of Intranasal Insulin on Cognitive Function: A Systematic Review. J. Clin. Endocrinol. Metab. 2012, 97, 366–376. [Google Scholar] [CrossRef] [PubMed] [Green Version]
- García-Cáceres, C.; Quarta, C.; Varela, L.; Gao, Y.; Gruber, T.; Legutko, B.; Jastroch, M.; Johansson, P.; Ninkovic, J.; Yi, C.-X.; et al. Astrocytic Insulin Signaling Couples Brain Glucose Uptake with Nutrient Availability. Cell 2016, 166, 867–880. [Google Scholar] [CrossRef] [Green Version]
- Wei, Y.; Gokhale, R.H.; Sonnenschein, A.; Montgomery, K.M.; Ingersoll, A.; Arnosti, D.N. Complex cis-regulatory landscape of the insulin receptor gene underlies the broad expression of a central signaling regulator. Development 2016, 143, 3591–3603. [Google Scholar] [CrossRef] [Green Version]
- Dumortier, O.; Fabris, G.; Pisani, D.F.; Casamento, V.; Gautier, N.; Hinault, C.; Lebrun, P.; Duranton, C.; Tauc, M.; Dalle, S.; et al. microRNA-375 regulates glucose metabolism-related signaling for insulin secretion. J. Endocrinol. 2020, 244, 189–200. [Google Scholar] [CrossRef]
- Kara, I.; Poggi, M.; Bonardo, B.; Govers, R.; Landrier, J.F.; Tian, S.; Leibiger, I.; Day, R.; Creemers, J.W.; Peiretti, F. The paired basic amino acid-cleaving enzyme 4 (PACE4) is involved in the maturation of insulin receptor isoform B: An opportunity to reduce the specific insulin receptor-dependent effects of insulin-like growth factor 2 (IGF2). J. Biol. Chem. 2015, 290, 2812–2821. [Google Scholar] [CrossRef] [Green Version]
- Zhou, L.; Zhang, J.; Fang, Q.; Liu, M.; Liu, X.; Jia, W.; Dong, L.Q.; Liu, F. Autophagy-Mediated Insulin Receptor Down-Regulation Contributes to Endoplasmic Reticulum Stress-Induced Insulin Resistance. Mol. Pharmacol. 2009, 76, 596–603. [Google Scholar] [CrossRef] [Green Version]
- Nagarajan, A.; Petersen, M.; Nasiri, A.R.; Butrico, G.; Fung, A.; Ruan, H.-B.; Kursawe, R.; Caprio, S.; Thibodeau, J.; Bourgeois-Daigneault, M.-C.; et al. MARCH1 regulates insulin sensitivity by controlling cell surface insulin receptor levels. Nat. Commun. 2016, 7, 12639. [Google Scholar] [CrossRef]
- Amessou, M.; Tahiri, K.; Chauvet, G.; Desbuquois, B. Age-related changes in insulin receptor mRNA and protein expression in genetically obese Zucker rats. Diabetes Metab. 2010, 36, 120–128. [Google Scholar] [CrossRef] [PubMed]
- Vella, V.; Milluzzo, A.; Scalisi, N.M.; Vigneri, P.; Sciacca, L. Insulin Receptor Isoforms in Cancer. Int. J. Mol. Sci. 2018, 19, 3615. [Google Scholar] [CrossRef] [PubMed] [Green Version]
- Spinelli, M.; Fusco, S.; Grassi, C. Brain Insulin Resistance and Hippocampal Plasticity: Mechanisms and Biomarkers of Cognitive Decline. Front. Neurosci. 2019, 13, 788. [Google Scholar] [CrossRef] [Green Version]
- Banks, W.A.; Jaspan, J.B.; Kastin, A.J. Effect of Diabetes Mellitus on the Permeability of the Blood–Brain Barrier to Insulin. Peptides 1997, 18, 1577–1584. [Google Scholar] [CrossRef]
- Alemzadeh, R.; Holshouser, S. Effect of Diazoxide on Brain Capillary Insulin Receptor Binding and Food Intake in Hyperphagic Obese Zucker Rats *. Endocrinology 1999, 140, 3197–3202. [Google Scholar] [CrossRef]
- Kondo, T.; Hafezi-Moghadam, A.; Thomas, K.; Wagner, D.D.; Kahn, C. Mice lacking insulin or insulin-like growth factor 1 receptors in vascular endothelial cells maintain normal blood–brain barrier. Biochem. Biophys. Res. Commun. 2004, 317, 315–320. [Google Scholar] [CrossRef]
- Konishi, M.; Sakaguchi, M.; Lockhart, S.M.; Cai, W.; Li, M.E.; Homan, E.P.; Rask-Madsen, C.; Kahn, C.R. Endothelial insulin receptors differentially control insulin signaling kinetics in peripheral tissues and brain of mice. Proc. Natl. Acad. Sci. USA 2017, 114, E8478–E8487. [Google Scholar] [CrossRef] [PubMed] [Green Version]
- Shaughness, M.; Acs, D.; Brabazon, F.; Hockenbury, N.; Byrnes, K.R. Role of Insulin in Neurotrauma and Neurodegeneration: A Review. Front. Neurosci. 2020, 14, 940. [Google Scholar] [CrossRef]
- Schmid, V.; Kullmann, S.; Gfrörer, W.; Hund, V.; Hallschmid, M.; Lipp, H.; Häring, H.; Preissl, H.; Fritsche, A.; Heni, M. Safety of intranasal human insulin: A. review. Diabetes Obes. Metab. 2018, 20, 1563–1577. [Google Scholar] [CrossRef]
- Erichsen, J.M.; Calva, C.B.; Reagan, L.P.; Fadel, J.R. Intranasal insulin and orexins to treat age-related cognitive decline. Physiol. Behav. 2021, 234, 113370. [Google Scholar] [CrossRef] [PubMed]
- Urayama, A.; Banks, W.A. Starvation and Triglycerides Reverse the Obesity-Induced Impairment of Insulin Transport at the Blood-Brain Barrier. Endocrinology 2008, 149, 3592–3597. [Google Scholar] [CrossRef]
- May, A.A.; Liu, M.; Woods, S.C.; Begg, D.P. CCK increases the transport of insulin into the brain. Physiol. Behav. 2016, 165, 392–397. [Google Scholar] [CrossRef] [PubMed] [Green Version]
- Gray, S.; Aylor, K.W.; Barrett, E.J. Unravelling the regulation of insulin transport across the brain endothelial cell. Diabetologia 2017, 60, 1512–1521. [Google Scholar] [CrossRef] [PubMed] [Green Version]
- Rhea, E.M.; Rask-Madsen, C.; Banks, W.A. Insulin transport across the blood-brain barrier can occur independently of the insulin receptor. J. Physiol. 2018, 596, 4753–4765. [Google Scholar] [CrossRef] [PubMed]
- Hersom, M.; Helms, H.C.; Schmalz, C.; Pedersen, T.Å.; Buckley, S.T.; Brodin, B. The insulin receptor is expressed and functional in cultured blood-brain barrier endothelial cells but does not mediate insulin entry from blood to brain. Am. J. Physiol. Endocrinol. Metab. 2018, 315, E531–E542. [Google Scholar] [CrossRef]
- Acharya, N.K.; Levin, E.C.; Clifford, P.M.; Han, M.; Tourtellotte, R.; Chamberlain, D.; Pollaro, M.; Coretti, N.J.; Kosciuk, M.C.; Nagele, E.P.; et al. Diabetes and Hypercholesterolemia Increase Blood-Brain Barrier Permeability and Brain Amyloid Deposition: Beneficial Effects of the LpPLA2 Inhibitor Darapladib. J. Alzheimer’s Dis. 2013, 35, 179–198. [Google Scholar] [CrossRef] [Green Version]
- Sun, Y.-N.; Liu, L.-B.; Xue, Y.-X.; Wang, P. Effects of insulin combined with idebenone on blood-brain barrier permeability in diabetic rats. J. Neurosci. Res. 2015, 93, 666–677. [Google Scholar] [CrossRef]
- Kuai, Z.; Xu, Y.; Zhao, Q.; Liu, J.; Guan, S.; Qiao, Y.; Gong, X.; Nie, J.; Li, P.; Liu, D.; et al. Effects of insulin on transcriptional response and permeability in an in vitro model of human blood-brain barrier. J. Cell. Biochem. 2018, 119, 5657–5664. [Google Scholar] [CrossRef]
- Talbot, K.; Wang, H.-Y.; Kazi, H.; Han, L.-Y.; Bakshi, K.P.; Stucky, A.; Fuino, R.L.; Kawaguchi, K.R.; Samoyedny, A.J.; Wilson, R.S.; et al. Demonstrated brain insulin resistance in Alzheimer’s disease patients is associated with IGF-1 resistance, IRS-1 dysregulation, and cognitive decline. J. Clin. Investig. 2012, 122, 1316–1338. [Google Scholar] [CrossRef] [Green Version]
- Duarte, A.I.; Moreira, P.I.; Oliveira, C.R. Insulin in Central Nervous System: More than Just a Peripheral Hormone. J. Aging Res. 2012, 2012, 384017. [Google Scholar] [CrossRef] [PubMed] [Green Version]
- Heni, M.; Schöpfer, P.; Peter, A.; Sartorius, T.; Fritsche, A.; Synofzik, M.; Häring, H.-U.; Maetzler, W.; Hennige, A.M. Evidence for altered transport of insulin across the blood–brain barrier in insulin-resistant humans. Acta Diabetol. 2014, 51, 679–681. [Google Scholar] [CrossRef]
- Sartorius, T.; Peter, A.; Heni, M.; Maetzler, W.; Fritsche, A.; Häring, H.-U.; Hennige, A.M. The Brain Response to Peripheral Insulin Declines with Age: A Contribution of the Blood-Brain Barrier? PLoS ONE 2015, 10, e0126804. [Google Scholar] [CrossRef] [Green Version]
- Cai, W.; Xue, C.; Sakaguchi, M.; Konishi, M.; Shirazian, A.; Ferris, H.A.; Li, M.E.; Yu, R.; Kleinridders, A.; Pothos, E.N.; et al. Insulin regulates astrocyte gliotransmission and modulates behavior. J. Clin. Investig. 2018, 128, 2914–2926. [Google Scholar] [CrossRef]
- Ruegsegger, G.N.; Manjunatha, S.; Summer, P.; Gopala, S.; Zabeilski, P.; Dasari, S.; Vanderboom, P.M.; Lanza, I.R.; Klaus, K.A.; Nair, K.S. Insulin deficiency and intranasal insulin alter brain mitochondrial function: A potential factor for dementia in diabetes. FASEB J. 2019, 33, 4458–4472. [Google Scholar] [CrossRef] [PubMed]
- Edwards, J.L.; Quattrini, A.; Lentz, S.I.; Figueroa-Romero, C.; Cerri, F.; Backus, C.; Hong, Y.; Feldman, E.L. Diabetes regulates mitochondrial biogenesis and fission in mouse neurons. Diabetologia 2010, 53, 160–169. [Google Scholar] [CrossRef] [Green Version]
- Sripetchwandee, J.; Chattipakorn, N.; Chattipakorn, S.C. Links between Obesity-Induced Brain Insulin Resistance, Brain Mitochondrial Dysfunction, and Dementia. Front. Endocrinol. 2018, 9, 496. [Google Scholar] [CrossRef]
- Persiyantseva, N.A.; Storozhevykh, T.P.; Senilova, Y.E.; Gorbacheva, L.R.; Pinelis, V.G.; Pomytkin, I.A. Mitochondrial H2O2 as an enable signal for triggering autophosphorylation of insulin receptor in neurons. J. Mol. Signal. 2013, 8, 11. [Google Scholar] [CrossRef] [PubMed] [Green Version]
- Bolaños, J.P.; Almeida, A.; Moncada, S. Glycolysis: A bioenergetic or a survival pathway? Trends Biochem. Sci. 2010, 35, 145–149. [Google Scholar] [CrossRef]
- Chomova, M.; Zitnanova, I. Look into brain energy crisis and membrane pathophysiology in ischemia and reperfusion. Stress 2016, 19, 341–348. [Google Scholar] [CrossRef]
- Kamboj, S.S.; Sandhir, R. Protective effect of N-acetylcysteine supplementation on mitochondrial oxidative stress and mitochondrial enzymes in cerebral cortex of streptozotocin-treated diabetic rats. Mitochondrion 2011, 11, 214–222. [Google Scholar] [CrossRef] [PubMed]
- Chomova, M.; Balazova, M.; Muchova, J. Diabetes-induced abnormalities of mitochondrial function in rat brain cortex: The effect of n-3 fatty acid diet. Mol. Cell. Biochem. 2017, 435, 109–131. [Google Scholar] [CrossRef] [PubMed]
- Poulsen, H.E.; Weimann, A.; Henriksen, T.; Kjær, L.K.; Larsen, E.L.; Carlsson, E.R.; Christensen, C.K.; Brandslund, I.; Fenger, M. Oxidatively generated modifications to nucleic acids in vivo: Measurement in urine and plasma. Free Radic. Biol. Med. 2019, 145, 336–341. [Google Scholar] [CrossRef]
- Carvalho, C.; Santos, M.S.; Oliveira, C.; Moreira, P.I. Alzheimer’s disease and type 2 diabetes-related alterations in brain mitochondria, autophagy and synaptic markers. Biochim. Biophys. Acta. 2015, 1852, 1665–1675. [Google Scholar] [CrossRef] [Green Version]
- Chowdhury, S.R.; Saleh, A.; Akude, E.; Smith, D.R.; Morrow, D.; Tessler, L.; Calcutt, N.A.; Fernyhough, P. Ciliary Neurotrophic Factor Reverses Aberrant Mitochondrial Bioenergetics Through the JAK/STAT Pathway in Cultured Sensory Neurons Derived from Streptozotocin-Induced Diabetic Rodents. Cell. Mol. Neurobiol. 2014, 34, 643–649. [Google Scholar] [CrossRef] [PubMed]
- Lu, H.; Koshkin, V.; Allister, E.M.; Gyulkhandanyan, A.V.; Wheeler, M.B. Molecular and Metabolic Evidence for Mitochondrial Defects Associated With β-Cell Dysfunction in a Mouse Model of Type 2 Diabetes. Diabetes 2009, 59, 448–459. [Google Scholar] [CrossRef] [PubMed] [Green Version]
- Gerencser, A.A. Bioenergetic Analysis of Single Pancreatic β-Cells Indicates an Impaired Metabolic Signature in Type 2 Diabetic Subjects. Endocrinology 2015, 156, 3496–3503. [Google Scholar] [CrossRef] [Green Version]
- Siewiera, K.; Kassassir, H.; Talar, M.; Wieteska, L.; Watala, C. Higher mitochondrial potential and elevated mitochondrial respiration are associated with excessive activation of blood platelets in diabetic rats. Life Sci. 2016, 148, 293–304. [Google Scholar] [CrossRef]
- Cheng, G.; Zielonka, M.; Dranka, B.; Kumar, S.N.; Myers, C.R.; Bennett, B.; Garces, A.M.; Machado, L.G.D.D.; Thiebaut, D.; Ouari, O.; et al. Detection of mitochondria-generated reactive oxygen species in cells using multiple probes and methods: Potentials, pitfalls, and the future. J. Biol. Chem. 2018, 293, 10363–10380. [Google Scholar] [CrossRef] [Green Version]
- Marques-Aleixo, I.; Santos-Alves, E.; Balça, M.; Rizo-Roca, D.; Moreira, P.; Oliveira, P.; Magalhães, J.; Ascensao, A. Physical exercise improves brain cortex and cerebellum mitochondrial bioenergetics and alters apoptotic, dynamic and auto(mito)phagy markers. Neuroscience 2015, 301, 480–495. [Google Scholar] [CrossRef] [PubMed]
- Wang, D.; Zhai, X.; Chen, P.; Yang, M.; Zhao, J.; Dong, J.; Liu, H. Hippocampal UCP2 is essential for cognition and resistance to anxiety but not required for the benefits of exercise. Neuroscience 2014, 277, 36–44. [Google Scholar] [CrossRef] [PubMed]
- Bristot, V.J.D.O.; Alves, A.C.D.B.; Cardoso, L.R.; Scheffer, D.D.L.; Aguiar, A.S.J. The Role of PGC-1α/UCP2 Signaling in the Beneficial Effects of Physical Exercise on the Brain. Front. Neurosci. 2019, 13, 292. [Google Scholar] [CrossRef] [Green Version]
- Cadenas, S. Mitochondrial uncoupling, ROS generation and cardioprotection. Biochim. Biophys. Acta Bioenerg. 2018, 1859, 940–950. [Google Scholar] [CrossRef] [PubMed]
- Barbieri, M.; Boccardi, V.; Esposito, A.; Papa, M.; Vestini, F.; Rizzo, M.R.; Paolisso, G. A/ASP/VAL allele combination of IGF1R, IRS2, and UCP2 genes is associated with better metabolic profile, preserved energy expenditure parameters, and low mortality rate in longevity. AGE 2011, 34, 235–245. [Google Scholar] [CrossRef] [Green Version]
- Abdul-Rahman, O.; Sasvari-Szekely, M.; Ver, A.; Rosta, K.; Szasz, B.K.; Kereszturi, E.; Keszler, G. Altered gene expression profiles in the hippocampus and prefrontal cortex of type 2 diabetic rats. BMC Genom. 2012, 13, 81. [Google Scholar] [CrossRef] [PubMed] [Green Version]
- Cardoso, S.; Seiça, R.M.; Moreira, P.I. Uncoupling Protein 2 Inhibition Exacerbates Glucose Fluctuation-Mediated Neuronal Effects. Neurotox. Res. 2017, 33, 388–401. [Google Scholar] [CrossRef]
- Costa-Mattioli, M.; Walter, P. The integrated stress response: From mechanism to disease. Science 2020, 368, 5314. [Google Scholar] [CrossRef]
- Forsström, S.; Jackson, C.B.; Carroll, C.; Kuronen, M.; Pirinen, E.; Pradhan, S.; Marmyleva, A.; Auranen, M.; Kleine, I.-M.; Khan, N.A.; et al. Fibroblast Growth Factor 21 Drives Dynamics of Local and Systemic Stress Responses in Mitochondrial Myopathy with mtDNA Deletions. Cell Metab. 2019, 30, 1040–1054.e7. [Google Scholar] [CrossRef]
- Basavarajappa, B.; Subbanna, S. Histone Methylation Regulation in Neurodegenerative Disorders. Int. J. Mol. Sci. 2021, 22, 4654. [Google Scholar] [CrossRef]
- Muñoz-Carvajal, F.; Sanhueza, M. The Mitochondrial Unfolded Protein Response: A Hinge between Healthy and Pathological Aging. Front. Aging Neurosci. 2020, 12, 300. [Google Scholar] [CrossRef]
- Ren, B.; Zhang, Y.; Zhang, M.; Liu, Y.; Zhang, D.; Gong, X.; Feng, Z.; Tang, J.; Chang, Y.; Zheng, J. Fundamentals of cross-seeding of amyloid proteins: An introduction. J. Mater. Chem. B 2019, 7, 7267–7282. [Google Scholar] [CrossRef]
- Hooper, P.L.; Balogh, G.; Rivas, E.; Kavanagh, K.; Vigh, L. The importance of the cellular stress response in the pathogenesis and treatment of type 2 diabetes. Cell Stress Chaperones 2014, 19, 447–464. [Google Scholar] [CrossRef] [Green Version]
- Kleinridders, A.; Lauritzen, H.P.; Ussar, S.; Christensen, J.H.; Mori, M.; Bross, P.; Kahn, C.R. Leptin regulation of Hsp60 impacts hypothalamic insulin signaling. J. Clin. Investig. 2013, 123, 4667–4680. [Google Scholar] [CrossRef] [Green Version]
- Wardelmann, K.; Blümel, S.; Rath, M.; Alfine, E.; Chudoba, C.; Schell, M.; Cai, W.; Hauffe, R.; Warnke, K.; Flore, T.; et al. Insulin action in the brain regulates mitochondrial stress responses and reduces diet-induced weight gain. Mol. Metab. 2019, 21, 68–81. [Google Scholar] [CrossRef]
- Wardelmann, K.; Rath, M.; Castro, J.; Blümel, S.; Schell, M.; Hauffe, R.; Schumacher, F.; Flore, T.; Ritter, K.; Wernitz, A.; et al. Central Acting Hsp10 Regulates Mitochondrial Function, Fatty Acid Metabolism, and Insulin Sensitivity in the Hypothalamus. Antioxidants 2021, 10, 711. [Google Scholar] [CrossRef] [PubMed]
- Chudoba, C.; Wardelmann, K.; Kleinridders, A. Molecular effects of dietary fatty acids on brain insulin action and mitochondrial function. Biol. Chem. 2019, 400, 991–1003. [Google Scholar] [CrossRef] [PubMed]
- Melo, H.M.; Silva, G.D.S.S.D.; Sant’Ana, M.R.; Teixeira, C.V.L.; Clarke, J.R.; Coreixas, V.S.M.; de Melo, B.C.; Fortuna, J.T.; Forny-Germano, L.; Ledo, J.H.; et al. Palmitate Is Increased in the Cerebrospinal Fluid of Humans with Obesity and Induces Memory Impairment in Mice via Pro-inflammatory TNF-α. Cell Rep. 2020, 30, 2180–2194.e8. [Google Scholar] [CrossRef] [PubMed] [Green Version]
- Rosenberger, K.; Dembny, P.; Derkow, K.; Engel, O.; Krüger, C.; Wolf, S.A.; Kettenmann, H.; Schott, E.; Meisel, A.; Lehnardt, S. Intrathecal heat shock protein 60 mediates neurodegeneration and demyelination in the CNS through a TLR4- and MyD88-dependent pathway. Mol. Neurodegener. 2015, 10, 5. [Google Scholar] [CrossRef] [Green Version]
- Juwono, J.; Martinus, R.D. Does Hsp60 Provide a Link between Mitochondrial Stress and Inflammation in Diabetes Mellitus? J. Diabetes Res. 2016, 2016, 8017571. [Google Scholar] [CrossRef] [Green Version]
- Taha, E.A.; Ono, K.; Eguchi, T. Roles of Extracellular HSPs as Biomarkers in Immune Surveillance and Immune Evasion. Int. J. Mol. Sci. 2019, 20, 4588. [Google Scholar] [CrossRef] [Green Version]
- Liyanagamage, D.S.N.K.; Martinus, R.D. Role of Mitochondrial Stress Protein HSP60 in Diabetes-Induced Neuroinflammation. Mediat. Inflamm. 2020, 2020, 8073516. [Google Scholar] [CrossRef]
- Parodi-Rullan, R.; Chapa-Dubocq, X.R.; Javadov, S. Acetylation of Mitochondrial Proteins in the Heart: The Role of SIRT3. Front. Physiol. 2018, 9, 1094. [Google Scholar] [CrossRef] [Green Version]
- Tyagi, A.; Nguyen, C.U.; Chong, T.; Michel, C.R.; Fritz, K.S.; Reisdorph, N.; Knaub, L.; Reusch, J.E.B.; Pugazhenthi, S. SIRT3 deficiency-induced mitochondrial dysfunction and inflammasome formation in the brain. Sci. Rep. 2018, 8, 17547. [Google Scholar] [CrossRef] [PubMed] [Green Version]
- Kristian, T.; Karimi, A.J.; Fearnow, A.; Waddell, J.; McKenna, M.C. Perturbed Brain Glucose Metabolism Caused by Absent SIRT3 Activity. Cells 2021, 10, 2348. [Google Scholar] [CrossRef]
- Tyagi, A.; Mirita, C.; Taher, N.; Shah, I.; Moeller, E.; Tyagi, A.; Chong, T.; Pugazhenthi, S. Metabolic syndrome exacerbates amyloid pathology in a comorbid Alzheimer’s mouse model. Biochim. Biophys. Acta Mol. Basis Dis. 2020, 1866, 165849. [Google Scholar] [CrossRef]
- Haigh, J.L.; New, L.E.; Filippi, B.M. Mitochondrial Dynamics in the Brain Are Associated with Feeding, Glucose Homeostasis, and Whole-Body Metabolism. Front. Endocrinol. 2020, 11, 580879. [Google Scholar] [CrossRef] [PubMed]
- Ramírez, S.; Gómez-Valadés, A.G.; Schneeberger, M.; Varela, L.; Haddad-Tóvolli, R.; Altirriba, J.; Noguera, E.; Drougard, A.; Flores, S.R.; Imbernón, M.; et al. Mitochondrial Dynamics Mediated by Mitofusin 1 Is Required for POMC Neuron Glucose-Sensing and Insulin Release Control. Cell Metab. 2017, 25, 1390–1399.e6. [Google Scholar] [CrossRef] [PubMed] [Green Version]
- Huang, S.; Wang, Y.; Gan, X.; Fang, D.; Zhong, C.; Wu, L.; Hu, G.; Sosunov, A.A.; McKhann, G.M.; Yu, H.; et al. Drp1-Mediated Mitochondrial Abnormalities Link to Synaptic Injury in Diabetes Model. Diabetes 2014, 64, 1728–1742. [Google Scholar] [CrossRef] [PubMed] [Green Version]
- Silzer, T.; Barber, R.; Sun, J.; Pathak, G.; Johnson, L.; O’Bryant, S.; Phillips, N. Circulating mitochondrial DNA: New indices of type 2 diabetes-related cognitive impairment in Mexican Americans. PLoS ONE 2019, 14, e0213527. [Google Scholar] [CrossRef]
- Agrawal, R.; Zhuang, Y.; Cummings, B.P.; Stanhope, K.L.; Graham, J.; Havel, P.; Gomez-Pinilla, F. Deterioration of plasticity and metabolic homeostasis in the brain of the UCD-T2DM rat model of naturally occurring type-2 diabetes. Biochim. Biophys. Acta Mol. Basis Dis. 2014, 1842, 1313–1323. [Google Scholar] [CrossRef] [Green Version]
Publisher’s Note: MDPI stays neutral with regard to jurisdictional claims in published maps and institutional affiliations. |
© 2022 by the author. Licensee MDPI, Basel, Switzerland. This article is an open access article distributed under the terms and conditions of the Creative Commons Attribution (CC BY) license (https://creativecommons.org/licenses/by/4.0/).
Share and Cite
Chomova, M. Toward the Decipherment of Molecular Interactions in the Diabetic Brain. Biomedicines 2022, 10, 115. https://doi.org/10.3390/biomedicines10010115
Chomova M. Toward the Decipherment of Molecular Interactions in the Diabetic Brain. Biomedicines. 2022; 10(1):115. https://doi.org/10.3390/biomedicines10010115
Chicago/Turabian StyleChomova, Maria. 2022. "Toward the Decipherment of Molecular Interactions in the Diabetic Brain" Biomedicines 10, no. 1: 115. https://doi.org/10.3390/biomedicines10010115
APA StyleChomova, M. (2022). Toward the Decipherment of Molecular Interactions in the Diabetic Brain. Biomedicines, 10(1), 115. https://doi.org/10.3390/biomedicines10010115