1. Introduction
The overheating of electric cables is a significant contributor to fire risk, especially in factories and power plants. However, a fire alarm system is usually not activated until after the fire has started. For example, a smoke detector based on photoelectric sensors requires a specific concentration of smoke to be activated. When the alarm is activated, fires and short circuiting may have caused irreversible damage. In that case, although the fire may be controlled in time, the loss could be significant. Therefore, it is challenging to provide fire risk information advice before the abnormality occurs.
Smoke is often accompanied by a burnt smell at the early stage of a fire before it becomes an open flame. Smell carries much information, the same as other factors perceived by the senses. With the development of AI and the Internet of Things (IoT) technology, how to obtain information on a specific smell has been paid more attention by many researchers.
There are a great variety of odorous substances but there are no basic odorants of smell. Moreover, one odorous substance can activate multiple odor receptors [
1,
2]. Owing to the particularity of odorous substances themselves, odor recognition is still a field that is expected to further develop. There are still many challenges in the development of sensing systems to recognize odors [
2,
3], for example, to identify the gases with complex compositions or identify specific gases in environments containing many odorous substances. Therefore, many researchers prefer to use multi-channel sensors or sensor arrays to obtain higher identification efficiency.
Currently, many research groups use sensor arrays and techniques using machine learning and neural networks to classify and identify odors. For example, sensor arrays are developed for identifying fruit odors, alcoholic beverages, and indoor odors [
4,
5]. In addition, many sensors such as gas sensors with a metal oxide semiconductor, SPR sensors, surface stress sensors, sensors with carbon materials, and carbon nanotubes have been designed to detect gases [
6,
7,
8,
9]. In various sensors, carbon-based sensor systems are low-cost and easy to manufacture [
3].
The odor sensing system developed by our research group is carbon-based [
10]. The system has an array with 16 channels. The sensitive layers of the odor sensing system are made of mixtures of carbon black (CB) and GC materials. The GC materials are usually used as a gas chromatography stationary phase. The advantage of this sensor is straightforward and consists of CB and GC materials only. Furthermore, there is a wide variety of GC materials, and the polarity can be differentiated from low to high by the McReynolds constant [
11]. The sensitive layer can absorb gases and outputs a change in resistance by the swelling effect. The type and mixing ratio of a GC material and CB will affect identification results [
10,
12]. Therefore, it is flexible to create sensor arrays with different characteristics.
This study focuses on an odor sensing system to detect and recognize the overheating cables of a power system. We attempt to monitor the odorants released from the insulation layer upon overheating to build a system that can activate the alarm before a fire or short circuit occurs. When using an odor sensing system with chemosensitive layers, diverse information can be obtained by analyzing the gas response characteristics of a cable when it is overheated [
13]. For example, in addition to identifying decomposition gases from cables at different temperatures, it is hoped that different types of cable can be distinguished simultaneously. Thus, the odor sensing system can be used to detect the abnormal heating of electric distribution cables and their maintenance more effectively.
In thermal analysis, electric cables release plasticizers and other substances when the temperature is close to their rated operating temperature, such as 110 °C [
14]. For example, polyvinyl chloride (PVC) cables for the switchboard will start to melt at a temperature approximately above 200 °C. Chloride is the main component of their product, and the amount of plasticizers released gradually increases as the temperature rises. In addition, the sensors of the odor sensing system are expected to have different response patterns for different decomposition products. The odor sensing system can be used to distinguish the abnormal state of cables.
There are two goals of developing the odor sensing system for detecting the abnormal heating of cables. Firstly, the system can activate an alarm before a cable overheats or melts. Secondly, the system can detect the characteristic gas released upon the deterioration of the cable at a temperature lower than the melting point of cables, thereby enabling timely maintenance and replacement of the affected wiring. Moreover, the odor sensing system should be capable of distinguishing different types of cable from the response characteristics so that the source of the abnormality can be accurately determined.
We conducted three phases of experiments to design an odor sensing system capable of detecting abnormal heating of cables in the early stages. First, the thermogravimetric analysis (TGA) and differential thermal analysis (DTA) of the cable were carried out to determine the characteristics of cable samples. Before the cable abnormality occurred, the state change was determined from the amounts of heat released and weight lost. Secondly, the gas composition and content of overheated cables were analyzed by GC-MS. Finally, the odor sensing system was used to detect and distinguish the gases generated from the samples at different heating temperatures using machine learning.
2. Materials and Methods
2.1. Cable Samples
As shown in
Table 1, three cables from different manufacturers were used as samples in this experiment: a low-voltage (LV) cable covered with heat-resistant PVC, and two types of medium-voltage (MV) cable made of cross-linked polyethylene (XLPE or PEX). To obtain the maximum conductor operating temperature, typical temperature ratings of these cables ranging from 90 °C to 110 °C were considered. Therefore, when the ambient temperature exceeds the temperature rating, the aging and damage of cables will accelerate, and the electric insulation performance will begin to decline. Furthermore, when cables overheat, their outer layer of cables may melt and burn, leading to a short circuit or fire accidents.
2.2. Thermal Properties of Cables
The heat-flux differential scanning calorimeter Shimadzu DSC-60 (Shimadzu Corporation, Kyoto, Japan) was used for the thermal analysis. Cable samples were heated from room temperature to 550 °C. The reference gas is air. Thermogravimetric and differential thermal analyses were performed on the cable samples to investigate changes in their physiochemical state with the increase in temperature [
15,
16].
2.3. Gas Chromatography-Mass Spectrometry (GC-MS)
Shimadzu GCMS-QP2010 SE (Shimadzu Corporation, Kyoto, Japan) was used for the composition analysis of the gas generated upon overheating of the cables in this research. The specific compounds of the gas generated from the cables could be analyzed by the results of GC-MS. However, it is not the primary purpose of this study to determine exactly all the products. The GC-MS results could provide information for us to define the conditions for odor recognition.
As the experimental procedure, 30 mg of the insulation layer of each cable sample was placed in a test tube and heated to 270 °C for 15 min. The generated gases were passed through a NaOH filter and were extracted by an 85 PDMS µm fiber (Sigma-Aldrich, Bellefonte, PA, USA). After extraction with the PDMS fiber, the gas compounds were injected in the GC-MS with the splitless mode. For GC, helium was used as the carrier gas. Furthermore, a 30 m DB-WAX column of 0.25 mm inner diameter and 0.25 μm film thickness (Agilent Technologies, Inc., Santa Clara, CA, USA) was used. The column chamber was heated from 40 °C to 230 °C at a rate of 10 °C/min. A quadrupole mass spectrometer was used for MS.
2.4. Experiment Devices of the Odor Sensing System
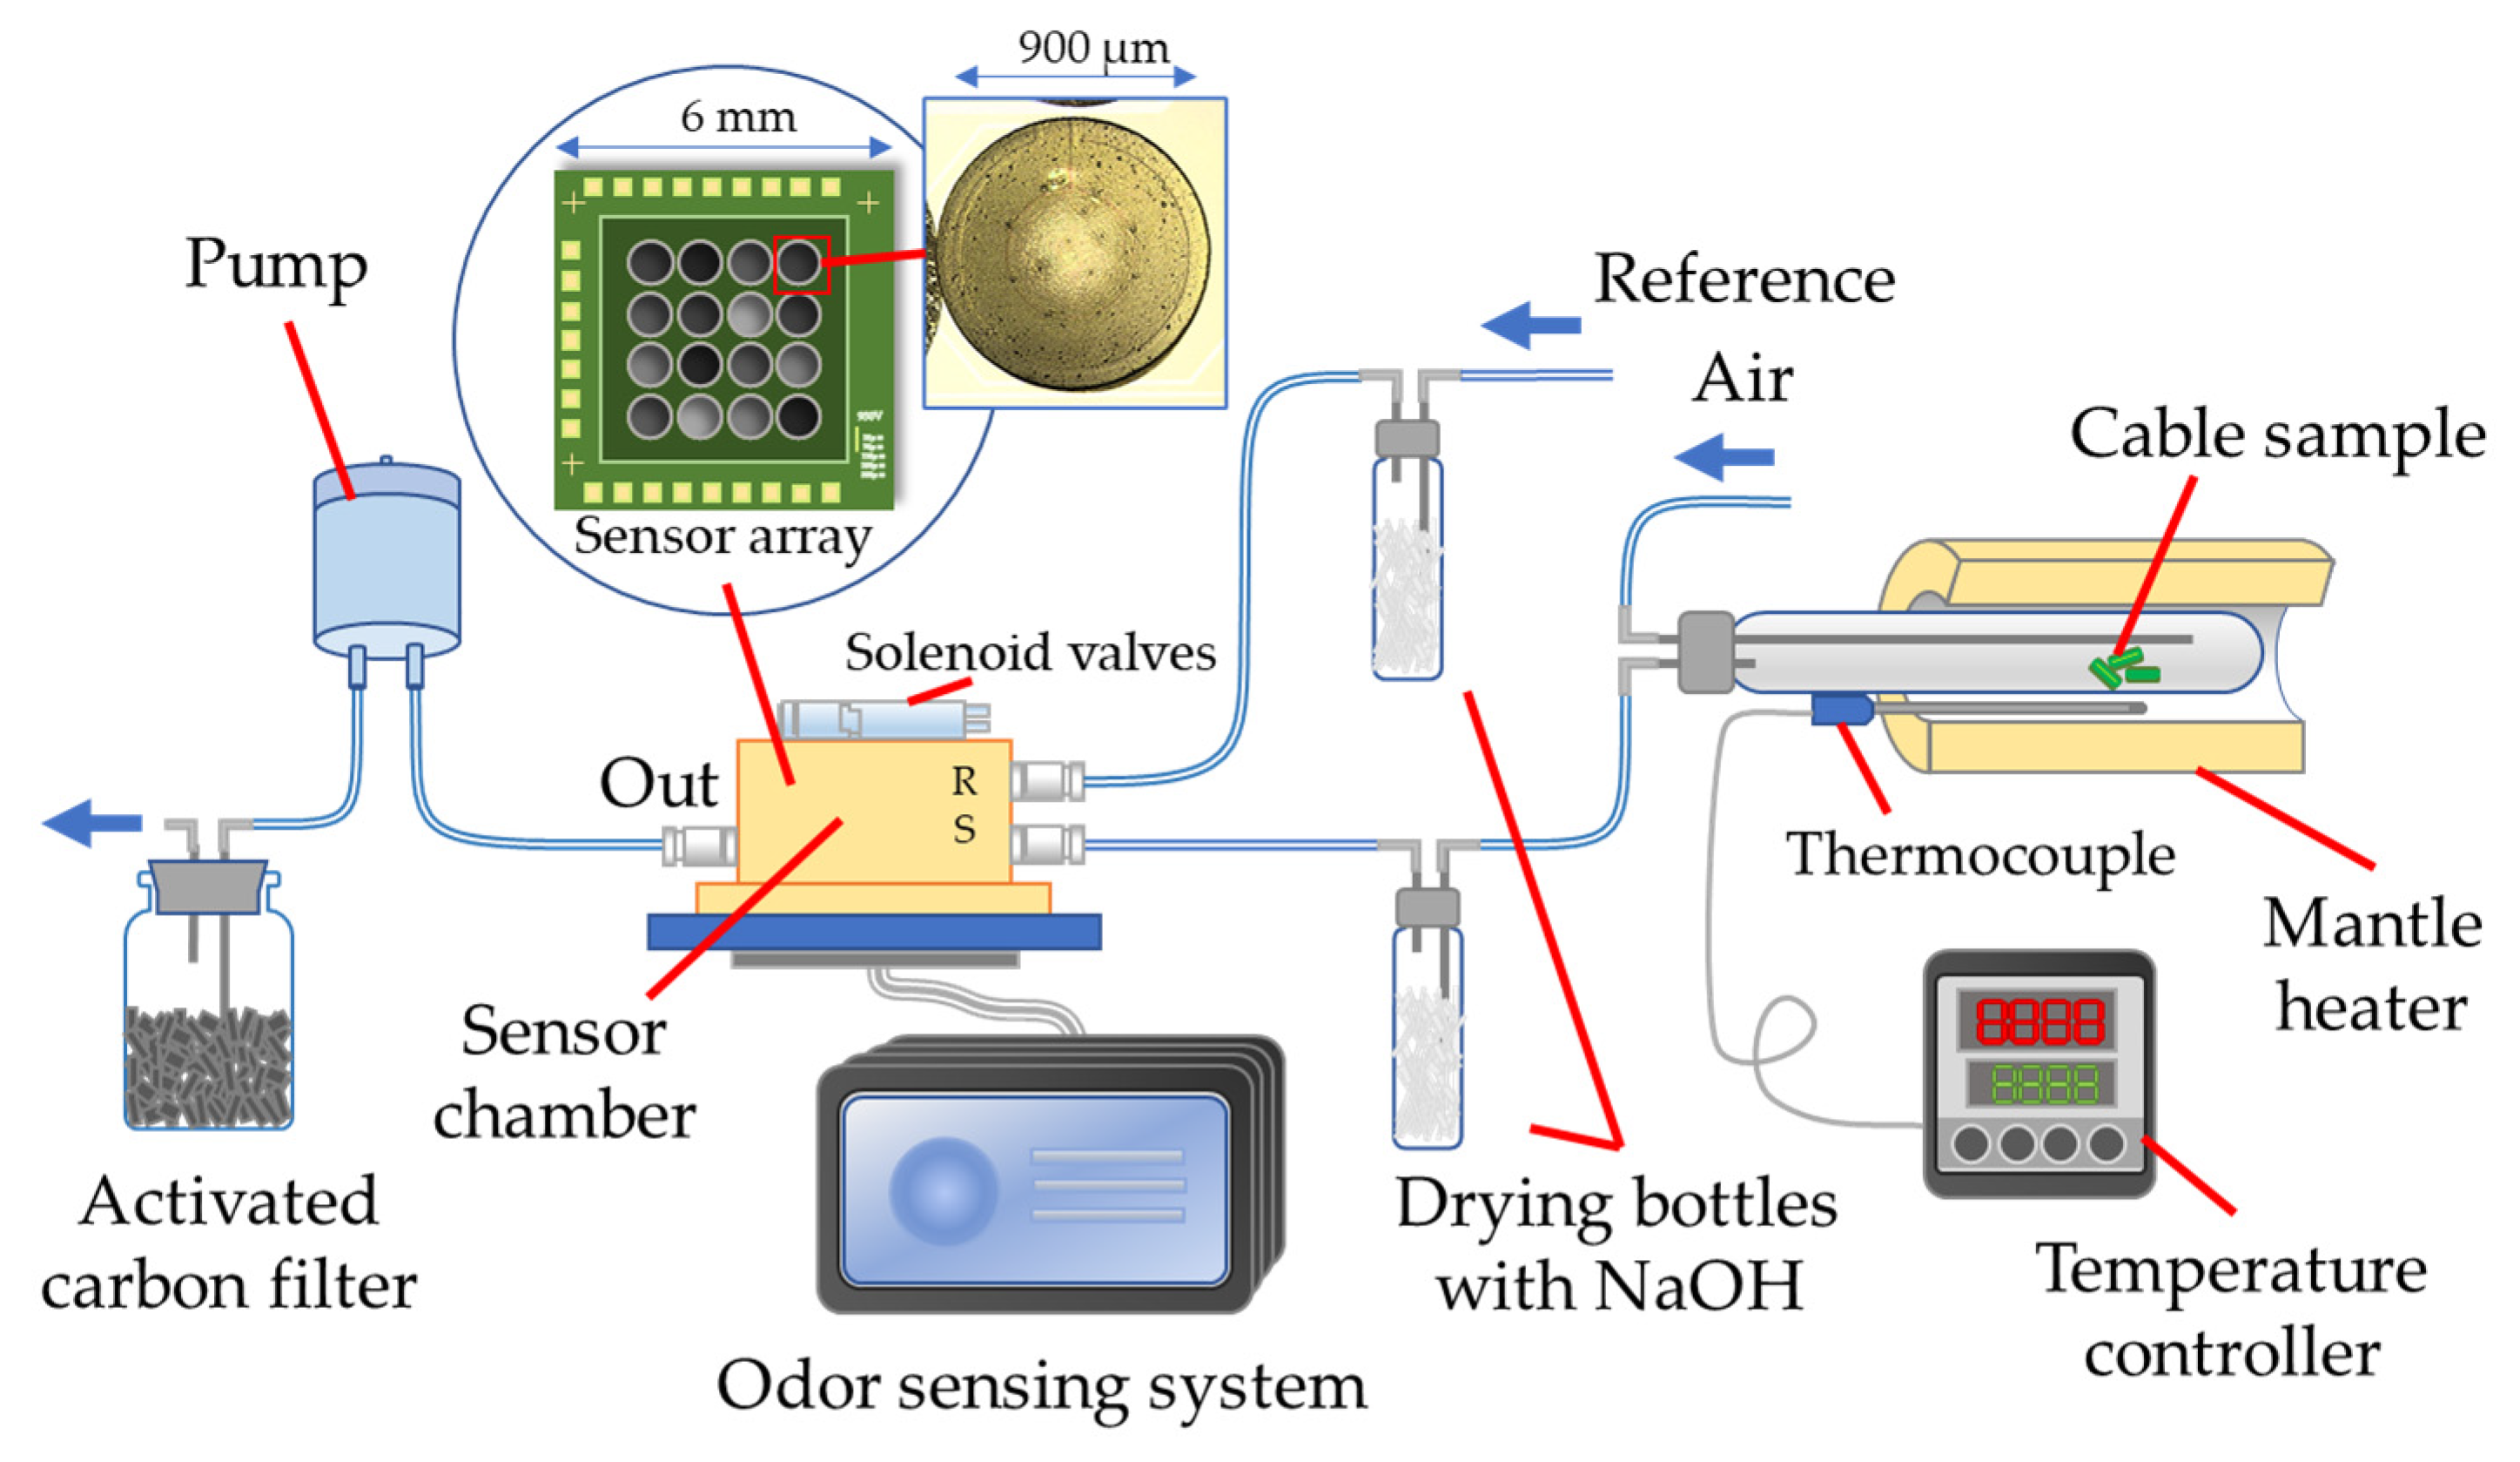
As shown in
Figure 1, the heating device consists of a temperature controller with a type K thermocouple and a mantle heater for controlling temperature from room temperature to 400 °C. A test tube with an outside diameter matching the mantle heater was heated to the specified temperature. The cable samples were placed inside the front of the test tube. The tube was long enough to prevent the cable samples from being heated before the tube reaches the specified temperature. When the tube was heated, the cable samples were allowed to slide to the tube bottom for heating.
An air pump is built into the system, which controls the flow of ordinary air into the device at a rate of 0.1 L/min. The reference and sample channels are connected to the sensor array chamber, which can be switched by the solenoid valves controlled by the odor sensing system.
Overheated PVC cables will generate acid gases such as HCl [
17,
18]. HCl is highly corrosive to the wire bonding of array chips, which will increase the risk of a circuit break. To enhance the corrosion of circuits, drying bottles filled with NaOH pellets (FUJIFILM Wako Pure Chemical Corporation, Osaka, Japan) were used as gas filters. The response of sensor arrays can still be confirmed using the filtered gases. A sensor array composed of 16 different GC materials is placed in the sensor chamber of the odor sensing system. The exhaust gas will pass through the activated carbon filter and move to the fume hood.
2.5. Sensor Array of the Odor Sensing System
As shown in
Figure 1, the sensor arrays used in this study have 16 channels. The size of the sensor array chip is about 6 mm × 6 mm. Each channel is about 900 μm in diameter. Two concentric electrodes are printed in the middle of each channel for measuring resistance changes. The sensitive layers made of GC material and CB mixtures are coated onto the electrodes using an automatic spotter SPOTMASTER from Musashi Engineering, Inc., Tokyo, Japan.
GC materials can absorb gases and expand. CB makes the sensitive layers electrically conductive. When the gases adsorb onto a sensitive layer, the volume change of the layer will cause a change in the resistance between the two electrodes. The change in resistance of each channel will be recorded as the sensor response.
As shown in
Table 2, two types of sensor array are prepared. Sixteen types of high-polarity GC materials with different functional groups were used in array A, and they were derived from previous studies [
13]. Array B is based on array A, but some of its GC materials were low polarity. Thus, the GC materials in Array B have different polarities from the high to low range. We expected array B to respond to the generated gas differentially, which may affect the identification accuracy.
2.6. Processing of Raw Data for Machine Learning
In the experiment, three sets of tests were carried out on each sample; that is, two sets were used as training data and one set was used as test data. Cross-validation was carried out to calculate the average recognition accuracy. In each test, the sample and reference gases were alternately detected seven times. The detection time is 30 s, and the recovery time is also 30 s. The original data are voltages recorded according to resistance changes of the sensor array [
12]. The high-frequency component noise was removed by converting the raw data to the frequency waveform using the Fourier transform. The average responses over 1 s at every 5 s interval after the measurement began were selected as features.
Principal component analysis (PCA) was used to observe the distribution of data in dimensionality reduction. Moreover, five classifiers were used for machine recognition, including the linear kernel SVM, random forest classifier, MLP classifier, and logistic regression. The type of data in the test group was predicted by the program using different classifiers, and the positive and negative results of prediction were summarized and compared.
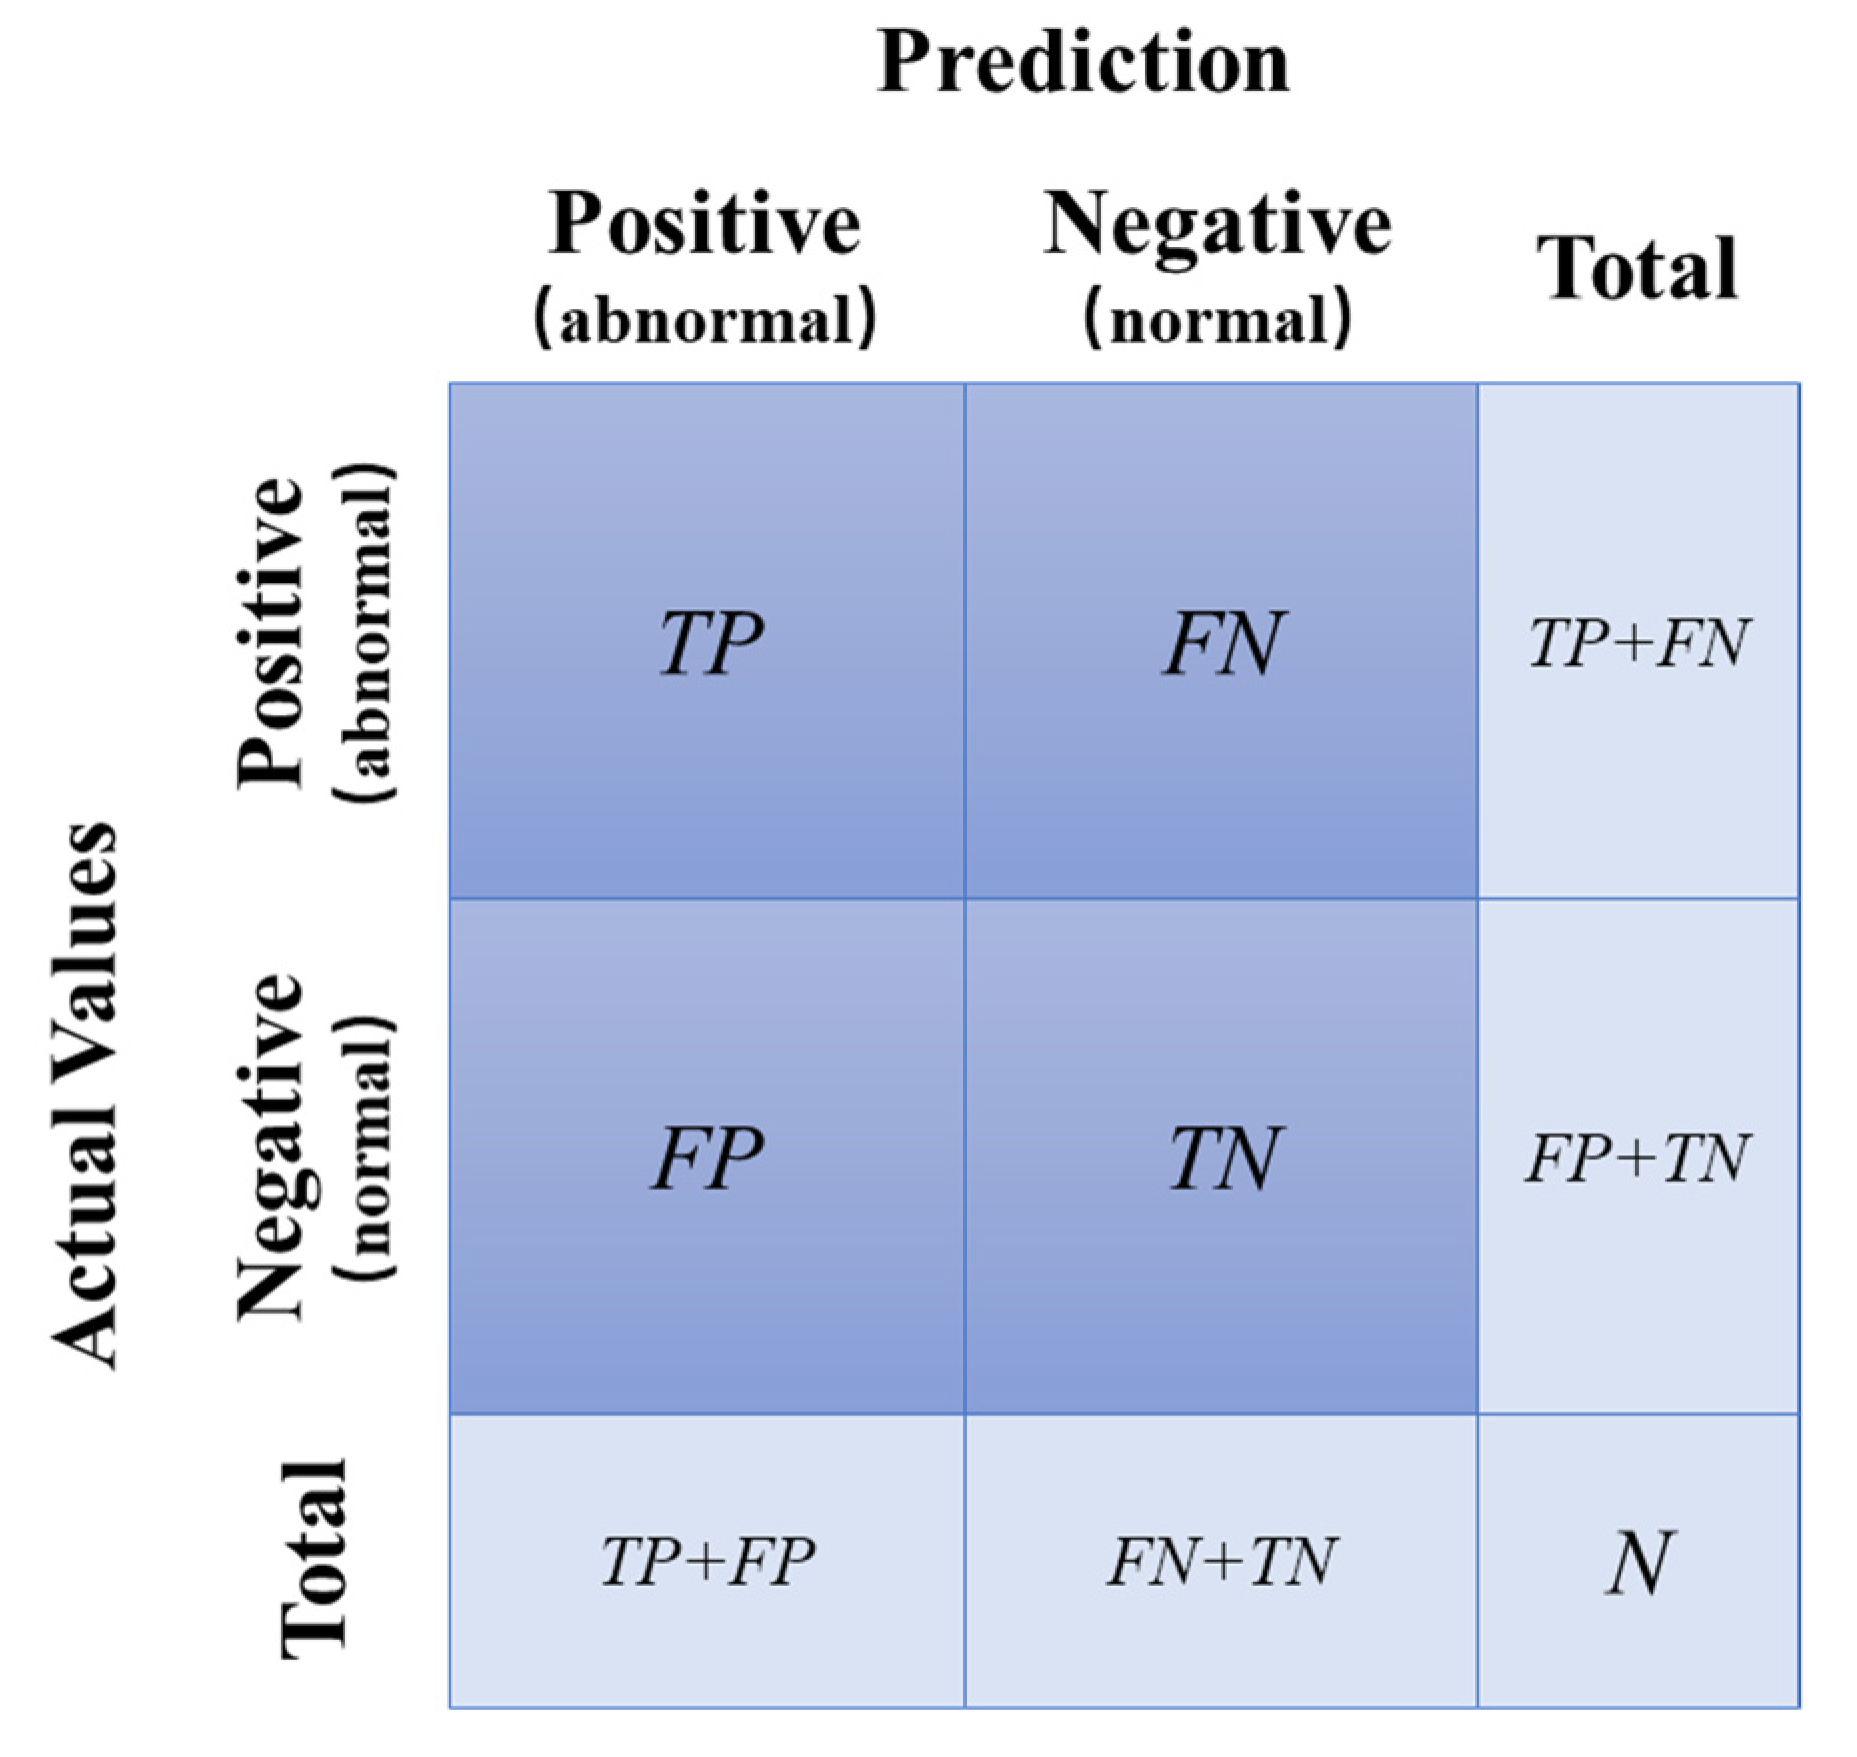
The prediction results were evaluated in terms of accuracy, recall, and precision. The calculation methods used are shown in
Figure 2. According to the comparison of the predicted and actual values, the results were divided into true positive (
TP), false negative (
FN), false positive (
FP), and true negative (
TN). The accuracy, recall rate, and precision rate were calculated using Equations (1)–(3). In general, accuracy rate is often used to evaluate the quality of the prediction system. Recall and precision rates can show different characteristics of prediction methods [
19]. The recall rate indicates the percentage of abnormal events that can be detected out of all abnormalities. The precision rate indicates the percentage of actual abnormal events that occurred from all abnormality predictions. As shown in Equation (4), the F-measure indicates the relationship between the recall and precision rates.
3. Results and Discussion
3.1. Differential Thermal and Thermogravimetric Analyses of Cables
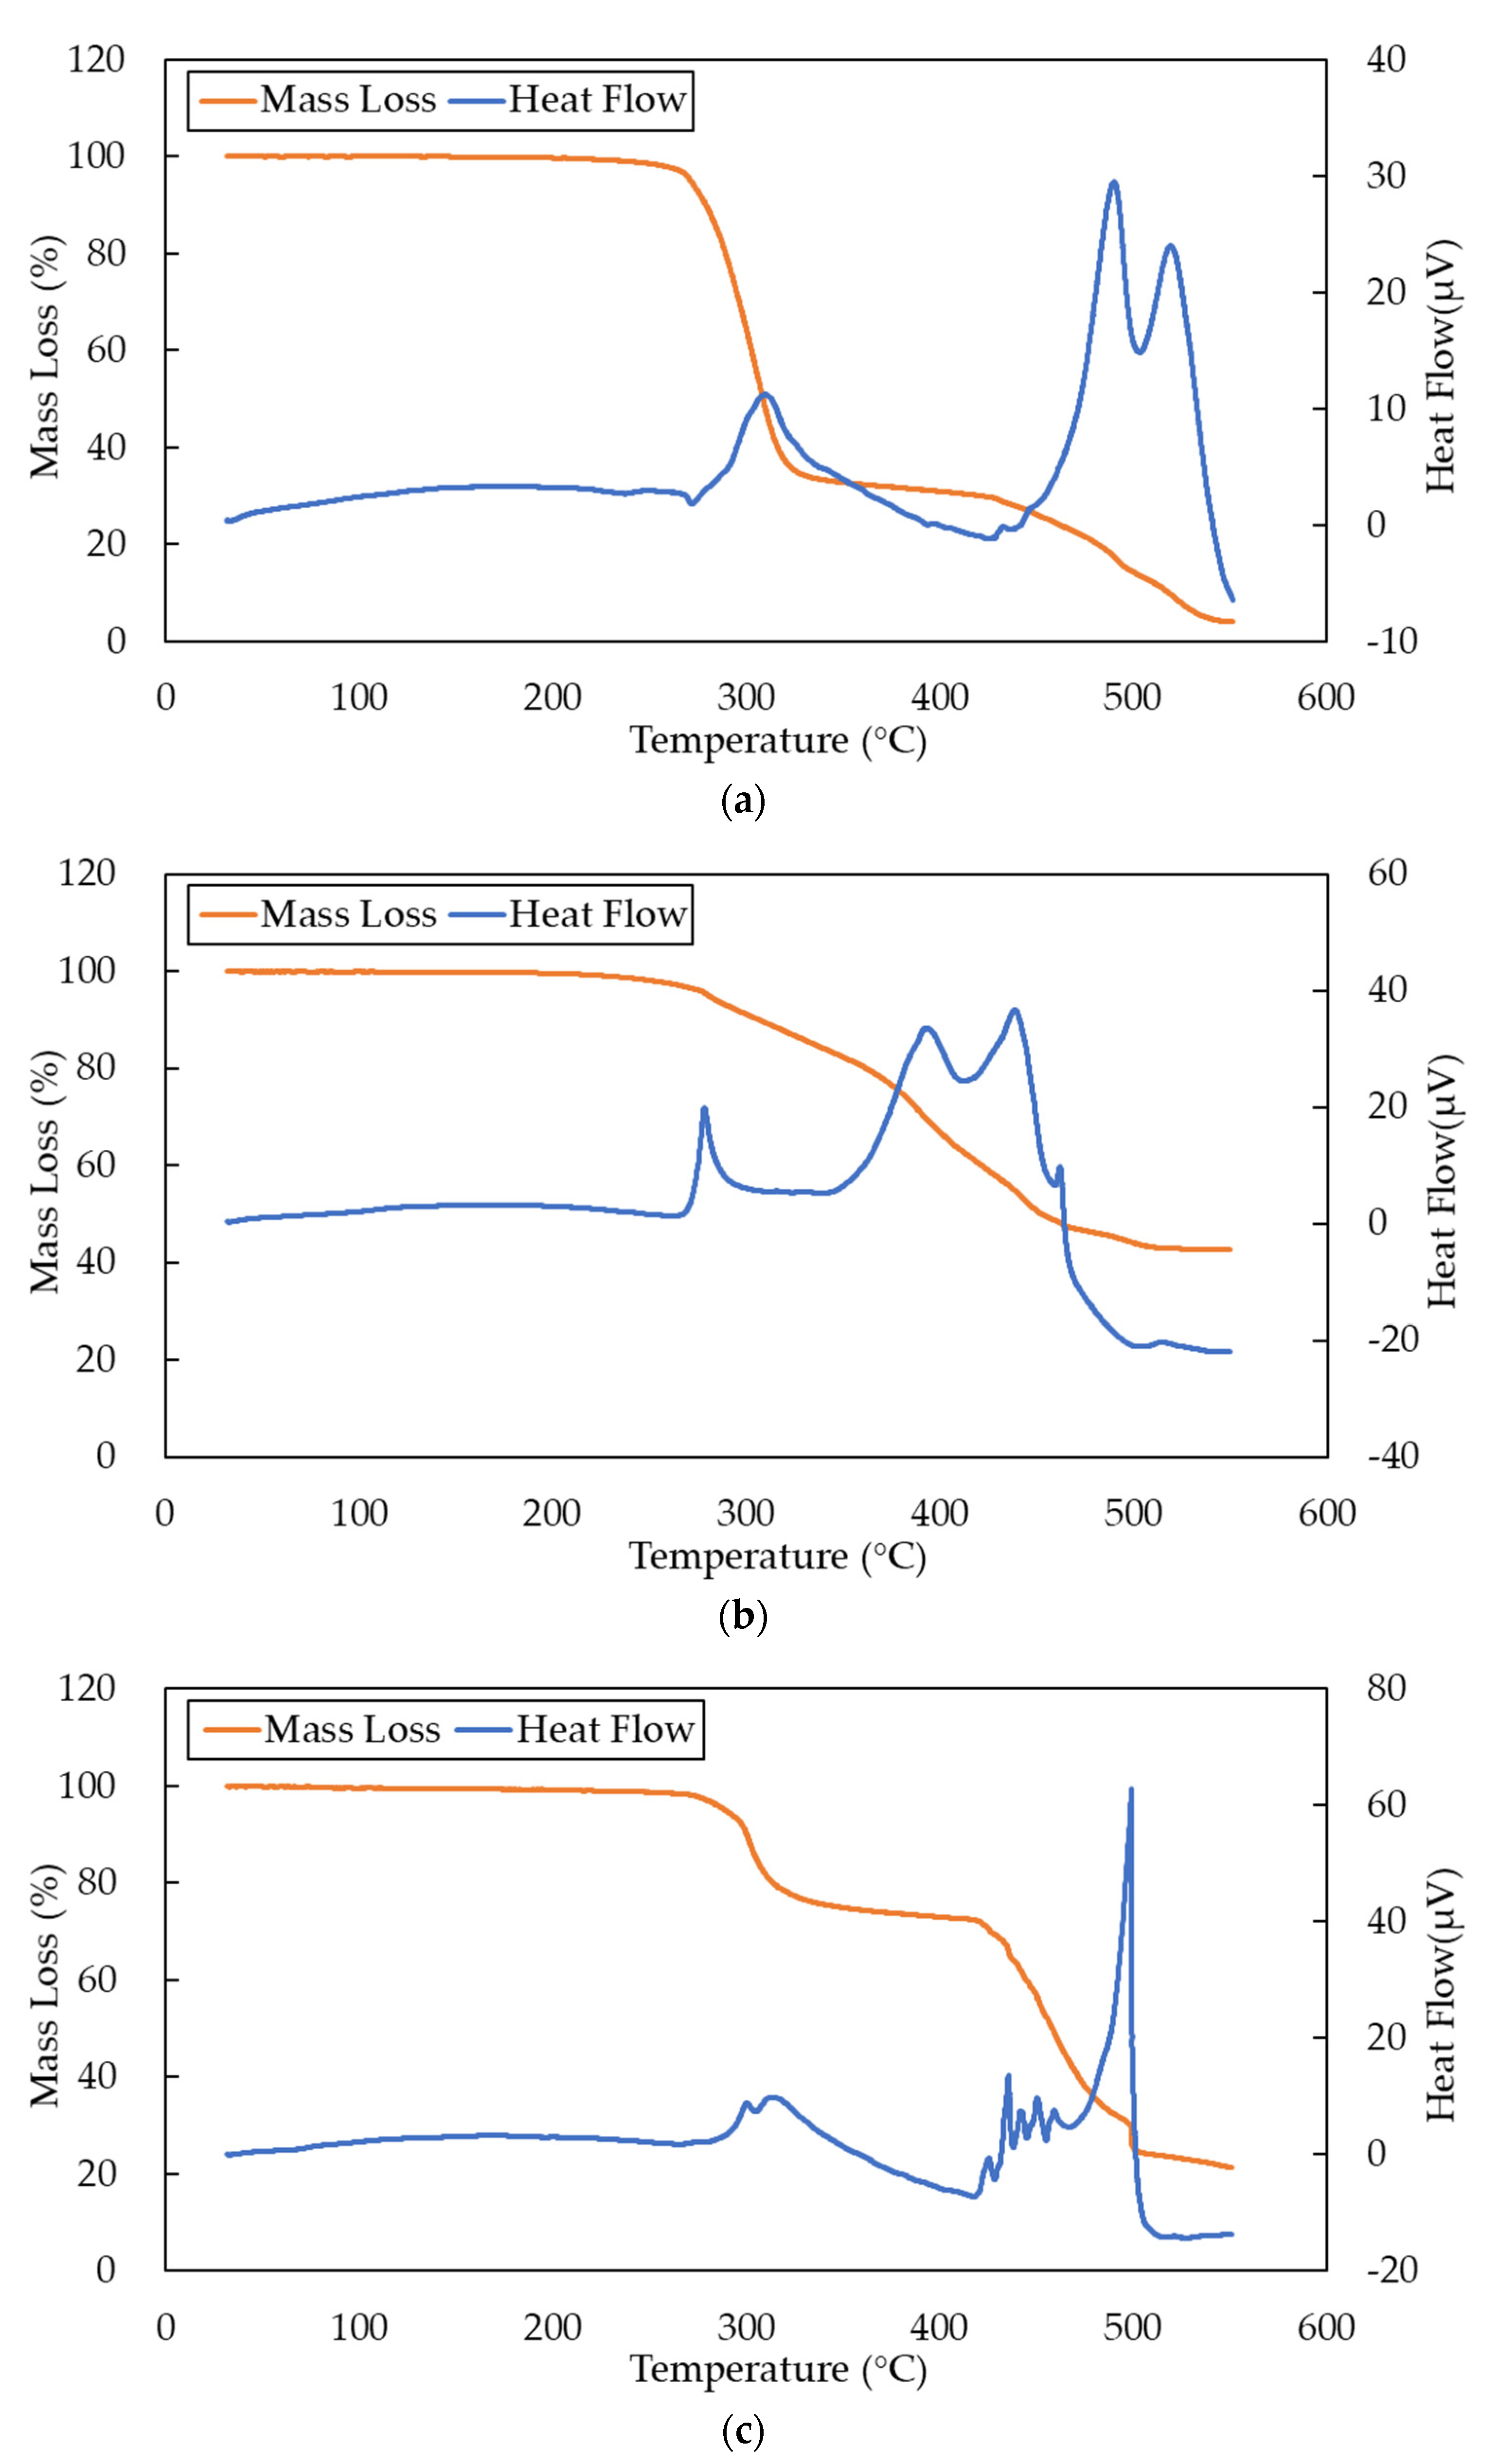
As the temperature rises, the weight of a cable gradually decreases. When the mass decreases, the insulation layer of the cable may melt or burn. When the differential heat is detected, it means that gas may be released.
Figure 3 contains the results of GTA and DTA of the cables.
Figure 3a shows that the mass of the LV cable decreases substantially to less than 40% at above 300 °C. Owing to the low heat resistance of PVC, the LV cable is more easily decomposed by heat. As shown in
Figure 3b,c, respectively, MV cables A and B maintain a mass of about 80% at 300 °C. Both XLPE cables only lose a mass of about 20%, and there is a risk of losing insulation properties. As shown in
Figure 3a–c, there are peaks of heat flow at about 300 °C. The heat flow peaks of the LV cable and the MV cable B are about 10 μV, and the heat flow peak of the MV cable A is about 20 μV. A heat flow peak of DTA means a lot of gases may be released by the sample.
The results suggest that the cables start to disintegrate and melt above 270 °C. Therefore, the odor sensing system needs to be able to recognize the generated gases no higher than 270 °C to detect abnormal heating of the cables in the early stages.
3.2. Compositional Analysis of Gases Generated from Overheated Cables
GC-MS was used to analyze the composition of the gases generated from three different cables. Investigating the differences in terms of the type and content of thermal decomposition products of cables will provide reference information for odor recognition using the sensing system. However, the accurate analysis of the source of each component is not the purpose of this experiment.
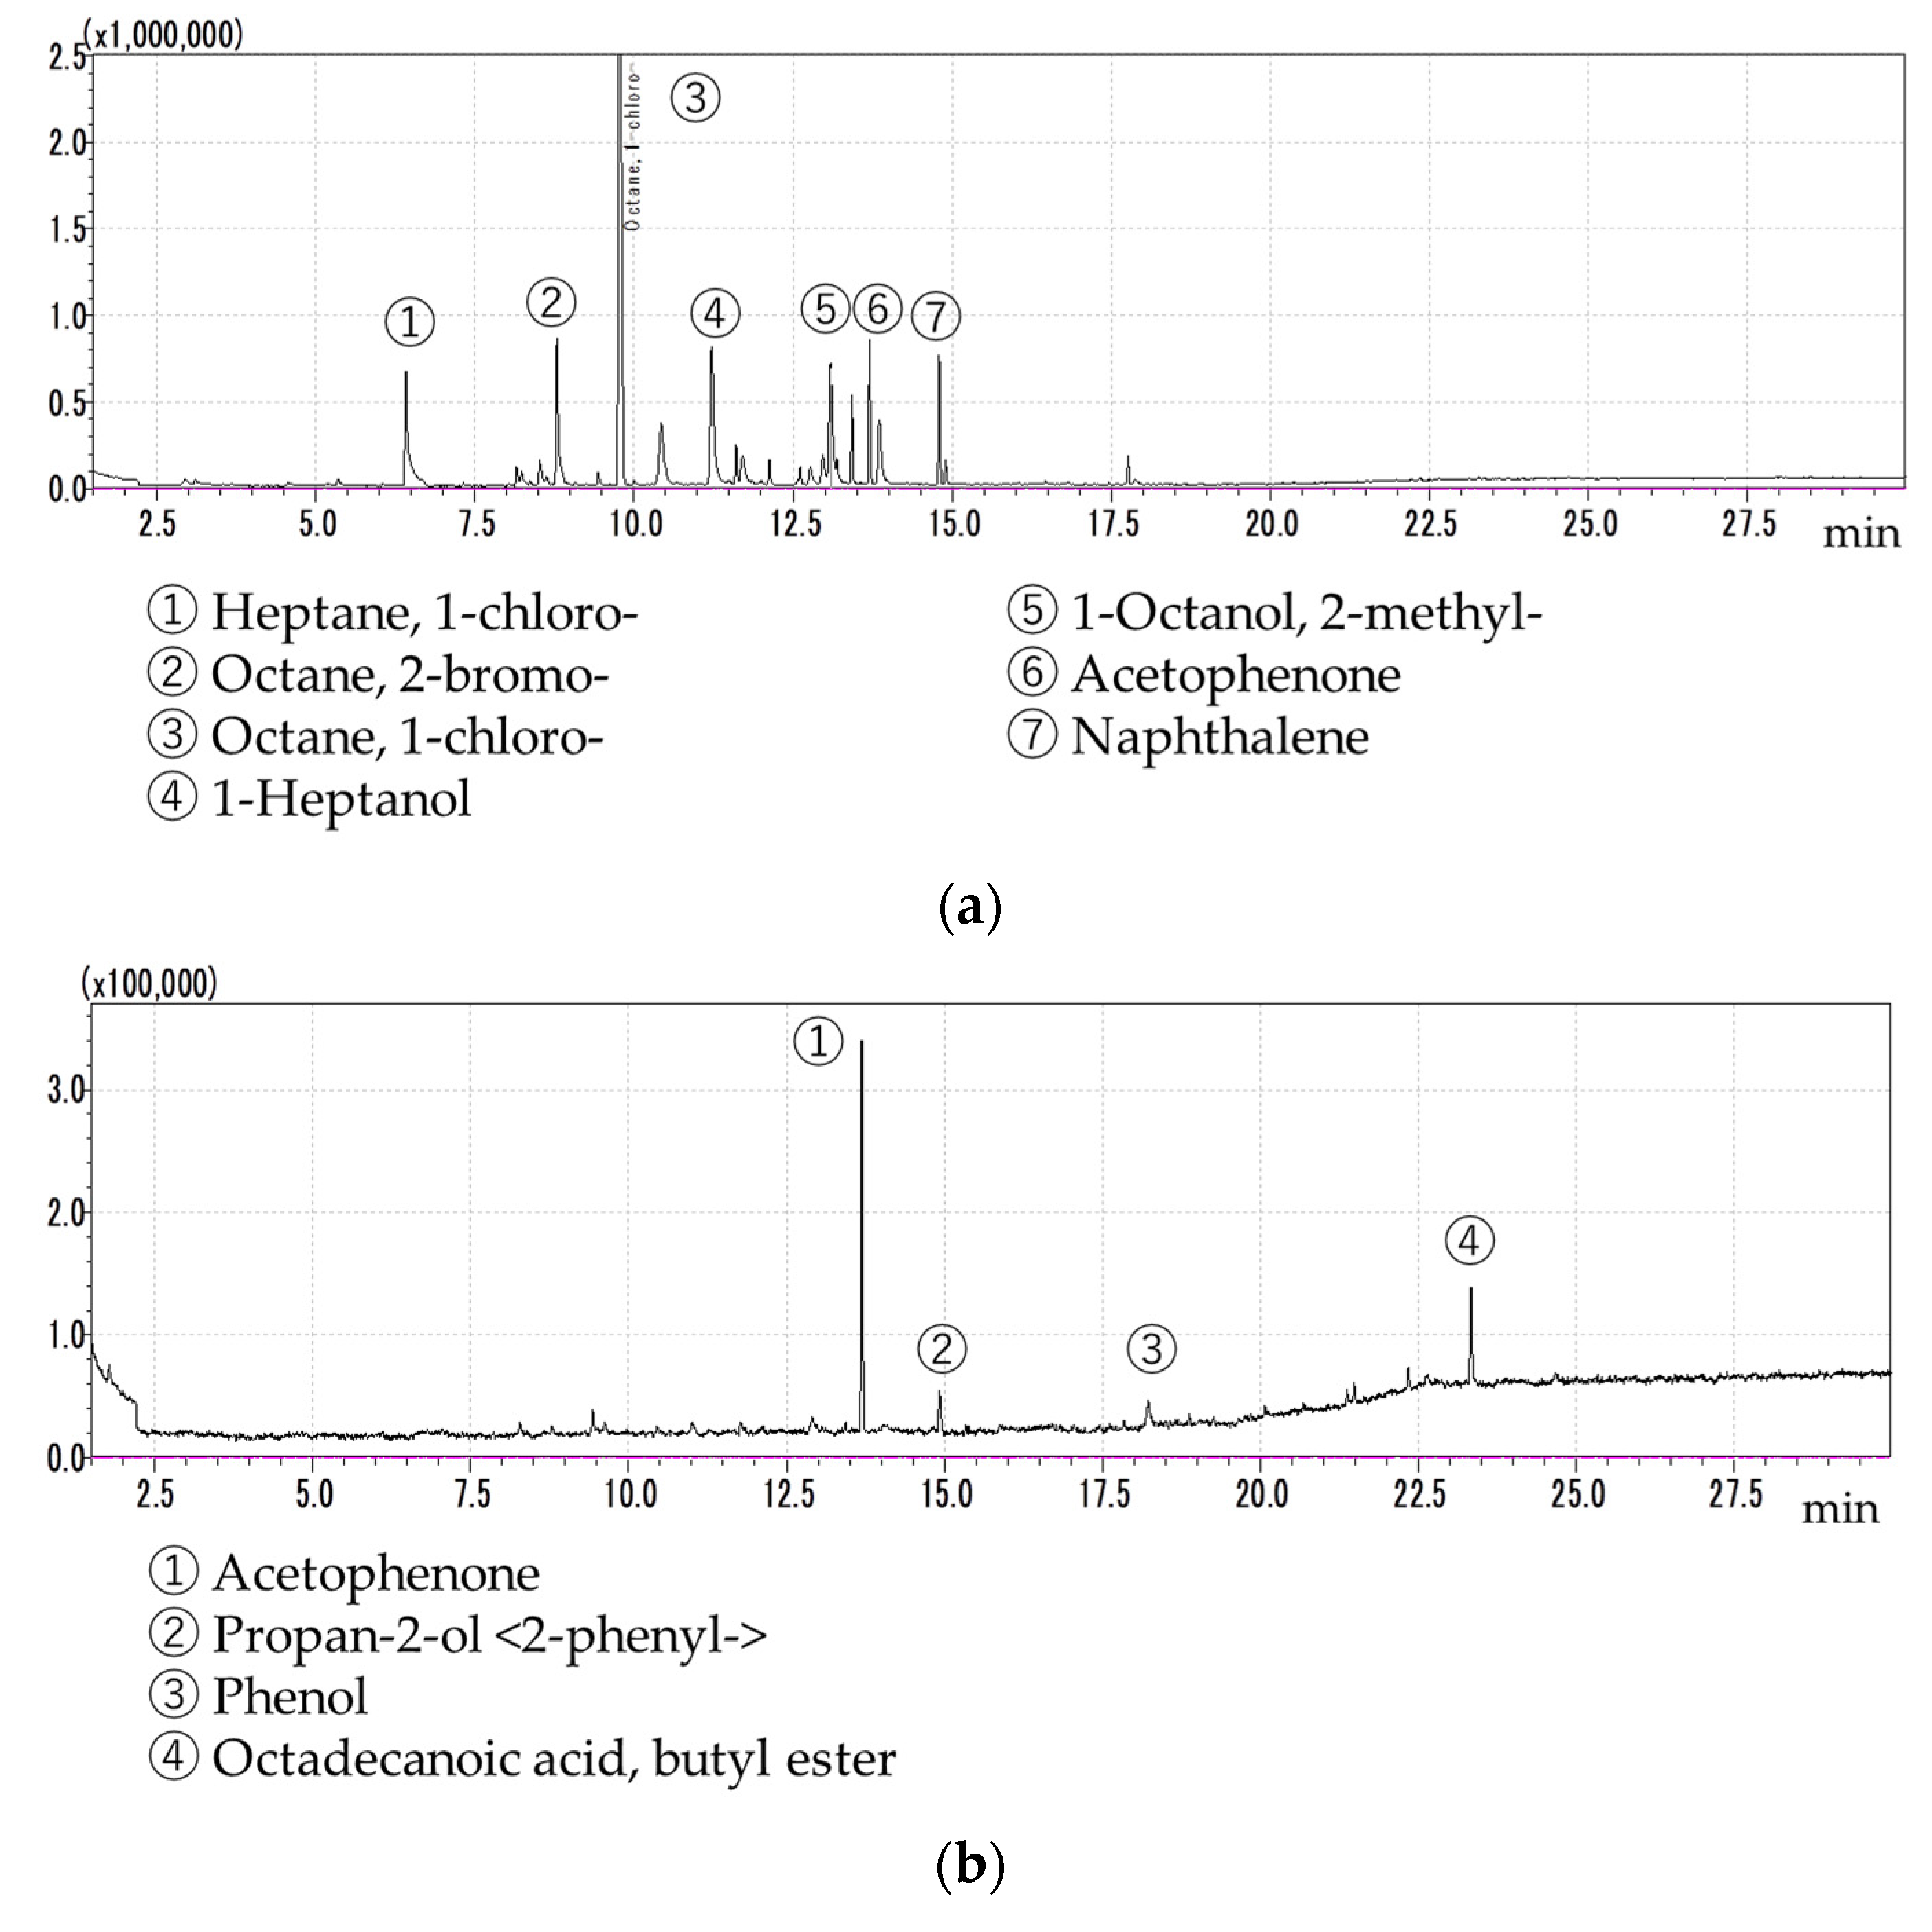
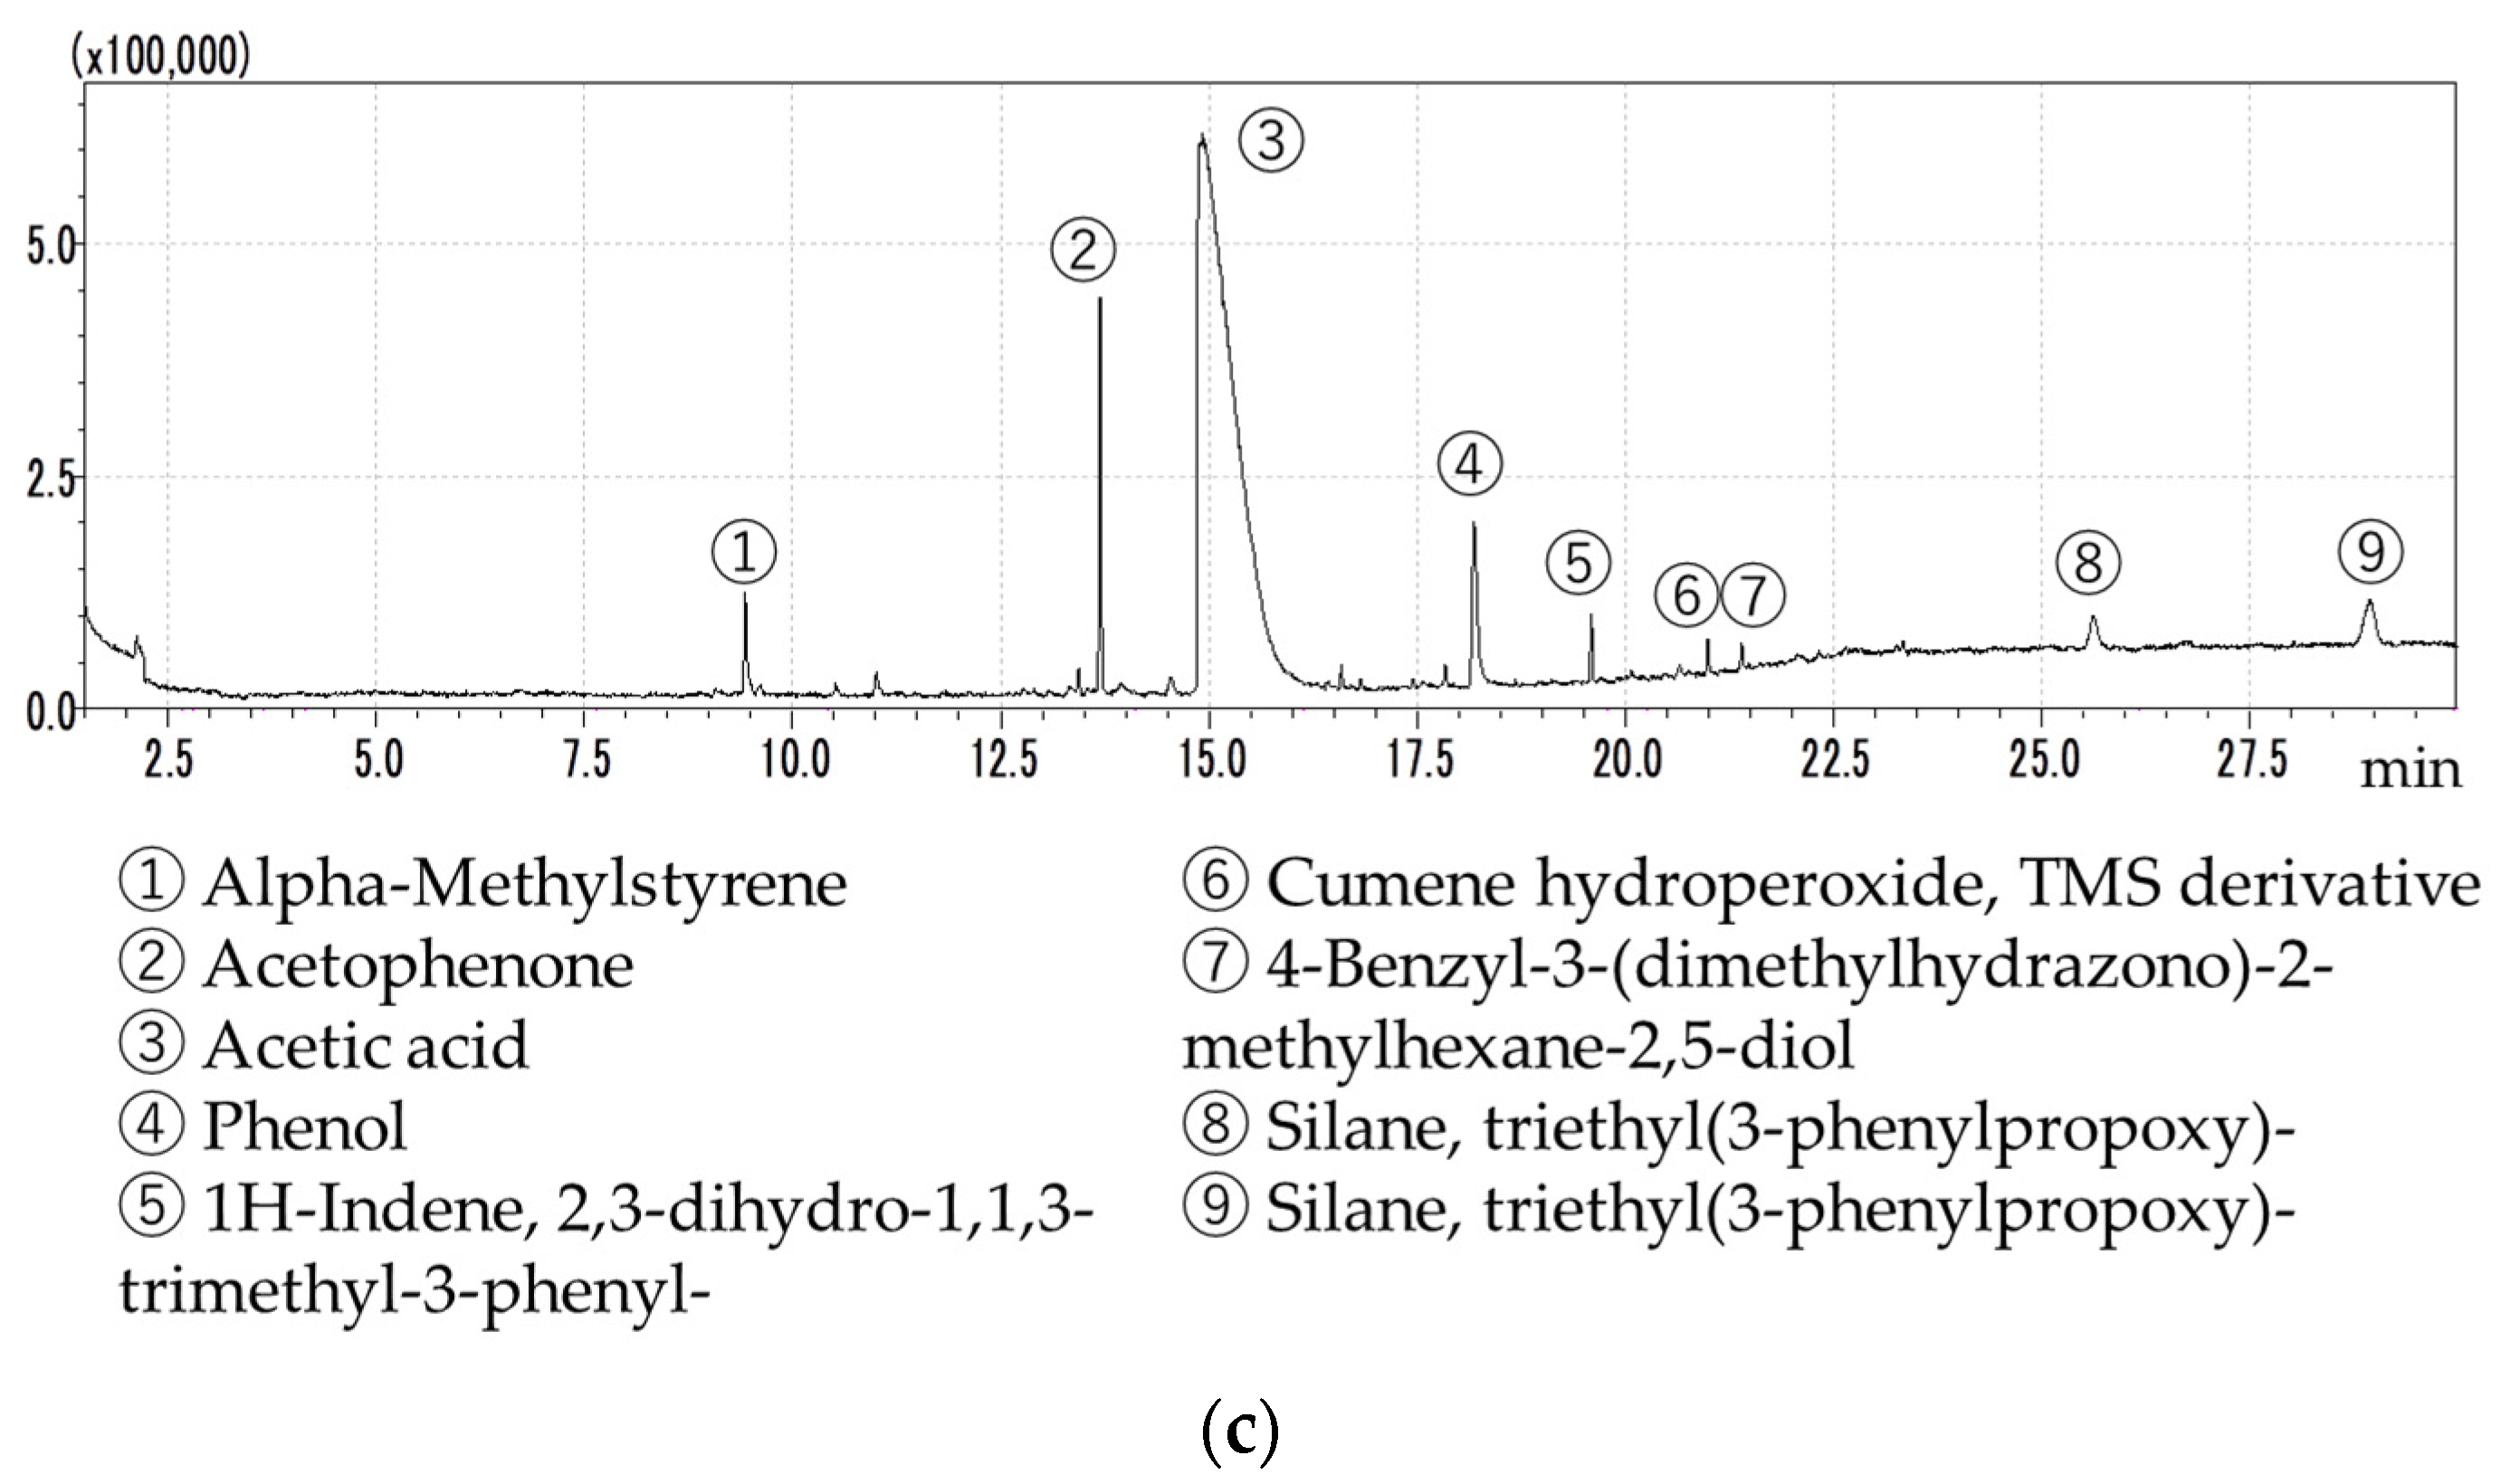
As shown in
Figure 4a–c, acetophenone was found in all three types of cable. Acetophenone is commonly used as a plasticizer or component of ink [
20,
21]. It probably originates from the inkjet printing on the cables. As shown in
Figure 4a, a high concentration of octane, 1-chloro- was found in the LV cable. Octane, 1-chloro- is an intermediate of the synthesis of a highly efficient non-toxic organotin heat stabilizer for PVC [
22]. This component is usually formed by the thermal decomposition of PVC materials [
23]. As shown in
Figure 4b, octadecanoic acid butyl ester was found in the MV cable A. Octadecanoic acid butyl ester is often used as a plasticizer [
21,
24]. As shown in
Figure 4c, a significant amount of acetic acid was detected in MV cable B. Acetic acid is a typical product of the thermal decomposition of ethylene-vinyl acetate (EVA) [
25]. The insulation layer of MV cable BB is likely to be a double-layer structure containing the EVA and the XLPE.
As detected from the three types of over-heated cable, there are different gases produced. These cables began to deteriorate after exceeding the nominal heat resistance temperature. Moreover, plasticizers and carbon compounds were detected. As a result, all the cables decomposed at about 270 °C. This result is in accordance with the result of the differential thermal analysis. Therefore, when the cables are heated to 270 °C, detecting the anomaly based on the gas produced is possible. Furthermore, because the generated gas of each cable is different, it is also possible to identify the type of cable using the odor sensing system. When the temperature exceeding the rated temperature, such as 130 °C, is regarded as the abnormal temperature, it will be more challenging to examine the abnormality and distinguish the types of cable.
3.3. Identification of Overheating Abnormalities of Power Cables Using an Odor Sensing System
3.3.1. Distinguishing Three Different Cables at 270 °C Using Two Types of Sensor Array
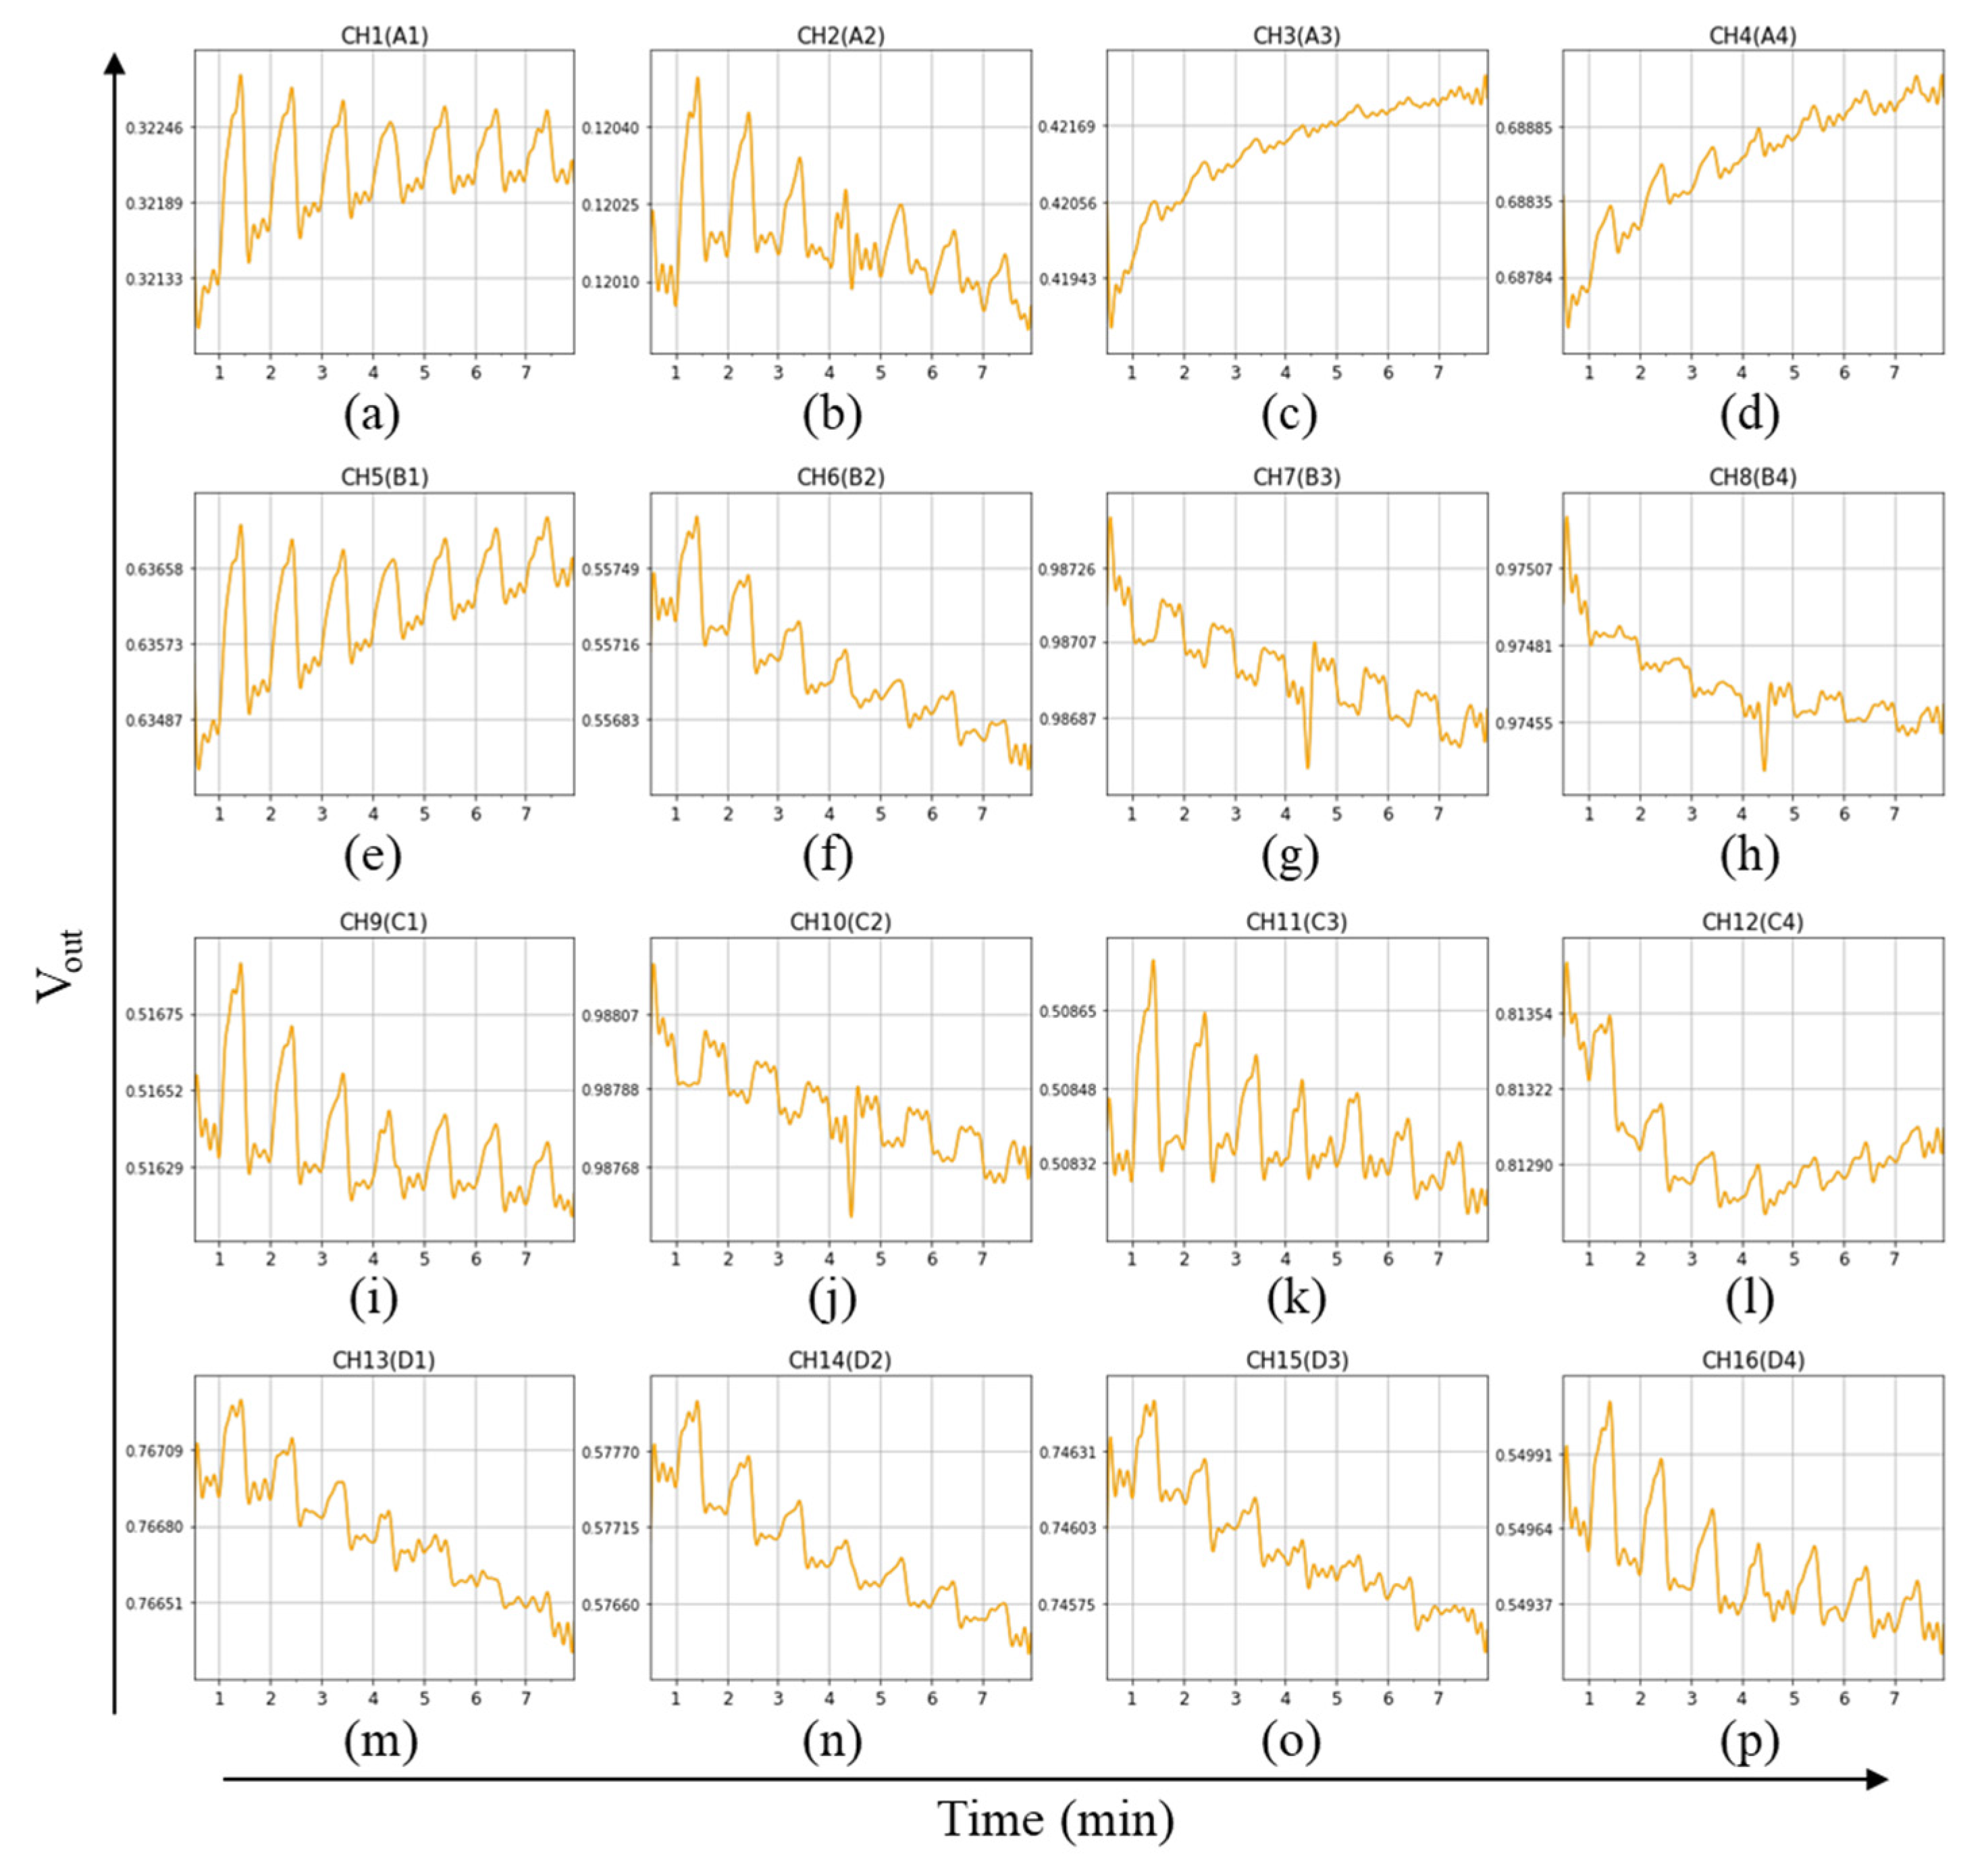
Sensor arrays with different GC materials are used to identify the cable samples. An example of the raw data is shown in
Figure 5. The cable samples were measured seven times. Each type of cable was measured with three tests. Therefore, each cable sample was measured a total of 21 times. The responses of each test are higher for the first two times for some channels such as CH1, CH2, and CH11. When the reference gas is passing, the sample gas will accumulate in the test tube. It makes the response rise quickly during the first few seconds after passing the sample in every test. Baseline drift has occurred across channels because of a short response time setting. With the use of NaOH filters, the concentration of the sensor chamber was kept at about 7–10%.
The odor sensing system is expected to recognize the gas product of the cables using machine learning. Although the odor sensing system cannot analyze all the components of a sample similarly to GC-MS, it can detect the abnormal heating of cables in the early stages by responding to different gas modes. Moreover, a wide variety of relatively cheap materials can be used for the sensor part, and the detection is rapid. In addition, owing to the characteristics of the sensor array, which can collect a large amount of data, we also expect that the system can discriminate different types of heated cable.
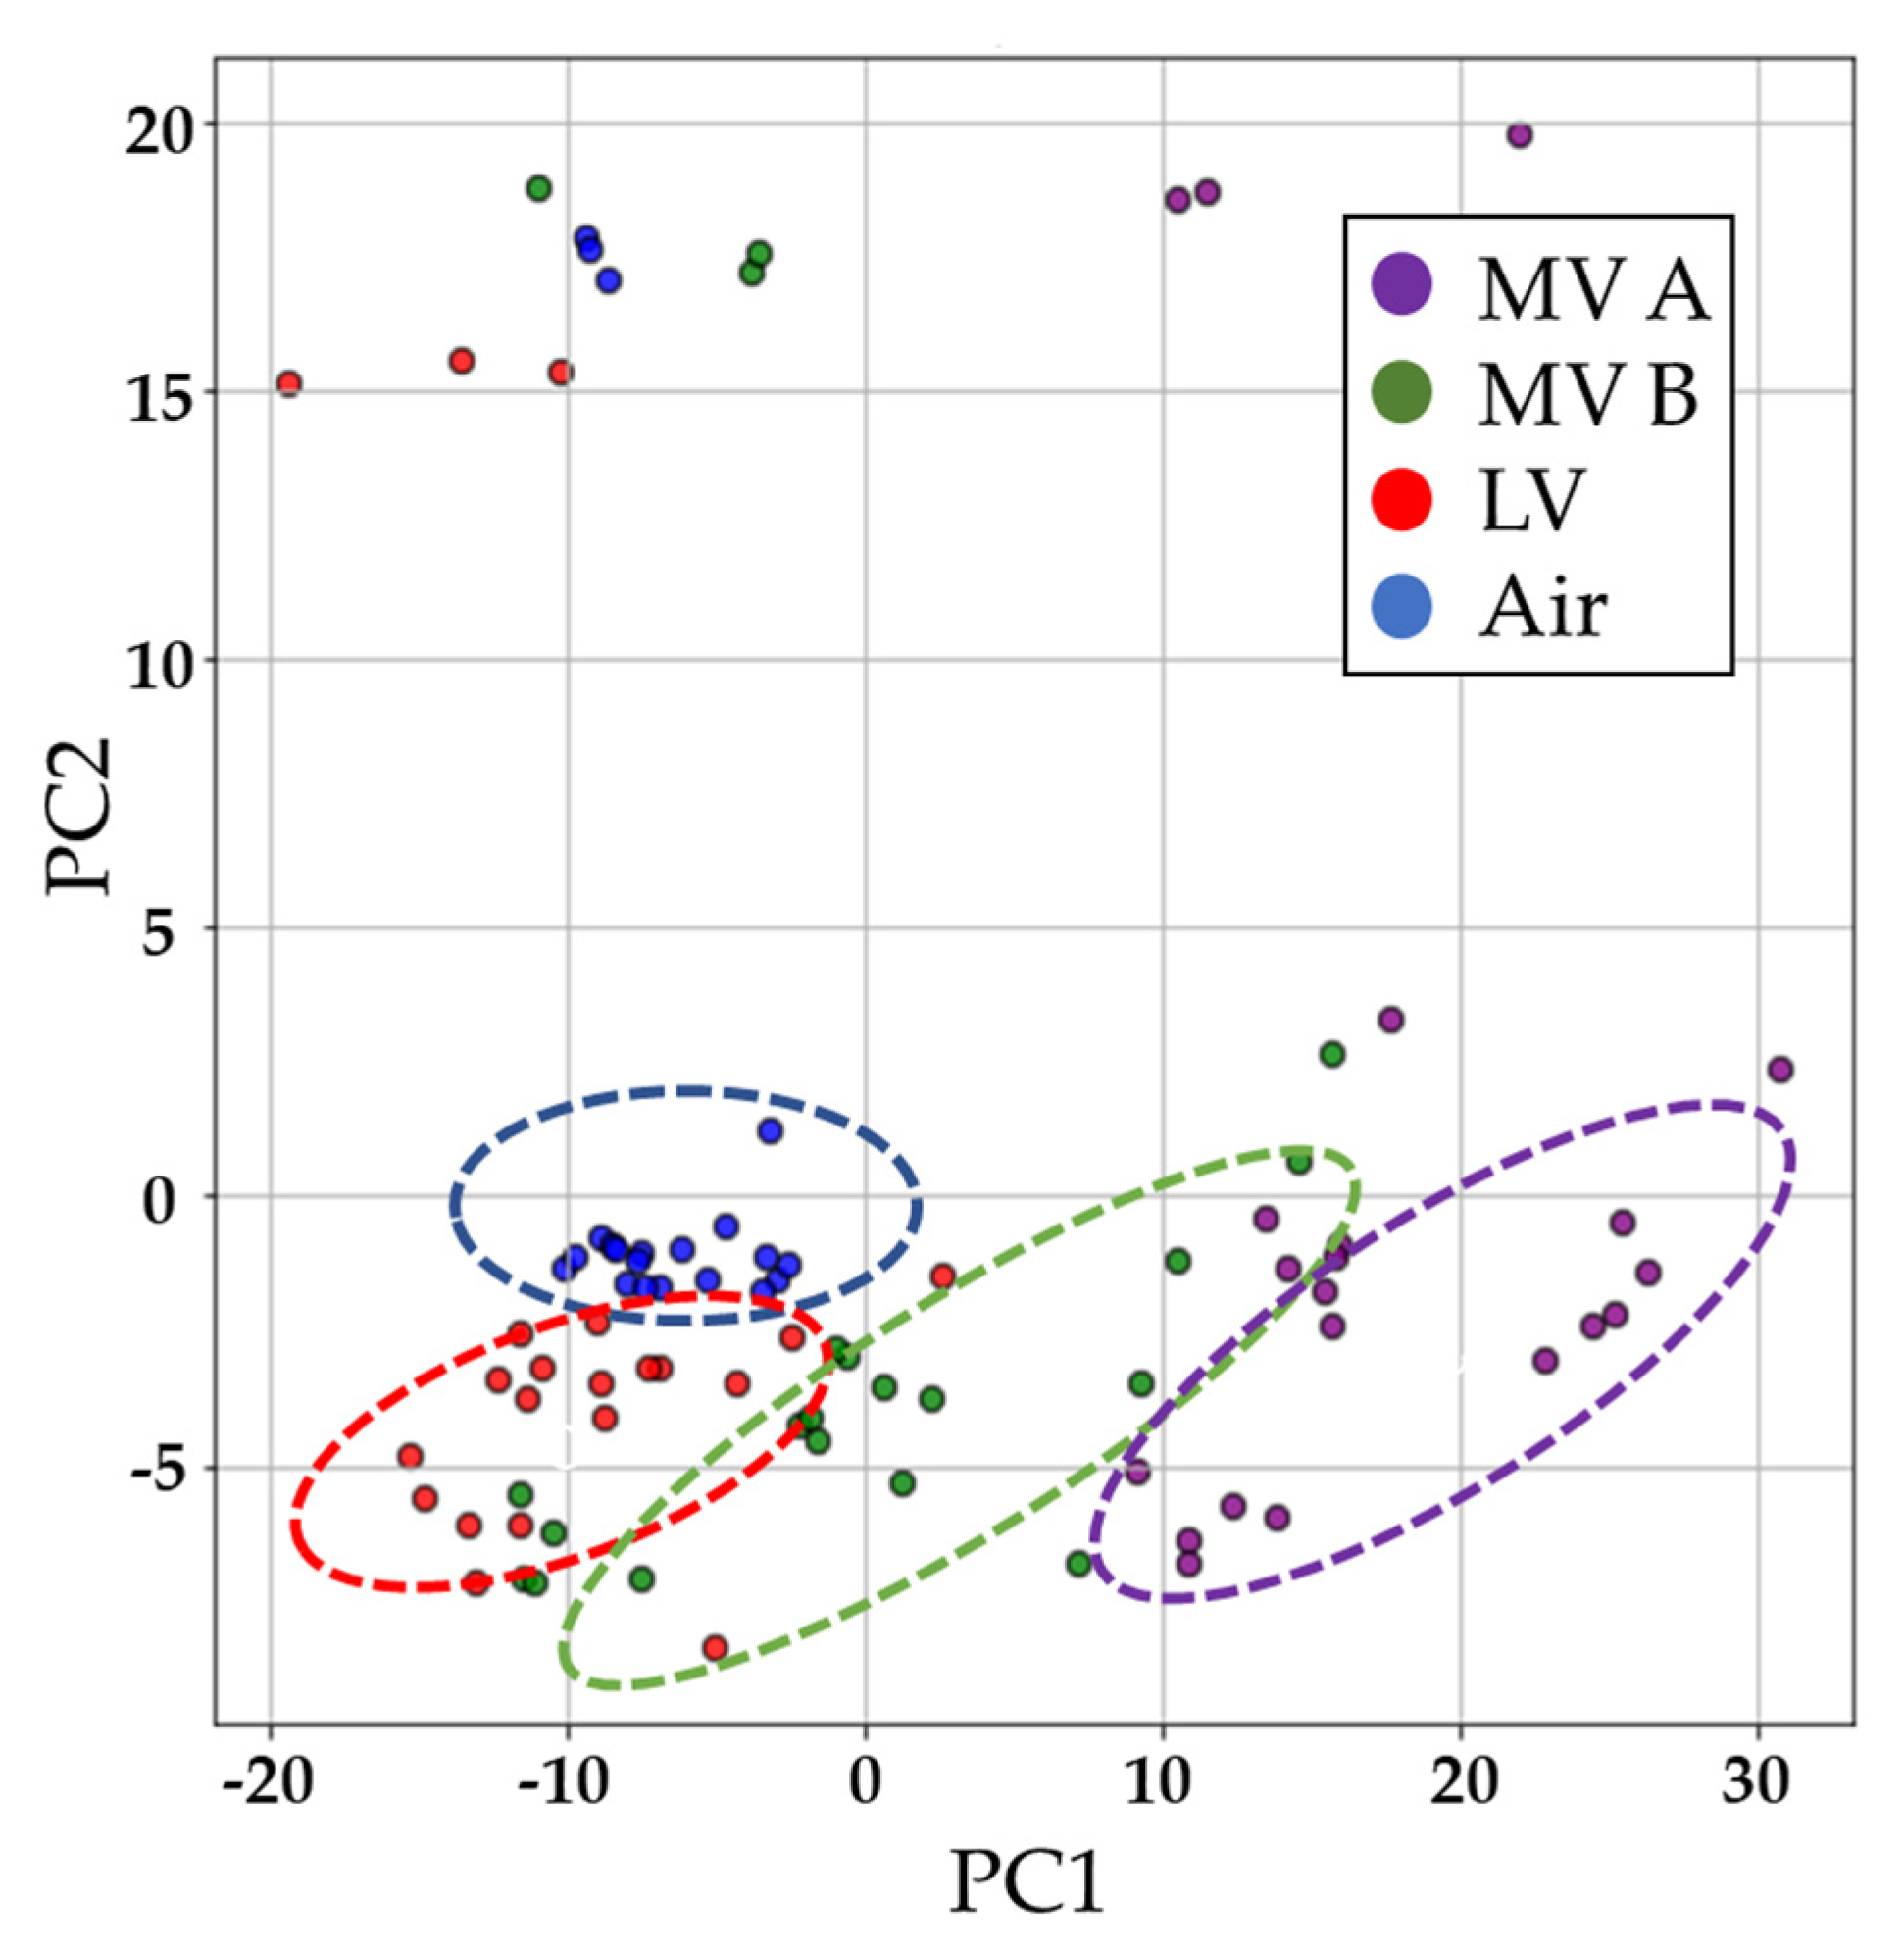
The three cables were heated to 270 °C and thermal decomposition products were detected using the odor sensing system. Empty bottles (air) were used as the control group. As shown in
Figure 6, at 270 °C, the PCA results of three different cables were distributed in different areas and did not coincide with those of the control group. Those results mean that the data collected by the odor sensing system enable us to distinguish well different types of cable.
As shown in
Table 3, various classifiers were used in this experiment for machine learning. Similar results were obtained when the linear kernel SVM, random forest classifier, MLP classifier, and logistic regression were used. Recognition accuracies reached about 70% to 85% when using both arrays with different classifiers. Therefore, it can be considered that the artificial olfactory system with both arrays A and B can distinguish the gases generated from the three different overheated cables. Although we expect that different results can be obtained by using sensor arrays of different polarities, there is almost no significant difference in recognition accuracy because some of GC materials used were the same for both sensor arrays. Therefore, it is necessary to use as many different GC materials as possible to obtain different results.
Moreover, a portion of the gas generated partially decreases in content as it passes through the NaOH filter in this experimental system, which may result in limited differences in the responses produced by the gas. Therefore, the pretreatment of gases from overheated cables with other types of filters may improve sensing capability. In addition, we may be able to improve the identification accuracy by increasing the number of sensor channels and using more diverse GC materials.
3.3.2. Identification of Anomalies in the Early Stages of Overheating of Cables
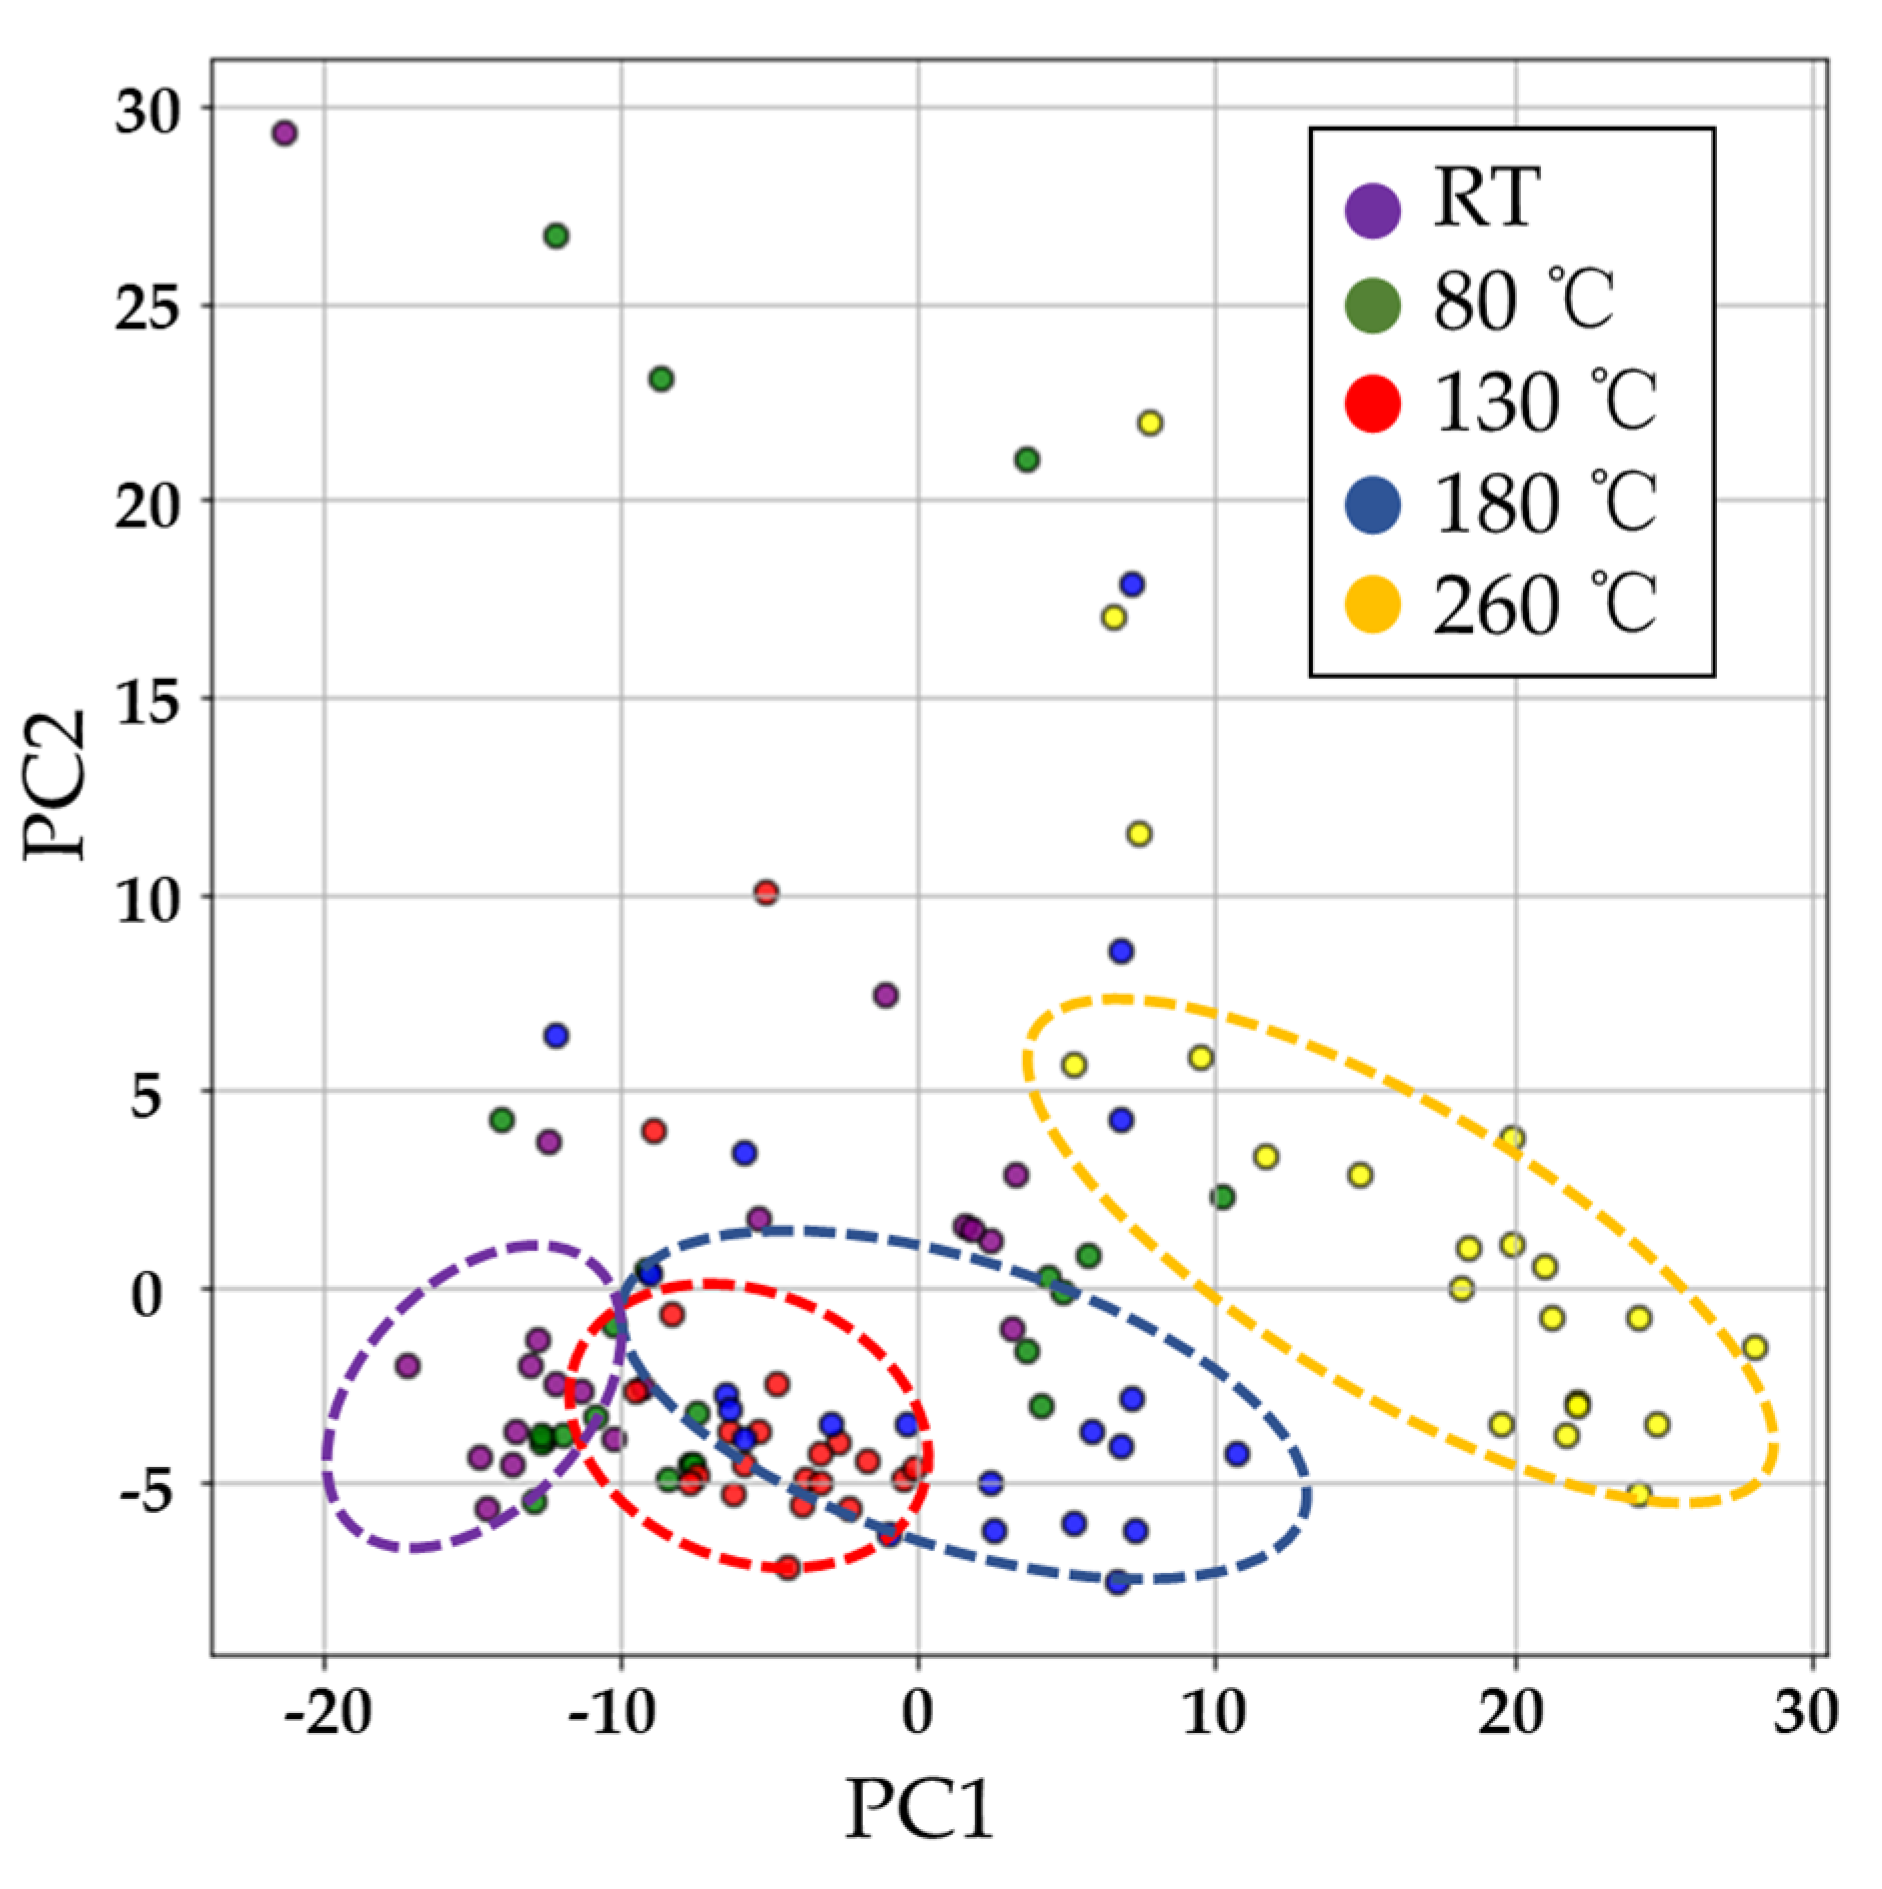
For the LV cable, we designed experiments to identify anomalies in the early stages of overheating. The PCA results of array A are shown in
Figure 7. There are 21 data points for each sample. With five temperature gradients from room temperature to 260 °C, the data points of the LV cable are distributed along PC1. PC1 correlates with the degree to which the wire is heated. The same samples tend to be aligned along PC2.
As shown in
Table 4, we calculated the identification accuracy using the data between RT and each heating temperature. When comparing the data of RT with 80 °C, the accuracy reaches only 40–60%. Since the LV cable can be used normally at 80 °C, a low recognition accuracy is tolerated. When comparing the data of RT with 130 °C or 180 °C, the accuracy is above 70%. The accuracy is higher when the temperature exceeds the allowable operating temperature. When the sample is heated to 260 °C, the recognition accuracy reached above 90%. However, when using the decision tree classifier, the recognition accuracies were lower.
To further evaluate the prediction results, we calculate the recall and precision rates of array A. The abnormal temperature was set at 130 °C, which exceeds the allowable operating temperature of the LV cable. The data points were divided into normal and abnormal groups. The data points measured at RT and 80 °C were the normal group. The data points measured at 130 °C, 180 °C, and 260 °C were the abnormal group.
As shown in
Table 5, the average recall rate of array A reaches about 90% except when using the decision tree classifier. The average precision rate reaches about 70%. The F-measure of this experiment is 76.8%, which indicates the balance between recall and precision rates. Based on the recall rate, about 90% of the anomalies will be detected and 10% will be missed. As can be seen from the precision rate, about 70% of the alarm judgments issued by the system are real abnormal situations and 30% of them are FPs.
An ideal alarm system should not miss any anomalies and should not be prone to issuing false alarms. The recall rate corresponds to the probability of how many anomalies the system can detect. The precision rate indicates the probability of true anomalies the system is alerting. In the development phase, the recall rate is more important than the precision rate in this study. Spotting anomalies are a priority for disaster prevention, although there may be some nuisance alarms.
Regarding the application of odor sensing systems to the detection of overheating of electric cables, recall should be prioritized over the precision rate. In other words, the probability of being detected when an abnormality occurs will be prioritized over a judgment error when an abnormality has not occurred. Since the recall rate has reached 90%, the odor sensing system used in this study can be considered to detect cable abnormalities significantly.
4. Conclusions
In this study, an odor sensing system with chemosensitive layers was used to detect the abnormal heating of electric cables. In the experiment, we used an LV cable and two types of MV cable as samples. The mass and heat release of these cables at different temperatures were investigated by differential thermal and thermogravimetric analyses. Furthermore, the gases generated from these cables were identified by GC-MS. At 270 °C, plasticizers were detected in different amounts. As shown by the TGA results, the mass of the cable gradually decreases with increasing temperature. From the DGA results, the heat release is very obvious above 270 °C, which means that the cable is likely to melt and burn. Therefore, the cables are considered to exhibit structural damage above 270 °C.
In addition, we made two types of sensor array with different GC materials to identify the generated gases. The odor sensing system trained with machine learning distinguished three different cable samples with an average accuracy of 75% at 270 °C. However, the recognition accuracy did not change significantly using both sensor arrays. When the abnormal temperature was set above 130 °C, the abnormal condition of the cables was determined with an average recall rate of 90% and an average precision rate of 70%.
We considered that the odor sensing system used in this study could significantly identify the gases generated from overheated cables before a fire occurs. Therefore, the odor sensing system has good application potentials for the detection of electric cable abnormalities. For a relatively closed distribution box, the odor sensing system may be able to identify the cables’ anomalies effectively. However, to apply the system in a relatively open environment, it is necessary to consider the interfering gases with different concentrations in future studies. In the future, the recognition accuracy is expected to be improved by using more diverse GC materials, increasing the number of sensor channels, and optimizing the pretreatment of the generated gas.


 ,
, 


