Article

Evaluation of Photosensitive Paper Coatings as Detectors for Instrumentation-Free UV Photometric Analysis Based on Photography-Based Photometry

by
Tatiana G. Choleva
,
Afroditi Sfakianaki
,
Athanasios G. Vlessidis
and
Dimosthenis L. Giokas
*
Department of Chemistry, University of Ioannina, 45110 Ioannina, Greece
*
Author to whom correspondence should be addressed.
Chemosensors 2021, 9(8), 233; https://doi.org/10.3390/chemosensors9080233
Submission received: 18 June 2021 / Revised: 12 August 2021 / Accepted: 18 August 2021 / Published: 20 August 2021
(This article belongs to the Section Materials for Chemical Sensing)

Abstract

:
Photography-based photometry is a technique developed to perform high throughput UV photometric analysis without instrumental detectors in resource-limited settings. Its principle relies on the illumination of a sample with UV irradiation and then capturing the transmitted irradiation on a photosensitive paper surface. Therefore, the photosensitive surface acts as a detector for the determination of the concentration of analytes in the sample. This work aims to investigate the optimum photosensitive paper coatings for capturing the transmitted UV irradiation. To this end, photosensitive coatings based on silver, iron, and dichromate salts were tested using three assays of pharmaceutical and biochemical interest. The results from both calibrations, using standard solutions and the application in real samples, show that photosensitive coatings based on iron salts provide the best results. Importantly, the detection limits and the linear range of the calibration curves were better than those obtained with standard photometry. Based on these findings, cyanotype green papers, are proposed as optimum detectors for photography-based photometry. This finding simplifies the operation of the technique enabling the fabrication of prototype readers for analytical assays performed in resource limited settings, point-of-need applications or in the field.

1. Introduction

Consumer electronic devices such as smartphones, scanners, tablets and CD/DVD/Blu-Ray disc players, have been increasingly used as analytical detectors to replace bulky and expensive laboratory instrumentation and offer analytical testing at the point-of-need (i.e., field tests in environmental, agricultural, public safety, etc. applications) or at the point-of-care (at the bedside, medical self-testing, etc.) [1,2]. These devices are either used to capture and process an optical signal generated from a colorimeric, photometric or (chemi)luminescence chemical reaction or include an appropriate module that enables the conversion and processing of electrical (electrochemical) signals [3,4,5].
The most popular applications of consumer electronic devices are colorimetric and photometric assays since color or transmitted light can be easily captured by cameras both from solid surfaces and liquid samples, respectively [3,4,6,7,8,9]. However, all these assays or methods are performed in the visible range of the electromagnetic spectrum since cameras can acquire and process only visible light. Therefore, photometric methods performed in the UV region of the electromagnetic spectrum cannot be performed with such devices. To overcome this limitation, we have recently developed a simple technique named photography-based photometry, that relies on the principles of 19th century photography and is specifically designed to perform photometric assays in the UV region [10]. In this approach, a liquid sample containing the UV absorbing compounds is added in a sample holder (e.g., cuvette or microtiter well plate) and placed in front of a photosensitive paper (Figure 1). When the sample is illuminated with the appropriate wavelength, the UV irradiation is absorbed by the target molecules while the transmitted irradiation reaches the surface of a photosenstised paper causing its photoreaction. In this manner, a colored image appears on the surface of the photosensitive paper and its intensity is reversibly proportional to the concentration of the analytes in the sample (i.e., the more light is absorbed by the sample, the more faint the coloration on the paper surface is). By appropriately configuring the device and optimizing its operation we were able to develop a device configuration of general utility for all assays that employs one setup in terms of irradiation distance, angle of light source from the sample holder, sample volume, and irradiation intensity. Based on this configuration, we demonstrated that photography-based photometry can be used to perform high-throughput photometric assays in the UV region of the electromagnetic spectrum without scientific equipment producing accurate and reliable results in the analysis of various samples of environmental pharmaceutical and biomedical interest.
Except technical specifications, a crucial parameter determining the efficiency of photography-based photometry is the photosensitive paper coating. In our previous work, we have used two commercially available photographic papers composed of silver halide emulsions and iron salts (i.e., cyanotype green) as model detectors to develop and demonstrate the use of the method [10]. It was observed that each paper offered different sensitivity under the same experimental conditions. Moreover, the analytical results varied depending on whether the photosensitive papers were processed or not (according to the standard photographic practice of image development using appropriate washing procedures). Based on these data, we reasoned that the sensitivity of measurements should be optimized also with regards to the photosensitive coating and its response to UV light.
On these grounds, in this work, we examine a variety of photosensitive paper coatings in order to evaluate their performance with photography-based photometry. The coatings were composed of various mixtures of UV light-sensitive reagents including silver, iron, and dichromate salts (and mixtures of them) prepared according to modernized recipes of traditional early photography. Plain paper, photosensitized with these coatings, was used as a detector for various assays of pharmaceutical and biochemical interest based on different principles (i.e., absorbance increase and quenching) at three wavelengths (254, 312, and 365 nm) that cover the entire range of UV spectrum. The results from the analysis of both standard solutions and real samples were used to find the best photosensitive coating that can be used for a wide range of assays, thus develop an integrated detection strategy for instrumentation-free assays performed in the UV region.

2. Materials and Methods

2.1. Chemicals and Materials

All reagents were of analytical grade unless otherwise stated. Ellman’s reagent, paracetamol, hydrogen peroxide, ammonium chloride, magnesium sulfate, magnesium chloride hexahydrate, sodium chloride, sodium sulfate, sodium bicarbonate, sodium bromide, sodium iodide, sodium acetate, dipotassium hydrogen phosphate, potassium dihydrogen phosphate, citric acid, potassium chloride, calcium chloride dehydrate, uric acid, d(+)-glucose, creatinine a-tocopherol were purchased from Sigma-Aldrich (Steinheim, Germany). Potassium iodate and citric acid were purchased from Mallinckrodt (Dublin, Ireland). Glycine (Gly), Lysine (Lys), and Valine (Val) were supplied by Serva Electrophoresis GmbH (Heidelberg, Germany). Urea (>99.5%) was purchased from Pharmacia Biotech AB (Uppsala, Sweden). Silver nitrate and potassium dichromate were obtained from Merck (Darmstand, Germany). Gum Arabic and aquarelle paper (No.2, 220 gsm) were purchased from local stores (Ioannina, Greece). Silver halide photographic paper (MULTIGRADE IV RC DELUXE Satin Sheets, 190 gsm, resin coated) was purchased from ILFORD (Harman Technology Ltd., Worcester, UK). Cyanotype green papers (natural fiber, hydro-milled, hot pressed, double-sided paper with smooth surface) were obtained from Cyanotype Store (Burton, WA, USA). Cyanotype blue papers were purchased from Parallax Photographic Coop (London, UK). The dark side of both papers was used for the experiments.

2.2. Equipment and Instrumentation

UV Transparent, non-sterile, 96-well colorless microtitration plates (BRANDplates®, pureGrade™, 80% transmission at 240 nm) (Wertheim, Germany) with a flat bottom were used as a sample holder. A mask of each well was prepared with a Silhouette Cameo cutting machine using filter paper that was adhered at the bottom of the plate to isolate each well and avoid light diffusion between adjacent wells. The solutions placed inside the plates were irradiated in a Vilber Lourmat Bio-Link® BLX Crosslinker UV illumination chamber (internal chamber dimensions H × D × W: 14.5 cm × 33 cm × 26 cm) to ensure constant and uniform exposure of the samples to UV light (max 4 W cm−2), as well as to protect users from UV light. Vilber Lourmat tubes (211 mm length, 8 W) were placed at the fixed positions in the illumination chamber (at a distance of 3 cm from each other). UV tubes of different wavelengths (254, 312, and 365 nm) were used as a light source to irradiate the samples at 40 W. Images of the photographic paper were captured with a flatbed scanner (PerfectionV370 Photo, Epson, Athens, Greece) in reflectance mode by disabling all automatic correction factors to avoid image manipulation. Color intensity on the images corresponding to the sample areas was measured with Image J (NIH, Bethesda, MD, USA) as the mean grey area intensity in the RGB color system. UV-Vis spectra were recorded in a Jenway 6405 UV-Vis spectrophotometer (Cole-Palmer, Staffordshire, UK) using matched quartz cells of 1 cm path length.

2.3. Principles and Calibration of the Assays

For the calibration of the paracetamol assay, paracetamol standard solutions were prepared in distilled water (5–200 mg L−1). Measurements were performed at 254 nm by measuring the increase in the absorbance of the solutions with increasing paracetamol concentration. The calibration of the Ellman’s was performed by adding defined amounts of l-Cysteine stock solution (1 mM in distilled water) in phosphate buffer (0.1 M, pH 8.0) and 250 μL of the Ellman’s reagent (0.44 mM), respectively to a final volume of 2 mL. This assay is based on the stochiometric reaction of the Ellman’s reagent with a thiolate anion of cysteine yielding a mixed disulfide and the yellow colored dianion of 2-nitro-5-thiobenzoic acid. As a result of this reaction, the initial absorbance of Ellman’s reagent at 312 nm is quenched and a new peak at 410 nm appears. In this work, we measured the absorbance quenching of Ellman’s reagent with increasing cysteine concentration. Finally, for the calibration of the H2O2 assay, defined amounts of H2O2 stock solution (2 mM) were added in distilled water. Then, 1 mL of phosphate buffer (0.1 M, pH 7.2) and 1 mL of KI (5 mM) were mixed into the solution to a final volume of 3 mL. In principle, this assay makes use of the oxidative capacity of hydrogen peroxide to convert iodide to triiodide, which can be measured photometrically at 365 nm.
In all assays, the photosensitive papers were used as follows: Silver halide, van dyke brown, and gum dichromate coated papers were used without image development. Blue and green cyanotype papers and salted paper were developed by washing the paper with water and air drying at room conditions away from light exposure. The images were scanned at 300 DPI and the color intensity was determined as the mean grey area in the RGB color system.

2.4. Analysis of Real Samples

Commercial effervescent paracetamol tablets were purchased from local pharmacies and dissolved in distilled water. The solutions were filtered through 0.20 μm filters to remove any un-dissolved excipients and diluted as appropriate with distilled water. The analysis of paracetamol was performed at 254 nm.
The analysis of biothiols and H2O2 (produced from the catalytic oxidation of glucose from glucose oxidase) was performed in simulated blood plasma that was prepared according to our previous works, with some improvements [11,12]. In more detail, artificial blood plasma (ABP) was firstly prepared by mixing 137.5 mM NaCl, 4.2 mM sodium hydrogen carbonate, 3.0 mM KCl, 0.5 mM disodium hydrogen phosphate, 0.5 mM MgCl2, 2.64 mM CaCl2, and 0.5 mM Na2SO4 in distilled water and adjusting the pH at the value of 7.4 [13]. Simulated blood plasma (SBP) was prepared by enriching of ABP with glucose (5.0 mM), urea (3.0 mM), a mixture of 3.0 mM of common amino acids found in blood plasma (0.5 mM of glutamine, glycine, valine, arginine, lysine and alanine), l-cysteine (250.0 μM), uric acid (220 μM), creatinine (30.0 μM), ascorbic acid (20.0 μM), and a-tocopherol (20.0 μM). A portion of this sample was diluted in phosphate buffer (0.1 M, pH 8.0) and used for the analysis of cysteine using the Ellman’s reagent at 312 nm [14]. For the analysis of H2O2, an aliquot of SBP sample was diluted with phosphate buffer (0.1 M, pH 7.2). Then, 0.21 mg/mL of GOx were added and the mixture was incubated at 35 °C for 30 min [15]. After cooling, 1.7 mM of KI was added and the determination of H2O2 concentration was performed at 365 nm, corresponding to the oxidation of KI towards the formation of triiodide [16].

3. Results

3.1. UV Sensitivity of Photosensitive Paper Coatings

The foundation of early photography is the modification of paper with a light sensitive coating that undergoes a chemical transformation (i.e., reduction) upon exposure to UV irradiation [17]. The photoreduced coating is immobilized on the paper surface, while the unaffected coating can be chemically washed away, in a process called image development. When an object is placed in front of the light sensitive coating during exposure to UV light, it will absorb or reflect the incident irradiation and act as a mask of UV light protecting the photosensitive coating from photoreduction. Thus, upon development with the appropriate chemical solutions only the photoreduced coating remains in the surface of the paper producing a visible image [17].
Over the past century, different UV sensitive coatings have been evaluated that almost invariably rely on the UV light sensitivity of metal salts of silver, iron, and dichromate. Silver-based coatings rely on the photosensitivity of silver halide salts that are either immobilized in situ on the paper surface (salt prints) or are embedded in a transparent gelatin colloid that is used to cover the paper surface (silver emulsions) [18]. Iron-based coatings are based on the sensitivity of Fe (III) salts to UV light. Upon exposure to UV irradiation Fe (III) is reduced to Fe (II) which in turn complexes with ferricyanide ion, to form the insoluble ferric ferrocyanide—iron (III) hexacyano-ferrate (II) complex, widely known as Prussian blue [19]. A combination of silver and iron salts, known as van Dyke brown printing, has been also developed relying on the UV mediated photoreduction of Fe (III) to Fe (II) which reduces Ag+ to metallic silver (Ag0) forming an image [17,18]. The gum dichromate photographic technique exploits the photosensitivity of dichromate salts to UV light, producing a sepia brown (tan) coloration. The main difference from the other techniques is that dichromate anions are mixed with an organic colloid (typically gum Arabic) which hardens upon exposure to UV light and is immobilized on the paper surface [17]. Many modifications to the above techniques have been also developed (for example, by replacing silver with platinum in van dyke brown prints to produce platinotypes) but they were not considered in this work since they rely on the same principles, and they only produce photographs of different colors and contrast, which was beyond the scope of this study.
Photographic techniques and their variants have been widely developed and optimized regarding image quality and stability. Therefore, to employ these coatings as photometric detectors it is important to determine the response of photosensitive coatings to UV irradiation of various wavelengths and determine the absolute differences in the color intensity between developed and not developed coatings. Such information is unknown as they were beyond the scope of conventional photography. In that regard, we firstly investigated the color transitions and the signal intensity (as the mean grey area intensity) of the photographic paper coatings before and after exposure to UV light of variable wavelengths. Considering that the UV spectra is divided into three bands: UVA (315–400 nm), UVB (280–315 nm), and UVC (100–280 nm), we determined the color signal intensity of photosensitive paper coatings at three wavelengths (254, 312, and 365 nm) as representative wavelengths of UV irradiation before and after development.
In our previous work, we have determined the mean grey area intensity of each coating before and after development of the photosensitive coating following its exposure to UV light of variable wavelengths. In this work, we expand this study by investigating the net mean grey area intensity calculated as the absolute difference of the mean grey area intensity before and after development. This approach is more closely related to the use of photosensitive coatings for analytical measurements since the net analytical signal is derived from the difference between the mean color intensity of the blank and the sample. The photographs of Figure S1 were used to determine the net signal intensity which is graphically depicted in Figure S2. To facilitate the comparison, the absolute difference between the color intensity of the blank and the sample is demonstrated, since in some coatings the difference produced negative values (indicated with an asterix) suggesting that the color of the developed images is brighter than the non-developed images. From these graphs, it can be seen that the largest net signal intensity is obtained from silver halide papers which also show no selectivity for UV light wavelength (i.e., similar signals were obtained at all wavelengths). This is explained by the different mechanisms that are responsible for image development in silver halide emulsions, as compared to other photosensitive coatings. More specifically, irradiation of silver slats results in the reduction of Ag+ to Ag0 on the silver halide crystal surface. In photography, this causes a “latent-image” that is invisible to the bare eye. During image development (with appropriate reducing agents) the Ag0 acts as an autocatalytic center that enhances the photoreduction of adjacent Ag0 ions resulting in the formation of an image [18,20]. In contrast, in other photosensitive coatings only the areas exposed to UV irradiation are affected and are immobilized on the paper surface.
With regards to other photosensitive papers, salted paper and both types of cyanotype papers (green and blue) show increased sensitivity with increasing wavelength while van dyke brown and gum dichromate papers show a noticeable decrease of sensitivity at 312 nm. The implications of these findings are discussed further below in more detail. It should be noted that the development process involved in silver halide emulsions is too complex involving the use of a series of chemicals for its development and strictly requires darkroom conditions [10,20]. On the other hand, all other papers can be developed under room light by simply washing with water [17], thus significantly facilitating their use even by non-experts which is desirable for analytical applications.

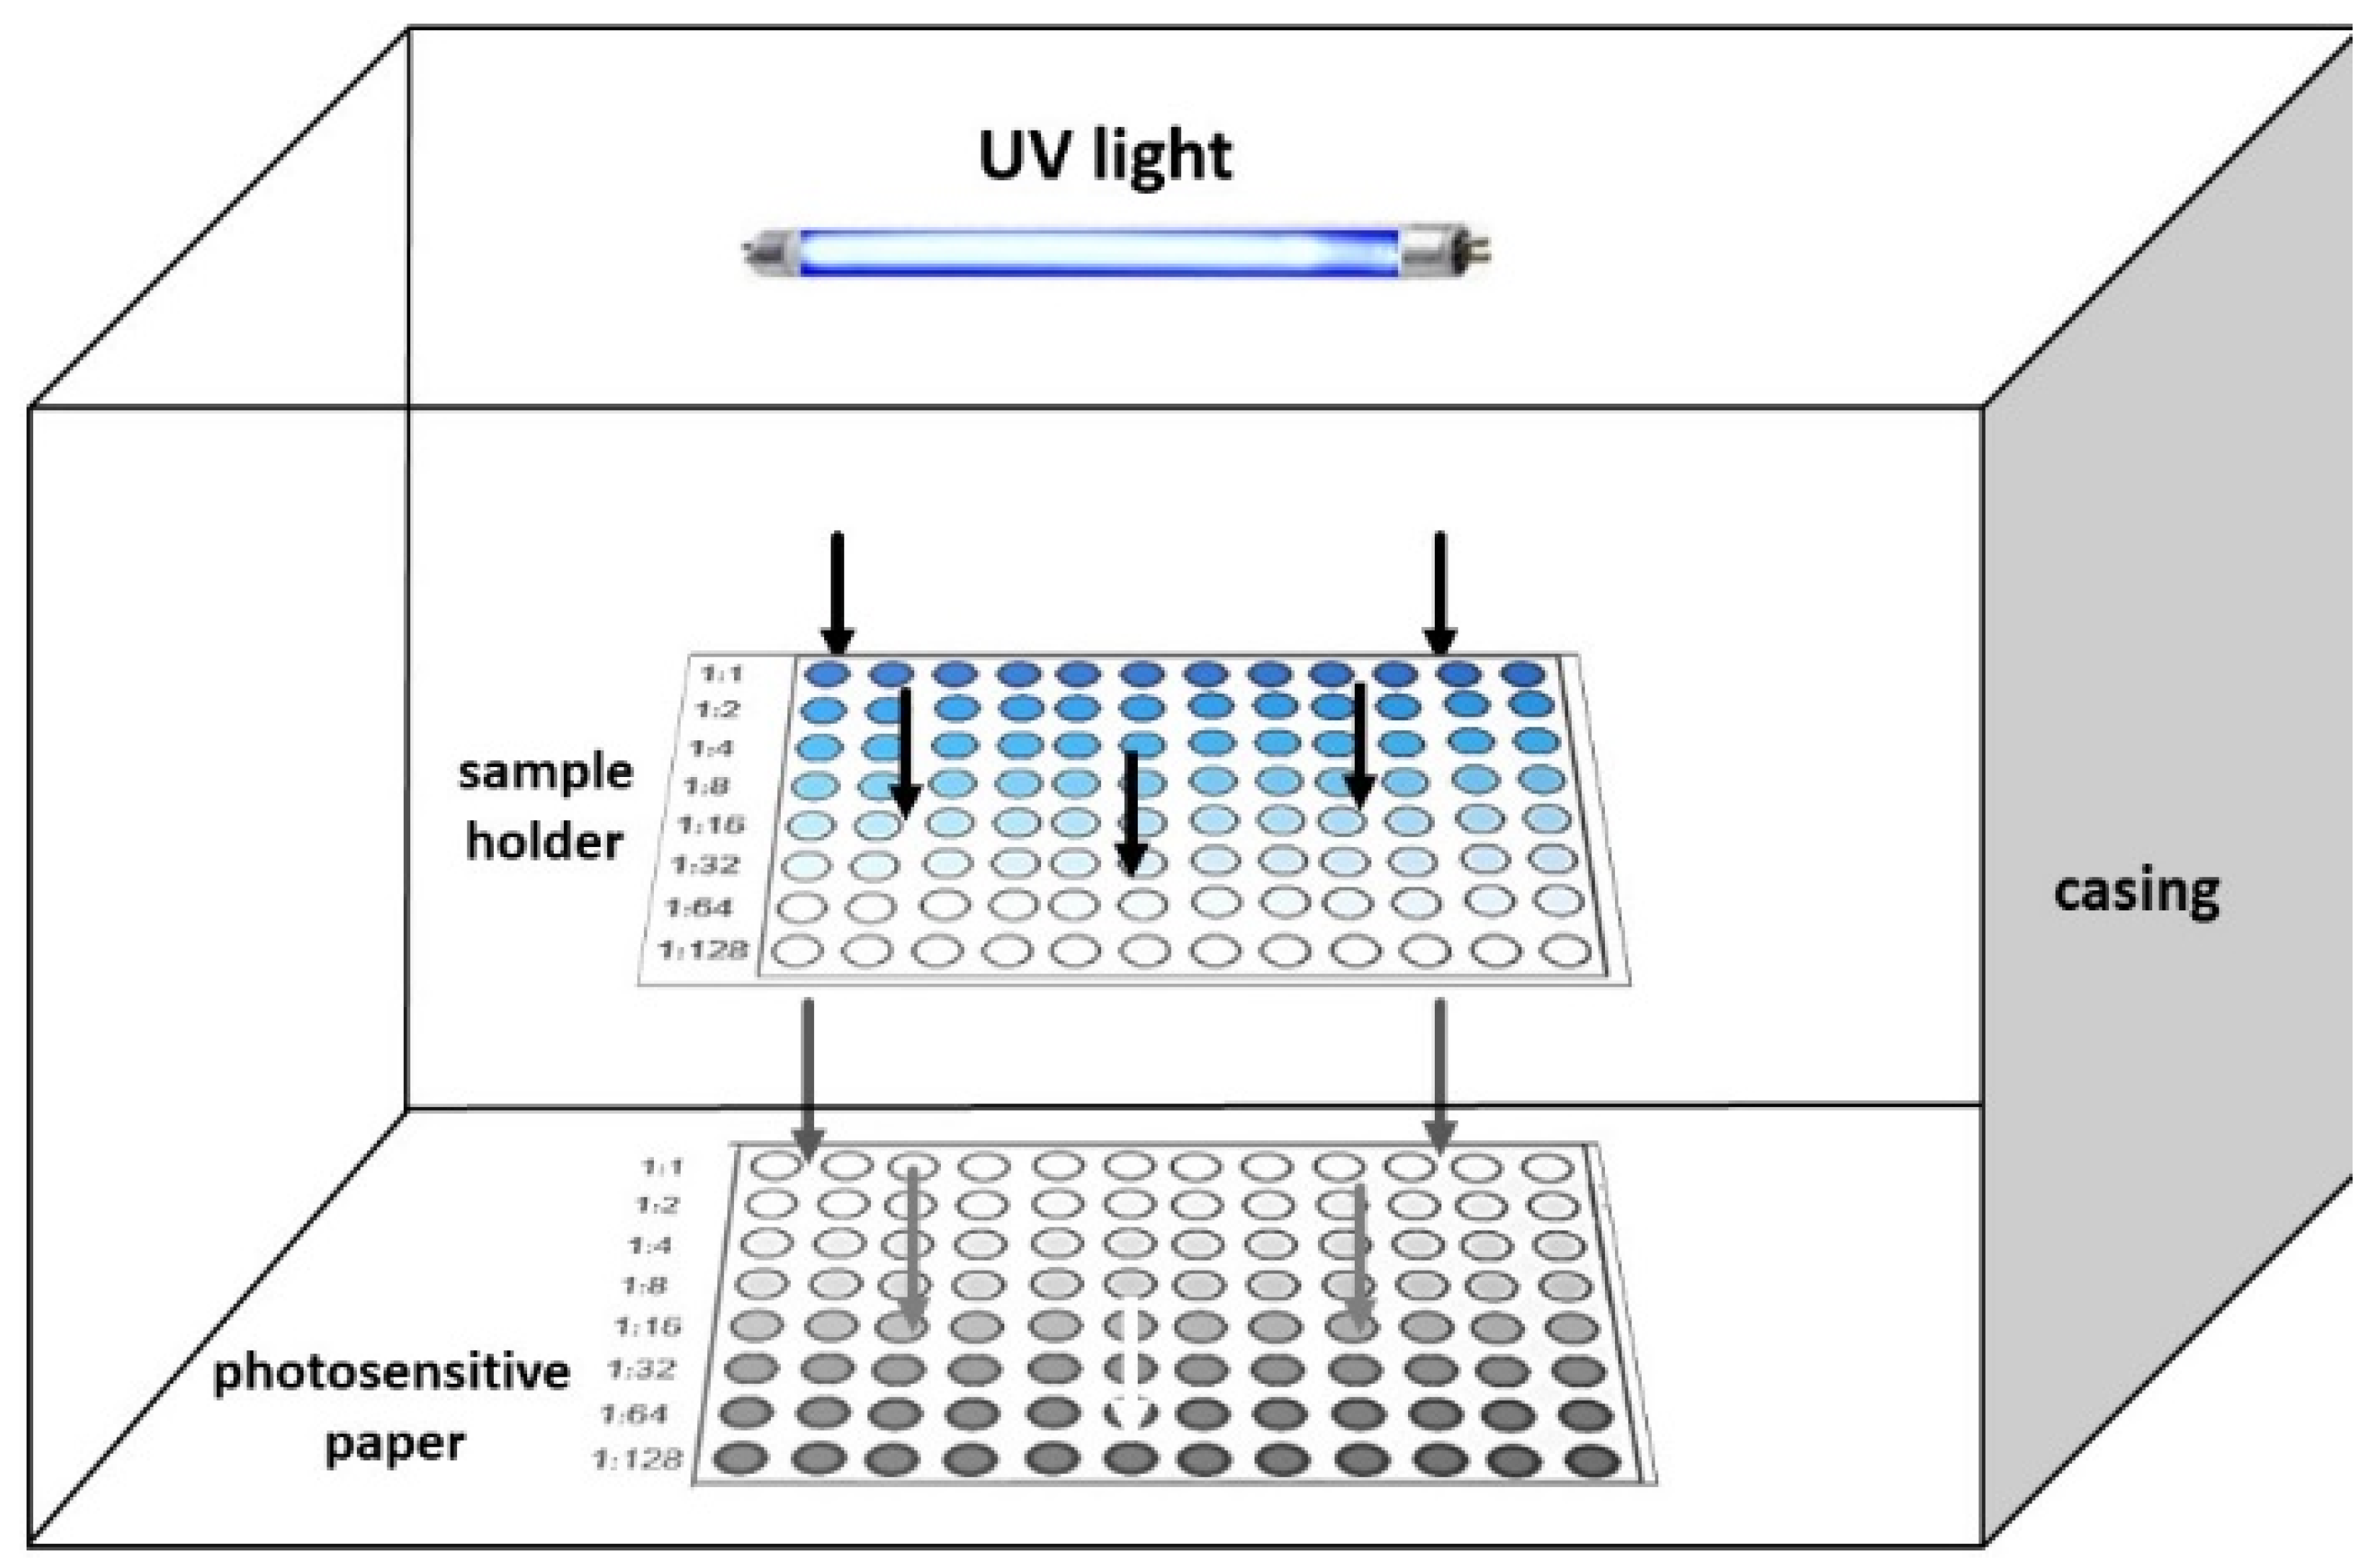
3.2. Configuration of Photographic-Based Photometry and Optimization of the Assays

The setup of the photographic-based photometric device was based on the optimized configuration described in our previous work [10]. Specifically, a photosensitive paper was adhered to the bottom of the sample holder (microtiter plate) right below the photomask. The plate was placed in the middle of the illumination chamber so that all wells are located at an angle of 0–45° from UV light tubes at a 15 cm distance. All measurements were performed at 40 W of light intensity.
Three assays based on different principles (i.e., absorbance increase and quenching) were used to investigate the analytical merits of various photosensitive paper coatings; the determination of paracetamol at 254 nm, the determination of thiols by measuring the absorbance quenching of the Ellman reagent-cysteine complex at 312 nm, and the determination of H2O2 by measuring the triiodide produced from the oxidation of H2O2 by iodide at 365 nm. In all assays the working wavelength was close to the peak wavelength (Figure S3). By adopting the optimum experimental conditions for each assay reported in the literature, the assays were optimized with regards to (a) irradiation time for each photosensitive paper coating and (b) the development of the images according to the standard photographic practice.
The experiments with variable irradiation (exposure) times showed that too short or too long irradiation times both gave narrow dose-response curves. In the first case, the light transmitted through the sample was not adequate to photoreduce the photosensitive coating, while in the second case the color on the photosensitive surface reached saturation. Therefore, the best irradiation time for each photosensitive coating and assay was selected on the basis of reproducibility of the measurements and the range of dose-response curves. The selected values are summarized in Table 1. According to these values, the time of analysis is higher than that required in standard photometry. However, since the analysis is performed in microtiter plates, the time of analysis per individual sample is significantly lower than the conventional photometry performed in cuvettes and significantly cheaper than the conventional photometry performed both in cuvettes and in microtiter plates.
To optimize image development, we prepared calibration plots using standard solutions of the analytes and used the photosensitive papers to capture the transmitted UV irradiation. The photosensitive papers were scanned to acquire an image of the samples and then each paper was developed according to the standard practices performed in photography [13]. From this study, it was revealed that image development offers better image quality and higher color intensities as compared to the undeveloped papers for green and blue cyanotype, salted paper, and silver halides. On the other hand, image development had a negative effect on the linearity of the calibration curves and the signal intensities with the van dyke brown and gum dichromate papers. Moreover, the development procedure for silver halide emulsions was too complex, requiring the washing of the paper with a series of chemical solutions under dark room conditions [10]. Therefore, even though the results obtained with developed silver halide emulsion images were good, the overall experimental effort was too demanding for the intended use and was omitted from the remaining study. On these grounds, the images recorded on silver halide emulsions, van dyke brown and gum dichromate papers were used to measure the mean grey area intensity without image development, while the developed images were used for the other papers.

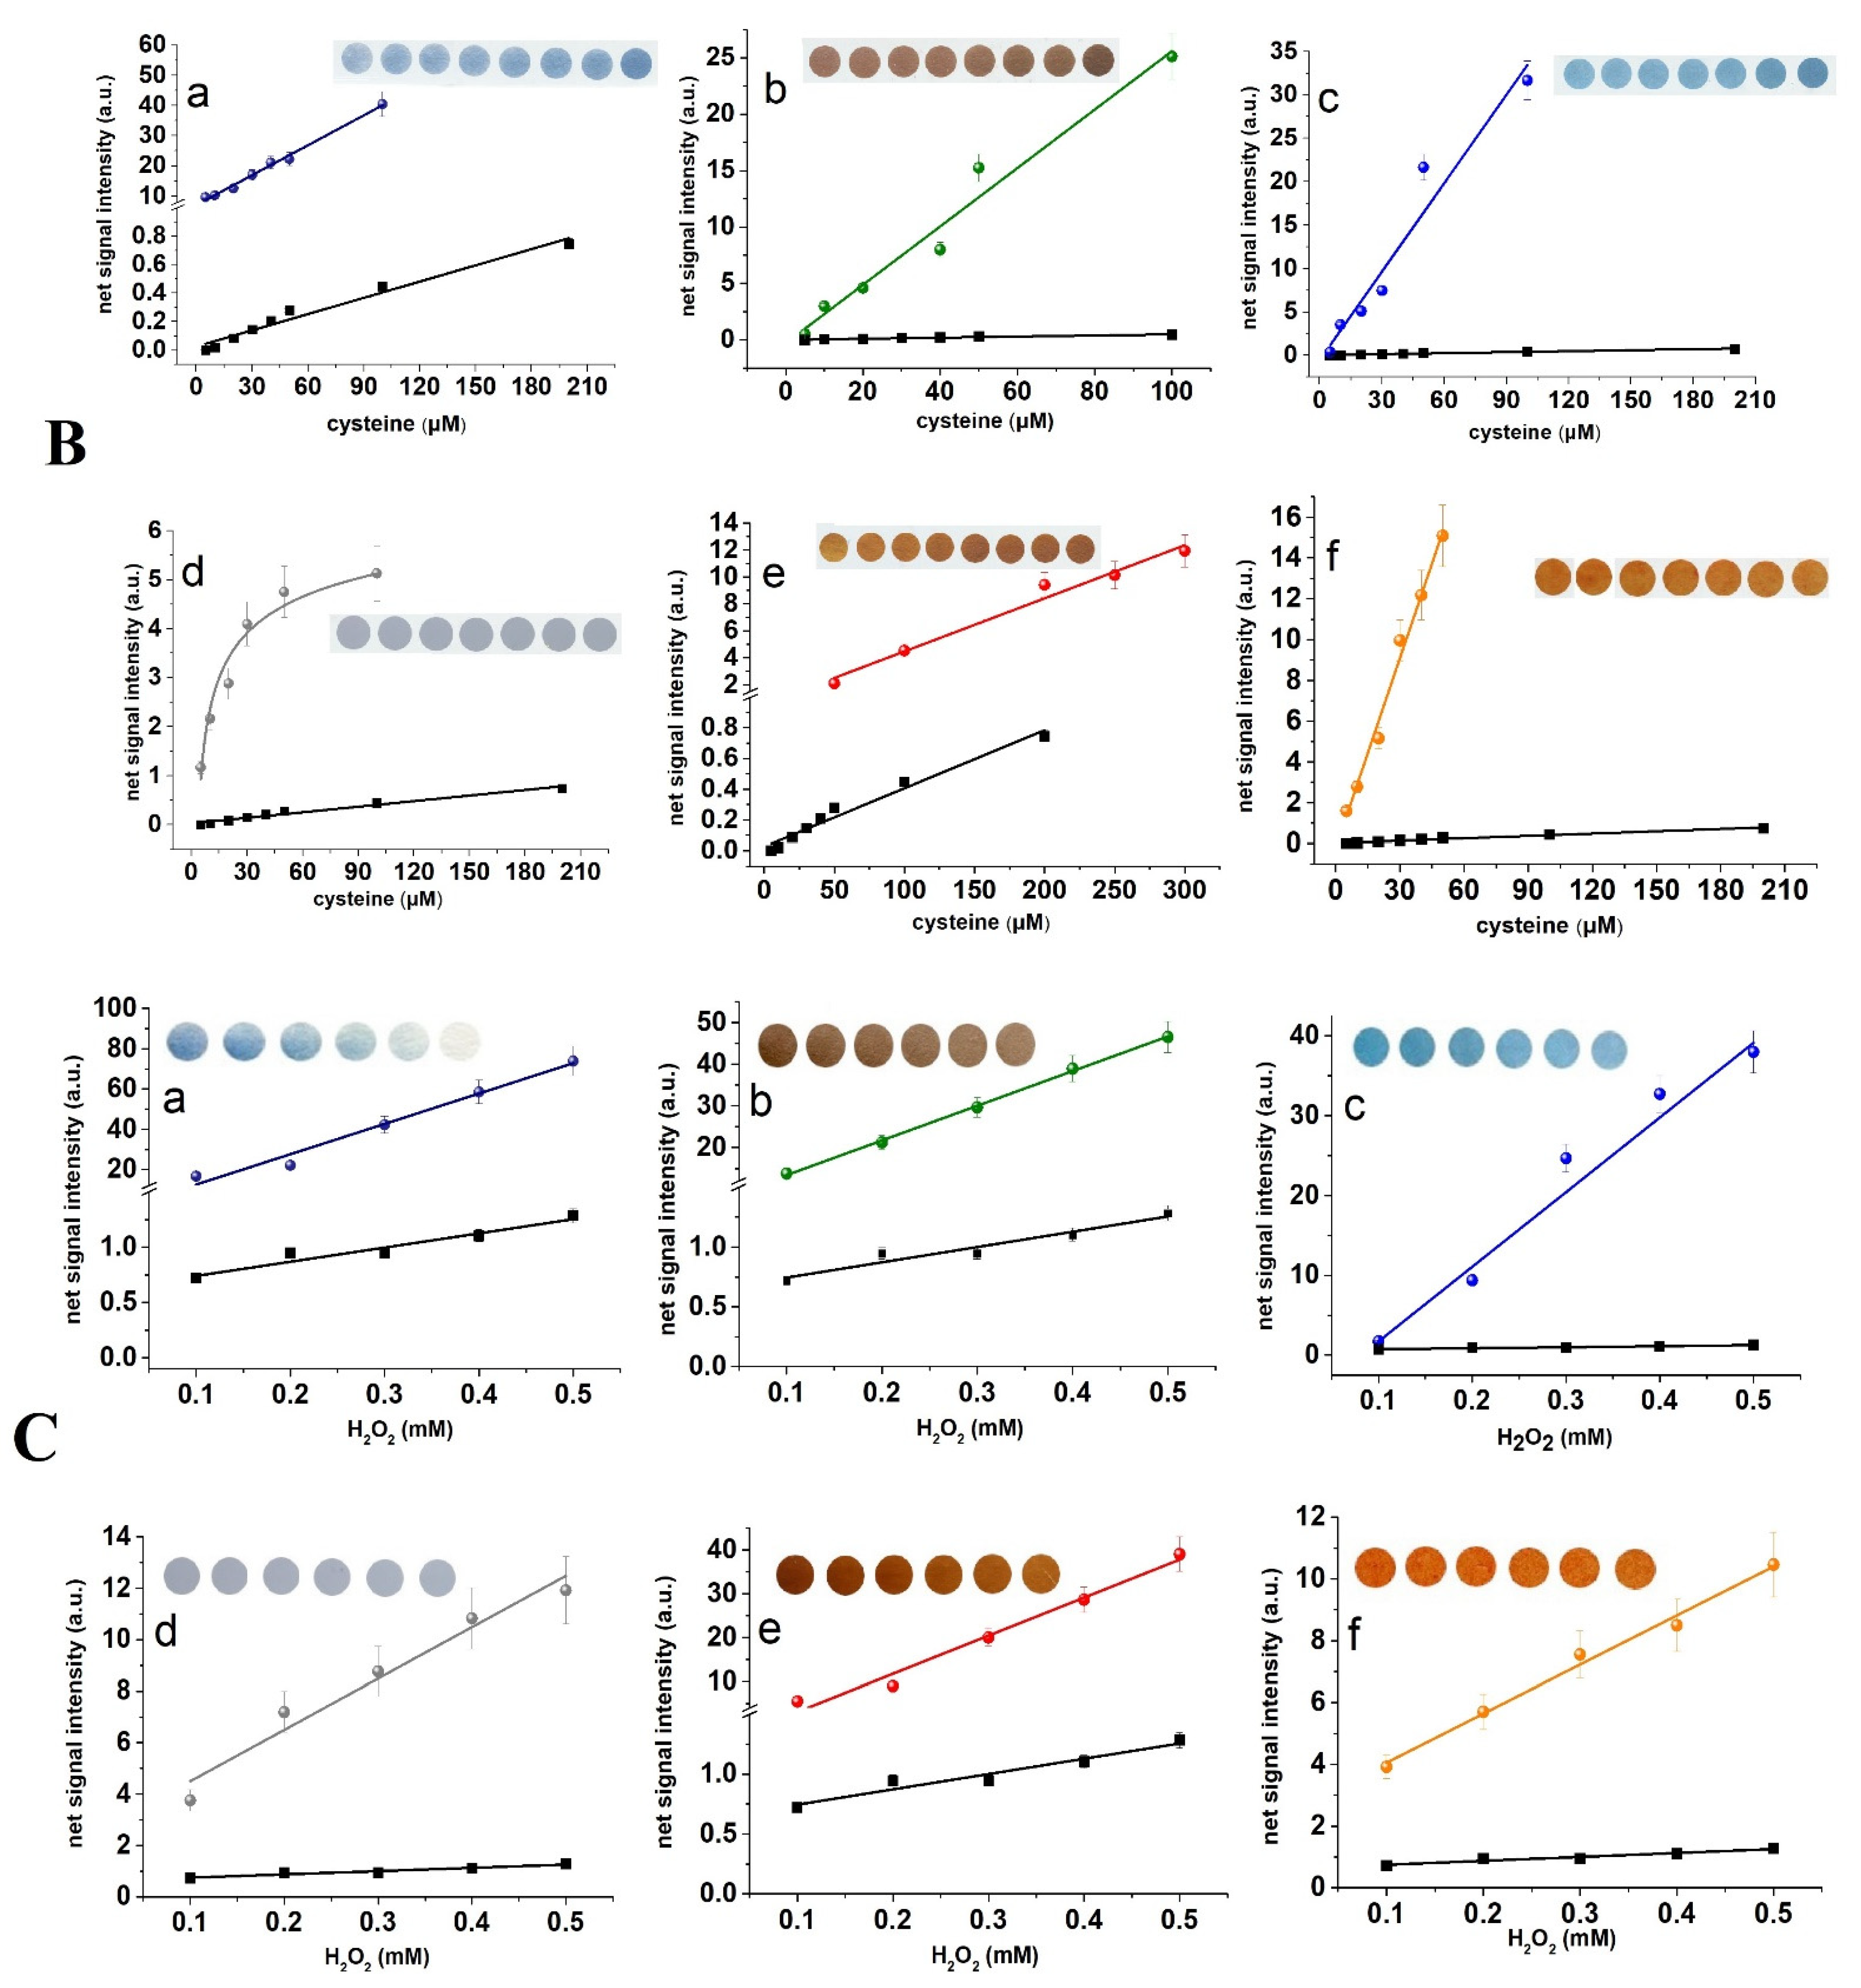
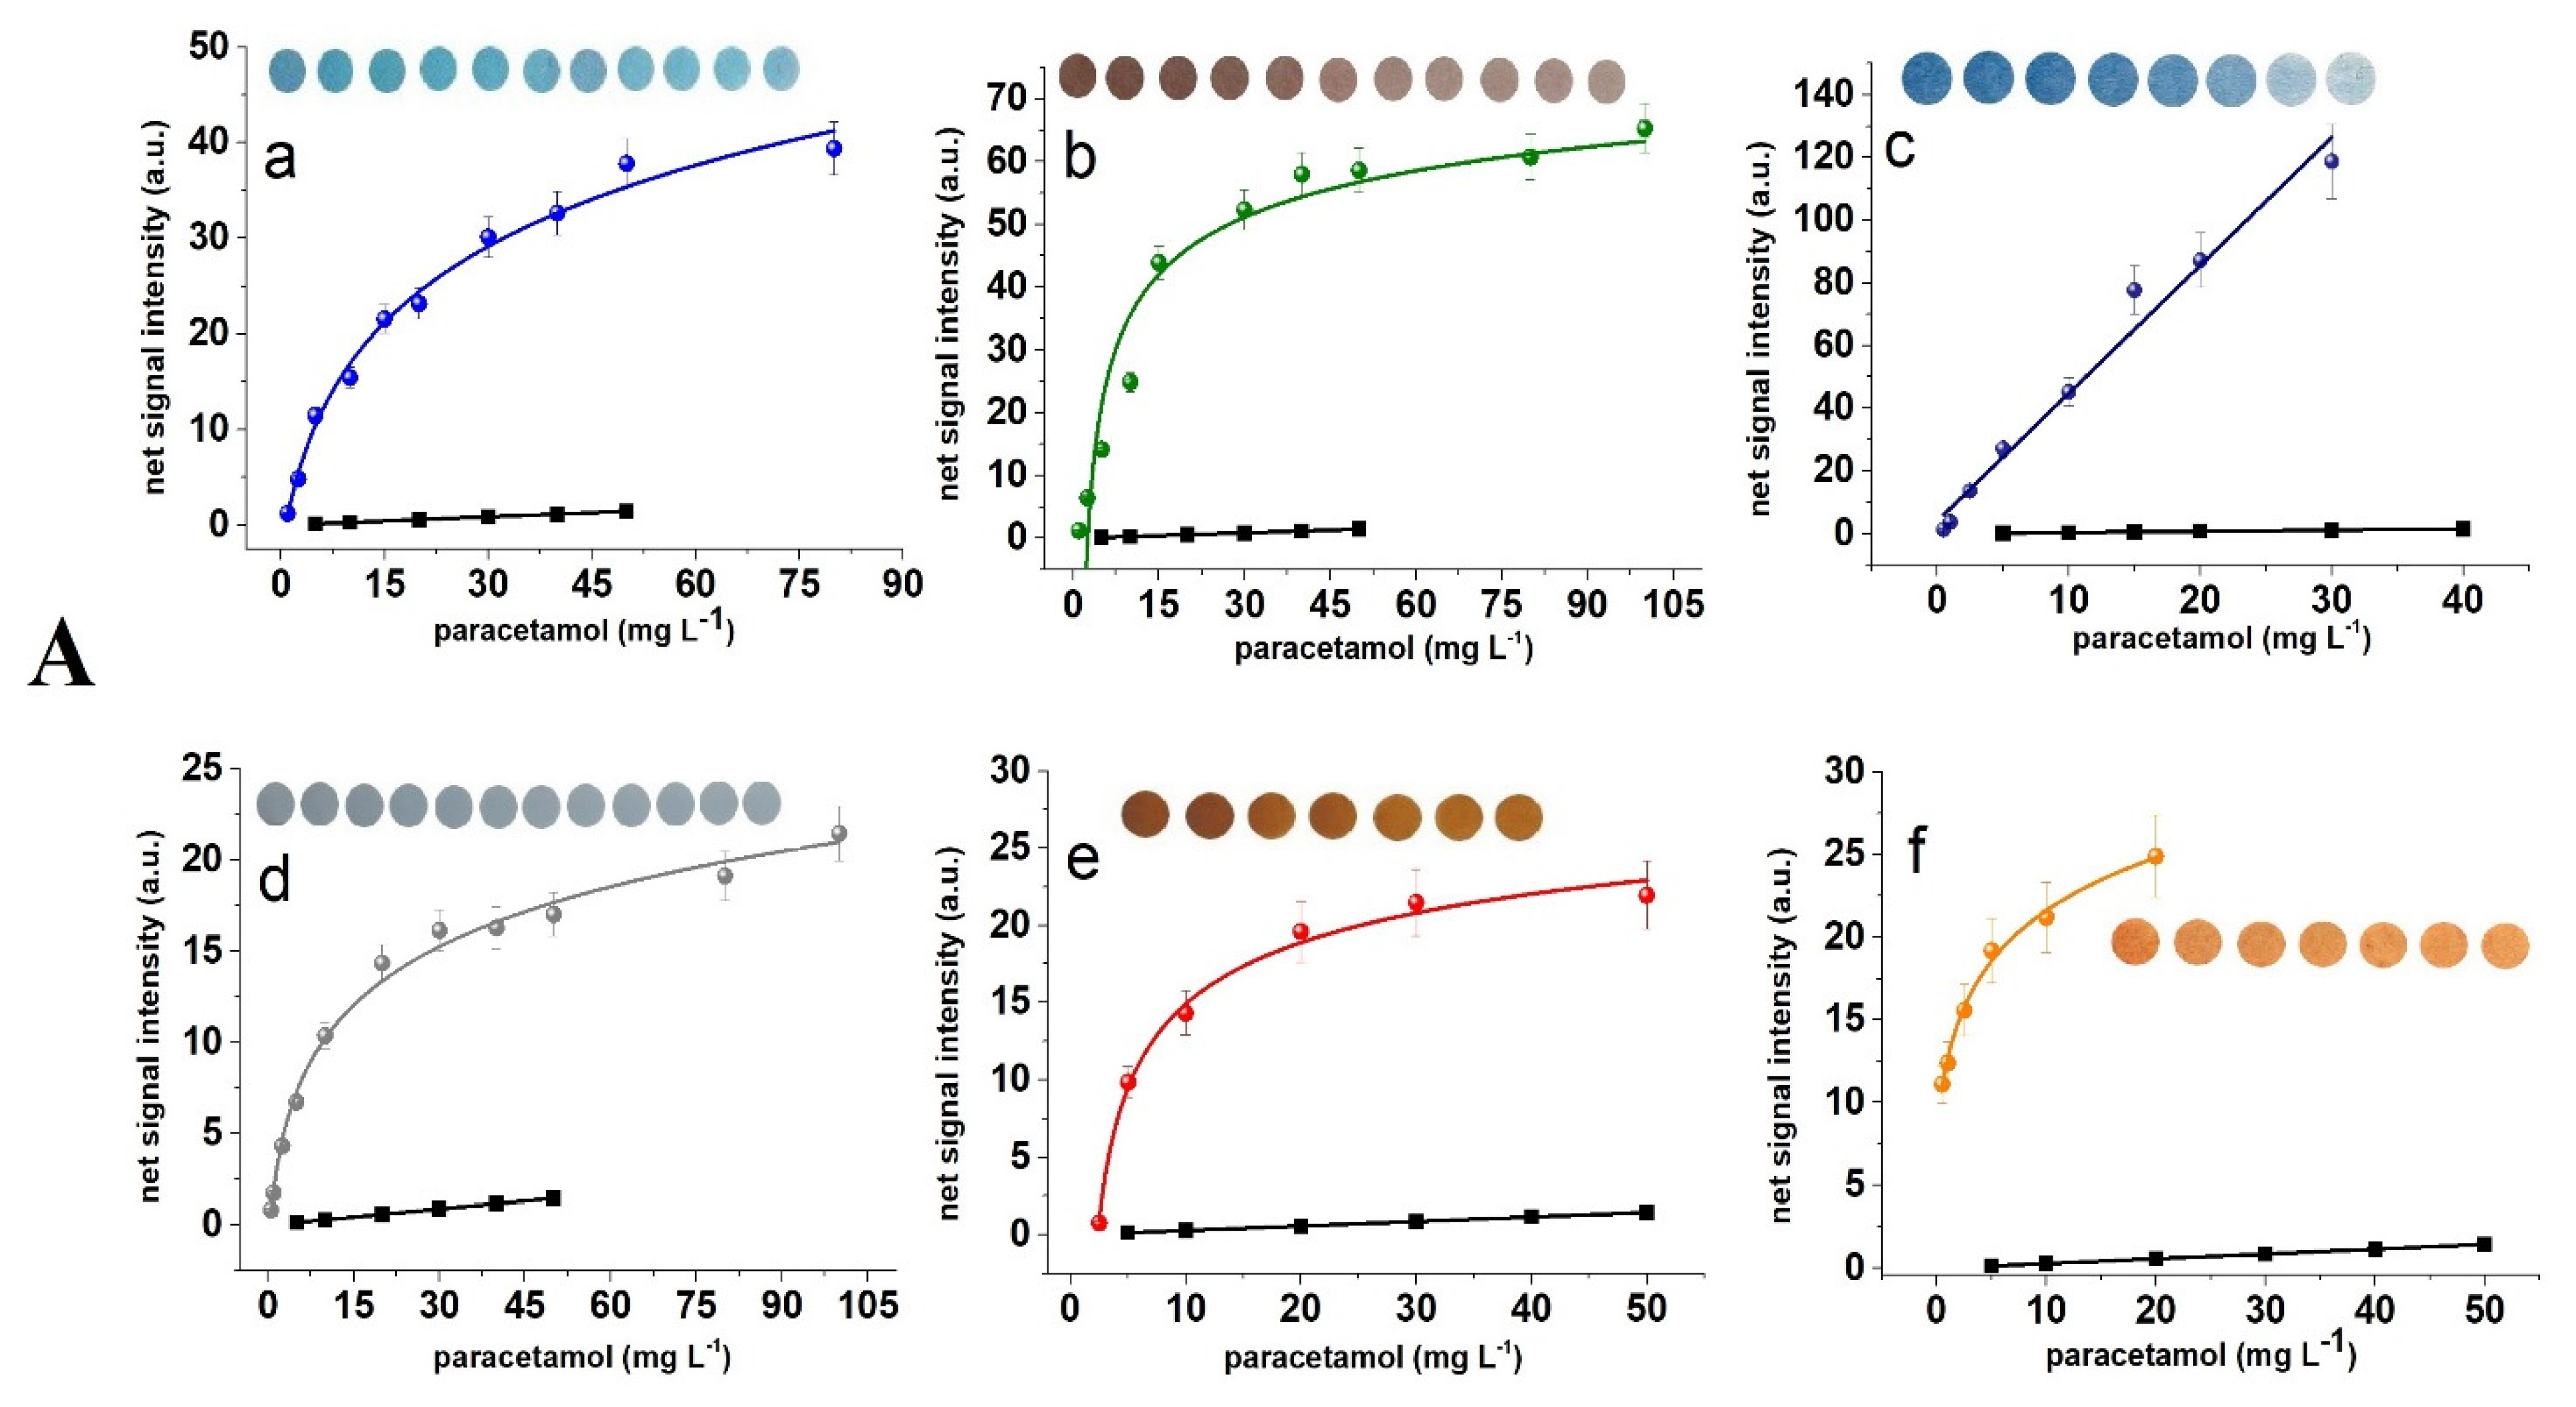
3.3. Comparison of Photography-Based Photometry and Photometry

The dose-response curves obtained with each photosensitive paper coating and standard photometry for the three assays are shown in Figure 2. These plots and the corresponding data of Table 2 show that the slope of the curves obtained with all photographic papers are higher than that obtained with standard photometry at all wavelengths. In almost all of the photosensitive papers examined, the detection limits (defined as 3 times the signal to noise ratio) were lower or similar to that obtained with photometry, despite the fact that measurements were not performed at the peak absorbance but close to it (Figure S3). Interestingly, the dose-response curves at 254 nm could be better represented by logarithmic functions, while at longer wavelengths (312 and 365 nm) almost all curves were fitted to linear equations. This may be attributed to the higher energy at 254 nm causing faster color saturation on the paper surface as compared to higher wavelengths. An overview of the results of Table 2 and the bar plots of Figure S2 show that paper of higher sensitivity to light enables the determination of lower concentrations at the expense of the working concentration range (since more sensitive coatings reach saturation faster), while paper with lower sensitivity to light may be used for higher concentrations and wider working concentration ranges.
The reproducibility of the measurements (RSD%) as calculated by five replicates at two concentration levels was lower than 10% for all photosensitive paper coatings, which is satisfactory but higher than that obtained with standard photometry. In addition, measurements performed in commercial papers (silver halides, cyanotype green and blue) produced more reproducible measurements than lab-made papers (with the exception of salt paper) possibly due to the high homogeneity of the photosensitive coatings as compared to lab-made papers (van dyke brown and gum dichromate coatings). Another reason may be the stability of the coating. Commercial papers are stable for long periods of time when stored away from light, while lab-made papers could only be used within 12–14 h due to gradual degradation of the coating.

3.4. Application in Pharmaceutical and Biochemical Analysis

To test the applicability of photosensitive coatings, we evaluated their performance in the analysis of real samples. Specifically, paracetamol was determined in commercial effervescent tables, while cysteine and glucose in simulated blood plasma. For validation purposes the measured concentrations were compared to those obtained with photometry. In all assays, the selectivity was determined only by the sensing mechanism of each assay and was independent from the detector (i.e., photometer or photography-based photometry). The data obtained from the analysis of real samples using all photosensitive paper coatings are summarized in Table 3.
Assuming that the values obtained with standard photometry correspond to the true concentrations of the target analytes, we calculated (a) the relative error of the measurements obtained with each photosensitive paper coating and (b) tested the data for systematic and non-systematic errors using the Student’s test (t-test) for comparison of means and the F-test for comparison of standard deviations.
From the values gathered in Table 3, it can be inferred that the lowest relative errors were obtained with cyanotype green and salted paper. According to the experimental t-test values, in almost all data there are no statistically significant differences between the measured concentrations and the concentrations determined by photometry at the 5% probability level, suggesting the lack of systematic errors in the results. However, non-systematic errors were identified with the aid of F-test for van dyke brown and gum dichromate coatings. The experimental F-values were higher than the critical value indicating that the results obtained from these coatings are less precise compared to photometry. A possible reason is that the sample images recorded on dyke brown and gum dichromate coatings were not developed since the RGB color intensity could be better quantified in undeveloped images. However, undeveloped images contain a mixture of the photoproduced and non-photoreduced coating which may increase the uncertainty in the measured color intensity. From the above data, it can also be concluded that the brightness of the developed images do not affect the analytical results (i.e., does not play any role in the analytical results if the developed images are brighter or darker than the undeveloped images).
From the above findings, we reached the conclusion that cyanotype green and salted paper photosensitive coatings offer the best results during photography-based photographic measurements. In addition, they are easy to develop by washing with water without specialized chemicals and require no darkroom conditions enabling their use under room light. Cyanotype green coating is also commercially available at low cost and can be stored for long periods of time protected from light. Lab-made coatings can further reduce the cost but from our experience, this process is impractical for routine laboratories or in resource limited settings since the process requires quite delicate manipulations to ensure homogenous coating of the paper, produces waste (although non-toxic), and does not have the long-term stability of commercial papers. On the other hand, salted paper provides very good results but needs to be prepared daily and used within 12–14 h while it requires the use of silver nitrate, which is rather expensive.

4. Conclusions

In this work, we have evaluated various photosensitive paper coatings as detectors for performing photography-based photometric assays in the UV region of the electromagnetic spectrum without the need for conventional instrumental photometers. We have shown that cyanotype green paper coatings provide the best medium for capturing the transmitted UV irradiation in terms of linearity of dose-response curves, detection limits, as well as precision and accuracy. Cyanotype green papers are also commercially available at low cost and stable for long periods of time facilitating their storage, transportation, and use. Importantly, the sensitivity and linear range of the assays performed with photography-based photometry using cyanotype green paper detectors are improved compared to standard photometry. The combination of photography-based photometry in the UV region and conventional digital photometry in the visible region of the electromagnetic spectrum can provide an integrated toolset for photometric and colorimetric assays in resource-limited settings, point-of-need or point-of-care applications.

Supplementary Materials

The following are available online at https://www.mdpi.com/article/10.3390/chemosensors9080233/s1. Figure S1: Color transitions of various photosensitive paper coatings before and after image development following exposure to UV light irradiation at 254, 312, and 365 nm. The first two columns show the color transitions before and after development without exposure to UV light, Figure S2: Absolute net grey area intensities (mean grey area intensity of the photosensitive paper before image development minus the mean grey area intensity of the photosensitive paper after image development) for various photosensitive paper coatings at 254, 312 and 365 nm. Asterix (*) indicates that the absolute difference between the color intensity of the blank and the sample yields a negative value (i.e., the color of the developed images is brighter than the non-developed images), Figure S3: UV spectra of the model analytes (paracetamol, Ellman’s reagent, and triodide) and working wavelengths.

Author Contributions

Conceptualization, D.L.G.; data curation, A.G.V. and D.L.G.; investigation, T.G.C. and A.S.; methodology, A.G.V. and D.L.G.; supervision, D.L.G.; validation, T.G.C. and A.S.; writing—original draft, T.G.C., A.S., A.G.V. and D.L.G.; writing—review and editing, D.L.G. All authors have read and agreed to the published version of the manuscript.

Funding

This research is co-financed by Greece and the European Union (European Social Fund- ESF) through the Operational Programme «Human Resources Development, Education and Lifelong Learning 2014–2020» in the context of the project “«Development of novel analytical methods and signal transduction techniques for the optical analysis of biomarkers in biological fluids using common imaging devices»” (MIS 5047630).

Conflicts of Interest

The authors declare no conflict of interest. The funders had no role in the design of the study; in the collection, analyses, or interpretation of data; in the writing of the manuscript, or in the decision to publish the results.

References

  1. Christodouleas, D.C.; Kaur, B.; Chorti, P. From Point-of-Care Testing to eHealth Diagnostic Devices (eDiagnostics). ACS Cent. Sci. 2018, 4, 1600–1616. [Google Scholar] [CrossRef] [PubMed]
  2. Grudpan, K.; Kolev, S.D.; Lapanantnopakhun, S.; McKelvie, I.D.; Wongwilai, W. Applications of everyday IT and communications devices in modern analytical chemistry: A review. Talanta 2015, 136, 84–94. [Google Scholar] [CrossRef] [PubMed]
  3. Fan, Y.; Li, J.; Guo, Y.; Xie, L.; Zhang, G. Digital image colorimetry on smartphone for chemical analysis: A review. Measurement 2021, 171, 108829. [Google Scholar] [CrossRef]
  4. Rezazadeh, M.; Seidi, S.; Lid, M.; Pedersen-Bjergaard, S.; Yamini, Y. The modern role of smartphones in analytical chemistry. TrAC Trends Anal. Chem. 2019, 118, 548–555. [Google Scholar] [CrossRef]
  5. Sun, A.; Wambach, T.; Venkatesh, A.G.; Hall, D.A. A low-cost smartphone-based electrochemical biosensor for point-of-care diagnostics. In Proceedings of the 2014 IEEE Biomedical Circuits and Systems Conference (BioCAS), Lausanne, Switzerland, 22–24 October 2014; IEEE: Piscataway, NJ, USA, 2014; pp. 312–315. [Google Scholar]
  6. Hernández-Neuta, I.; Neumann, F.; Brightmeyer, J.; Ba Tis, T.; Madaboosi, N.; Wei, Q.; Ozcan, A.; Nilsson, M. Smartphone-based clinical diagnostics: Towards democratization of evidence-based health care. J. Intern. Med. 2019, 285, 19–39. [Google Scholar] [CrossRef] [PubMed] [Green Version]
  7. Christodouleas, D.C.; Nemiroski, A.; Kumar, A.A.; Whitesides, G.M. Broadly Available Imaging Devices Enable High-Quality Low-Cost Photometry. Anal. Chem. 2015, 87, 9170–9178. [Google Scholar] [CrossRef] [PubMed]
  8. Calabria, D.; Mirasoli, M.; Guardigli, M.; Simoni, P.; Zangheri, M.; Severi, P.; Caliceti, C.; Roda, A. Paper-based smartphone chemosensor for reflectometric on-site total polyphenols quantification in olive oil. Sens. Actuators B Chem. 2020, 305, 127522. [Google Scholar] [CrossRef]
  9. Kappi, F.A.; Tsogas, G.Z.; Routsi, A.-M.; Christodouleas, D.C.; Giokas, D.L. Paper-based devices for biothiols sensing using the photochemical reduction of silver halides. Anal. Chim. Acta 2018, 1036, 89–96. [Google Scholar] [CrossRef] [PubMed]
  10. Tzoka, S.; Tarara, M.; Giokas, D.L. Photography-based photometry: High throughput UV photometric analysis without scientific equipment based on contact printing photography and common imaging devices. Sens. Actuators B Chem. 2021, 328, 129018. [Google Scholar] [CrossRef]
  11. Akrivi, E.; Kappi, F.; Gouma, V.; Vlessidis, A.G.; Giokas, D.L.; Kourkoumelis, N. Biothiol modulated growth and aggregation of gold nanoparticles and their determination in biological fluids using digital photometry. Spectrochim. Acta Part A Mol. Biomol. Spectrosc. 2021, 249, 119337. [Google Scholar] [CrossRef] [PubMed]
  12. Akrivi, E.A.; Vlessidis, A.G.; Giokas, D.L.; Kourkoumelis, N. Gold-Modified Micellar Composites as Colorimetric Probes for the Determination of Low Molecular Weight Thiols in Biological Fluids Using Consumer Electronic Devices. Appl. Sci. 2021, 11, 2705. [Google Scholar] [CrossRef]
  13. Liu, L.; Qiu, C.L.; Chen, Q.; Zhang, S.M. Corrosion behavior of Zr-based bulk metallic glasses in different artificial body fluids. J. Alloy. Compd. 2006, 425, 268–273. [Google Scholar] [CrossRef]
  14. Moser, M.; Schneider, R.; Behnke, T.; Schneider, T.; Falkenhagen, J.; Resch-Genger, U. Ellman’s and Aldrithiol Assay as Versatile and Complementary Tools for the Quantification of Thiol Groups and Ligands on Nanomaterials. Anal. Chem. 2016, 88, 8624–8631. [Google Scholar] [CrossRef] [PubMed]
  15. Choleva, T.G.; Gatselou, V.A.; Tsogas, G.Z.; Giokas, D.L. Intrinsic peroxidase-like activity of rhodium nanoparticles, and their application to the colorimetric determination of hydrogen peroxide and glucose. Microchim. Acta 2018, 185, 22. [Google Scholar] [CrossRef] [PubMed]
  16. El-Saadani, M.; Esterbauer, H.; El-Sayed, M.; Goher, M.; Nassar, A.Y.; Jürgens, G. A spectrophotometric assay for lipid peroxides in serum lipoproteins using a commercially available reagent. J. Lipid Res. 1989, 30, 627–630. [Google Scholar] [CrossRef]
  17. Blacklow, L. New Dimensions in Photo Processes; Routledge: London, UK, 2018; ISBN 9781315208015. [Google Scholar]
  18. Bjelkhagen, H.I. Silver-Halide Recording Materials. In Springer Series in Optical Sciences; Springer: Berlin/Heidelberg, Germany, 1995; Volume 66, ISBN 978-3-540-58619-7. [Google Scholar]
  19. Lawrence, G.D.; Fishelson, S. UV Catalysis, Cyanotype Photography, and Sunscreens. J. Chem. Educ. 1999, 76, 1199. [Google Scholar] [CrossRef]
  20. Allen, E.; Triantaphillidou, S. The Manual of Photography and Digital Imaging; Allen, E., Triantaphillidou, S., Eds.; Routledge: London, UK, 2012; ISBN 9780080926803. [Google Scholar]
Figure 1. Illustration of the setup and operation of a photographic-based photometry device.
Chemosensors 09 00233 g001
Figure 2. Calibration plots of signal intensity (i.e., net mean grey area intensity) vs. concentration for (A) paracetamol at λ = 254 nm, (B) Ellman’s reagent at λ = 312 nm, and (C) triodide at λ = 365 nm obtained with various photosensitive paper coatings: (a) Cyanotype blue, (b) salted paper, (c) cyanotype green, (d) silver halide emulsions, (e) can dyke brown, and (f) gum dichromate. Each data point corresponds to the mean value of five measurements (in some points the lines used for standard deviations are smaller than the symbols). Embedded photographs show the color transitions with increasing analyte concentrations. In all embedded photographs, the first image (from left to right) is the blank sample. The black line and the square points correspond to the calibration plot obtained with standard photometry.
Chemosensors 09 00233 g002aChemosensors 09 00233 g002b
Table 1. Optimum irradiation time for various assays and photosensitive paper coatings.
AssayExposure Time (min)
Cyanotype GreenSalted PaperCyanotype BlueSilver HalidesVan Dyke BrownGum Dichromate
Paracetamol (254 nm)15161620
Ellman-Thiols (312 nm)83241513
H2O2-KI (365 nm)42421015
Table 2. Analytical figures of merit of photometry and photography-based photometry for the determination of paracetamol, thiols, and hydrogen peroxide.
AssayDetectionCalibration FunctionWorking RangeR2LOD aRSD (%, n = 5) b
Paracetamol (254 nm)Photometryy = 0.03x − 0.00265–500.9990.60.7–2.1
Cyanotype greeny = 4.1x + 4.00.5–300.980.168.3–11.7
Salted papery = 15.6lnx − 4.51–1000.960.308.0–8.3
Cyanotype bluey = 9.4lnx − 2.71–800.960.303.2–6.5
Silver halidey = 4lnx + 1.80.5–1000.980.151.2–6.7
Van dyke browny = 6.7lnx − 2.72.5–500.940.87.1–9.4
Gum dichromatey = 3.7lnx + 12.80.5–200.980.17.6–10.7
Ellman’s-Thiol (312 nm)Photometryy = 0.0062x − 0.0045–2000.971.64.0–4.4
Cyanotype greeny = 0.33x + 7.05–1000.9931.57.2–8.5
Salted papery = 0.26x − 0.315–1000.971.52.1–4.8
Cyanotype bluey = 0.17x + 0.5610–2000.963.58.6–9.8
Silver halidey = 1.4lnx − 1.065–1000.971.62.3–5.6
Van dyke browny = 0.039x + 0.5350–2000.9812.56.4–8.2
Gum dichromatey = 0.3x − 0.215–500.991.77.0–9.0
H2O2-KI (365 nm)Photometryy = 1.3x + 0.610.1–0.50.970.031.5–2.1
Cyanotype greeny = 150.8x − 2.60.1–0.50.980.036.4–8.1
Salted papery = 83.1x + 5.10.1–0.50.9980.015.6–6.1
Cyanotype bluey = 95.8x − 7.40.1–0.50.970.035.2–7.7
Silver halidey = 19.9x + 2.50.1–0.50.960.033.2–4.9
Van dyke browny = 86.7x − 5.60.1–0.50.980.038.5–11.0
Gum dichromatey = 15.8x + 2.60.1–0.50.9910.029.3–10.3
a LOD = 3S/N, b RSD values were calculated at two concentration levels at the first half in each calibration curve.
Table 3. Results from the analysis of real samples with various photosensitive paper coatings and comparison with standard photometry.
PhotometryCyanotype GreenSalted PaperCyanotype BlueSilver Halide EmuslionsVan Dyke BrownGum Dichromate
Paracetamol(mg L−1)495 ± 17488 ± 36492 ± 20479 ± 30511 ± 15468 ± 44529 ± 43
Relative error (%) a −1.41−0.61−3.844.04−5.456.87
texperimental b 0.430.341.422.981.371.77
Fexperimental c 4.481.383.111.286.706.40
Cysteine (μM)102 ± 498 ± 11100 ± 9108 ± 993 ± 1087 ± 12118 ± 14
Relative error (%) a −3.9−2.05.9−8.8−14.715.7
texperimental b −1.1−0.51.5−2.0−2.82.6
Fexperimental c 4.55.15.16.39.012.3
Glucose (mM)0.25 ± 0.030.22 ± 0.030.26 ± 0.060.21 ± 0.070.19 ± 0.050.17 ± 0.090.31 ± 0.06
Relative error (%) a −12.04.0−16.0−24.0−32.024.0
texperimental b 2.240.371.282.681.992.24
Fexperimental c 1.04.05.42.89.04.0
a Relative error (%) = (True value − Measured value) × 100/True value. b tcritical = 2.78. c Fcritical = 6.38.
Publisher’s Note: MDPI stays neutral with regard to jurisdictional claims in published maps and institutional affiliations.

