Article

Selective Enhancement of SERS Spectral Bands of Salicylic Acid Adsorbate on 2D Ti3C2Tx-Based MXene Film

by
Sonata Adomavičiūtė-Grabusovė
1,*,
Simonas Ramanavičius
2,3,
Anton Popov
4,
Valdas Šablinskas
1,
Oleksiy Gogotsi
5 and
Arūnas Ramanavičius
2,*
1
Institute of Chemical Physics, Vilnius University, Sauletekio Av. 3, LT-10257 Vilnius, Lithuania
2
Department of Physical Chemistry, Faculty of Chemistry and Geosciences, Institute of Chemistry, Vilnius University, Naugarduko 24, LT-03225 Vilnius, Lithuania
3
Center for Physical Sciences and Technology, Sauletekio Av. 3, LT-10257 Vilnius, Lithuania
4
NanoTechnas—Center of Nanotechnology and Materials Science, Faculty of Chemistry and Geosciences, Institute of Chemistry, Vilnius University, Naugarduko St. 24, LT-03225 Vilnius, Lithuania
5
Materials Research Center Ltd., Krzhyzhanovskogo Str. 3, 01001 Kiev, Ukraine
*
Authors to whom correspondence should be addressed.
Chemosensors 2021, 9(8), 223; https://doi.org/10.3390/chemosensors9080223
Submission received: 7 July 2021 / Revised: 2 August 2021 / Accepted: 9 August 2021 / Published: 13 August 2021
(This article belongs to the Section (Bio)chemical Sensing)

Abstract

:
In this research, we have demonstrated that 2D Ti3C2Xn-based MXene (MXene) films are suitable for the design of surface-enhanced Raman spectroscopy (SERS)-based sensors. The enhanced SERS signal was observed for a salicylic acid molecule on Ti3C2Tx-based MXene film. Confirmation of the adsorption of the salicylic acid molecule and the formation of a salicylic acid–MXene complex were determined by experimental SERS-based spectral observations such as greatly enhanced out-of-plane bending modes of salicylic acid at 896 cm−1 and a band doublet at 681 cm−1 and 654 cm−1. Additionally, some other spectral features indicate the adsorption of salicylic acid on the MXene surface, namely, a redshift of vibrational modes and the disappearance of the carboxyl deformation spectral band at 771 cm−1. The determined enhancement factor indicates the value that can be expected for the chemical enhancement mechanism in SERS of 220 for out-of-plane vibrational modes. Theoretical modeling based on density functional theory (DFT) calculations using B3LYP/6311G++ functional were performed to assess the formation of the salicylic acid/MXene complex. Based on the calculations, salicylic acid displays affinity of forming a chemical bond with titanium atom of Ti3C2(OH)2 crystal via oxygen atom in hydroxyl group of salicylic acid. The electron density redistribution of the salicylic acid–MXene complex leads to a charge transfer effect with 2.2 eV (428 nm) and 2.9 eV (564 nm) excitations. The experimentally evaluated enhancement factor can vary from 220 to 60 when different excitation wavelengths are applied.

1. Introduction

A recently discovered class of specific two-dimensional (2D) materials—MXenes—promises a variety of applications with encouraging improvement in plasmonics, conductivity and catalysis compared to these properties of conventional non-metallic substances such as graphene. Due to the high concentration of free charges, the conductivity of these substances is metallic-like and higher than that of graphene [1,2]. Nevertheless, these materials are quite new, and the most relevant publications considering the optical and electric properties of MXenes have appeared just in the last decade.
MXenes were synthesized from MAX (Mn+1AXn, where n = 1, 2 or 3) phase for the first time in 2011 [3]. Here, M represents a III–VI group transition metal, A is typically an element from IIIA or IVA group (e.g., Al, Si, Cd, Ga, etc.) and X usually depicts carbides, nitrides or carbonitrides, though over 30 different types of MXenes have been reported so far and even more are predicted to exist [4]. Henceforth, MXenes are generally produced by selectively etching the middle element of the MAX three-dimensional lattice A, thus obtaining layers of MAX phase that ought to be further separated by various intercalant agents or sonication yielding 2D MXenes. Recently, research of this material class expanded rapidly. This is especially obvious for the Ti3C2Tx MXene compounds (Tx here denotes the terminal functional group, usually -O, -OH or -F) formed from Ti3AlC2 (MAX phase). These MXenes are studied most extensively since their synthesis is widely established, and they exhibit higher metallic conductivity in comparison to that of molybdenum and nitride-based MXenes [5,6,7,8]. Nevertheless, further investigations are directed towards the efficient synthesis of other MXene types that can yield more defect-less 2D MXene layers [4,6].
Due to unique morphology and composition, these materials have the potential to be used in sensor design [9,10] as catalysts [11,12,13]. High conductivity, transparency and tunable work function enable the application of these materials in the design of optoelectronic devices, including solar cells. Ti3C2Tx MXene has the potential to be used as an additive in a charge transport layer or as an electrode in perovskite and organic solar cells [14]. In addition, intriguing metal-like properties (e.g., the decrease of conductivity by the increase of temperature) and high conductivity determined by a high density of charge carriers were observed for MXenes [15,16,17]. The reported concentration of free charge carriers for Ti3C2Tx MXene is 2 × 1021 cm−3 [18], while in noble metal nanoparticles, it is approximately 6 × 1022 cm−3 [19] and for graphene, 3 × 1013 cm−2 [1,2]. The conductivity of MXenes can be altered by their surface termination groups [20], leading to a possible application as supercapacitors [21,22], resistive sensors [23,24,25] and other applications in electrochemistry [26], electronics [27]. As a result of the relatively high concentration of free electrons, the plasmonic effect of MXenes reclassifies these materials into a class of metals because the plasmon frequency depends on the density of free electrons [19]. For this reason, MXenes might be used as a substitute for metallic nanostructures with the ability to enhance internal vibrations of molecules at near proximity as is in surface-enhanced Raman spectroscopy (SERS) [28,29,30].
It is widely accepted that two mechanisms can cause the SERS effect: (i) electromagnetic mechanism occurring due to localized plasmon resonance of noble metal nanostructures (such as silver, gold, platinum), which enhances the intensity of Raman spectral bands up to six orders of magnitude and (ii) chemical mechanism, which occurs because of interacting electronic energy levels between the substrate and the adsorbed molecule that causes a shift in electronic energy levels of the molecule. The enhancement due to chemical mechanism is lower and usually does not exceed two orders of magnitude [31]. However, until now, only enhanced resonance Raman spectra of dye molecules (such as rhodamine 6G, crystal violet, methylene blue, malachite green) adsorbed on the MXene surface were observed, and the enhancement was explained by the chemical mechanism [28,29,30]. The chemical enhancement between the MXene materials and the adsorbed dye molecules occurs because of the coupling between the dye and MXene energy levels. This coupling can be considered as a chemical mechanism of SERS [30,32,33]. Nevertheless, the electromagnetic mechanism of enhancing the SERS signal due to the free electron oscillations in MXene layers cannot be neglected as well [34,35].
The application of MXenes as SERS substrates is desirable in such cases when non-metal SERS substrates with a different chemical affinity towards molecules are needed. Moreover, the enhancement from 2D thin materials is beneficial in comparison to three-dimensional surfaces due to the larger specific surface area of 2D materials. Additionally, the localized plasmon resonance frequency in the metal nanoparticles depends on the shape and size of these nanoparticles which are determined during the synthesis of the nanoparticles, whereas for 2D materials such as graphene and MXenes, the surface plasmon resonance frequency can be influenced by different functional groups and/or controlled by an external electric field [20,36]. The possibility to use MXenes as a SERS substrate not only for sensing molecules with electron-level energy similar to that of MXenes would provide a wider field of application and, therefore, is highly desirable. SERS-based sensing is used for the detection of various molecules (or ions), usually at much lower limits of detection than by conventional spectroscopic methods. The high sensitivity of the method is directly related to the adsorption of the analyte molecules on the nanoparticles. Thus, the adsorption of the molecules leads to enhanced intensity of the Raman spectrum.
Salicylic acid can act as a model molecule for studies of SERS enhancement on MXene film. This molecule consists of a benzene ring and carboxyl group. The Carboxyl group is involved in the adsorption of salicylic acid on the customary SERS substrates—silver or gold nanoparticles. Salicylic acid is known to be SERS-active when silver and gold nanoparticles are used, but this molecule does not exhibit electronic absorption in the visible spectral range.
In this research, the adsorption of salicylic acid molecules and the formation of salicylic acid–MXene complex were confirmed by experimental SERS-based spectral observations. The enhanced SERS signal was observed for salicylic acid molecules on Ti3C2Tx-based MXene film. The goal of this work is to study the enhancement of Raman spectral bands of salicylic acid when it is adsorbed on MXene film and to elucidate the enhancement features of MXenes when they are used as SERS substrates.

2. Materials and Methods

2.1. Synthesis of Ti3C2Tx MXene Substrates

In this study, MXenes were prepared by etching 0.1 g of Ti2AlC3 MAX phase in 10 mL of 5 wt.% hydrofluoric acid solution. Solution was stirred for 24 h at 25 °C temperature. After this step, the solution was centrifuged in order to remove residue of hydrofluoric acid. Centrifugation proceeded until the pH of solution became neutral. Finally, the MXene films on a microscope glass slide were prepared. For this purpose, the glass slides were covered with 0.5 mL of aqueous MXene solution (0.01 g/mL) and dried under nitrogen atmosphere.

2.2. Characterization of MXene Film and Its Interaction with Adsorbate

Sample images and elemental analysis were performed by scanning electron microscope Helios Nanolab 650 (FEI, Eindhoven, Netherlands) equipped with an EDX spectrometer X-Max (Oxford Instruments, Abingdon, UK). X-ray diffraction (XRD) analysis was performed using Ni-filtered Cu Kα radiation on MiniFlex II diffractometer (Rigaku, Tokyo, Japan) working in Bragg–Brentano (θ/2θ) geometry. The diffractograms were recorded within 2θ angle range from 5° to 60° at a step width of 0.02° and speed of 2/min. Resistivity measurements were performed on a thin-film gold interdigitated electrode ED-IDE3-Au (Micrux Technologies, Oviedo, Spain).
Characteristic spectroscopic range of interband transition and plasmonic response of MXenes were determined by ultraviolet, visible and near-infrared range (UV-Vis-NIR) absorption spectroscopy. UV-Vis-NIR electronic absorption spectra were acquired with dual-channel Lambda-1050 spectrometer (PerkinElmer, Boston, MA, USA). The spectra were obtained in the range 350–2300 nm with 5 nm resolution.
Ti3C2Tx-based MXene film and its interaction with salicylic acid (SA) were investigated by means of Raman spectroscopy. MonoVista CRS+ Raman microscope system (S & I GmbH, Warstein, Germany) equipped with four excitation lasers (457 nm, 532 nm, 633 nm and 785 nm) and a liquid-nitrogen-cooled CCD detector were used for acquiring the spectra. Diameter of the focused laser beam on the sample was ≈ 1 µm, and its power density on the sample was ≈ 20 kW/cm2 (for 633 nm excitation) and ≈ 45 kW/cm2 (for 785 nm excitation). Before the measurements, the spectrometer was calibrated to a fundamental vibrational band at 520.7 cm−1 of silicon wafer. Fourier transform MultiRAM spectrometer (Bruker, Mannheim, Germany) equipped with liquid-nitrogen-cooled Ge diode detector was used for the calculations of enhancement factor for salicylic acid–MXene complex with 1064 nm excitation wavelength.
Solution of salicylic acid in water with concentration equal to 2 mM was prepared. Two drops (5 µL each) of the solution were dried on the glass substrate covered by the MXene film. To ensure the most homogenous distribution of salicylic acid molecules, the drying was performed in a confined space when the saturated vapor diminishes the surface tension in air–water interface and more uniform distribution can be achieved. The same volume of salicylic acid solution was dried on the aluminum foil as a reference. Salicylic acid solution spread to form a 2 mm spot on the film. After drying out, no crystallization occurred on the MXene film, while on the reference glass substrate, crystals of salicylic acid were formed. Presented SERS spectra of salicylic acid were recorded on 20 randomly chosen positions on the MXene surface and averaged. The standard deviation for the spectral intensity of salicylic acid on MXene substrate was calculated while applying 3 s acquisition time.

2.3. Computational Methods

In order to make more detailed analysis of the interaction between salicylic acid and MXene, theoretical calculations of structure and vibrational spectra of monomeric salicylic acid and salicylic acid dimer were performed by means of quantum chemistry calculations implemented in Gaussian 09W software package [37]. The salicylic acid dimer was chosen to resemble the crystalline structure of solid-state salicylic acid. The density functional theory (DFT) calculations using B3LYP/6311G++ functional were performed. For the investigation of the salicylic acid–MXene complex, the 2 × 2 × 1 supercell expansion of Ti3C2(OH)2 MXene crystal structure (of 20 atoms) was built and optimized. Initially, geometry optimization was performed separately for salicylic acid (B3LYP/6311G++) and Ti3C2(OH)2 cluster (B3LYP/LanL2DZ) and for their complex afterward (B3LYP/LanL2DZ). No virtual frequencies were present after the complex optimization. The excited-state calculations were performed to assess the redistribution of the electronic energy levels.

3. Results

3.1. Characterization of MXene Films

The structure and morphology of the MAX phase and synthesized MXene-based materials were evaluated using the scanning electron microscopy (SEM) imaging technique (Figure 1). The compact and layered morphology, which is typical for ternary carbide [38], was obtained in the case of the MAX phase. Etching with 5 wt.% HF solution allows preparing Ti3C2Tx, for which the structure is quite similar to that of the MAX phase. However, MXene layers were slightly opened. The ‘accordion-like’ structure was not observed. A possible explanation may be found in low hydrofluoric acid concentration, which is insufficient for the formation of a sufficient amount of H2 evolving during the exothermic reaction of hydrofluoric acid with aluminum atoms. Successful etching of aluminum atoms was confirmed by energy-dispersive X-ray spectroscopy (EDX) analysis (Table 1). It was revealed that the number of aluminum atoms in MXenes decreased by five times in comparison with the initial amount of these atoms in the MAX phase.
Comparing resistivity of MAX phase and MXenes etched in 5 wt.% HF, it was measured that the resistivity of samples at room temperature decreased from 36 Ω to 20.5 Ω. A decrease in sample resistivity might be explained by a reduced amount of aluminum by etching and the formation of semi-metallic Ti3C2 MXene structures.
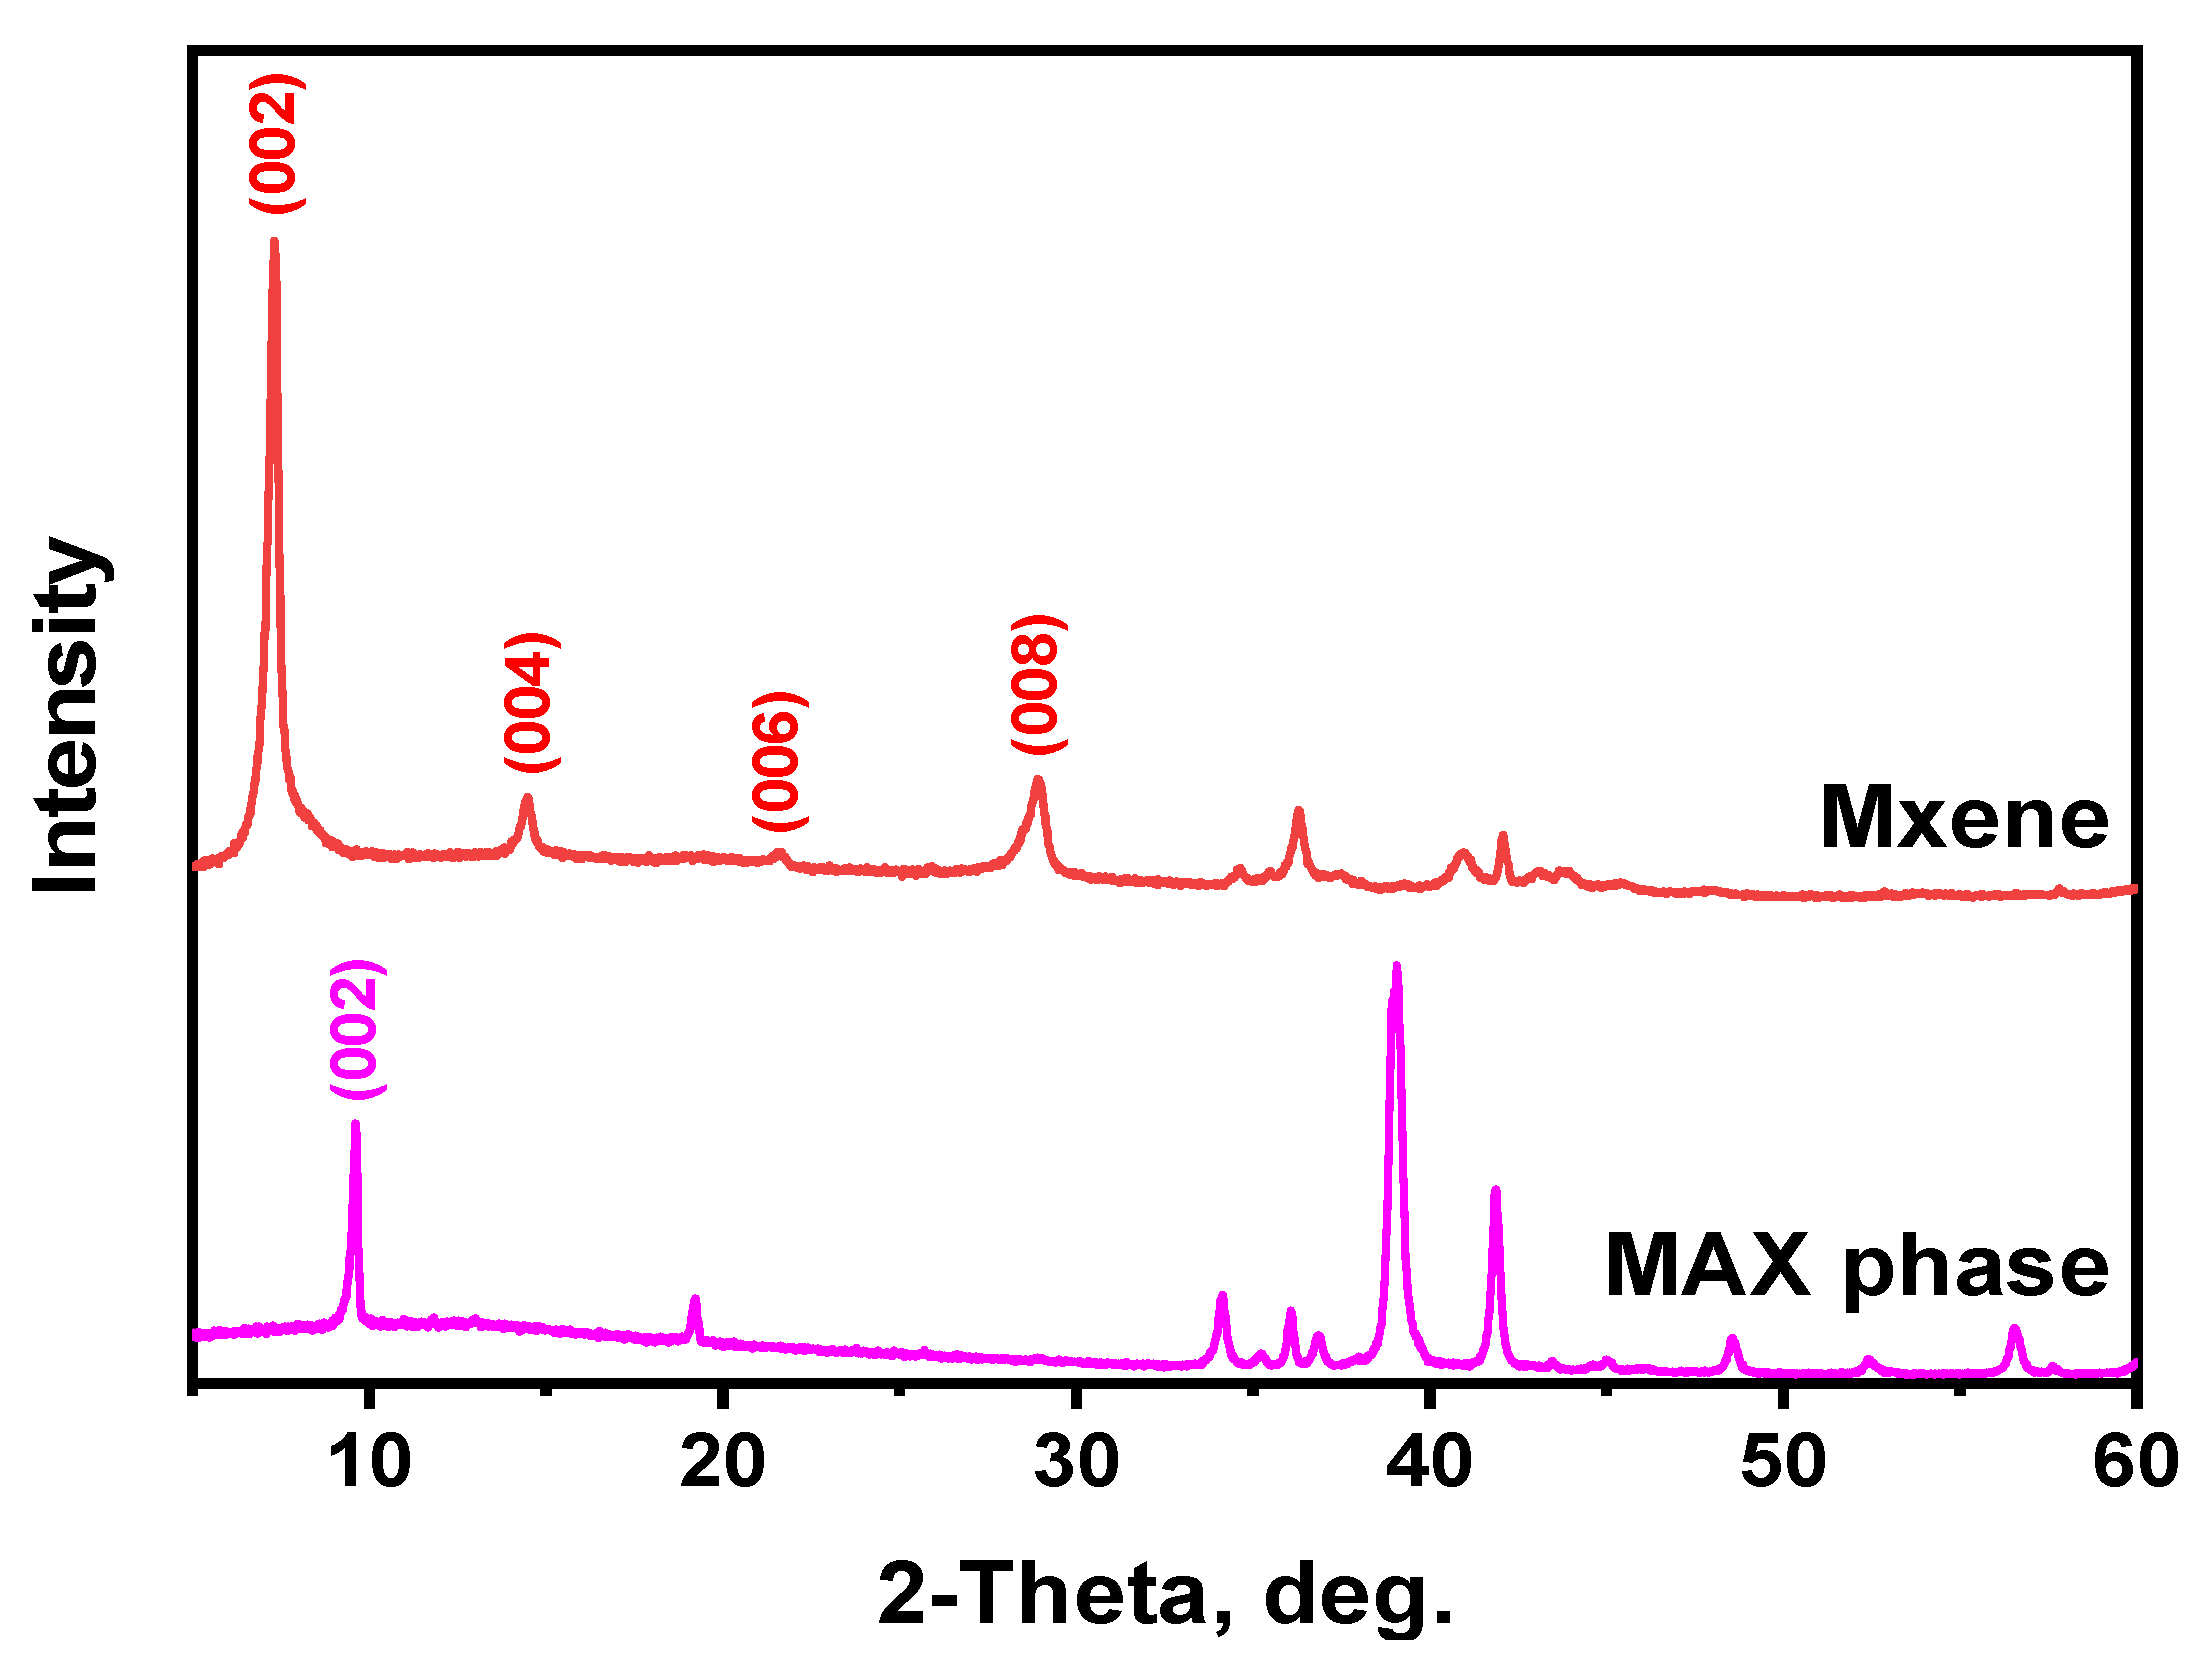
The synthesis of MXenes was confirmed using XRD analysis (Figure 2). A shift of the (002) peak of Ti3AlC2 at 9.5° to 7.3° for the Ti3C2Tx was observed. Such sufficiently large shift is typical for wet multilayered MXene samples [39], whereas an intense and sharp (002) peak is characteristic for MXenes etched by hydrofluoric acid [40]. Such results, together with the absence of other MAX phase characteristic peaks in MXene spectra, coincide with EDX analysis results and confirm successful etching of Al out of Ti3AlC2.
Usually, MXene films are composed of various sizes of Ti3C2Tx flakes (lateral sizes vary from 0.1 to ~5 μm). In contrast, the thickness of monolayered MXene is supposed to be about 0.95 nm [41]
Due to weak interaction between neighboring individual MXene flakes, the electric and plasmonic properties of the film do not significantly depend on the thickness of MXene structures, though the correlation between metallic behavior and the origin of the terminal chemical groups of MXenes is well expressed [17,21,34,42]. MXenes terminated with -F and -OH feature higher conductivity and plasmonic response to incident radiation in comparison to the oxidized MXenes.
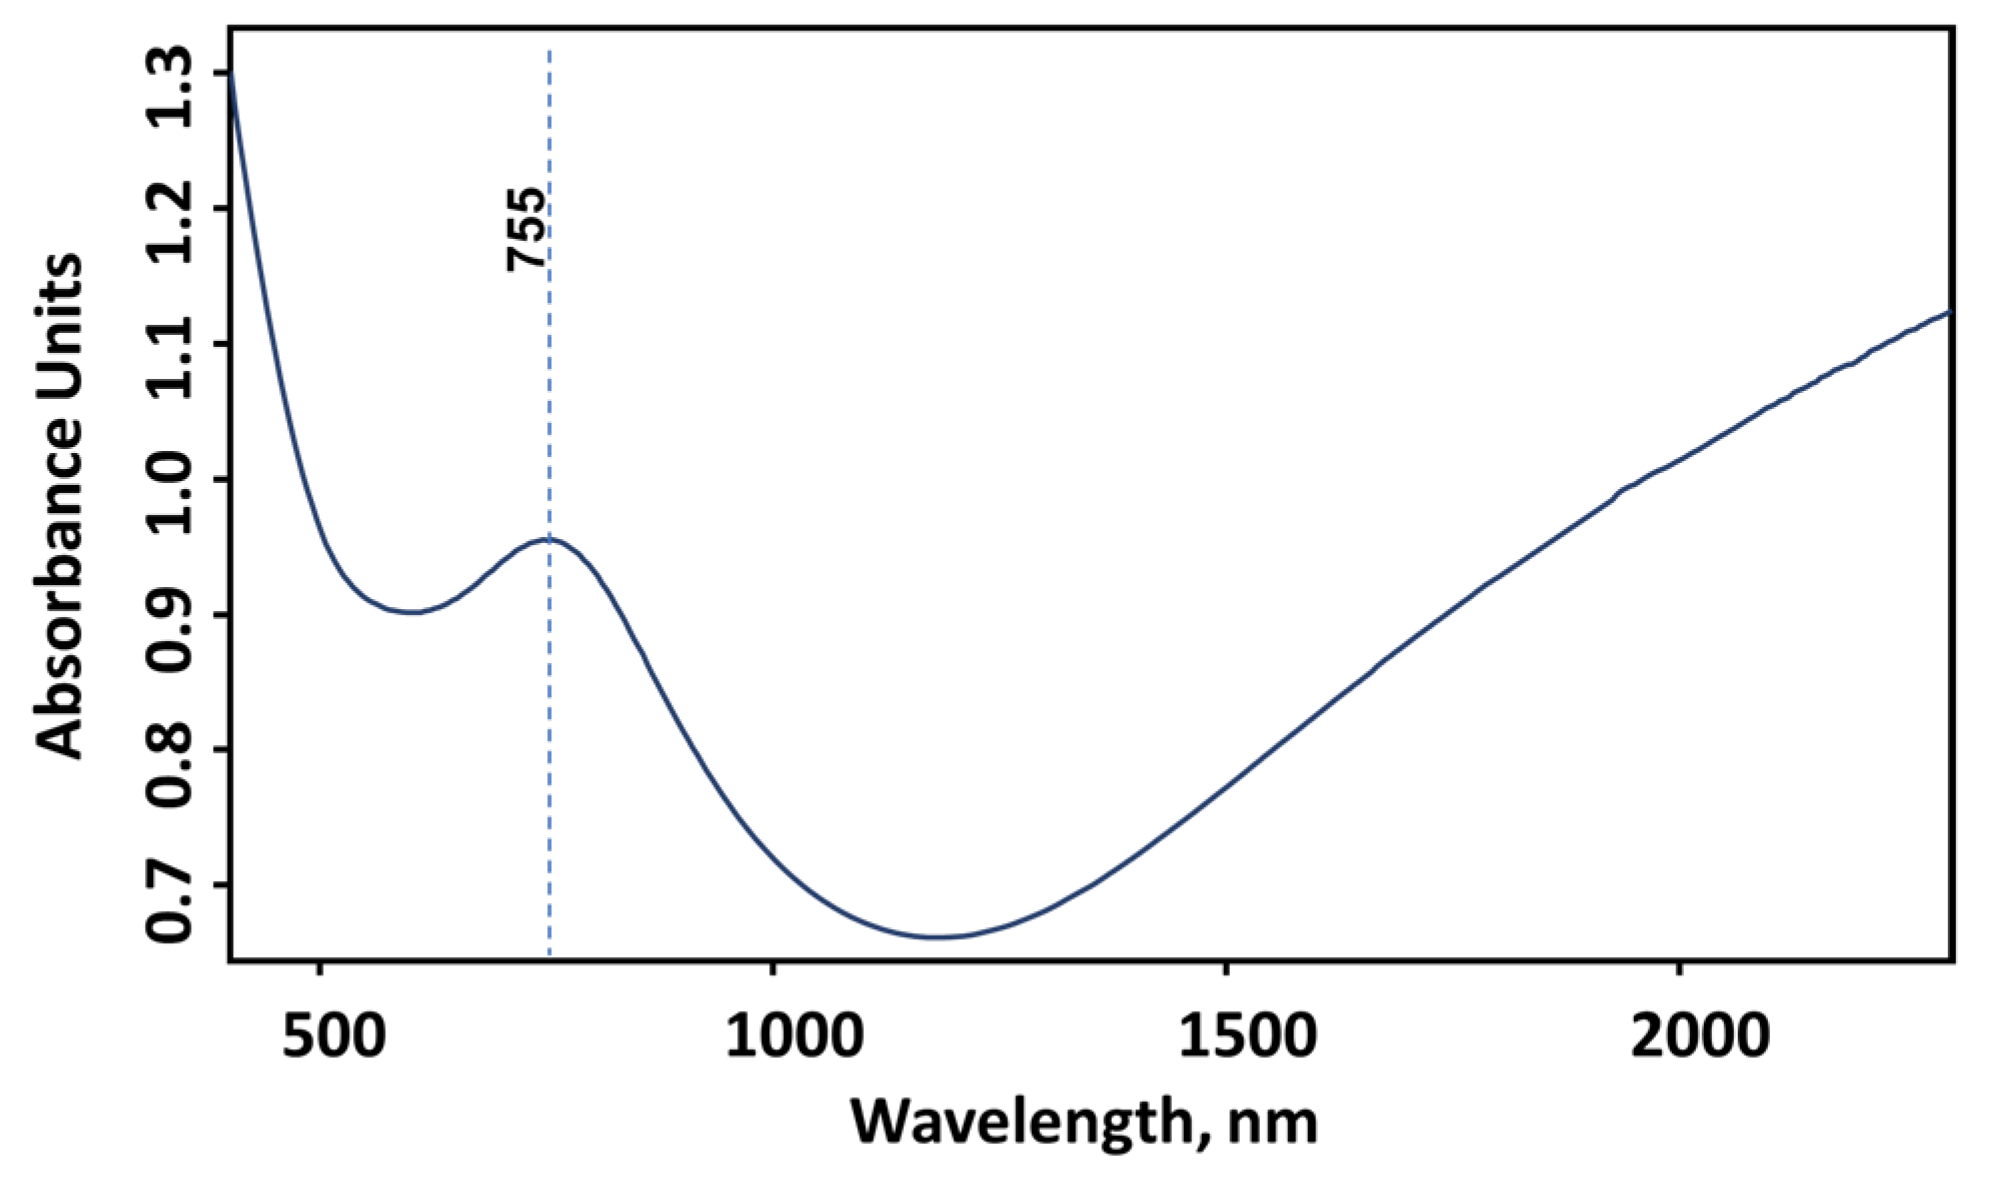
The plasmonic response and other optical properties of the MXene substrate were assessed by the mean of UV-Vis-NIR absorption spectroscopy (Figure 3). Relying on the correlation between the optical density and the thickness of the film [17,21,43], we estimated the thickness to be approximately 70 nm.
The UV-Vis-NIR absorption spectrum of 70 nm thick Ti3C2Tx-based MXene film contains a broad spectral band (full width at half maximum—195 nm) characteristic for delaminated MXenes. The center of this band is located at 750 nm (1.65 eV). The origin of the spectral band is attributed to the interband transition. The plasmonic nature of this band is controversial. Some researchers assign bands in this spectral range to transversal plasmon resonance [42,44], while other studies suggest that the plasmonic activity of MXenes occurs as a consequence of the real part of the dielectric function, becoming negative only in the near-infrared spectral range, implying that the plasma frequency of MXenes is also in this range and excitation of surface plasmons can be expected at longer wavelengths. During this research, we adhere to the assignment of this absorption band to the interband transition because: (i) no plasmonic activities were observed in this spectral range and (ii) the characteristics of enhanced SERS spectra of salicylic acid indicate a chemical enhancement mechanism. It is important to note that the thickness of the MXene film or the size and shape of the individual Ti3C2Tx flakes have no influence on the interband gap. The position of the spectral band can only be shifted by changing the concentration of free charge carriers that can be altered with different terminal groups of Ti3C2Tx MXene lattice [17,21,34,42]. Therefore, we did not observe a shift in the interband transition energy when a thicker (120 nm thick) MXene film was deposited.
Considering the origin of the absorption band, transversal and longitudinal plasmon resonances are predicted to be closer to the middle infrared spectral range. It is notable that the maximum of the spectral band related to the plasmon resonance is located at λ > 2200 nm (see Figure 2). According to the calculations, the width of the plasmon band might be influenced by the high size dispersion of MXene flakes [45]. It should be noted that in order to increase the contribution of the electromagnetic enhancement mechanism into the amplification of the SERS spectrum together with the chemical enhancement mechanism, the plasmon resonance should be observed in the visible region of the spectrum. Fortunately, the plasmon resonance wavelength can be tailored by changing the flake dimensions [45,46].

3.2. Raman Spectra of MXene Films

Further assessment of MXene film composition can be performed using Raman spectroscopy data. The positions of Raman spectral bands of the MXene by itself are mostly caused by various vibrations of Ti3C2Tx lattice and the terminal groups. Consequently, the presence of different terminal groups and even interactions with the target molecules can be distinguished by examining the spectral changes.
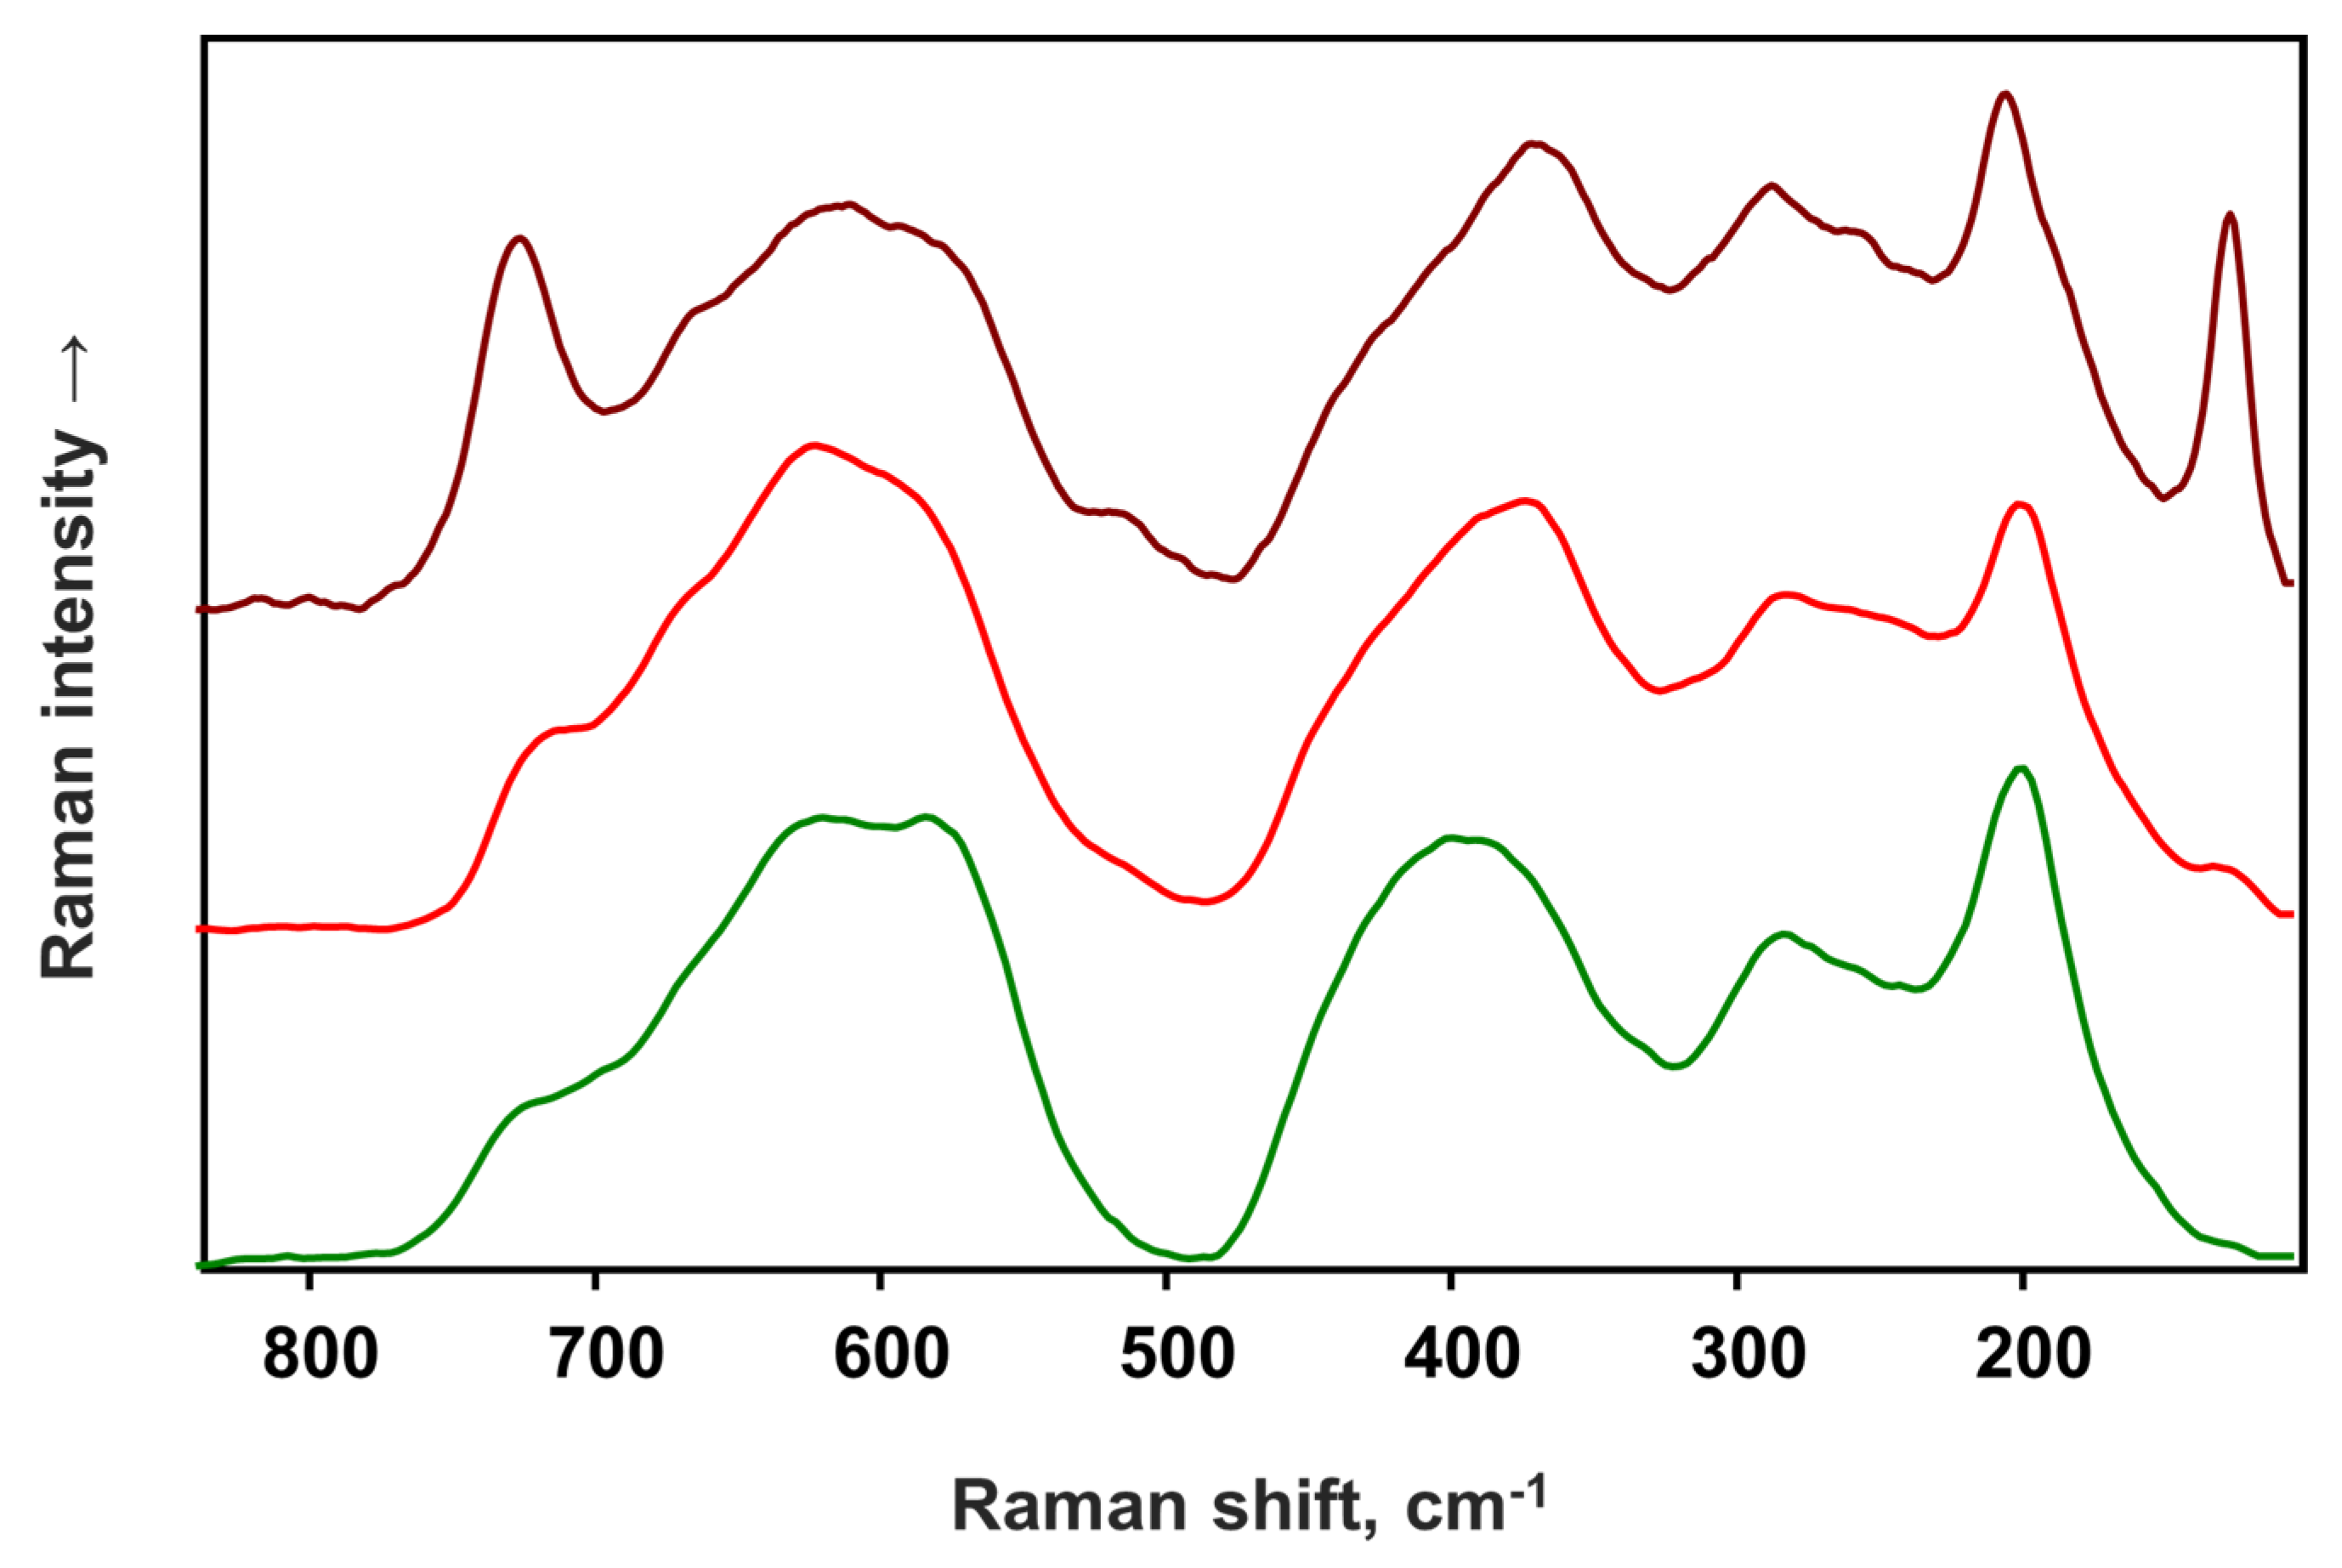
The Raman spectra of an MXene film on a glass plate obtained with 532 nm, 633 nm and 785 nm excitation are presented in Figure 4. The spectral bands of Ti3C2Tx lattice vibrations that interest us occur in the range of 100–850 cm−1. Excitation with a 532 nm laser yields a Raman spectrum with a relatively low signal-to-noise ratio (S/N ≈ 52), whereas it is higher in the case of 633 nm and 785 nm excitations (S/N > 100).
It is worth mentioning that only a rather low power of 532 nm laser excitation could be used for acquiring the spectra. Structural and chemical changes of MXene film have been observed due to rapid oxidation when laser power exceeded 5 mW. In this case, the power density on the sample exceeded 1.5 MW/cm2. Some degradation of the film was noticeable starting from 17 kW/cm2 excitation beam power density. In the case of rapid oxidation, the intense G and D spectral bands arising from allotropic forms of carbon (formed from Ti3C2Tx lattice) emerge along with the Raman spectrum of TiO2 in anatase form, exhibiting the most intense spectral band at 143 cm−1. Rapid oxidation is known to disrupt the structure of the MXene film [47]. Due to the disruption, Ti is oxidized into TiO2 by the formation of anatase nanoparticles and graphitic or amorphous carbon [48]. Raman spectra acquired with 532 nm and 633 nm excitation fit very well with the literature data [22,48]. The lattice phonon modes of Ti3C2Tx MXene terminated with different chemical groups are observed as a combination of the broader spectral bands at 129 cm−11), 198 cm−12), 709 cm−13), 667 cm−14), 281 cm−15) and 371 cm−17) [49]. Higher energy vibrational spectral bands presumably occur from non-uniform, defected MXene films and the presence of free carbon materials [24,48,50]. G and D spectral bands distinctive for the carbon materials are also present in the MXene spectra. The G band in MXene samples was observed at 1581 cm−1, and the D band was almost imperceptible. Generally, the G band in carbon materials occurs because of sp2 hybridization caused by C-C stretching being observed in both chain and ring structures, whereas the D band is observable only in the defected ring structures [51]. In our observations, the appearance of graphene bands indicates the disruption in MXene lattice structure and oxidation of MXenes. We will further address this issue in our forthcoming research.
The spectrum obtained with 785 nm excitation is somewhat different from other spectra. As can be seen in the UV-Vis-NIR absorption spectrum (Figure 3). MXenes in this spectral region have a spectral band arising due to IBT (the corresponding absorption band center, in our case, is at 750 nm). Thus, resonance effects are expected in the Raman spectrum with a 785 nm excitation laser. As a consequence of resonant lattice vibrations, the new spectral bands become observable. The new band at 120 cm−1 arises from the in-plane vibration mode of Ti and C atoms of the MXene lattice. In addition, the new out-of-plane breathing mode (ω6) band at 513 cm−1 becomes discernible. During this vibration, terminal atoms are mainly moving in a transversal direction to the lattice plane. The intensity increase for the band at 722 cm−1 is observed as well. The spectral band at 722 cm−1 represents out-of-plane vibrations of C atoms perpendicular to the 2D plane of MXene film. The gradual increase in the intensity of these bands is observed when excitation wavelength changes from 532 nm, 633 nm to 785 nm.
The appearance of new spectral bands can be explained by the resonant condition of excitation [44,45,49]. The enhancement of certain vibrational modes occurs when the exciting frequency comes into resonance with the lowest excited state. Usually, total symmetric modes experience the greatest enhancement (through A term). In this case, the symmetric normal modes, in which vibrations involve bonds that are affected by the change in the electronic state of excited molecules, are enhanced. Nevertheless, the enhancement of non-symmetric normal modes is possible when two excited states are coupled by the normal mode vibration (B term). Hence, in both cases, the enhanced modes correspond to the interaction between the molecule ground and excited states [52,53].
Furthermore, the lower energy vibrational spectral bands of Ti3C2Tx MXenes can be used for the determination of the changes in surface terminal groups (=O, –OH or –F) [49,54,55]. The most stable MXene film is the one with carbonyl (=O) terminal group, e.g., Ti3C2O2 [56] whilst, during the first step of synthesis of MXene—etching of Al—they are terminated with the -F group. Usually, it is considered that MXenes are terminated with all these functional groups to some degree [57]. Very promising spectral bands for the determination of terminal groups are the out-of-plane mode of C vibrations (ω3), which is calculated to be located at 694 cm−1 in Ti3C2(OH)2 MXene and at 730 cm−1 in Ti3C2O2 and the out-of-plane mode of mainly Ti and terminal atoms vibrations (ω2). It was experimentally proved that ω3 mode becomes red-shifted when the =O terminal group is reduced into the –OH group [30], while ω2 redshifts from 218 cm−1 to 208 cm−1 [49]. Other distinct Raman spectral bands of Ti3C2O2 are the out-of-plane mode of =O at 371 cm−1 and Ti and the =O in-plane vibrational mode at 589 cm−1. The bands at 281 cm−1 –OH in-plane and 667 cm−1—C atom out-of-plane vibrational modes arise from Ti3C2(OH)2. Raman vibrational frequencies observed for MXene films and assignments of the spectral bands are presented in Table 2.

3.3. Interaction between Salicylic Acid and MXenes

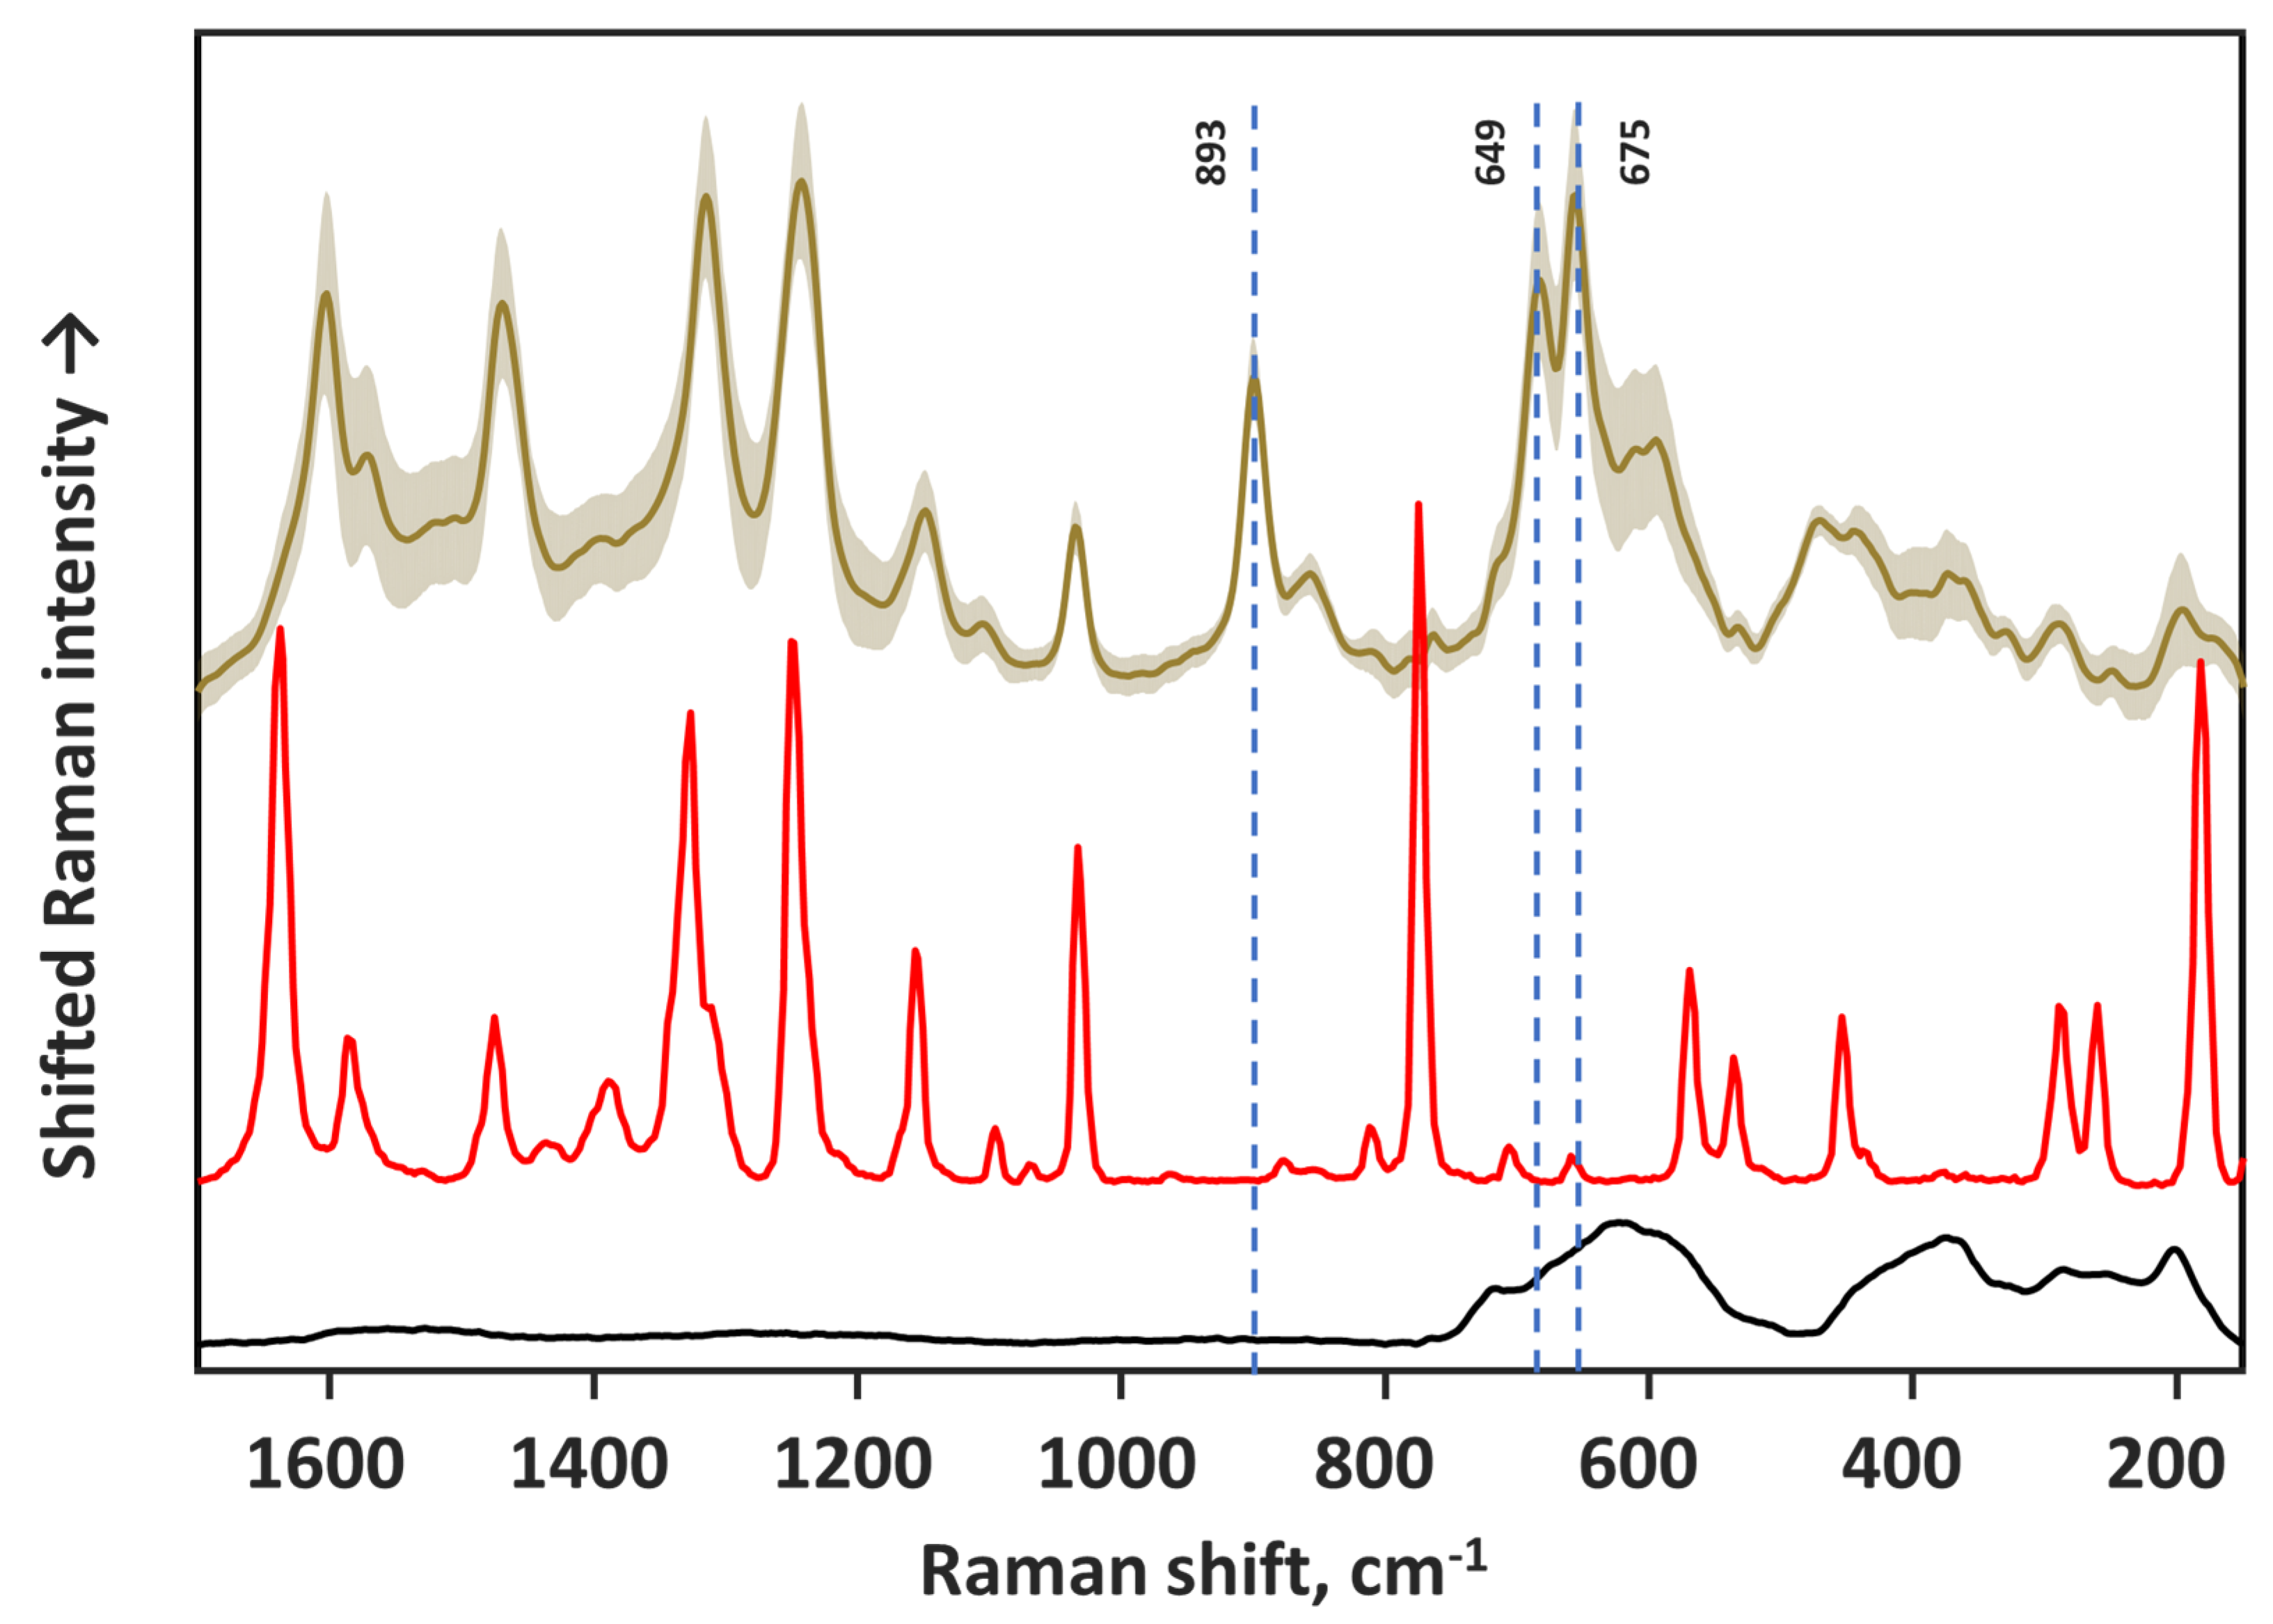
An interesting effect was observed when salicylic acid (SA) solution was dried on the MXene film. The measured Raman spectrum of salicylic acid on MXene film clearly differs from that of crystalline salicylic acid (Figure 5). The redshifts of the vibrational bands are evident and indicate an interaction between salicylic acid molecules and the Ti3C2Tx-based MXene film. The appearance of prominent Raman spectral bands at 896 cm−1 and a band doublet at 681 cm−1 and 654 cm−1 confirms the interaction between salicylic acid and the MXene. Based on our DFT calculations performed for monomeric salicylic acid molecule and salicylic acid dimer (as in crystalline salicylic acid form), these newly emerged bands can be assigned to out-of-plane vibrations of CH groups and out-of-plane ring deformation, respectively. The latter usually displays a low Raman signal intensity of the crystalline form of SA. The increased intensity of out-of-plane vibrational bands was evaluated by calculating enhancement factor for intensified bands as:
E n h a n c e m e n t   f a c t o r = ( I S E R S × N R a m a n ) / ( I R a m a n × N S E R S )
where I S E R S and I R a m a n are SERS and Raman spectral band intensities, N R a m a n and N S E R S —number of excited molecules for Raman and SERS experiments.
Comparing salicylic acid deposited directly on aluminum surface and on the MXene film, enhancement factor reached 125, 110 and 220 for the band at 896 cm−1 and band doublet at 681 cm−1 and 654 cm−1, respectively (532 nm excitation).
Additionally, an increase in intensities and redshifts were observed for the other salicylic acid spectral bands. The largest shift occurred for the C=O stretching vibrational band of the carboxylic group at 1636 cm−1 which shifted by 39 cm−1 to 1597 cm−1; the other bands experienced smaller redshifts—from 12 to 15 cm−1. For example, the vibrational modes of the benzene ring observed at 1583 cm−1 and 1473 cm−1 were shifted to 1567 cm−1 and 1467 cm−1, respectively. The C–O stretching band at 1325 cm−1 is shifted down to 1311 cm−1; the spectral band of the C–O deformation of the hydroxyl group at 1244 cm−1 is shifted to 1232 cm−1. Indeed, the only spectral band that did not experience observable shift is the benzene ring mode at 1031 cm1. The assignments of the experimental spectral bands for (i) salicylic acid crystals formed on the pure aluminum surface and (ii) vibrational shifts for salicylic acid on MXene film are provided in Table 3.
Partly due to the porous MXene surface and high surface area, salicylic acid molecules can spread easily and interact with the MXenes. Indication of such interaction is the change in color from purple to yellowish when salicylic acid is dried on the MXene film (Figure 6 inset). Salicylic acid molecules are prone to form crystals when drying, though: after drying on the MXene film, no crystals are visible.
Detailed investigation of the interaction between salicylic acid molecules and Ti3C2Tx MXene can be completed by analyzing UV-Vis-NIR spectra. The change in UV-Vis-NIR absorption spectrum of salicylic acid–MXene film is clearly seen in the differential spectrum where the MXene spectrum is subtracted from salicylic acid on the MXene spectrum (Figure 6b). Salicylic acid water solution features absorption bands from π to π* and n to π* transitions at ≈ 230 nm and ≈ 300 nm, whereas salicylic acid–MXene film possesses the highest intensity band at 400 nm. Other, less distinct bands are at 495 nm, 595 nm and 1080 nm. The decrease in near-infrared absorption range from MXene film is probably caused by redistribution of conduction band electrons—free charge carriers. These changes in the absorption spectrum confirm that salicylic acid and MXene are forming complex structures.
These spectral changes can be explained by the formation of the salicylic acid–MXene complex and the charge-transfer effect. It is already known that certain molecules form complexes with Ti3C2Tx MXenes and, therefore, can undergo charge transfer [30,32,33]. For that matter, the SERS enhancement derived from the MXene films is explained using this charge transfer mechanism and, naturally, by the chemical enhancement mechanism. Briefly, the chemical enhancement is thought to be active because of one of these factors: (i) the charge transfer mechanism between the adsorbed molecule and the substrate and (ii) the influence of the substrate on the molecular polarizability tensor elements that changes the efficiency of Raman scattering. In the case of charge transfer, the Raman signal is enhanced because of the pre-resonance or resonance condition of the excitation to the adsorbate–substrate complex. Thus, the charge transfer mechanism can be traced by: (i) the greater enhancement of the antisymmetric vibrations compared to symmetric ones (due to the B term excitation of resonance Raman); (ii) enhancement of the stretching vibrations (in the resonant condition of excitation, the totally symmetric vibrations in accordance with the excited state geometry of the molecule are enhanced (due to A term mechanism). The bond length between atoms usually increases in the excited molecule state); (iii) high dependence of the EF on the excitation wavelength.
The first indication of the charge transfer effect in the salicylic acid–MXene complex is the greater enhancement of asymmetric vibrational modes. Since the salicylic acid molecule is in the Cs point symmetry group, the vibrational modes of salicylic acid can only be classified as in-plane (A’) or out-of-plane (A”) vibrations. The latter is less symmetric and, as seen in Figure 5, was enhanced via salicylic acid–MXene interaction. The dependence of salicylic acid–MXene Raman spectra on the excitation wavelength is presented in Figure 7.
Based on the spectra acquired at different excitations, the enhancement factor dependence on the excitation can be evaluated (Figure 8). To minimize the influence of spectrometer response to different wavelength, the crystalline salicylic acid was acquired with each excitation, and the salicylic acid–MXene complex spectrum was compared to crystalline salicylic acid spectrum acquired at the same conditions.
Indeed, the SERS enhancement factor for out-of-plane vibrations is as expected for the chemical enhancement mechanism. The enhancement factor for the substrate covered by the salicylic acid–MXene complex was calculated for the most enhanced vibrational band at 654 cm−1 (carboxyl deformation + out-of-plane C-C bending). As the enhancement factor value dependency on the excitation wavelength indicates, the highest enhancement of 220 is achieved with a 532 nm laser (Figure 8). Nevertheless, 457 nm and 633 nm excitations also yield comparable enhancement of 165 and 178, respectively. The 785 nm excitation fell into the absorption of MXenes; for this reason, the Raman spectral bands of MXene phonon modes are still observable in the spectrum, and the enhancement factor reaches 150. For the excitation profile of 1064 nm, an entirely different Fourier Transform-Raman spectrometer was used. It was observed that MXene film without salicylic acid highly absorbs this wavelength, generates heat and makes the registration of spectrum with this excitation impossible. Nevertheless, when the salicylic acid–MXene complex is excited, the characteristic spectrum is observed, which is indicating changes in the electron distribution of the MXene layer.
It is worth mentioning that based on our results, the chemical mechanism of enhancement takes place between salicylic acid and MXenes. The observable hot spot effect of SERS substrates arises when the intensity crucially depends on the different spots of the sample, because of the electromagnetic mechanism of enhancement when the analyte molecule is trapped between two nanoparticles [31]. The random distribution of these hot spots varies the absolute intensity of SERS bands. In our case, the chemical enhancement mechanism makes the substrate more uniform in the sense of changes in the intensity of the Raman bands. For the calculations of the enhancement factor, the absolute intensity is important, but for further studies, the normalization to a specific spectral band can be considered (for salicylic acid, it was the only spectral band at 1031 cm−1 that did not shift, and for this reason, it is considered to be unaffected by chemical enhancement mechanism).
However, the comparison of the achieved enhancement factor for salicylic acid with that of conventional SERS materials such as silver and gold nanostructures is difficult. Limited literature is available concerning the SERS enhancement factor of salicylic acid. To the best of our knowledge, the evaluation of the analytical enhancement factor for salicylic acid adsorbed on silver and gold nanoparticles with 1064 nm excitation is presented only in one of our previous works [59]. The determined enhancement factors for gold and silver nanoparticles prepared with different synthesis methods and stabilizing agents are presented in Table 4.

3.4. Computational Results of Salicylic Acid Interaction with MXene

In order to make a more detailed investigation of the salicylic acid and MXene interaction, the first-principle calculations based on DFT were performed. For salicylic acid–MXene complex investigation, the cluster of Ti3C2(OH)2 supercell was built and optimized (B3LYP/LanL2DZ). According to the calculations, salicylic acid displays affinity of forming a chemical bond with titanium atom of Ti3C2(OH)2 crystal via oxygen atom in carboxyl group of salicylic acid. The likeness of the complex formation is assured based on geometrical parameters of optimized geometry of the salicylic acid–MXene complex. The length of the O-H interatomic bond in the salicylic acid carboxyl group increased from 0.976 to 1.536 Å, whereas the distance between the Ti3C2(OH)2 MXene OH-H group was 1.034 Å, indicating the possible proton transfer between SA and the MXene cluster. The C-O bond length in the carboxyl group also increased from 1.232 to 1.339 Å. The bond formation between salicylic acid and Ti3C2(OH)2 MXene can explain the drastic experimental shift of 40 cm−1 for the C=O stretching vibrational band of the carboxylic group at 1636 cm−1 and the disappearance of the salicylic acid band at 771 cm−1 (benzene ring bending + carboxyl deformation modes). The formed bond between salicylic acid and the MXene cluster can become a channel for electron density redistribution around the salicylic acid and MXene cluster. Moreover, the charge distribution on the atoms from the performed Mulliken population analysis indicates a slight charge redistribution by −0.66 when from −0.32 (monomeric salicylic acid) to −0.98 (salicylic acid–MXene complex).
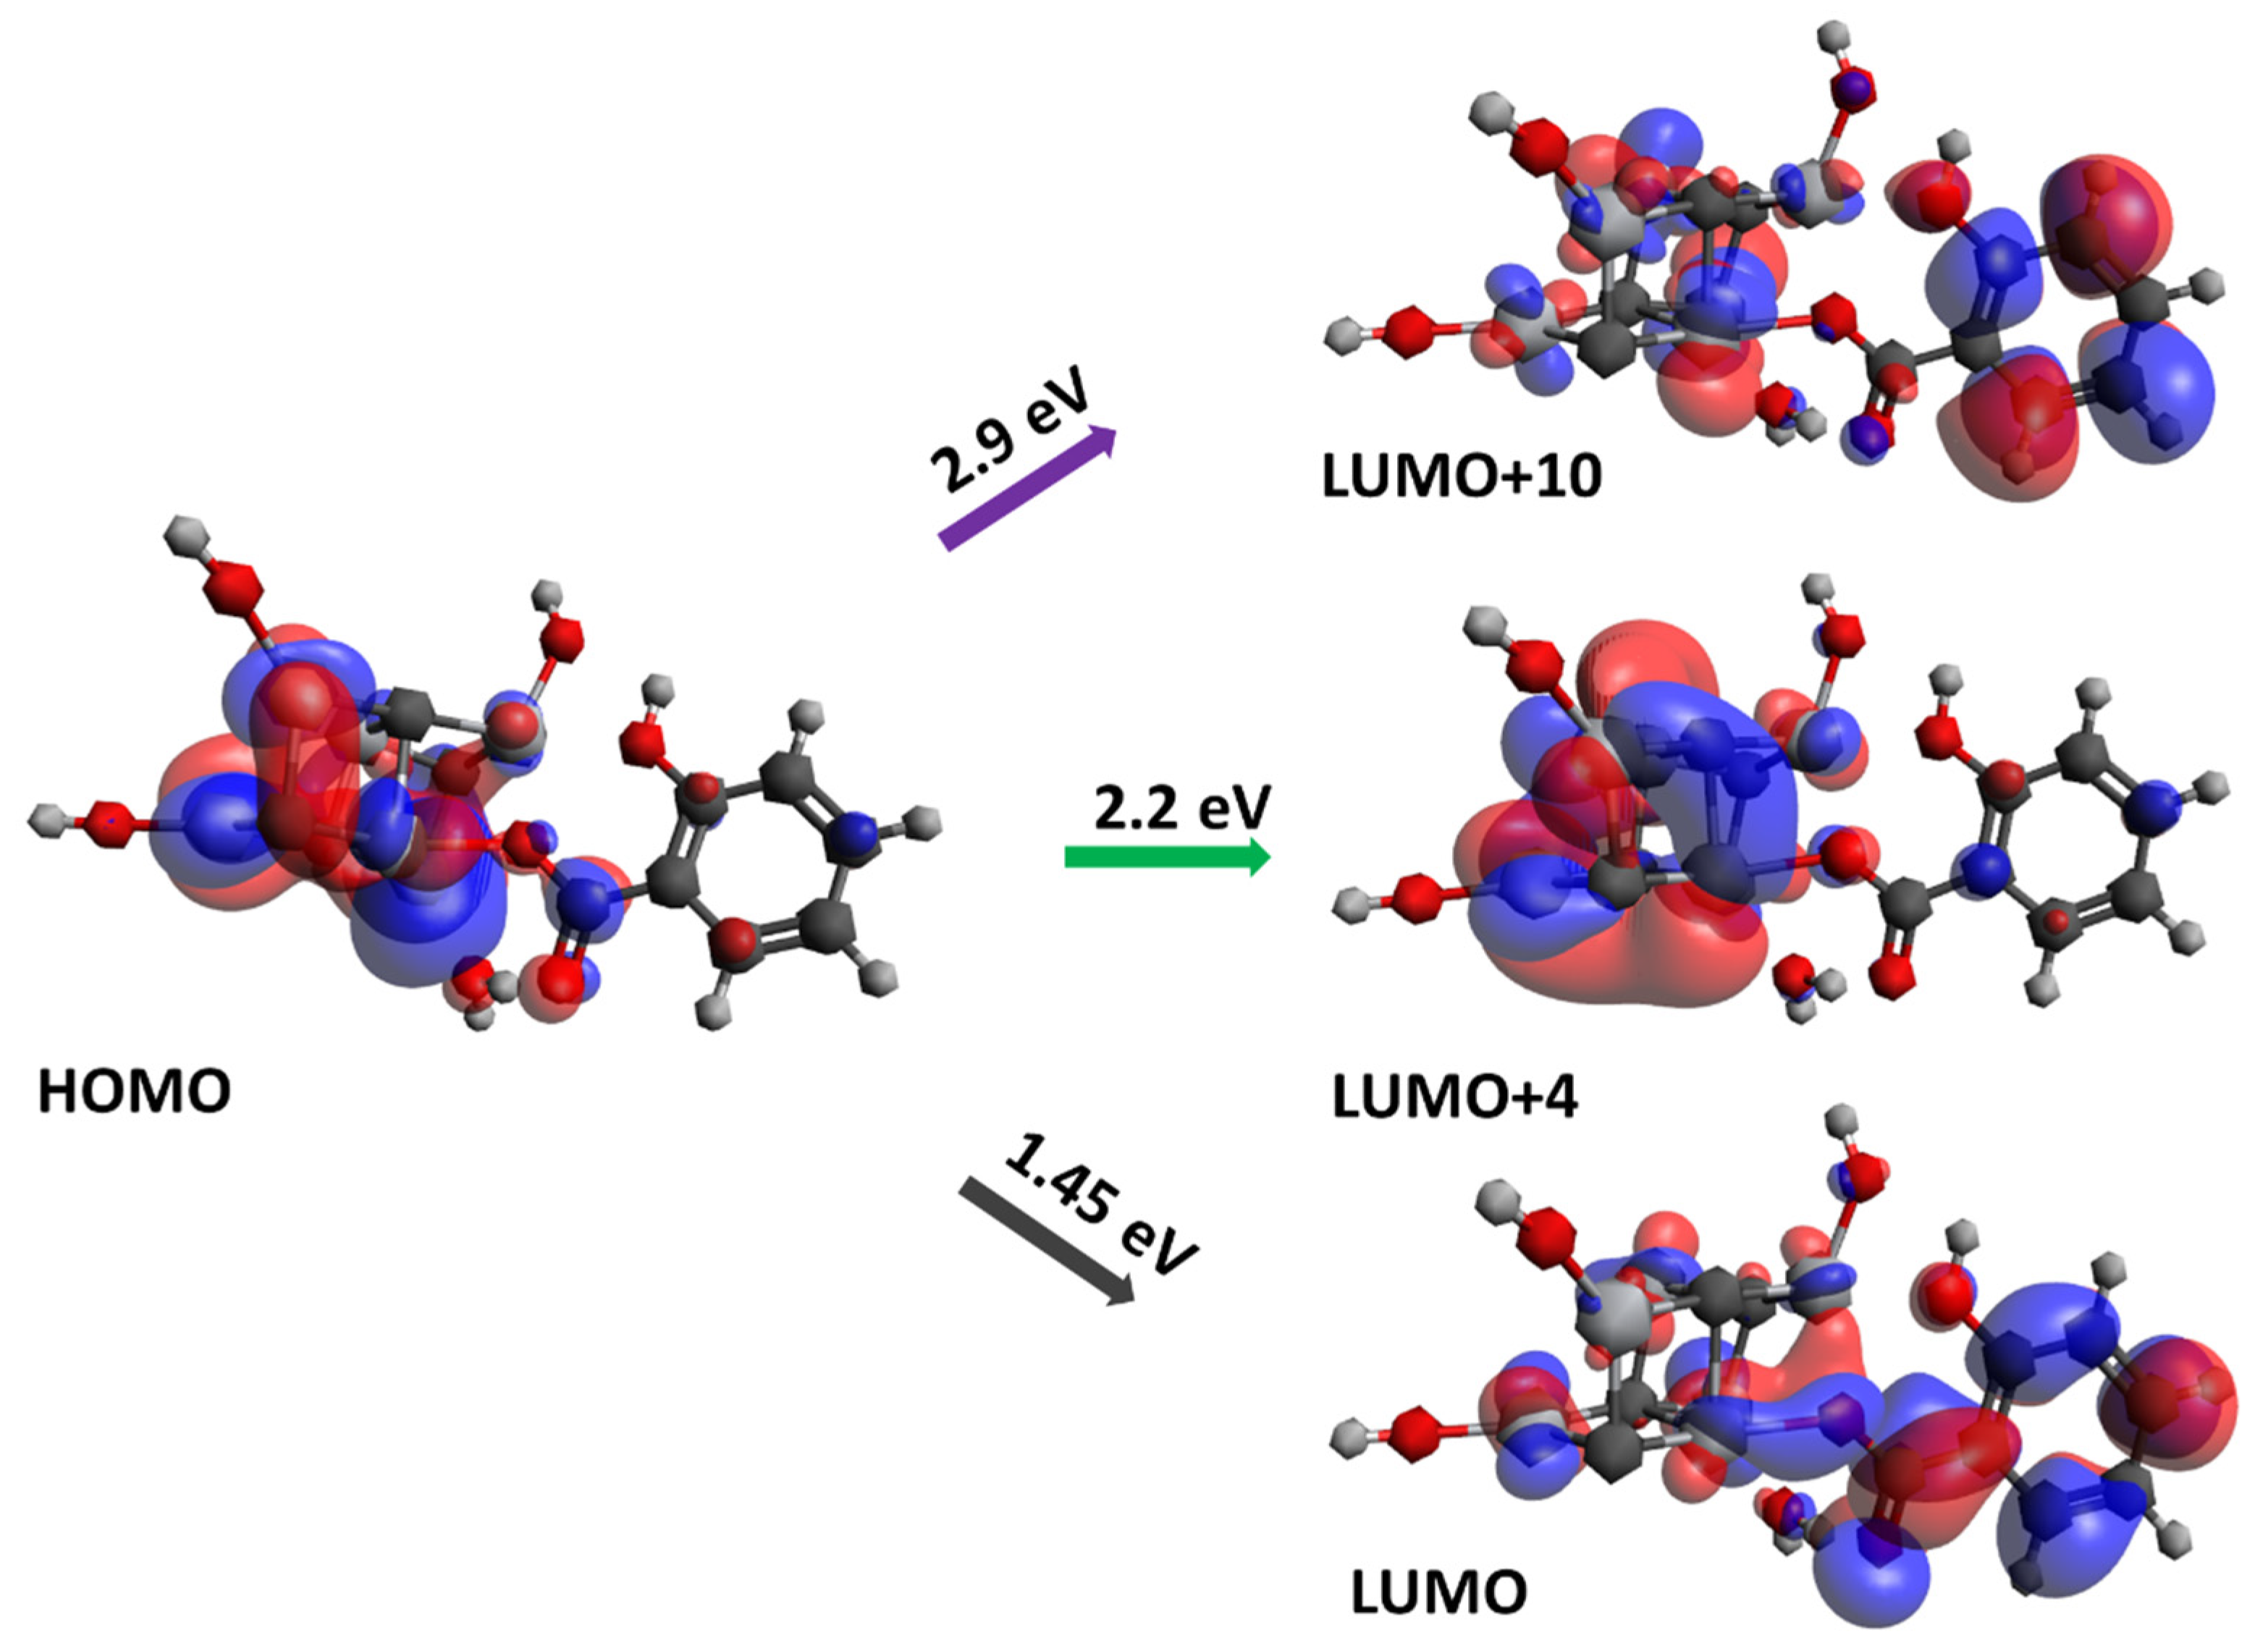
As can be expected, the electron density in the highest occupied molecular orbital minus 1 (HOMO-1) and lower molecular orbitals is focused on the donor Ti3C2(OH)2 MXene. In the HOMO molecular orbital, the electron density redistribution is already observed, also indicating the formation of a complex bond between the carboxyl group of salicylic acid and MXene, whereas in the lowest unoccupied molecular orbital (LUMO), the high electron density shifts from MXene to salicylic acid (1.45 eV). Based on the electron density in molecular orbitals, other charge transfer excitations are observed at LUMO + 4 (2.2 eV) and LUMO + 10 (2.9 eV) (Figure 9). The calculated salicylic acid–MXene complex excitations are in accordance with the observed UV-Vis absorption spectrum (Figure 6), where the most intense absorption band is observed at 400 nm (calculated—428 nm) and lower bands—at 495 nm and 595 nm (calculated—564 nm) and 1080 nm. By comparing the HOMO-LUMO excitation of the monomeric salicylic acid molecule, the required salicylic acid molecule excitation energy decreased from 4.5 eV to 2.9 eV.

4. Discussion

In the search for non-metallic SERS substrates, a very big role is placed on the very high enhancement of vibrations. Briefly, the chemical enhancement mechanism of SERS in widely used metal nanoparticles contributes to the total enhancement effect only on the order of 10–100, whereas the electromagnetic enhancement mechanism is thought to be responsible for spectral enhancement as high as 106 times [31]. Thus, the electromagnetic enhancement should enhance the molecular spectra by a huge amount. Nevertheless, the electromagnetic enhancement mechanism depends strongly on the charge carrier concentration in materials and thus their metallic properties.
During the last decade, the metallic properties of MXenes were investigated rather comprehensively. Similar to other 2D semimetals [16], MXenes show plasmonic behavior and the negative real part of the dielectric function in the near-infrared range [17,34,42,46]. Experimental findings for highly oriented MXene films reveal that at wavelengths longer than 1000 nm, the real part of the dielectric function becomes negative, indicating the onset of free-electron plasma oscillations [17,42,46]. The wavelength threshold at which MXene films become metallic depends on the film thickness [34,46], and thus can be slightly shifted. Furthermore, SEM [22] and atomic force microscopy [55] images clearly reveal the structure of MXenes as the flakes are packed in the form of multilayer sheets. After the delamination, these sheets part out. Extended studies of optical properties of the monolayer flake revealed that the free-electron plasma oscillations occur in two spectral regions: (I) at wavelengths longer than 885 nm and (II) in the narrow 615–740 nm region [42]. The surface plasmon in the latter region was assigned to transversal plasmon resonance (1.7 eV). The transversal plasmon resonance is insensitive to the size and shape of the flake, but it depends on the concentration of free charge carriers that can be altered with the different terminal groups [17,34,42,46].
In performed studies, it was reported that some molecules could interact with multilayered MXenes. Intercalated molecules increase the distance between individual Ti3C2Tx mono-sheets and, due to mechanical agitation, cause the delamination of multilayered MXene flakes. Usually, such intercalants are dimethyl sulfoxide DMSO, tetraalkylammonium hydroxide, isopropylamine, hydrazine, urea, Li+ ions [60,61] or even water molecules [62]. As a result of this process, a large surface area of MXene layers becomes available for interaction, which is desirable for the SERS enhancement. In this work, SERS spectra of the salicylic acid–MXene complex was observed for both the multilayered and delaminated MXenes (it should be noted that for the latter, SERS intensity and reproducibility were higher). This supports our prediction that salicylic acid was also responsible for partial delamination of MXene layers.
MXenes have a mixture of oxygen, hydroxyl and fluoride terminal groups that can be protonated/deprotonated at different pHs [23]. At higher hydrogen ion concentration (lower pH), the oxidation of MXenes is slowed down; therefore, a higher surface concentration of hydroxyl terminal groups is favored. Due to pronation at low pH, the hydroxyl terminal groups provide a slightly positive charge on the surface of the MXene layer. This fact should be considered while investigating the mechanism of interaction between MXene and salicylic acid. Moreover, salicylic acid is deprotonated in deionized water (loses hydrogen ions from the carboxylic group); thus, it has a negative charge localized at the carboxylic group that also favors the formation of hydrogen bonds with terminal hydroxyl groups. Therefore, salicylic acid adsorbs well to the hydroxyl-terminated MXene layer.
Out-of-plane vibrations of salicylic acid are enhanced when the molecule interacts with MXene. These spectral changes indicate the molecule of salicylic acid is lying flat on the MXene film. It is known that for dye molecules, charge transfer between the electronic dye level and MXene electronic level takes place, and as a consequence, the dye molecules experience enhancement. Nevertheless, the electromagnetic enhancement mechanism from MXenes, which is expected, was still not observed, neither in our study nor to the best of our knowledge in any other studies.

5. Conclusions

The surface-enhanced effect of spectral Raman bands of salicylic acid adsorbed on Ti3C2Tx-based MXene film was observed for the first time. The adsorption of the salicylic acid molecule and the formation of a salicylic acid–MXene complex was confirmed by experimental spectral observations such as substantial enhancement of out-of-plane bending modes of salicylic acid at 896 cm−1, 681 cm−1 and 654 cm−1. Additionally, other spectral features indicate the adsorption of salicylic acids, such as the redshift of some vibrational frequencies as well as the disappearance of the carboxyl deformation spectral band at 771 cm−1. The values of calculated experimental enhancement factors indicate that chemical enhancement mechanisms are dominant in SERS spectra of salicylic acid adsorbed on the MXene surface. For the deformation out-of-plane vibrational modes, this factor varies from 220 (at λ = 532 nm) to 60 (at λ = 1064 nm).

Author Contributions

Conceptualization: S.A.-G. and A.R.; Methodology: S.A.-G., A.P., S.R. and O.G.; Software: S.A.-G. and V.Š., formal analysis: S.A.-G., A.P., S.R. and O.G.; Writing—original draft preparation: S.A.-G.; Writing—review and editing: V.Š. A.P., S.R. and A.R.; Supervision: V.Š. and A.R. All authors have read and agreed to the published version of the manuscript.

Funding

This project has received funding from H2020 Marie Skłodowska-Curie Actions (CanBioSe 778157, SALSETH 872370).

Institutional Review Board Statement

Not applicable.

Informed Consent Statement

Not applicable.

Data Availability Statement

Not applicable.

Acknowledgments

Computations were performed on resources at the High Performance Computing Center, ‘HPC Sauletekis’, at the Vilnius University Faculty of Physics.

Conflicts of Interest

The authors declare no conflict of interest.

References

  1. Yan, Y.; Cheng, Z.; Li, W.; Jin, K.; Wang, W. Graphene, a material for high temperature devices—Intrinsic carrier density, carrier drift velocity and lattice energy. Sci. Rep. 2014, 4, 5758. [Google Scholar] [CrossRef] [Green Version]
  2. Song, Q.; Ye, F.; Kong, L.; Shen, Q.; Han, L.; Feng, L.; Yu, G.; Pan, Y.; Li, H. Graphene and MXene Nanomaterials: Toward High-Performance Electromagnetic Wave Absorption in Gigahertz Band Range. Adv. Funct. Mater. 2020, 30, 2000475. [Google Scholar] [CrossRef]
  3. Naguib, M.; Kurtoglu, M.; Presser, V.; Lu, J.; Niu, J.; Heon, M.; Hultman, L.; Gogotsi, Y.; Barsoum, M.W. Two-dimensional nanocrystals produced by exfoliation of Ti3AlC2. Adv. Mater. 2011, 23, 4248–4253. [Google Scholar] [CrossRef] [Green Version]
  4. Gogotsi, Y.; Anasori, B. The rise of MXenes. CS Nano 2019, 13, 8491–8494. [Google Scholar] [CrossRef] [Green Version]
  5. Bhat, A.; Anwer, S.; Bhat, K.S.; Mohideen, M.I.H.; Liao, K.; Qurashi, A. Prospects challenges and stability of 2D MXenes for clean energy conversion and storage applications. NPJ 2D Mater. Appl. 2021, 5, 61. [Google Scholar] [CrossRef]
  6. Papadopoulou, K.A.; Chroneos, A.; Parfitt, D.; Christopoulos, S. A perspective on MXenes: Their synthesis, properties, and recent applications. J. Appl. Phys. 2020, 128, 17. [Google Scholar] [CrossRef]
  7. Anasori, B.; Luhatskaya, M.R.; Gogotsi, Y. 2D metal carbides and nitrides (MXenes) for energy storage. Nat. Rev. Mater. 2017, 2, 16098. [Google Scholar] [CrossRef]
  8. Shahzad, F.; Iqbal, A.; Kim, H.; Koo, C.M. 2D Transition Metal Carbides (MXenes): Applications as an Electrically Conducting Material. Adv. Mater. 2020, 32, 2002159. [Google Scholar] [CrossRef]
  9. Sinha, A.; Zhao, H.; Huang, Y.; Lu, X.; Chen, J.; Jain, R. MXene: An emerging material for sensing and biosensing. TrAC Trends Anal. Chem. 2018, 105, 424–435. [Google Scholar] [CrossRef]
  10. Ramanavicius, S.; Ramanavicius, A. Progress and Insights in the Application of MXenes as New 2D Nano-Materials Suitable for Biosensors and Biofuel Cell Design. Int. J. Mol. Sci. 2020, 21, 9224. [Google Scholar] [CrossRef]
  11. Xie, X.; Chen, S.; Ding, W.; Nie, Y.; Wei, Z. An extraordinarily stable catalyst: Pt NPs supported on two-dimensional Ti3C2X2 (X= OH, F) nanosheets for oxygen reduction reaction. Chem. Commun. 2013, 49, 10112–10114. [Google Scholar] [CrossRef] [PubMed]
  12. Zhang, J.; Zhao, Y.; Guo, X.; Chen, C.; Dong, C.L.; Liu, R.S.; Han, C.P.; Li, Y.; Gogotsi, Y.; Wang, G. Single platinum atoms immobilized on an MXene as an efficient catalyst for the hydrogen evolution reaction. Nat. Catal. 2018, 1, 985–992. [Google Scholar] [CrossRef]
  13. Ran, J.; Gao, G.; Li, F.T.; Ma, T.Y.; Du, A.; Qiao, S.Z. Ti3C2 MXene co-catalyst on metal sulfide photo-absorbers for enhanced visible-light photocatalytic hydrogen production. Nat. Commun. 2017, 8, 13907. [Google Scholar] [CrossRef] [Green Version]
  14. Yin, L.; Li, Y.; Yao, X.; Wang, Y.; Jia, L.; Liu, Q.; Li, J.; Li, Y.; He, D. MXenes for Solar Cells. Nano-Micro Lett. 2021, 13, 78. [Google Scholar] [CrossRef]
  15. Enyashin, A.N.; Ivanovskii, A.L. Two-dimensional titanium carbonitrides and their hydroxylated derivatives: Structural, electronic properties and stability of MXenes Ti3C2−xNx(OH)2 from DFTB calculations. J. Solid State Chem. 2013, 207, 42–48. [Google Scholar] [CrossRef] [Green Version]
  16. Zhu, Z.; Zou, Y.; Hu, W.; Li, Y.; Gu, Y.; Cao, B.; Guo, N.; Wang, L.; Song, J.; Zhang, S.; et al. Near-Infrared Plasmonic 2D Semimetals for Applications in Communication and Biology. Adv. Funct. Mater. 2016, 26, 1793–1802. [Google Scholar] [CrossRef]
  17. Dillon, A.D.; Ghidiu, M.J.; Krick, A.L.; Griggs, J.; May, S.J.; Gogotsi, Y.; Barsoum, M.W.; Fafarman, A.T. Highly conductive optical quality solution-processed films of 2D titanium carbide. Adv. Funct. Mater. 2016, 26, 4162–4168. [Google Scholar] [CrossRef]
  18. Miranda, A.; Halim, J.; Barsoum, M.W.; Lorke, A. Electronic properties of freestanding Ti3C2Tx MXene monolayers. Appl. Phys. Lett. 2016, 108, 033102. [Google Scholar] [CrossRef]
  19. Lee, K.S.; El-Sayed, M.A. Gold and Silver Nanoparticles in Sensing and Imaging: Sensitivity of Plasmon Response to size, shape, and metal composition. J. Phys. Chem. B 2016, 110, 19220–19225. [Google Scholar] [CrossRef] [PubMed]
  20. Hart, J.L.; Hantanasirisakul, K.; Lang, A.C.; Anasori, B.; Pinto, D.; Pivak, Y.; van Omme, J.T.; May, S.J.; Gogotsi, Y.; Taheri, M.L. Control of MXenes’ electronic properties through termination and intercalation. Nat. Commun. 2019, 10, 522. [Google Scholar] [CrossRef] [Green Version]
  21. Mariano, M.; Mashtalir, O.; Antonio, F.Q.; Ryu, W.H.; Deng, B.; Xia, F.; Gogotsi, Y.; Taylor, A.D. Solution-processed titanium carbide MXene films examined as highly transparent conductors. Nanosale 2016, 8, 16371–16378. [Google Scholar] [CrossRef] [PubMed]
  22. Melchior, S.A.; Raju, K.; Ike, I.S.; Erasmus, R.M.; Kabongo, G.; Sigalas, I.; Iyuke, S.E.; Ozoemena, K.I. High-voltage symmetric supercapacitor based on 2d titanium carbide (mxene, Ti2CTx)/carbon nanosphere composites in a neutral aqueous electrolyte. J. Electrochem. Soc. 2018, 165, A501–A511. [Google Scholar] [CrossRef] [Green Version]
  23. Echols, I.J.; An, H.; Zhao, X.; Prehn, E.M.; Tan, Z.; Radovic, M.; Green, M.J.; Lutkenhaus, J.L. pH-Response of polycation/Ti3C2Tx MXene layer-by-layer assemblies for use as resistive sensors. Mol. Syst. Des. Eng. 2020, 5, 366–375. [Google Scholar] [CrossRef]
  24. Lorencova, L.; Bertok, T.; Dosekova, E.; Holazova, A.; Paprckova, D.; Vikartovska, A.; Sasinkova, V.; Filip, J.; Kasak, P.; Jerigova, M.; et al. Electrochemical performance of Ti3C2Tx MXene in aqueous media: Towards ultrasensitive H2O2 sensing. Electrochim. Acta 2017, 235, 471–479. [Google Scholar] [CrossRef] [Green Version]
  25. An, H.; Habib, T.; Shah, S.; Gao, H.; Patel, A.; Echols, I.; Zhao, X.; Radovic, M.; Green, M.J.; Lutkenhaus, J.L. Water sorption in MXene/polyelectrolyte multilayers for ultrafast humidity sensing. ACS Appl. Nano Mater. 2019, 2, 948–955. [Google Scholar] [CrossRef]
  26. Song, D.; Jiang, X.; Li, Y.; Lu, X.; Luan, S.; Wang, Y.; Li, Y.; Gao, F. Metal–organic frameworks-derived MnO2/Mn3O4 microcuboids with hierarchically ordered nanosheets and Ti3C2 MXene/Au NPs composites for electrochemical pesticide detection. J. Hazard. Mater. 2019, 373, 367–376. [Google Scholar] [CrossRef]
  27. Kim, H.; Wang, Z.; Alshareef, H.N. MXetronics: Electronic and photonic applications of MXenes. Nano Energy 2019, 60, 179–197. [Google Scholar] [CrossRef]
  28. Velusamy, D.B.; El-Demellawi, J.K.; El-Zohry, A.M.; Giugni, A.; Lopatin, S.; Hedhili, M.N.; Mansour, A.E.; Fabrizio, E.D.; Mohammed, O.F.; Alshareef, H.N. MXenes for Plasmonic Photodetection. Adv. Mater. 2019, 31, 1807658. [Google Scholar] [CrossRef]
  29. Zhu, X.; Liu, P.; Xue, T.; Ge, Y.; Ai, S.; Sheng, Y.; Wu, R.; Xu, L.; Tang, K.; Wen, Y. A novel graphene-like titanium carbide MXene/Au–Ag nanoshuttles bifunctional nanosensor for electrochemical and SERS intelligent analysis of ultra-trace carbendazim coupled with machine learning. Ceram. Int. 2021, 47, 173–184. [Google Scholar] [CrossRef]
  30. Hu, M.; Li, Z.; Hu, T.; Zhu, S.; Zhang, C.; Wang, X. High-Capacitance Mechanism for Ti3C2Tx MXene by in Situ Electrochemical Raman Spectroscopy Investigation. ACS Nano 2016, 10, 11344–11350. [Google Scholar] [CrossRef]
  31. Le Ru, E.; Etchegoin, P. Principles of Surface-Enhanced Raman Spectroscopy: And Related Plasmonic Effects; Elsevier: Amsterdam, The Netherlands, 2008. [Google Scholar]
  32. Liu, R.; Jiang, L.; Lu, C.; Yu, Z.; Li, F.; Jing, X.; Xu, R.; Zhou, W.; Jin, S. Large-scale two-dimensional titanium carbide MXene as SERS-active substrate for reliable and sensitive detection of organic pollutants. Spectrochim. Acta Part A Mol. Biomol. Spectrosc. 2020, 236, 118336. [Google Scholar] [CrossRef] [PubMed]
  33. Elumalai, S.; Lombardi, J.R.; Yoshimura, M. The surface-enhanced resonance Raman scattering of dye molecules adsorbed on two-dimensional titanium carbide Ti3C2Tx (MXene) film. Mater. Adv. 2020, 1, 146–152. [Google Scholar] [CrossRef] [Green Version]
  34. Mauchamp, V.; Bugnet, M.; Bellido, E.P.; Botton, G.A.; Moreau, P.; Magne, D.; Naguib, M.; Cabioc’h, T.; Barsoum, M.W. Enhanced and tunable surface plasmons in two-dimensional Ti3C2 stacks:Electronic structure versus boundary effects. Phys. Rev. B 2014, 89, 235428. [Google Scholar] [CrossRef]
  35. Lashgari, H.; Abolhassani, M.R.; Boochani, A.; Elahi, S.M.; Khodadadi, J. Electronic and optical properties of 2D graphene-like compounds titanium carbides and nitrides: DFT calculations. Solid State Commun. 2014, 195, 61–69. [Google Scholar] [CrossRef]
  36. Kumada, N.; Tanabe, S.; Hibino, H.; Kamata, H.; Hashisaka, M.; Muraki, K.; Fujisawa, T. Plasmon transport in graphene investigated by time-resolved electrical measurements. Nat. Commun. 2013, 4, 1363. [Google Scholar] [CrossRef] [Green Version]
  37. Frish, M.J.; Trucks, G.W.; Schlegel, H.B.; Scuseria, G.E.; Robb, M.A.; Cheeseman, J.R.; Scalmani, G.; Barone, V.; Mennucci, B.; Paterson, G.A. Gaussian 09, Revision A.02; Gaussian Inc.: Wallingford, CT, USA, 2009. [Google Scholar]
  38. Alhabeb, M.; Maleski, K.; Anasori, B.; Lelyukh, P.; Clark, L.; Sin, S.; Gogotsi, Y. Guidelines for Synthesis and Processing of Two-Dimensional Titanium Carbide (Ti3C2Tx MXene). Chem. Mater. 2017, 29, 7633–7644. [Google Scholar] [CrossRef]
  39. Shekhirev, M.; Shuck, C.E.; Sarycheva, A.; Gogotsi, Y. Characterization of MXenes at every step, from their precursors to single flakes and assembled films. Prog. Mater. Sci. 2020, 120, 100757. [Google Scholar] [CrossRef]
  40. Rasool, K.; Helal, M.; Ali, A.; Ren, C.; Gogotsi, Y.; Mahmoud, K. Antibacterial Activity of Ti3C2Tx MXene. ACS Nano 2016, 10, 3674–3684. [Google Scholar] [CrossRef] [PubMed] [Green Version]
  41. Xia, Y.; Mathis, T.S.; Zhao, M.Q.; Anasori, B.; Dang, A.; Zhou, Z.; Cho, H.; Gogotsi, Y.; Yang, S. Thickness-independent capacitance of vertically aligned liquid-crystalline MXenes. Nature 2018, 557, 409–412. [Google Scholar] [CrossRef]
  42. El-Demellawi, J.K.; Lopatin, S.; Yin, J.; Mohammed, O.F.; Alshareef, H.N. Tunable Multipolar Surface Plasmons in 2D Ti3C2Tx MXene Flakes. ACS Nano 2018, 12, 8485–8493. [Google Scholar] [CrossRef] [PubMed]
  43. Halim, J.; Lukatskaya, M.R.; Cook, K.M.; Lu, J.; Smith, C.R.; Näslund, L.Å.; May, S.J.; Hultman, L.; Gogotsi, Y.; Eklund, P.; et al. Transparent Conductive Two-Dimensional Titanium Carbide Epitaxial Thin Films. Chem. Mater. 2014, 26, 2374–2381. [Google Scholar] [CrossRef]
  44. Lioi, D.B.; Neher, G.; Heckler, J.E.; Back, T.; Mehmood, F.; Nepal, D.; Pachter, R.; Vaia, R.; Kennedy, W.J. Electron-Withdrawing Effect of Native Terminal Groups on the Lattice Structure of Ti3C2Tx MXenes Studied by Resonance Raman Scattering: Implications for Embedding MXenes in Electronic Composites. ACS Appl. Nano Mater. 2019, 2, 6087–6091. [Google Scholar] [CrossRef]
  45. Sarycheva, A.; Makaryan, T.; Maleski, K.; Satheeshkumar, E.; Melikyan, A.; Minassian, H.; Yoshimura, M.; Gogotsi, Y. Two-dimensional titanium carbide (MXene) as surface-enhanced Raman scattering substrate. J. Phys. Chem. C 2017, 121, 19983–19988. [Google Scholar] [CrossRef]
  46. Chaudhuri, K.; Alhabeb, M.; Wang, Z.; Shalaev, V.M.; Gogotsi, Y.; Boltasseva, A. Highly Broadband Absorber Using Plasmonic Titanium Carbide. ACS Photonics 2018, 5, 1115–1122. [Google Scholar] [CrossRef]
  47. Lotfi, R.; Naguib, M.; Yilmaz, D.E.; Nanda, J.; Van Duin, A.C. A comparative study on the oxidation of two-dimensional Ti 3 C 2 MXene structures in different environments. J. Mater. Chem. A 2018, 6, 12733–12743. [Google Scholar] [CrossRef]
  48. Naguib, M.; Mashtalir, O.; Lukatskaya, M.R.; Dyatkin, B.; Zhang, C.; Presser, V.; Gogotsi, Y.; Barsoum, M.W. One-step synthesis of nanocrystalline transition metal oxides on thin sheets of disordered graphitic carbon by oxidation of MXenes. Chem. Commun. 2014, 50, 7420–7423. [Google Scholar] [CrossRef] [Green Version]
  49. Hu, T.; Wang, J.; Zhang, H.; Li, Z.; Hu, M.; Wang, X. Vibrational properties of Ti3C2 and Ti3C2T2 (T = O, F, OH) monosheets by first-principles calculations: A comparative study. Phys. Chem. Chem. Phys. 2015, 17, 9997–10003. [Google Scholar] [CrossRef]
  50. Sang, X.; Xie, Y.; Lin, M.W.; Alhabeb, M.; Van Aken, K.L.; Gogotsi, Y.; Kent, P.R.; Xiao, K.; Unocic, R.R. Atomic Defects in Monolayer Titanium Carbide (Ti3C2Tx) MXene. ACS Nano 2016, 10, 9193–9200. [Google Scholar] [CrossRef] [PubMed]
  51. Childres, I.; Jauregui, L.A.; Park, W.; Cao, H.; Chen, Y.P. Raman spectroscopy of graphene and related materials. New Dev. Photon Mater. Res. 2013, 1, 1–20. [Google Scholar]
  52. Albrecht, A.C. On the theory of Raman intensities. J. Chem. Phys. 1961, 34, 1476–1484. [Google Scholar] [CrossRef]
  53. Hirakawa, A.Y.; Tsuboi, M. Molecular geometry in an excited electronic state and a preresonance Raman effect. Science 1975, 188, 359–361. [Google Scholar] [CrossRef]
  54. Hu, M.; Hu, T.; Li, Z.; Yang, Y.; Cheng, R.; Yang, J.; Cui, C.; Wang, X. Surface functional groups and interlayer water determine the electrochemical capacitance of Ti3C2Tx MXene. ACS Nano 2018, 12, 3578–3586. [Google Scholar] [CrossRef] [PubMed]
  55. Sarycheva, A.; Gogotsi, Y. Raman Spectroscopy Analysis of the Structure and Surface Chemistry of Ti3C2Tx MXene. Chem. Mater. 2020, 32, 3480–3488. [Google Scholar] [CrossRef]
  56. Wang, H.W.; Naguib, M.; Page, K.; Wesolowski, D.J.; Gogotsi, Y. Resolving the structure of Ti3C2Tx mxenes through multilevel structural modeling of the atomic pair distribution function. Chem. Mater. 2016, 28, 349–359. [Google Scholar] [CrossRef]
  57. Ibragimova, R.; Puska, M.J.; Komsa, H.P. pH-dependent distribution of functional groups on titanium-based MXenes. ACS Nano 2019, 13, 9171–9181. [Google Scholar] [CrossRef] [Green Version]
  58. Wilson, E.B. The Normal Modes and Frequencies of Vibration of the Regular Plane Hexagon Model of the Benzene Molecule. Phys. Rev. 1934, 45, 706–714. [Google Scholar] [CrossRef]
  59. Adomavičiūtė, S.; Velička, M.; Šablinskas, V. Detection of aspirin traces in blood by means of surface-enhanced Raman scattering spectroscopy. J. Raman Spectrosc. 2020, 51, 919–931. [Google Scholar] [CrossRef]
  60. Mashtalir, O.; Naguib, M.; Mochalin, V.N.; Dall’Agnese, Y.; Heon, M.; Barsoum, M.W.; Gogotsi, Y. Intercalation and delamination of layered carbides and carbonitrides. Nat. Commun. 2013, 4, 1716. [Google Scholar] [CrossRef] [PubMed]
  61. Naguib, M.; Come, J.; Dyatkin, B.; Presser, V.; Taberna, P.L.; Simon, P.; Barsoum, M.W.; Gogotsi, Y. MXene: A promising transition metal carbide anode for lithium-ion batteries. Electrochem. Commun. 2012, 16, 61–64. [Google Scholar] [CrossRef] [Green Version]
  62. Ghidiu, M.; Lukatskaya, M.R.; Zhao, M.Q.; Gogotsi, Y.; Barsoum, M.W. Conductive two-dimensional titanium carbide ‘clay’with high volumetric capacitance. Nature 2014, 516, 78–81. [Google Scholar] [CrossRef] [PubMed]
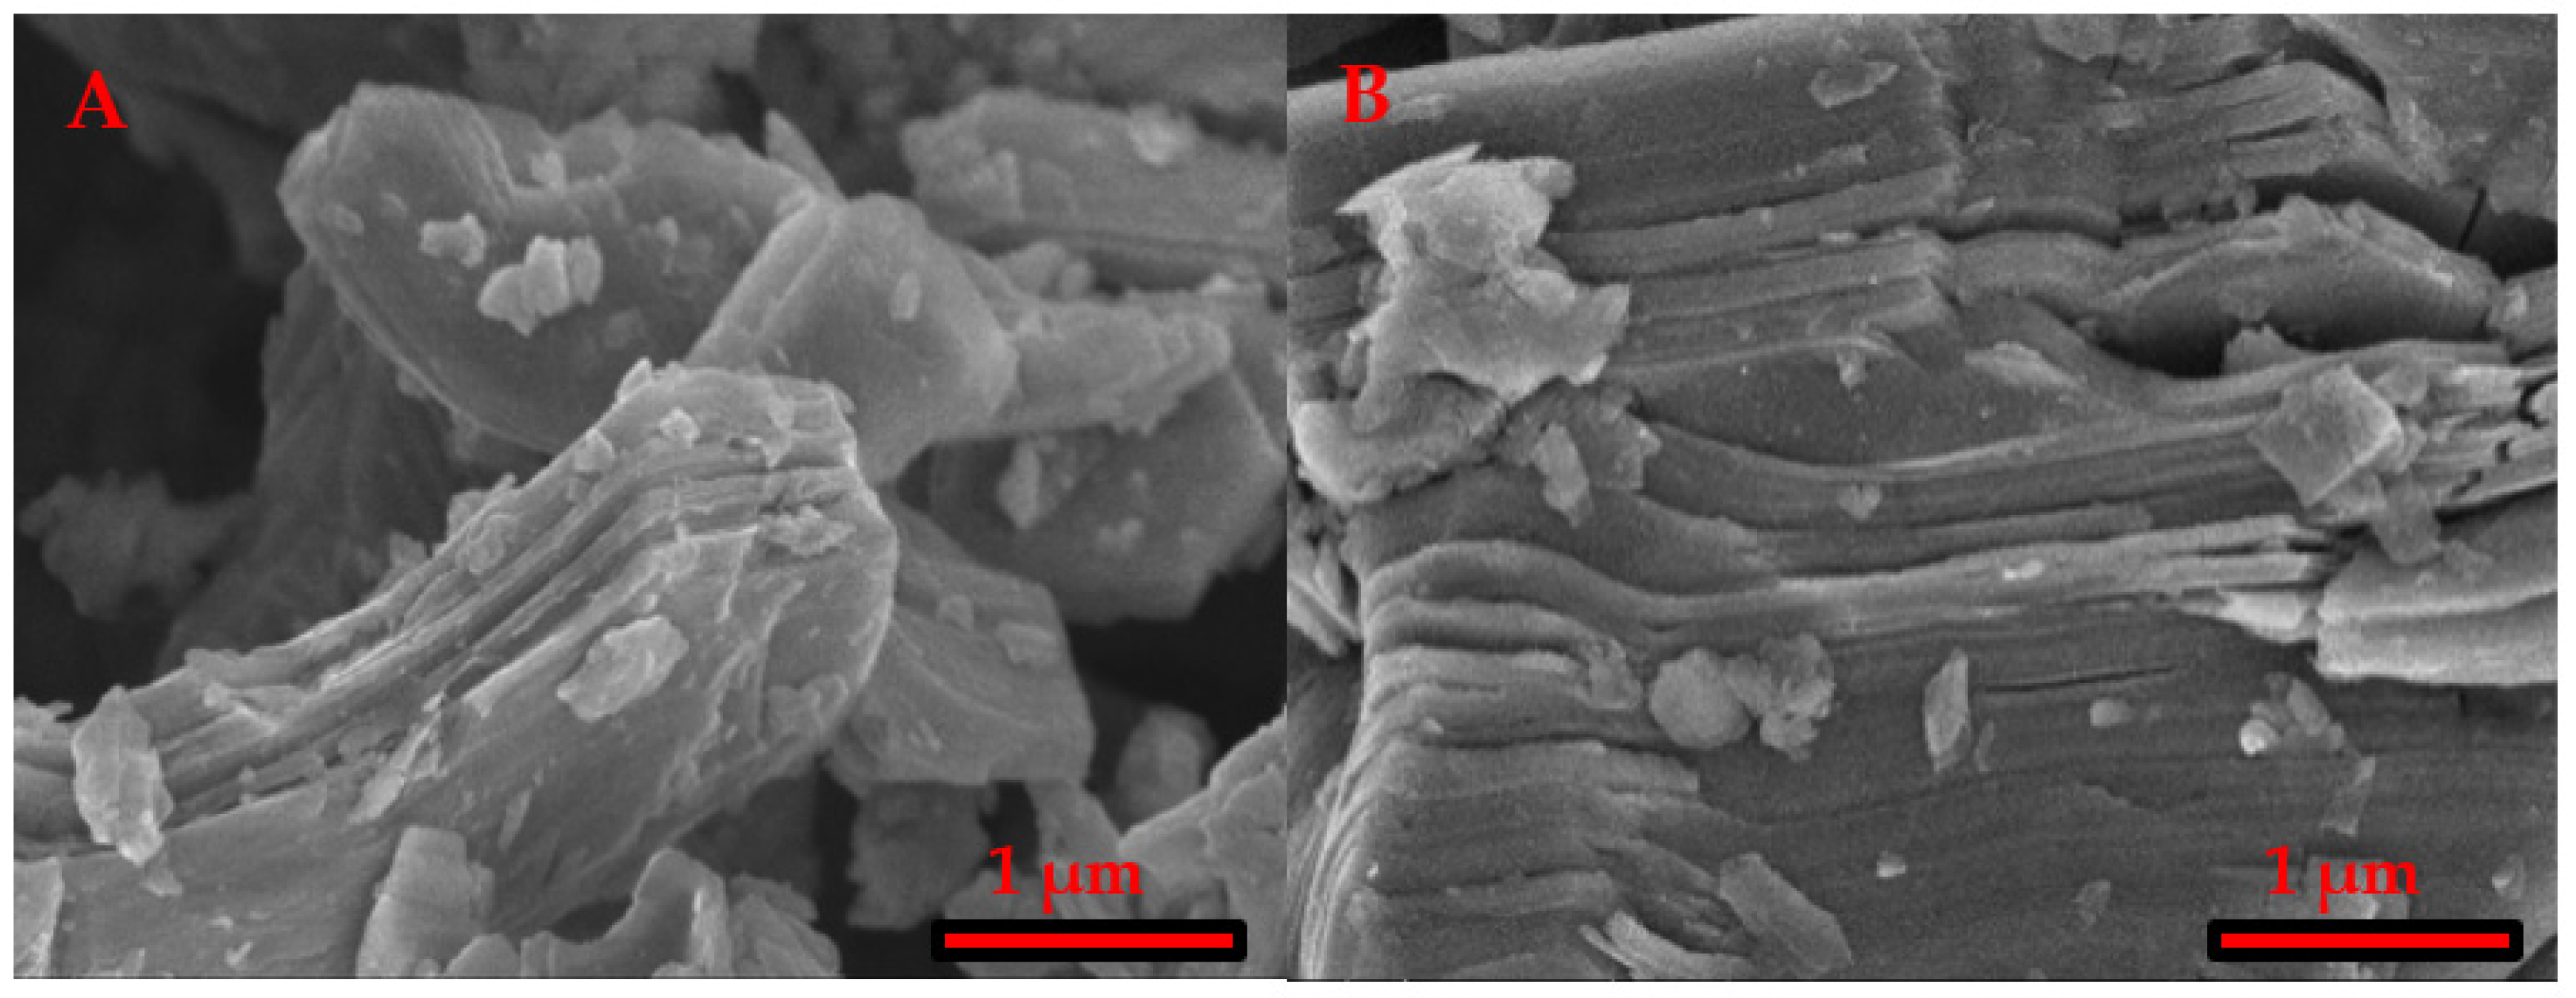
Figure 1. SEM images of (A) MAX phase (Ti3AlC2) and (B) MXenes (Ti3C2Tx).
Chemosensors 09 00223 g001
Figure 2. XRD patterns of MAX phase (Ti3AlC2) and MXene (Ti3C2Tx) powders.
Chemosensors 09 00223 g002
Figure 3. UV-Vis-NIR absorption spectrum of dried 70 nm thick Ti3C2Tx MXene film on the glass slide.
Chemosensors 09 00223 g003
Figure 4. Raman spectra of MXene film with 532 nm (bottom), 633 nm (middle) and 785 nm (top) excitation.
Chemosensors 09 00223 g004
Figure 5. Raman spectra of MXene film (bottom) and salicylic acid: dried on MXene surface (middle) and on aluminum foil (top). Excitation wavelength—633 nm.
Chemosensors 09 00223 g005
Figure 6. UV-Vis-NIR absorption spectra of the Ti3C2Tx-based MXene film (dotted line) and salicylic acid (straight line) dried on the MXene (a); differential spectrum (b). Inset—optical microscope images of MXene film (left) and salicylic acid dried on the MXene film (right).
Chemosensors 09 00223 g006
Figure 7. Raman spectra of salicylic acid–MXene complex with different excitations. Excitations from top to bottom: 457 nm; 532 nm; 633 nm; 785 nm; 1064 nm.
Chemosensors 09 00223 g007
Figure 8. Calculated SERS enhancement factor (EF) for 2 mM salicylic acid dried on the MXene film with different excitation wavelengths.
Chemosensors 09 00223 g008
Figure 9. Calculated (B3LYP/LanL2DZ) molecular orbitals of salicylic acid–MXene complex and required transition energy.
Chemosensors 09 00223 g009
Table 1. EDX analysis results for aluminum (Al) and titanium (Ti) atomic ratio in MAX phase and MXene samples.
SampleAtomic Ratio, %
Aluminum (Al)Titanium (Ti)
MAX phase (Ti3AlC2)39.39 ± 0.9660.61 ± 0.96
MXenes (Ti3C2Tx)6.33 ± 1.9793.67 ± 1.97
Table 2. Vibrational frequencies of Ti3C2Tx-based MXene films.
Vibrational Freq., cm−1Calculated Freq., cm−1 [49]Assignments [49]
532 nm633 nm785 nm
W129120128(Ti,C)ip, Ti3C2F2; ω1
198198199190(Ti,F)oop, Ti3C2F2; ω2
257W258231(F)ip, Ti3C2F2; ω5
287281280278(OH)ip, Ti3C2(OH)2; ω5
390371366347(O)ip, Ti3C2O2; ω5
W511 a513 b514(OH)oop, Ti3C2(OH)2; ω6
590 a589 a584 a586(O)oop, Ti3C2O2; ω6
621620615622(C)ip, Ti3C2(OH)2; ω4
673 a667 a655684(C)oop, Ti3C2(OH)2; ω3
715709 a722 b730(C)oop, Ti3C2O2; ω3
WWW D band
155015811520 a G band
a Decreased intensity in spectral band compared to 785 nm excitation. b Increased intensity in spectral band compared to 785 nm excitation. W Not prominent or weak band. ip In-plane phonon mode. oop Out-of-plane phonon mode.
Table 3. Vibrational frequencies of crystalline salicylic acid and SA–MXene complex.
Crystalline Salicylic Acid, Freq. cm−1Salicylic Acid on MXenes, Freq. cm−1Assignments
180-δoop(C-COOH)
258-δip(C-COOH)
286-δip(C-OH)
452-δip(C-COOH)
-473δoop(ring) + δoop (OH)
534-δoop(ring)
568-δoop(O-H) a + δoop(ring)
-595δip(C-C, ring)+ δoop(OH)
657654 δip(-COOH) + δoop(ring)
705681 δoop(ring) + δoop(O-H) a
773-δip(C-H) a + 6 c
850861ν(C-OH) b+ δip(ring)
876896 δoop(C-H); 17 c
1031103118 c?
1093 δ(O-H) b
11541145δ(O-H) a
1164-15 c
12441232δ(O-H) a + ν(C-COOH)
1307-δ(O-H) a
13251311δ(C-O) b
1386139714 c + δ(C-O) b
1473146719 c
158315678 c
16361597 ν(C=O) a
a Vibration of atoms in –COOH functional group. b Vibration of atoms in –OH functional group. Increased intensity. Decreased intensity. Stretching vibration. δ Deformation vibration. oop Out-of-plane. ip In-plane. c Modes derived from benzene [58].
Table 4. Comparison of enhancement factors for salicylic acid achieved with different materials.
Substrate MaterialExcitationEnhancement Factor
Citrate-stabilized AgNPs1064 nm2.5 × 104
Polymer-stabilized AgNPs1064 nm1.2 × 104
Citrate-stabilized AuNPs1064 nm2.5 × 103
Polymer-stabilized AuNPs1064 nm3.8 × 103
Ti3C2Tx MXene532 nm2.2 × 102
AgNPs—silver nanoparticles. AuNPs—gold nanoparticles.
Publisher’s Note: MDPI stays neutral with regard to jurisdictional claims in published maps and institutional affiliations.