
Multi-Sensor Characterization of Sparkling Wines Based on Data Fusion


Abstract
:
1. Introduction
2. Materials and Methods
2.1. Reagents and Solutions
2.2. Samples
2.3. Instruments and Laboratory Equipment
2.4. Methods
2.4.1. Phenolic Profiling by HPLC
2.4.2. FC Assay
2.4.3. FRAP Assay
2.4.4. Organic Acid Profiling by HPLC
2.4.5. The pH
2.4.6. Total Acidity
2.4.7. Enzymatic Determination of Organic Acids
2.4.8. Fourier-Transform Infrared Spectroscopy
2.5. Data Analysis
3. Results
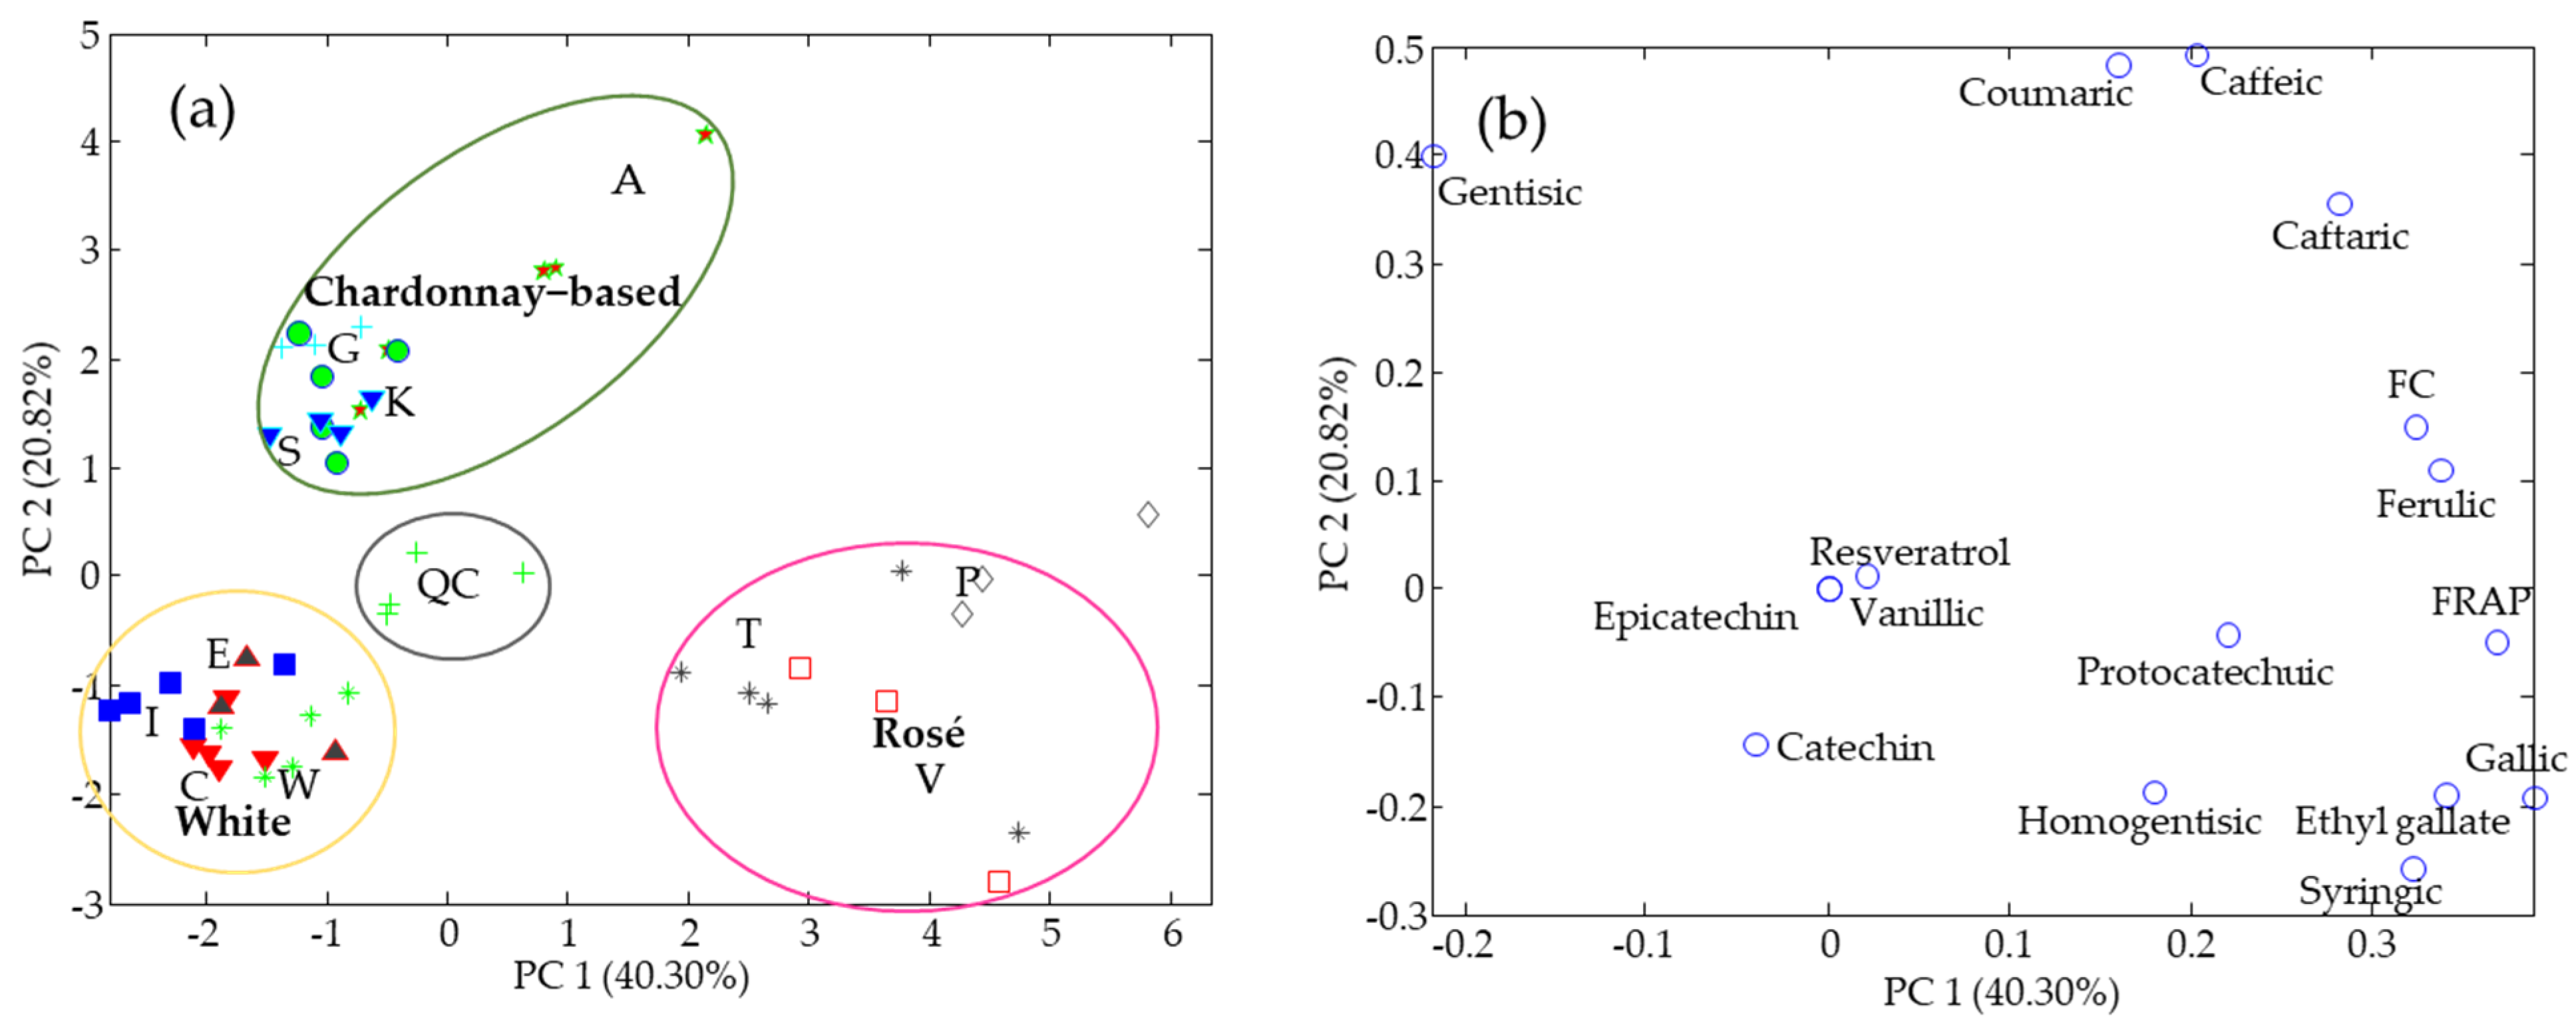
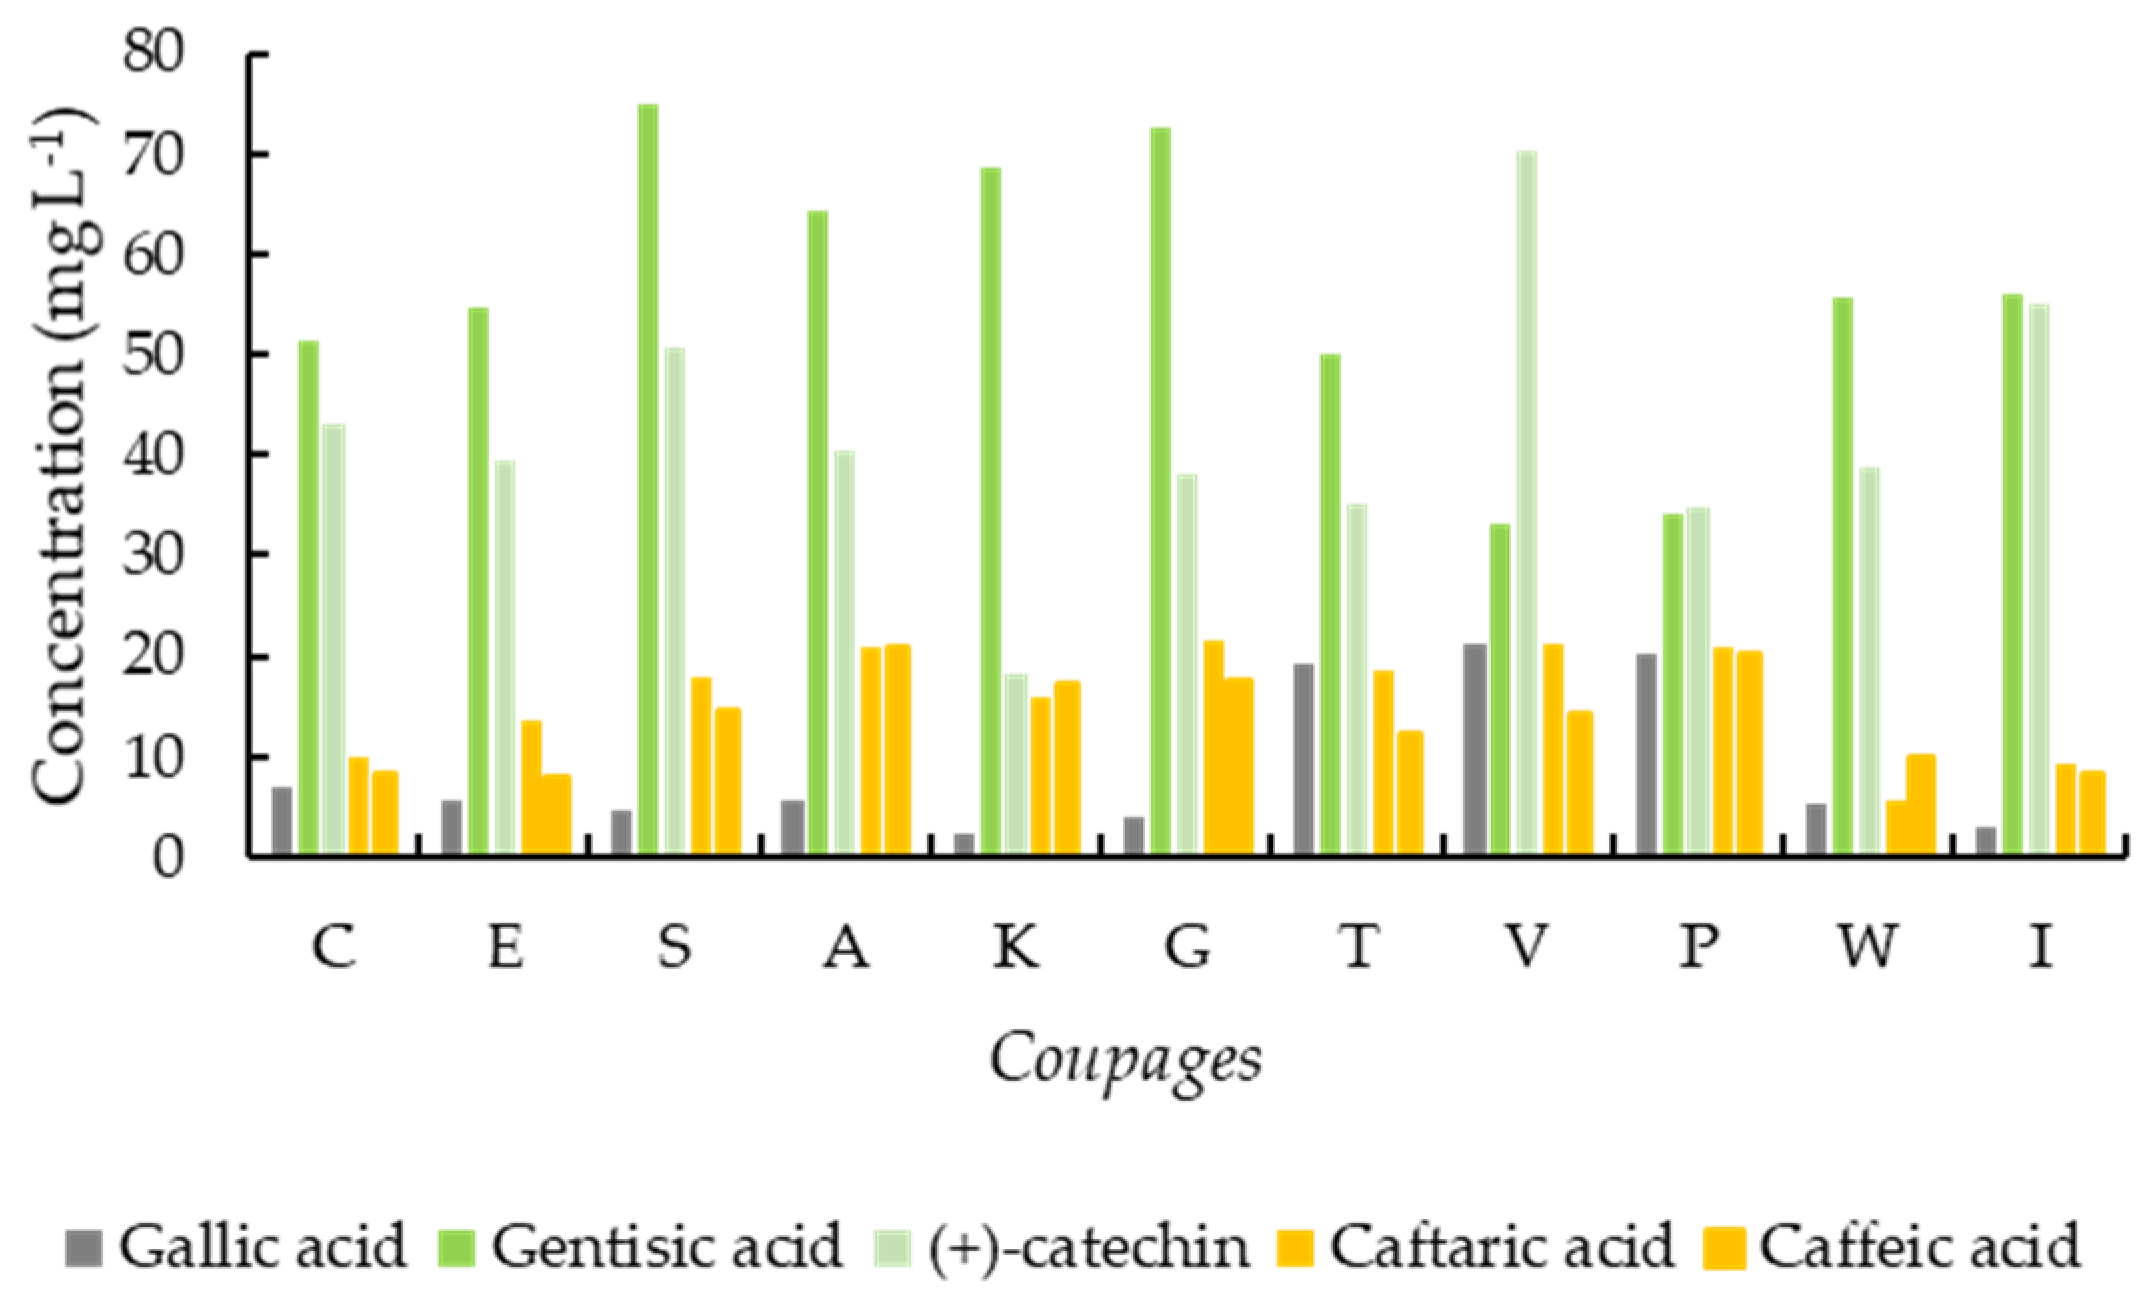
3.1. Phenolic Compounds
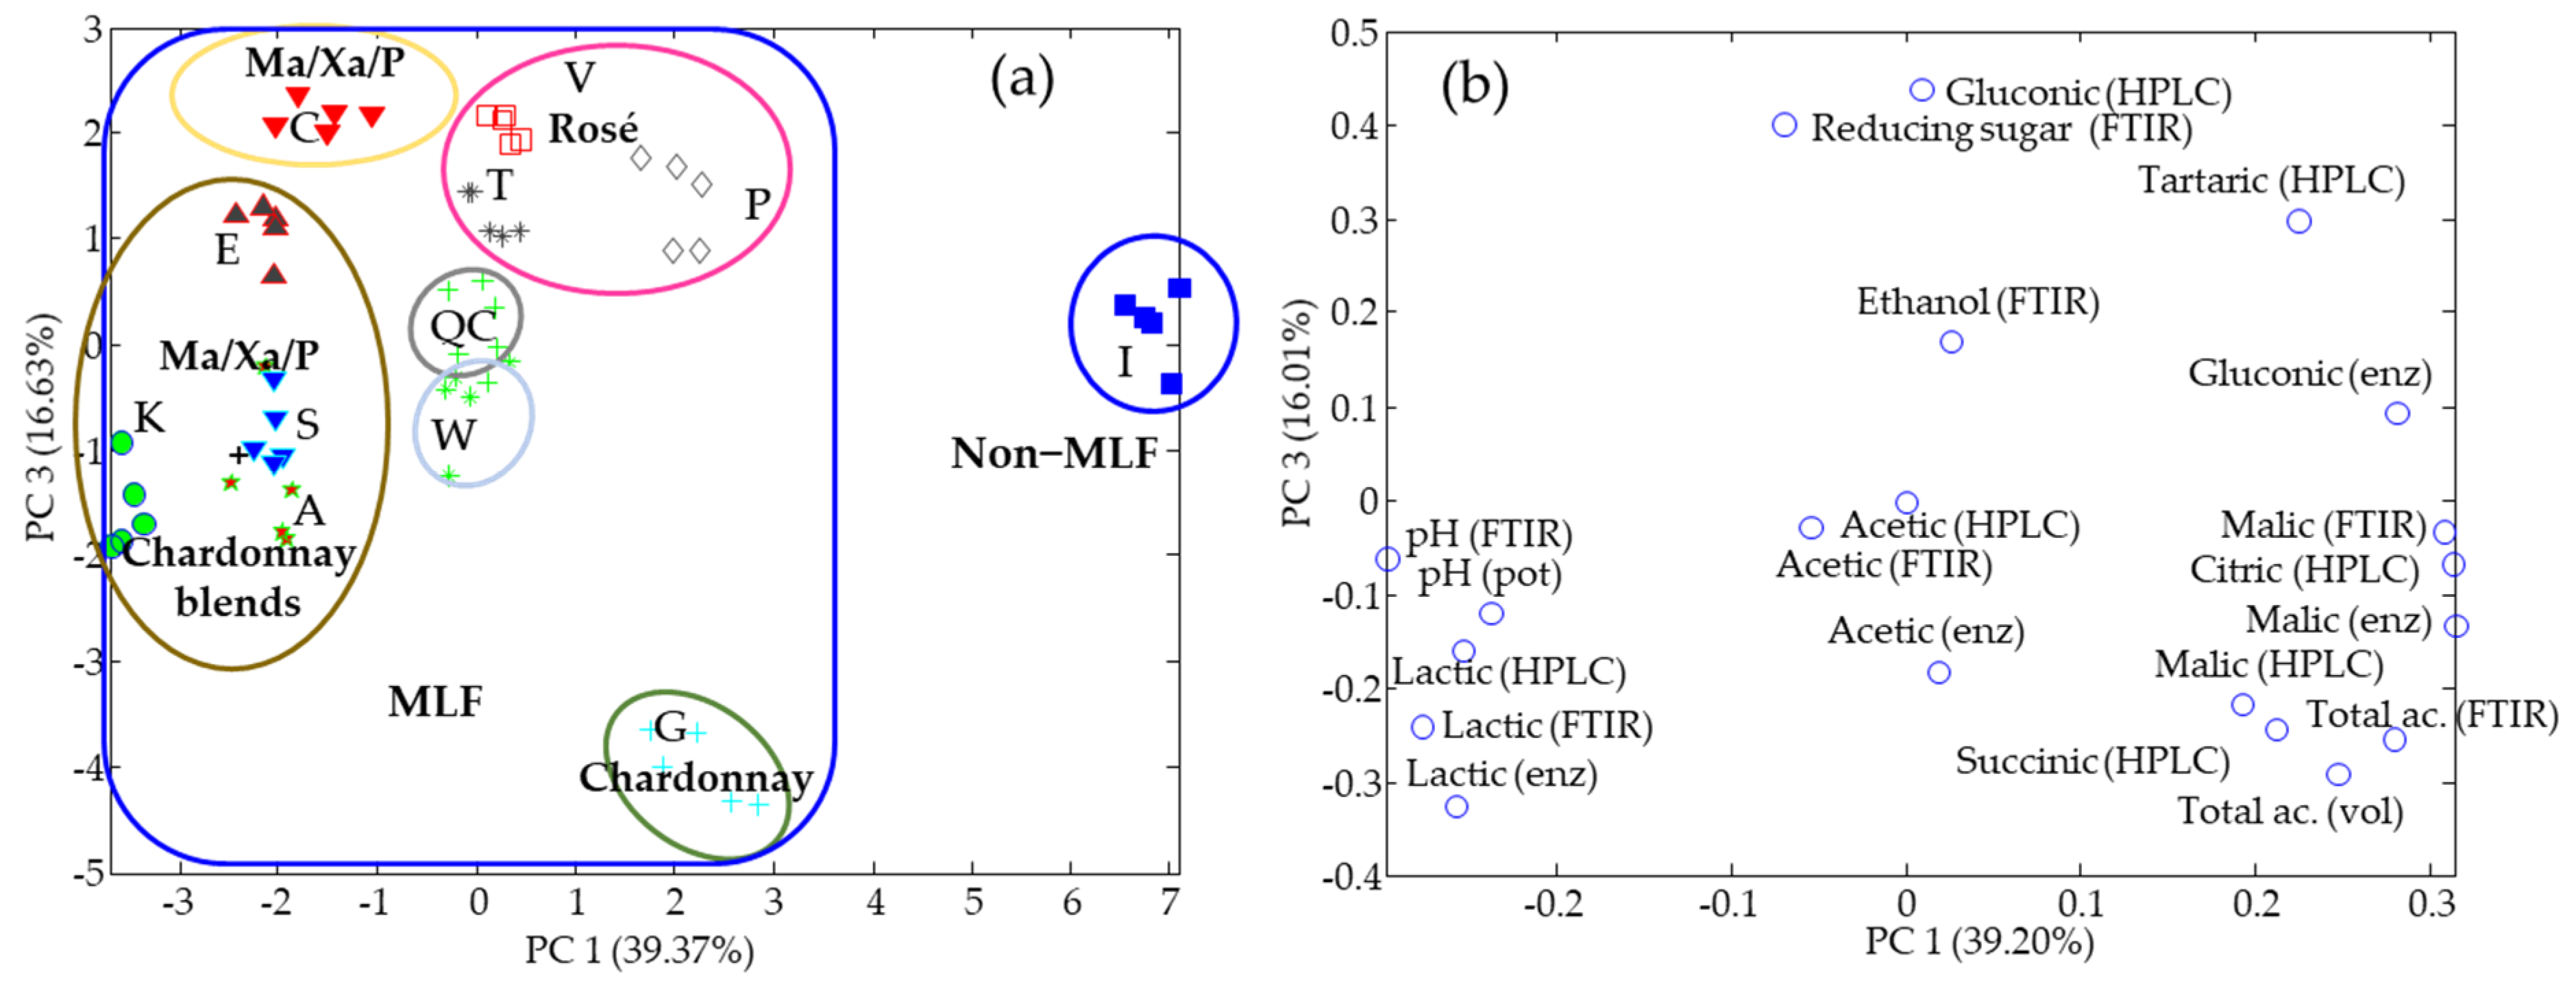
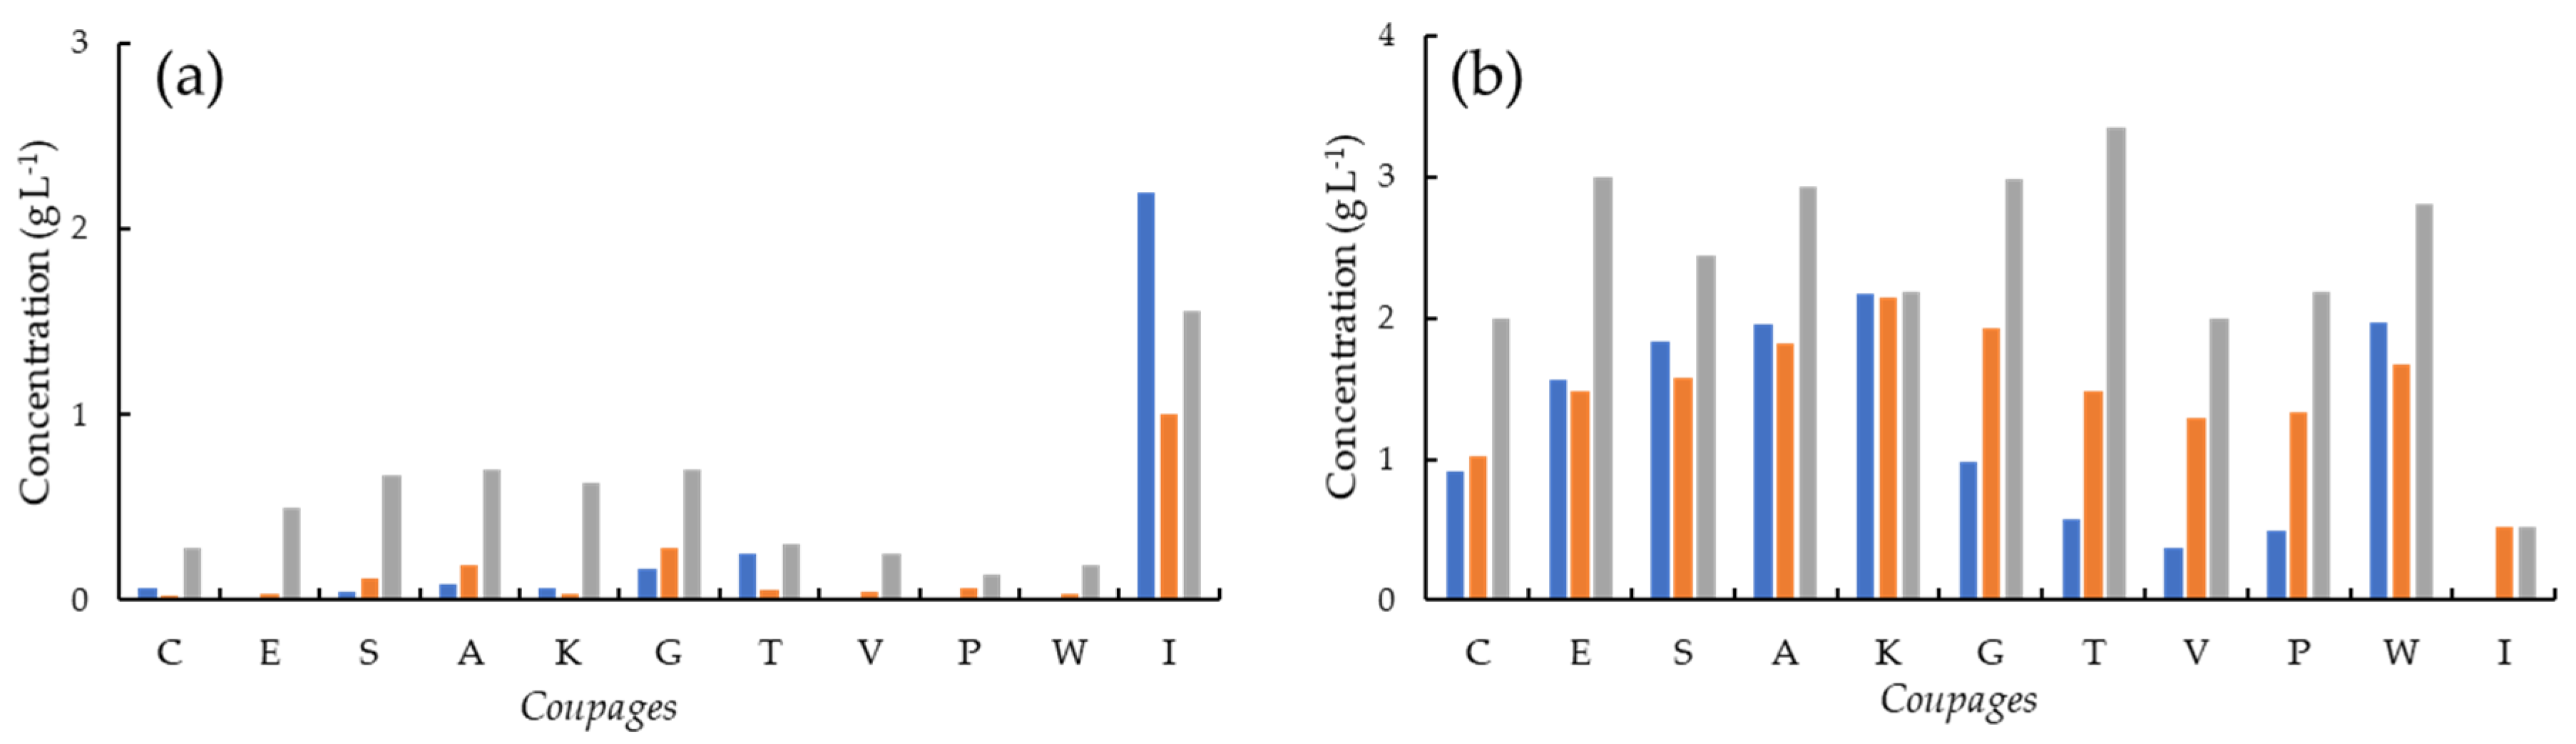
3.2. Organic Acids
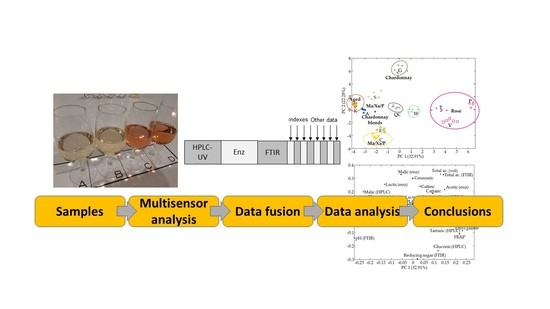
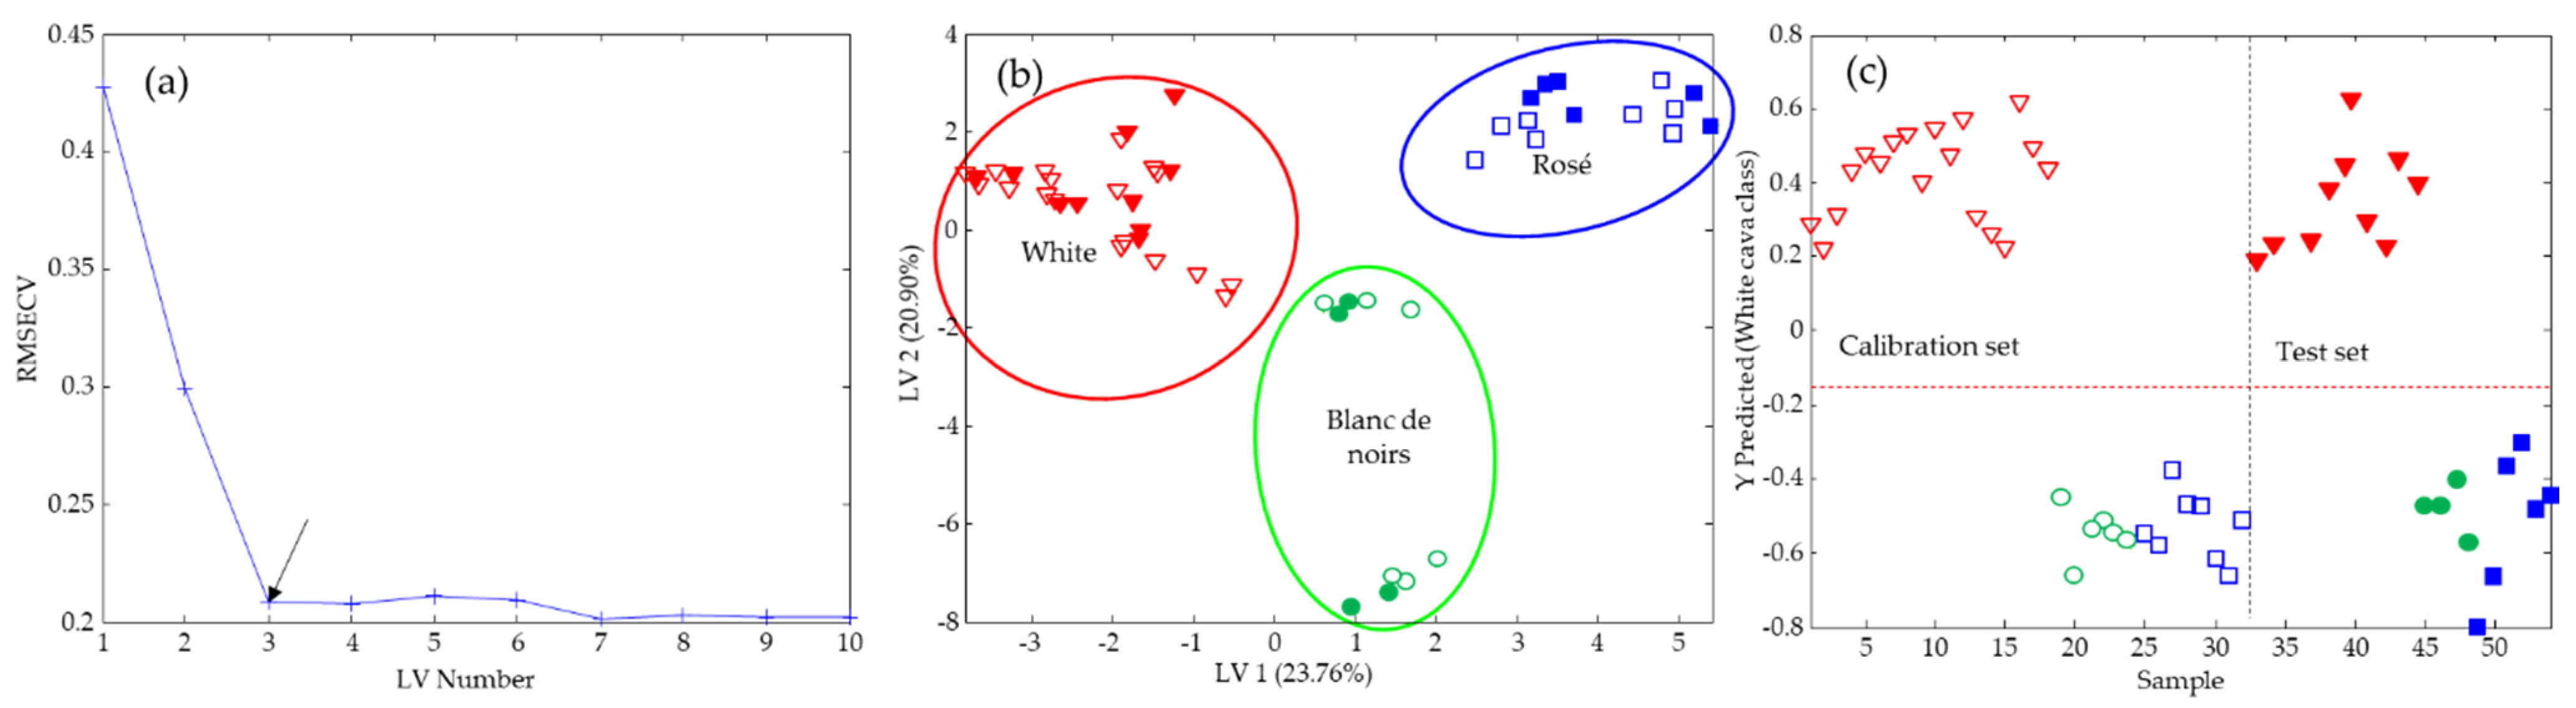
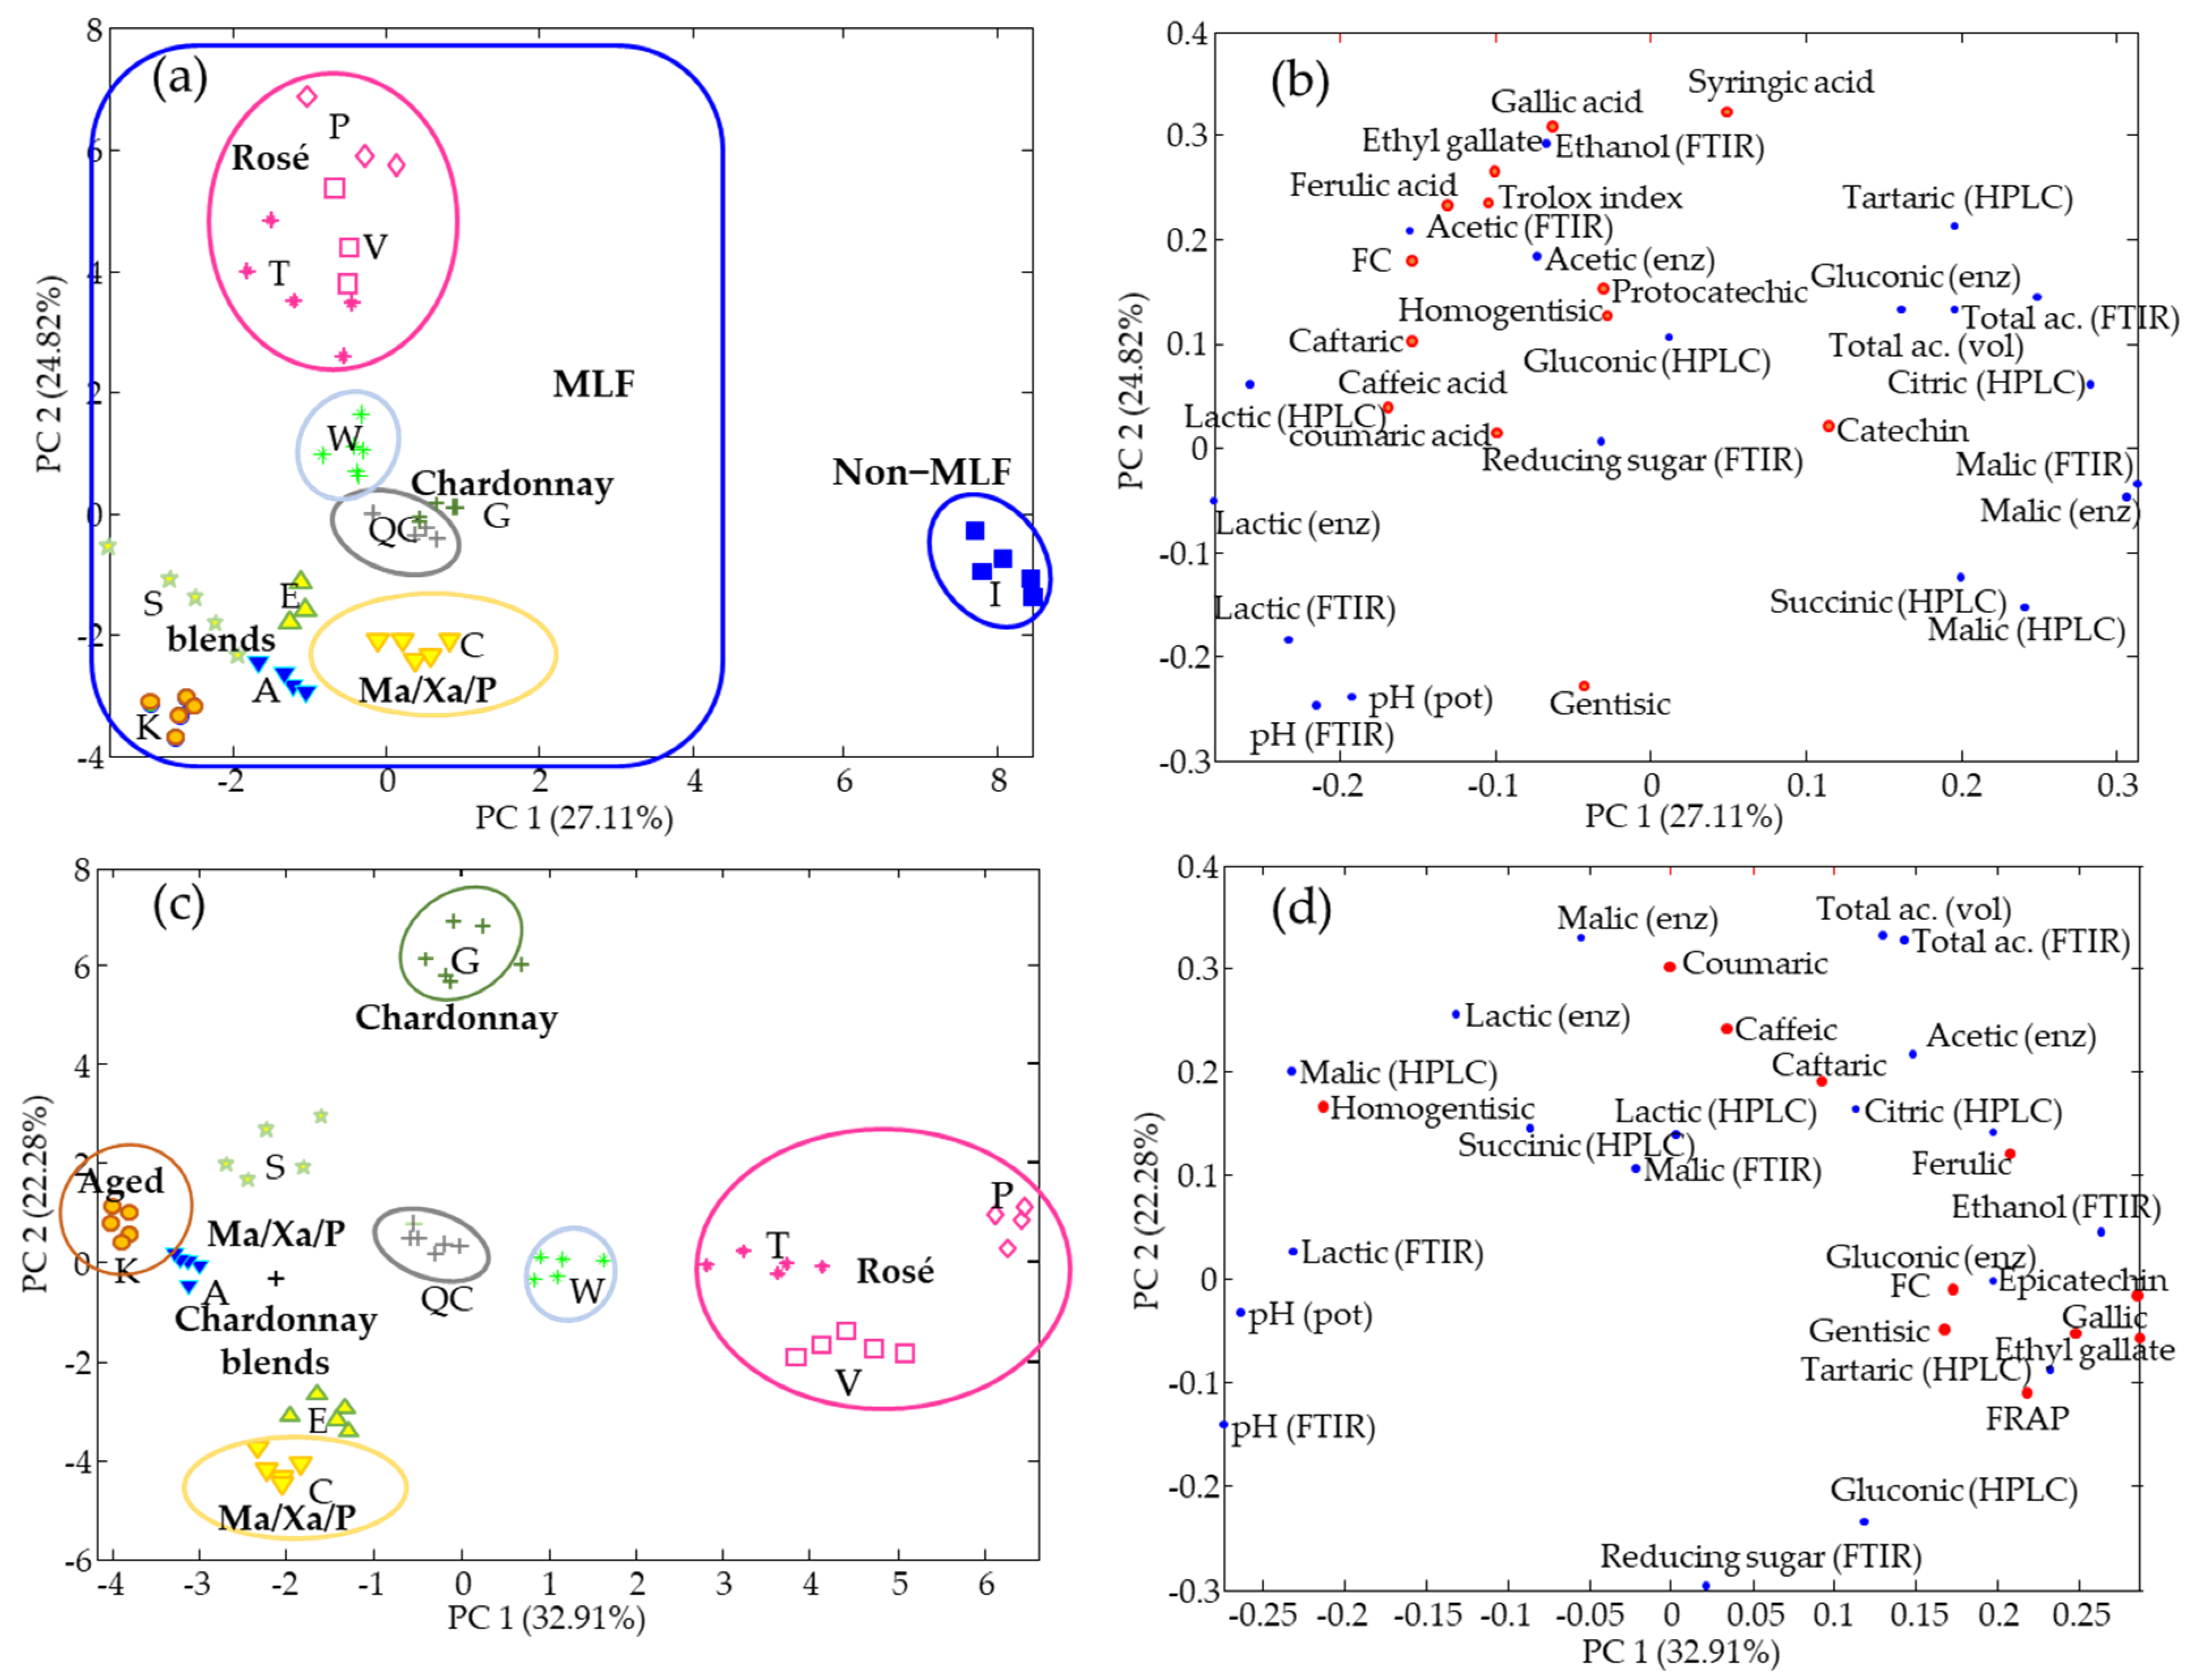
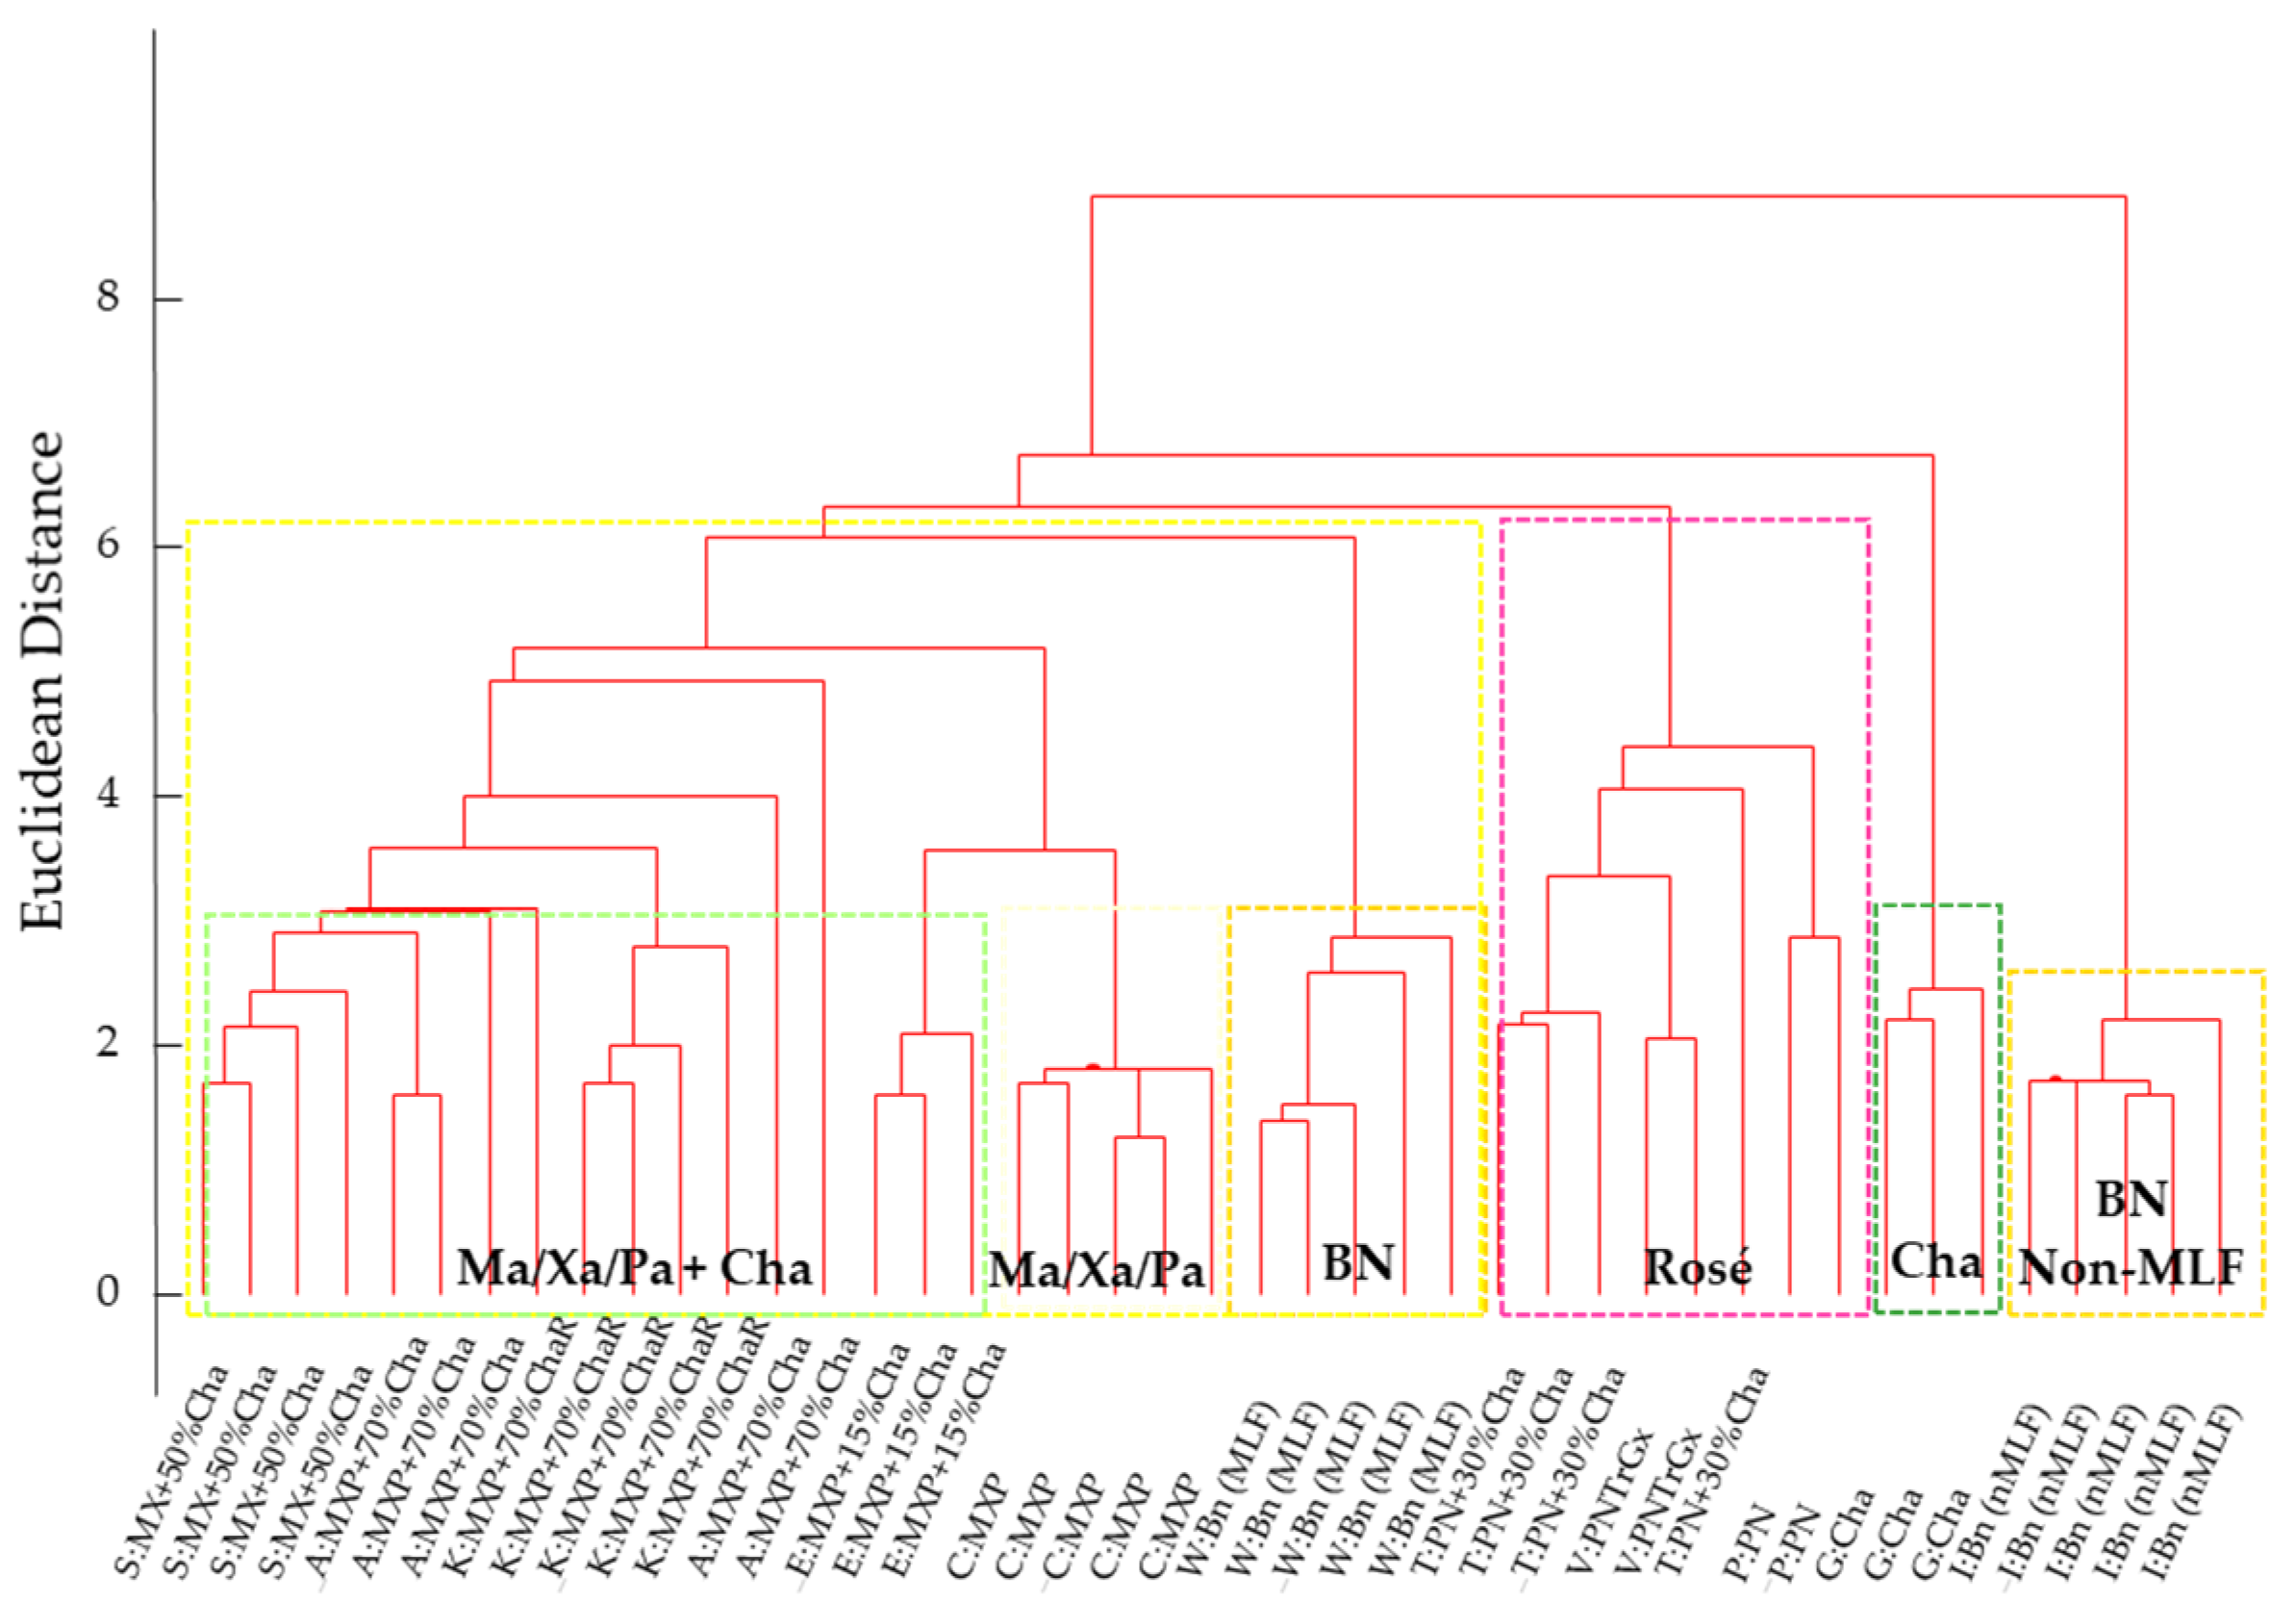
3.3. Data Fusion
3.4. Bar Charts
4. Conclusions
Supplementary Materials
Author Contributions
Funding
Institutional Review Board Statement
Informed Consent Statement
Data Availability Statement
Acknowledgments
Conflicts of Interest
References
- AECAVA. Cava Producers Association. Available online: https://aecava.com/en/cava/ (accessed on 25 May 2021).
- Ubeda, C.; Kania-Zelada, I.; del Barrio-Galan, R.; Medel-Maraboli, M.; Gil, M.; Pena-Neira, A. Study of the changes in volatile compounds, aroma and sensory attributes during the production process of sparkling wine by traditional method. Food Res. Int. 2019, 119, 554–563. [Google Scholar] [CrossRef]
- Kemp, B.; Alexandre, H.; Robillard, B.; Marchal, R. Effect of production phase on bottle-fermented sparkling wine quality. J. Agric. Food Chem. 2015, 63, 19–38. [Google Scholar] [CrossRef] [PubMed]
- Jones, J.E.; Kerslake, F.L.; Close, D.C.; Dambergs, R.G. Viticulture for Sparkling Wine Production: A Review. Am. J. Enol. Vitic. 2014, 65, 407–416. [Google Scholar] [CrossRef] [Green Version]
- Pozo-Bayon, M.A.; Martinez-Rodrigues, A.; Pueyo, E.; Moreno-Arribas, M.V. Chemical and biochemical features involved in sparkling wine production: From a traditional to an improved winemaking technology. Trends Food Sci. Tech. 2009, 20, 289–299. [Google Scholar] [CrossRef]
- Torresi, S.; Frangipane, M.T.; Anelli, G. Biotechnologies in sparkling wine production. Interesting approaches for quality improvement: A review. Food Chem. 2011, 129, 1232–1241. [Google Scholar] [CrossRef] [PubMed]
- Saurina, J. Characterization of wines using compositional profiles and chemometrics. Trends Anal. Chem. 2010, 29, 234–245. [Google Scholar] [CrossRef]
- Merkyte, V.; Longo, E.; Windisch, G.; Boselli, E. Phenolic Compounds as Markers of Wine Quality and Authenticity. Foods 2020, 9, 1785. [Google Scholar] [CrossRef] [PubMed]
- Villano, C.; Lisanti, M.T.; Gambuti, A.; Vecchio, R.; Moio, L.; Frusciante, L.; Aversano, R.; Carputo, D. Wine varietal authentication based on phenolics, volatiles and DNA markers: State of the art, perspectives and drawbacks. Food Control 2017, 80, 1–10. [Google Scholar] [CrossRef]
- Ceto, X.; Gonzalez-Calabuig, A.; Crespo, N.; Perez, S.; Capdevila, J.; Puig-Pujol, A.; del Valle, M. Electronic tongues to assess wine sensory descriptors. Talanta 2017, 162, 218–224. [Google Scholar] [CrossRef] [PubMed]
- Popirda, A.; Luchian, C.E.; Cotea, V.V.; Colibaba, L.C.; Scutarasu, E.C.; Toader, A.M. A Review of Representative Methods Used in Wine Authentication. Agriculture 2021, 11, 225. [Google Scholar] [CrossRef]
- Serrano-Lourido, D.; Saurina, J.; Hernandez-Cassou, S.; Checa, A. Classification and characterisation of Spanish red wines according to their appellation of origin based on chromatographic profiles and chemometric data analysis. Food Chem. 2012, 135, 1425–1431. [Google Scholar] [CrossRef] [PubMed]
- Izquierdo-Llopart, A.; Saurina, J. Characterization of Sparkling Wines According to Polyphenolic Profiles Obtained by HPLC-UV/Vis and Principal Component Analysis. Foods 2019, 8, 22. [Google Scholar] [CrossRef] [PubMed] [Green Version]
- Izquierdo-Llopart, A.; Saurina, J. Liquid Chromatographic Approach for the Discrimination and Classification of Cava Samples Based on the Phenolic Composition Using Chemometric Methods. Beverages 2020, 6, 54. [Google Scholar] [CrossRef]
- Gonzalez-Lazaro, M.; Martinez-Lapuente, L.; Palacios, A.; Guadalupe, Z.; Ayestaran, B.; Bueno-Herrera, M.; de la Cuesta, P.L.; Perez-Magarino, S. Effects of different oenological techniques on the elaboration of adequate base wines for red sparkling wine production: Phenolic composition, sensory properties and foam parameters. J. Food Sci. Food Agric. 2019, 99, 4580–4592. [Google Scholar] [CrossRef] [PubMed]
- Sartor, S.; Burin, V.M.; Panceri, C.P.; dos Passos, R.R.; Caliari, V.; Bordignon-Luiz, M.T. Rose Sparkling Wines: Influence of Winemaking Practices on the Phytochemical Polyphenol During Aging on Lees and Commercial Storage. J. Food Sci. 2018, 83, 2790–2801. [Google Scholar] [CrossRef] [PubMed]
- Stefenon, C.A.; Bonesi, C.D.; Marzarotto, V.; Barnabe, D.; Spinelli, F.R.; Webber, V.; Vanderlinde, R. Phenolic composition and antioxidant activity in sparkling wines: Modulation by the ageing on lees. Food Chem. 2014, 145, 292–299. [Google Scholar] [CrossRef] [PubMed] [Green Version]
- de Souza, J.F.; Nascimento, A.M.D.; Linhares, M.D.S.; Dutra, M.D.P.; Lima, M.D.; Pereira, G.E. Evolution of Phenolic Compound Profiles and Antioxidant Activity of Syrah Red and Sparkling Moscatel Wines Stored in Bottles of Different Colors. Beverages 2018, 4, 89. [Google Scholar] [CrossRef] [Green Version]
- Cho, J.H.; Cho, M.G.; Dhungana, S.K.; Kim, H.R.; Kim, D.J.; Kim, I.D. Influence of Ripe Persimmon on Quality Characteristics and Antioxidant Potential of Sparkling Wine. J. Pure Appl. Microbiol. 2017, 11, 1647–1653. [Google Scholar] [CrossRef]
- Izquierdo-Llopart, A.; Carretero, A.; Saurina, J. Organic Acid Profiling by Liquid Chromatography for the Characterization of Base Vines and Sparkling Wines. Food Anal. Methods 2020, 13, 1852–1866. [Google Scholar] [CrossRef]
- Huang, X.Y.; Jiang, Z.T.; Tan, J.; Li, R. Geographical Origin Traceability of Red Wines Based on Chemometric Classification via Organic Acid Profiles. J. Food Qual. 2017, 2038073. [Google Scholar] [CrossRef]
- Sartor, S.; Toaldo, I.M.; Panceri, C.P.; Caliari, V.; Luna, A.S.; de Gois, J.S.; Bordignon-Luiz, M.T. Changes in organic acids, polyphenolic and elemental composition of rose sparkling wines treated with mannoproteins during over-lees aging. Food Res. Int. 2019, 124, 34–42. [Google Scholar] [CrossRef] [PubMed]
- Borras, E.; Ferre, J.; Boque, R.; Mestres, M.; Acena, L.; Busto, O. Data fusion methodologies for food and beverage authentication and quality assessment—A review. Anal. Chim. Acta 2015, 891, 1–14. [Google Scholar] [CrossRef] [PubMed]
- Callao, M.P.; Ruisanchez, I. An overview of multivariate qualitative methods for food fraud detection. Food Control 2018, 86, 283–293. [Google Scholar] [CrossRef]
- Biancolillo, A.; Marini, F.; Ruckebusch, C.; Vitale, R. Chemometric Strategies for Spectroscopy-Based Food Authentication. Appl. Sci. 2020, 10, 6544. [Google Scholar] [CrossRef]
- Di Rosa, A.R.; Leone, F.; Cheli, F.; Chiofalo, V. Fusion of electronic nose, electronic tongue and computer vision for animal source food authentication and quality assessment—A review. J. Food Eng. 2017, 210, 62–75. [Google Scholar] [CrossRef]
- Peris, M.; Escuder-Gilabert, L. Electronic noses and tongues to assess food authenticity and adulteration. Trend Food Sci. Technol. 2016, 58, 40–54. [Google Scholar] [CrossRef] [Green Version]
- Ceto, X.; Capdevila, J.; Puig-Pujol, A.; del Valle, M. Cava Wine Authentication Employing a Voltammetric Electronic Tongue. Electroanalysis 2014, 26, 1504–1512. [Google Scholar] [CrossRef] [Green Version]
- Ceto, X.; Capdevila, J.; Minguez, S.; del Valle, M. Voltammetric BioElectronic Tongue for the analysis of phenolic compounds in rose cava wines. Food Res. Int. 2014, 55, 455–461. [Google Scholar] [CrossRef]
- Men, H.; Shi, Y.; Fu, S.; Jiao, Y.; Qiao, Y.; Liu, J. Mining Feature of Data Fusion in the Classification of Beer Flavor Information Using E-Tongue and E-Nose. Sensors 2019, 17, 1656. [Google Scholar] [CrossRef] [Green Version]
- Arslan, M.; Tahir, H.E.; Zareed, M.; Shi, J.Y.; Rakha, A.; Bilal, M.; Huang, X.W.; Li, Z.H.; Zou, X.B. Recent trends in quality control, discrimination and authentication of alcoholic beverages using nondestructive instrumental techniques—A review. Trends Food Sci. Technol. 2021, 107, 80–113. [Google Scholar] [CrossRef]
- Geana, E.I.; Marinescu, A.; Iordache, A.M.; Sandru, C.; Ionete, R.E.; Bala, C. Differentiation of Romanian Wines on Geographical Origin and Wine Variety by Elemental Composition and Phenolic Components. Food Anal. Methods 2014, 7, 2064–2074. [Google Scholar] [CrossRef]
- Di Egidio, V.; Sinelli, N.; Giovanelli, G.; Moles, A.; Casiraghi, E. NIR and MIR spectroscopy as rapid methods to monitor red wine fermentation. Eur. Food Res. Technol. 2010, 230, 947–955. [Google Scholar] [CrossRef]
- Garcia-Hernandez, C.; Salvo-Comino, C.; Martin-Pedrosa, F.; Garcia-Cabezon, C.; Rodriguez-Mendez, M.L. Analysis of red wines using an electronic tongue and infrared spectroscopy, Correlations with phenolic content and color parameters. LWT Food Sci. Technol. 2020, 118, 108785. [Google Scholar] [CrossRef]
- Schiavone, S.; Marchionni, B.; Bucci, R.; Marini, F.; Biancolillo, A. Authentication of Grappa (Italian grape marc spirit) by Mid and Near Infrared spectroscopies coupled with chemometrics. Vib. Spectrosc. 2020, 107, 103040. [Google Scholar] [CrossRef]
- Rios-Reina, R.; Callejon, R.M.; Savorani, F.; Amigo, J.M.; Cocchi, M. Data fusion approaches in spectroscopic characterization and classification of PDO wine vinegars. Talanta 2019, 98, 560–572. [Google Scholar] [CrossRef] [Green Version]
- Silvestri, M.; Elia, A.; Bertelli, D.; Salvatore, E.; Durante, C.; Vigni, M.L.; Marchetti, A.; Cocchi, M. A mid level data fusion strategy for the Varietal Classification of Lambrusco PDO wines. Chemom. Intell. Lab. Syst. 2014, 137, 181–189. [Google Scholar] [CrossRef] [Green Version]
- Biancolillo, A.; Bucci, R.; Magri, A.L.; Magri, A.D.; Marini, F. Data-fusion for multiplatform characterization of an italian craft beer aimed at its authentication. Anal. Chim. Acta 2014, 820, 23–31. [Google Scholar] [CrossRef] [PubMed]
- Perez-Beltran, C.H.; Zuniga-Arroyo, V.M.; Andrade, J.M.; Cuadros-Rodriguez, L.; Perez-Caballero, G.; Jimenez-Carvelo, A.M. A Sensor-Based Methodology to Differentiate Pure and Mixed White Tequilas Based on Fused Infrared Spectra and Multivariate Data Treatment. Chemosensors 2021, 9, 47. [Google Scholar] [CrossRef]
- Giannetti, V.; Mariani, M.B.; Marini, F.; Torrelli, P.; Biancolillo, A. Grappa and Italian spirits: Multi-platform investigation based on GC-MS, MIR and NIR spectroscopies for the authentication of the Geographical Indication. Microchem. J. 2020, 157, 104896. [Google Scholar] [CrossRef]
- Rios-Reina, R.; Azcarate, S.M.; Camina, J.M.; Goicoechea, H.C. Multi-level data fusion strategies for modeling three-way electrophoresis capillary and fluorescence arrays enhancing geographical and grape variety classification of wines. Anal. Chim. Acta 2020, 1126, 52–62. [Google Scholar] [CrossRef] [PubMed]
- Belmonte-Sanchez, J.R.; Romero-Gonzalez, R.; Vidal, J.L.M.; Arrebola, F.J.; Garrido Frenich, A. H-1 NMR and multi-technique data fusion as metabolomic tool for the classification of golden rums by multivariate statistical analysis. Food Chem. 2020, 317, 126363. [Google Scholar] [CrossRef] [PubMed]
- Zhang, H.H.; Shao, W.Q.; Qiu, S.S.; Wang, J.; Wei, Z.B. Collaborative Analysis on the Marked Ages of Rice Wines by Electronic Tongue and Nose based on Different Feature Data Sets. Sensors 2020, 20, 1065. [Google Scholar] [CrossRef] [PubMed] [Green Version]
- Cavallini, N.; Savorani, F.; Bro, R.; Cocchi, M. Fused adjacency matrices to enhance information extraction: The beer benchmark. Anal. Chim. Acta 2019, 1061, 70–83. [Google Scholar] [CrossRef] [Green Version]
- Larrauri, A.; Nunez, O.; Hernandez-Cassou, S.; Saurina, J. Determination of Polyphenols in White Wines by Liquid Chromatography: Application to the Characterization of Alella (Catalonia, Spain) Wines Using Chemometric Methods. J. AOAC Int. 2017, 100, 323–329. [Google Scholar] [CrossRef] [Green Version]
- Alcalde, B.; Granados, M.; Saurina, J. Exploring the Antioxidant Features of Polyphenols by Spectroscopic and Electrochemical Methods. Antioxidants 2019, 8, 523. [Google Scholar] [CrossRef] [PubMed] [Green Version]


| Sample | Instrumental Techniques | Fusion Level | Chemometric Methods | Comments | Ref. |
|---|---|---|---|---|---|
| Beer | e-nose | Low | GA, SVM | Classification rate > 80% | [30] |
| Spanish red wines | e-nose, MIR, UV/Vis (TPI, Folin-Ciocalteu) | Low | PCA, PLS | Phenolic content estimations | [34] |
| Grappa (Italian grape marc spirit) | NIR, MIR | Low | PLS-DA with multi-block strategies | Authentication, 100% classification rate | [35] |
| Wine vinegars | NIR, MIR, EEM, NMR | Low, mid | PCA, PARAFAC, MCR, PLS-DA | Classification of Jerez, Huelva and Montilla-Moriles PDOs | [36] |
| Lambrusco wines | HPLC, EEM, NMR | Mid | PCA, PARAFAC, MCR | PDO varietal classification of Salamino di Santa Croce, Grasparossa di Castelvetro, Sorbara | [37] |
| Italian craft beer | thermogravimetry, MID, NIR, UV, Vis | Low, mid | SIMCA, PLS-DA | Authentication of high quality ‘Reale’ beer. Classification rate > 75% | [38] |
| Mexican Tequila | MID | Low | PCA, SIMCA, PLS-DA | Discrimination among ‘agave’ and mixed Tequila | [39] |
| Grappa (Italian grape marc spirit) | GC-MS, NIR, MIR | Low | PLS-DA | Discrimination among grappa GI and other spirits | [40] |
| Wines | CE-DAD, EEM | Multi-level | PLS-DA, NPLS-DA | Geographical and grape variety classification. high-level strategy provides the best classification results | [41] |
| Golden rum | NMR, HPLC-MS, GC-MS | Low, mid | PCA, PLS-DA | classification based on fermentation barrel, raw material, distillation method and aging. Classification rate > 100% | [42] |
| Rice Wines | e-tongue, e-nose | Low, mid | PCA, LPP, SVM | Age evaluation | [43] |
| Beer | Vis, NIR, NMR | Mid | MCR | Clustering based on beer style | [44] |
| Class/Blend | Composition | Number of Samples |
|---|---|---|
| C 1 | 100% Macabeu, Xarel·lo, Parellada | 5 |
| G 2 | 100% Chardonnay | 5 |
| I 3 | 100% Blanc de Noirs | 5 |
| P | 100% Pinot Noir | 5 |
| W | 100% Blanc de Noirs | 5 |
| A | 70% Chardonnay/30% Macabeu, Xarel·lo, Parellada | 5 |
| K 2 | 70% Chardonnay/30% Macabeu, Xarel·lo, Parellada | 5 |
| E | 85% Macabeu, Xarel·lo, Parellada/15% Chardonnay | 5 |
| S | 50% Macabeu, Xarel·lo/50% Chardonnay | 5 |
| T | 70% Pinot Noir/30% Chardonnay | 5 |
| V | 25% Pinot noir/50% Garnatxa negra/25% Trepat | 5 |
Publisher’s Note: MDPI stays neutral with regard to jurisdictional claims in published maps and institutional affiliations. |
© 2021 by the authors. Licensee MDPI, Basel, Switzerland. This article is an open access article distributed under the terms and conditions of the Creative Commons Attribution (CC BY) license (https://creativecommons.org/licenses/by/4.0/).
Share and Cite
Izquierdo-Llopart, A.; Saurina, J. Multi-Sensor Characterization of Sparkling Wines Based on Data Fusion. Chemosensors 2021, 9, 200. https://doi.org/10.3390/chemosensors9080200
Izquierdo-Llopart A, Saurina J. Multi-Sensor Characterization of Sparkling Wines Based on Data Fusion. Chemosensors. 2021; 9(8):200. https://doi.org/10.3390/chemosensors9080200
Chicago/Turabian StyleIzquierdo-Llopart, Anais, and Javier Saurina. 2021. "Multi-Sensor Characterization of Sparkling Wines Based on Data Fusion" Chemosensors 9, no. 8: 200. https://doi.org/10.3390/chemosensors9080200
APA StyleIzquierdo-Llopart, A., & Saurina, J. (2021). Multi-Sensor Characterization of Sparkling Wines Based on Data Fusion. Chemosensors, 9(8), 200. https://doi.org/10.3390/chemosensors9080200