
Sniff Species: SURMOF-Based Sensor Array Discriminates Aromatic Plants beyond the Genus Level

 , , ,
, , ,
Abstract
:
1. Introduction
2. Materials and Methods
2.1. Plant Material
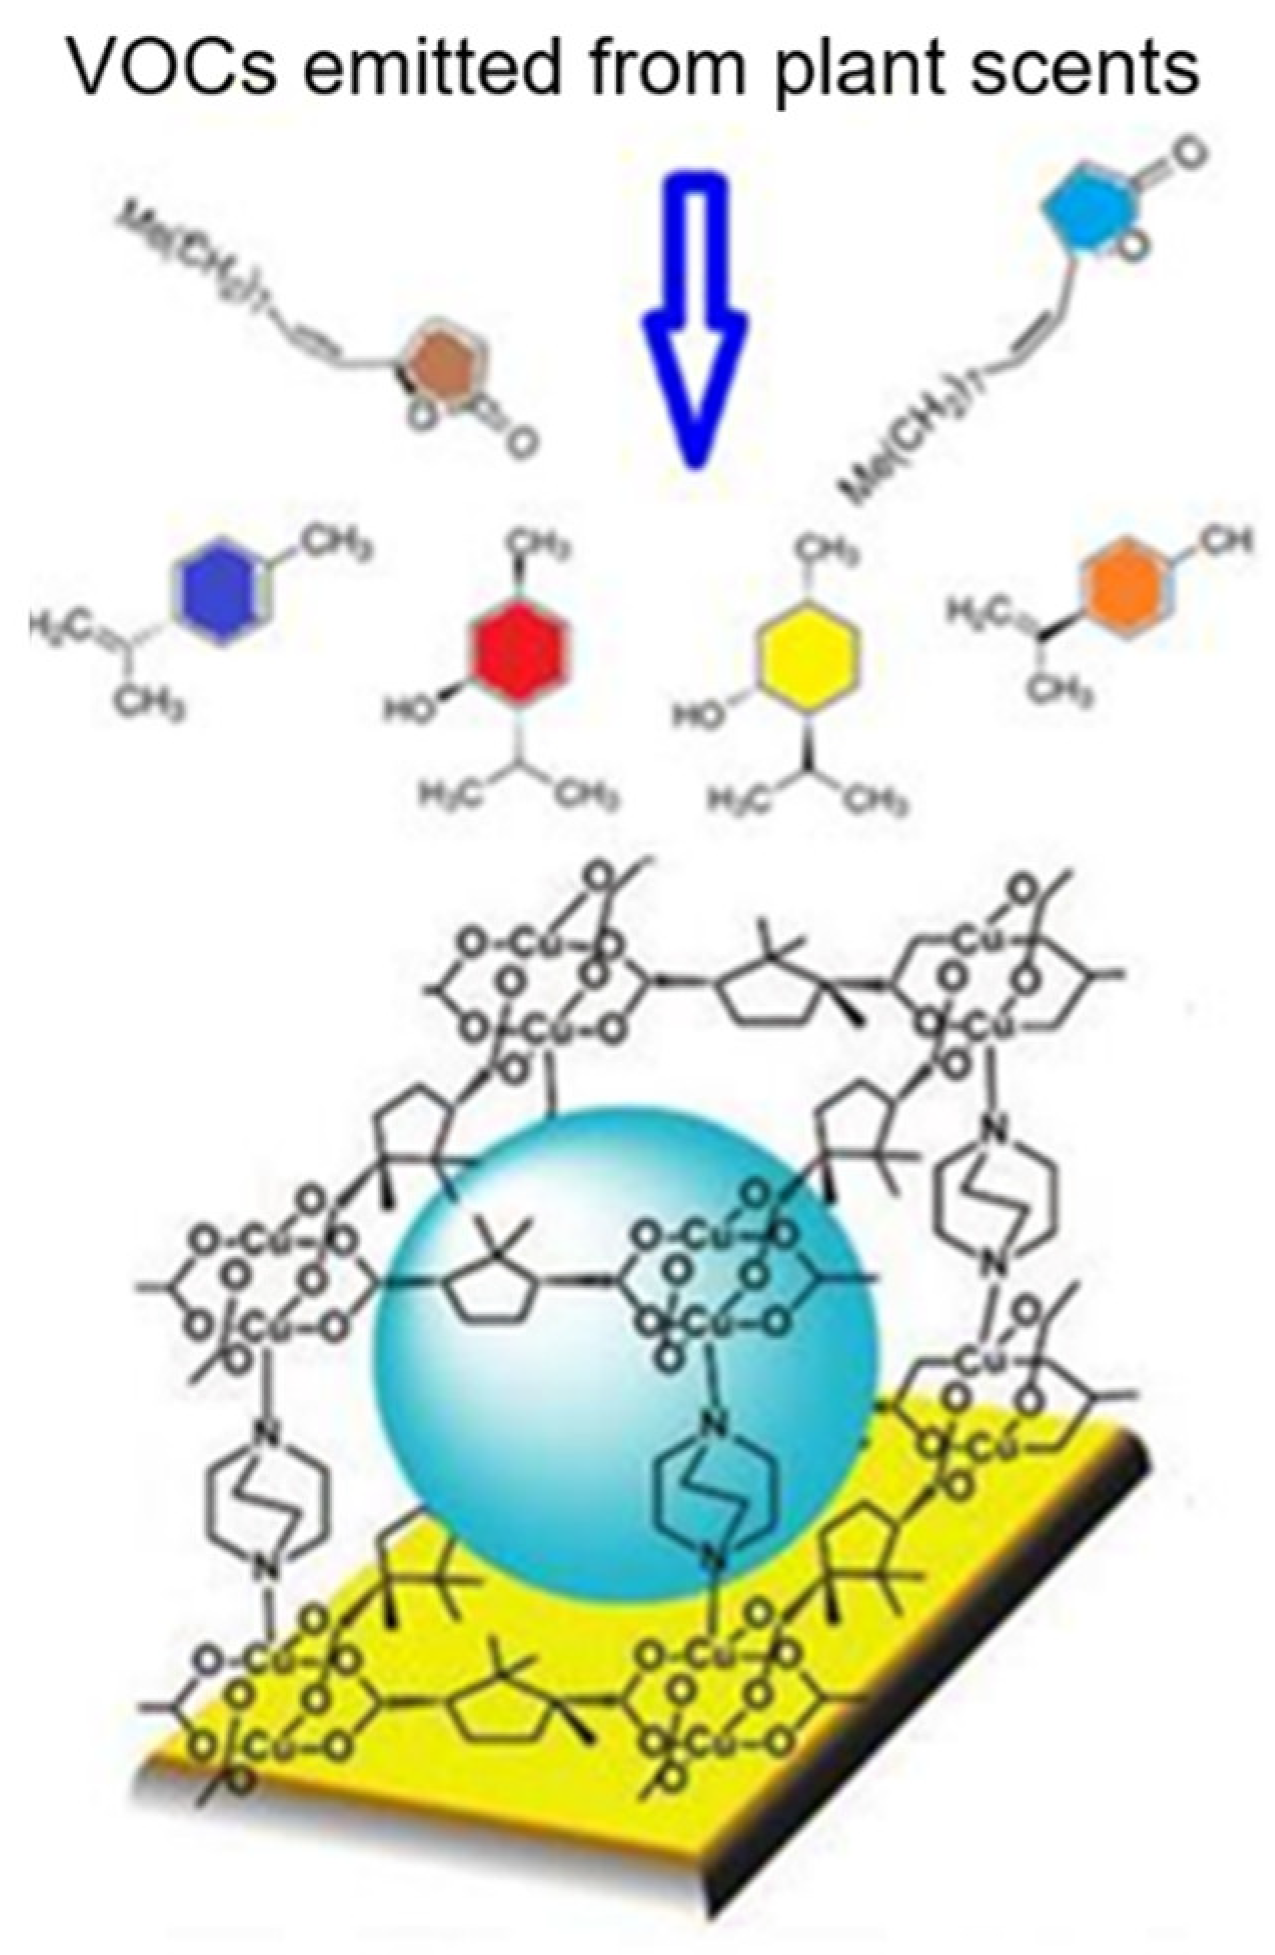
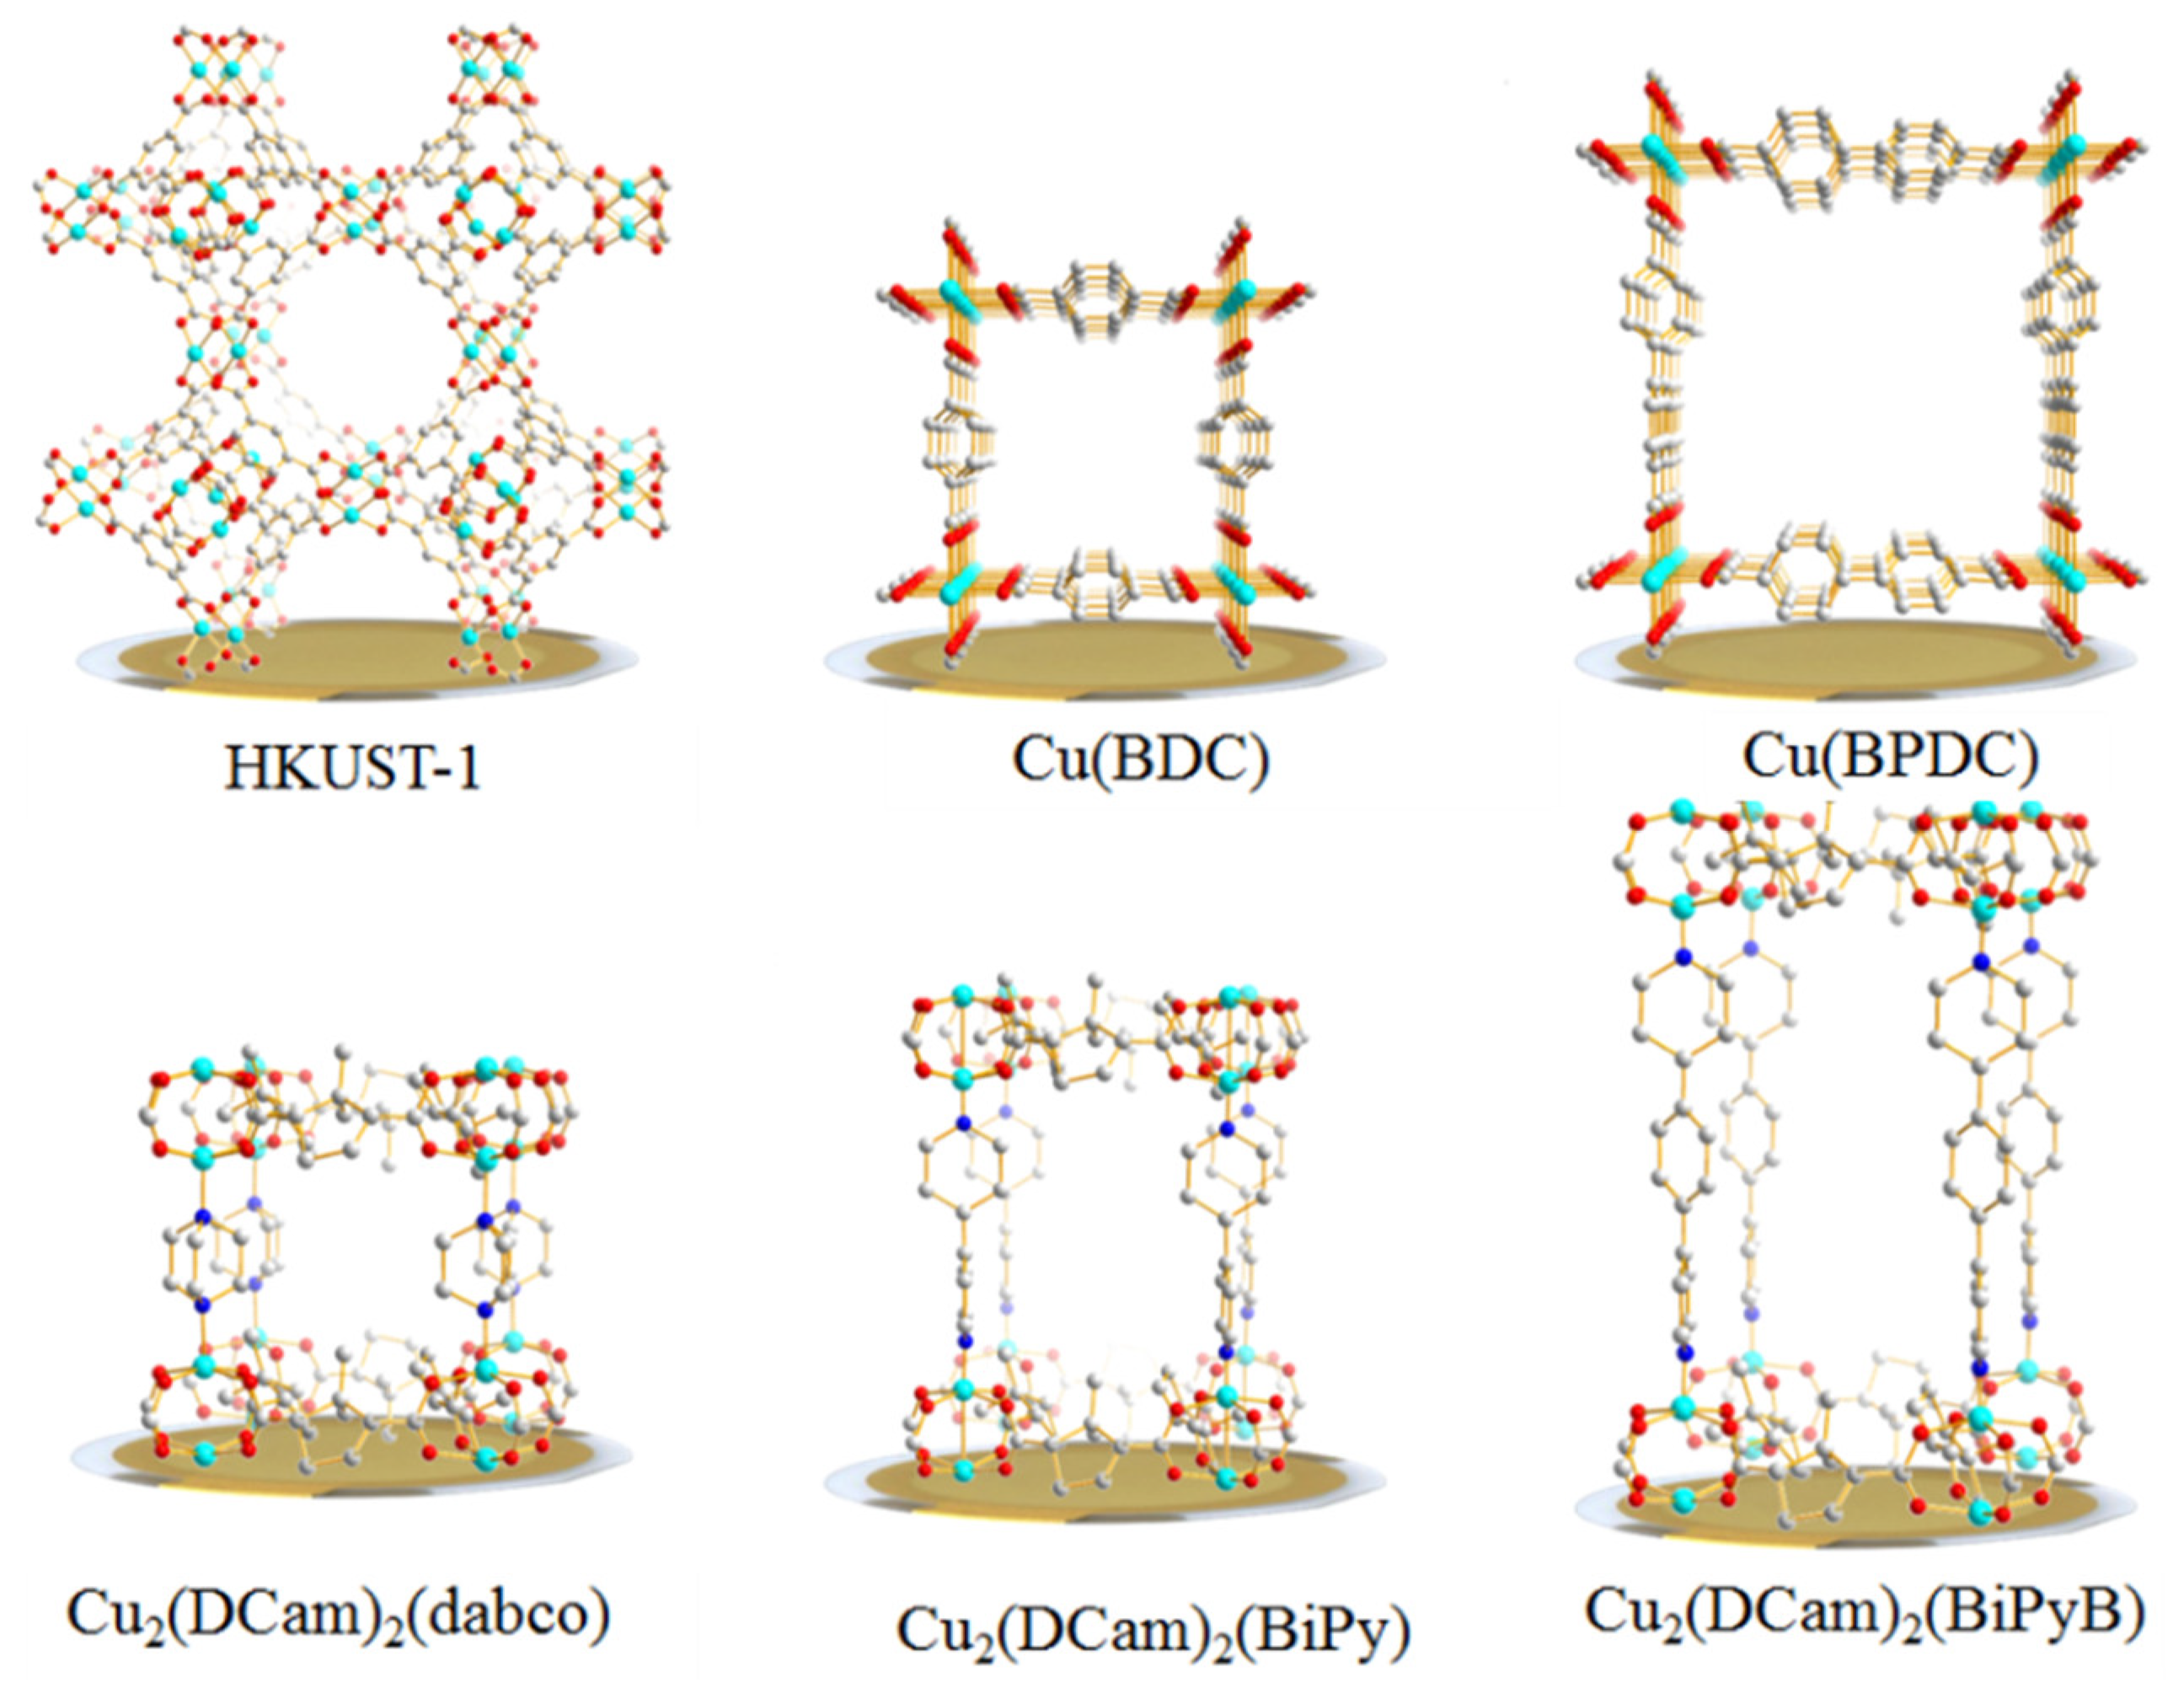
2.2. Chemicals and Fabrication of QCM Sensors
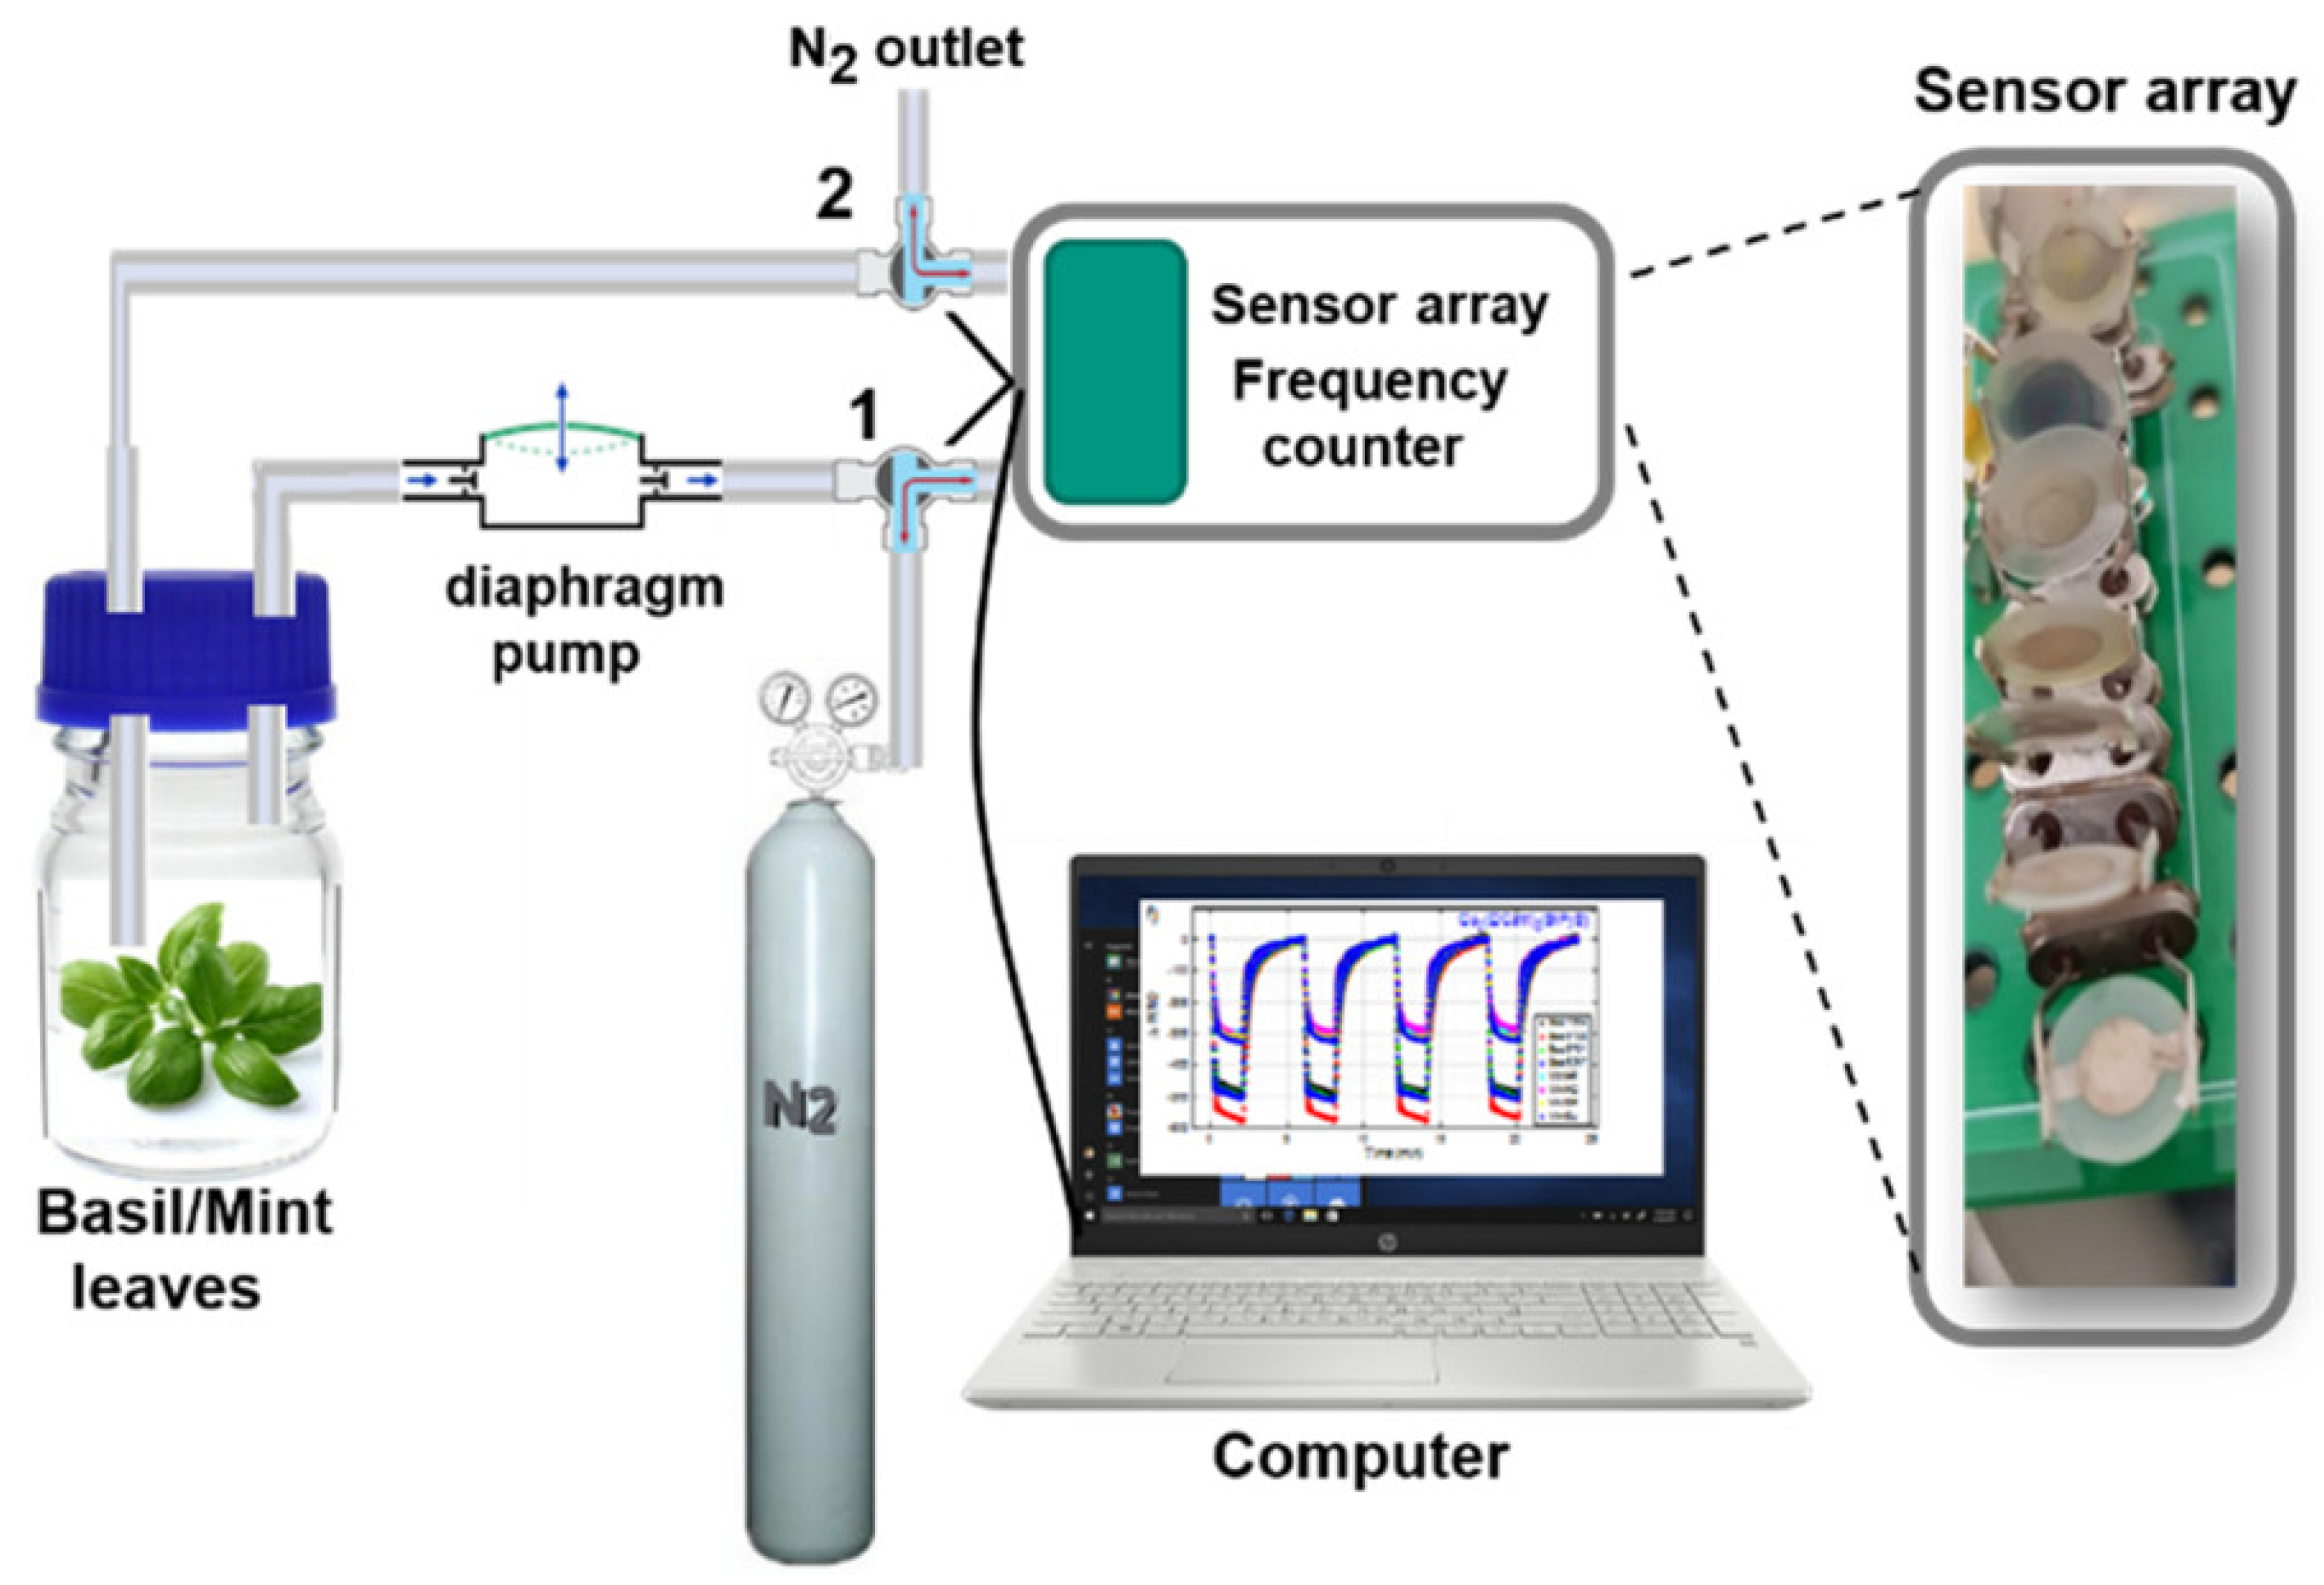
2.3. Data Acquisition with the e-Nose
2.4. Data Analysis and Classification
3. Results and Discussions
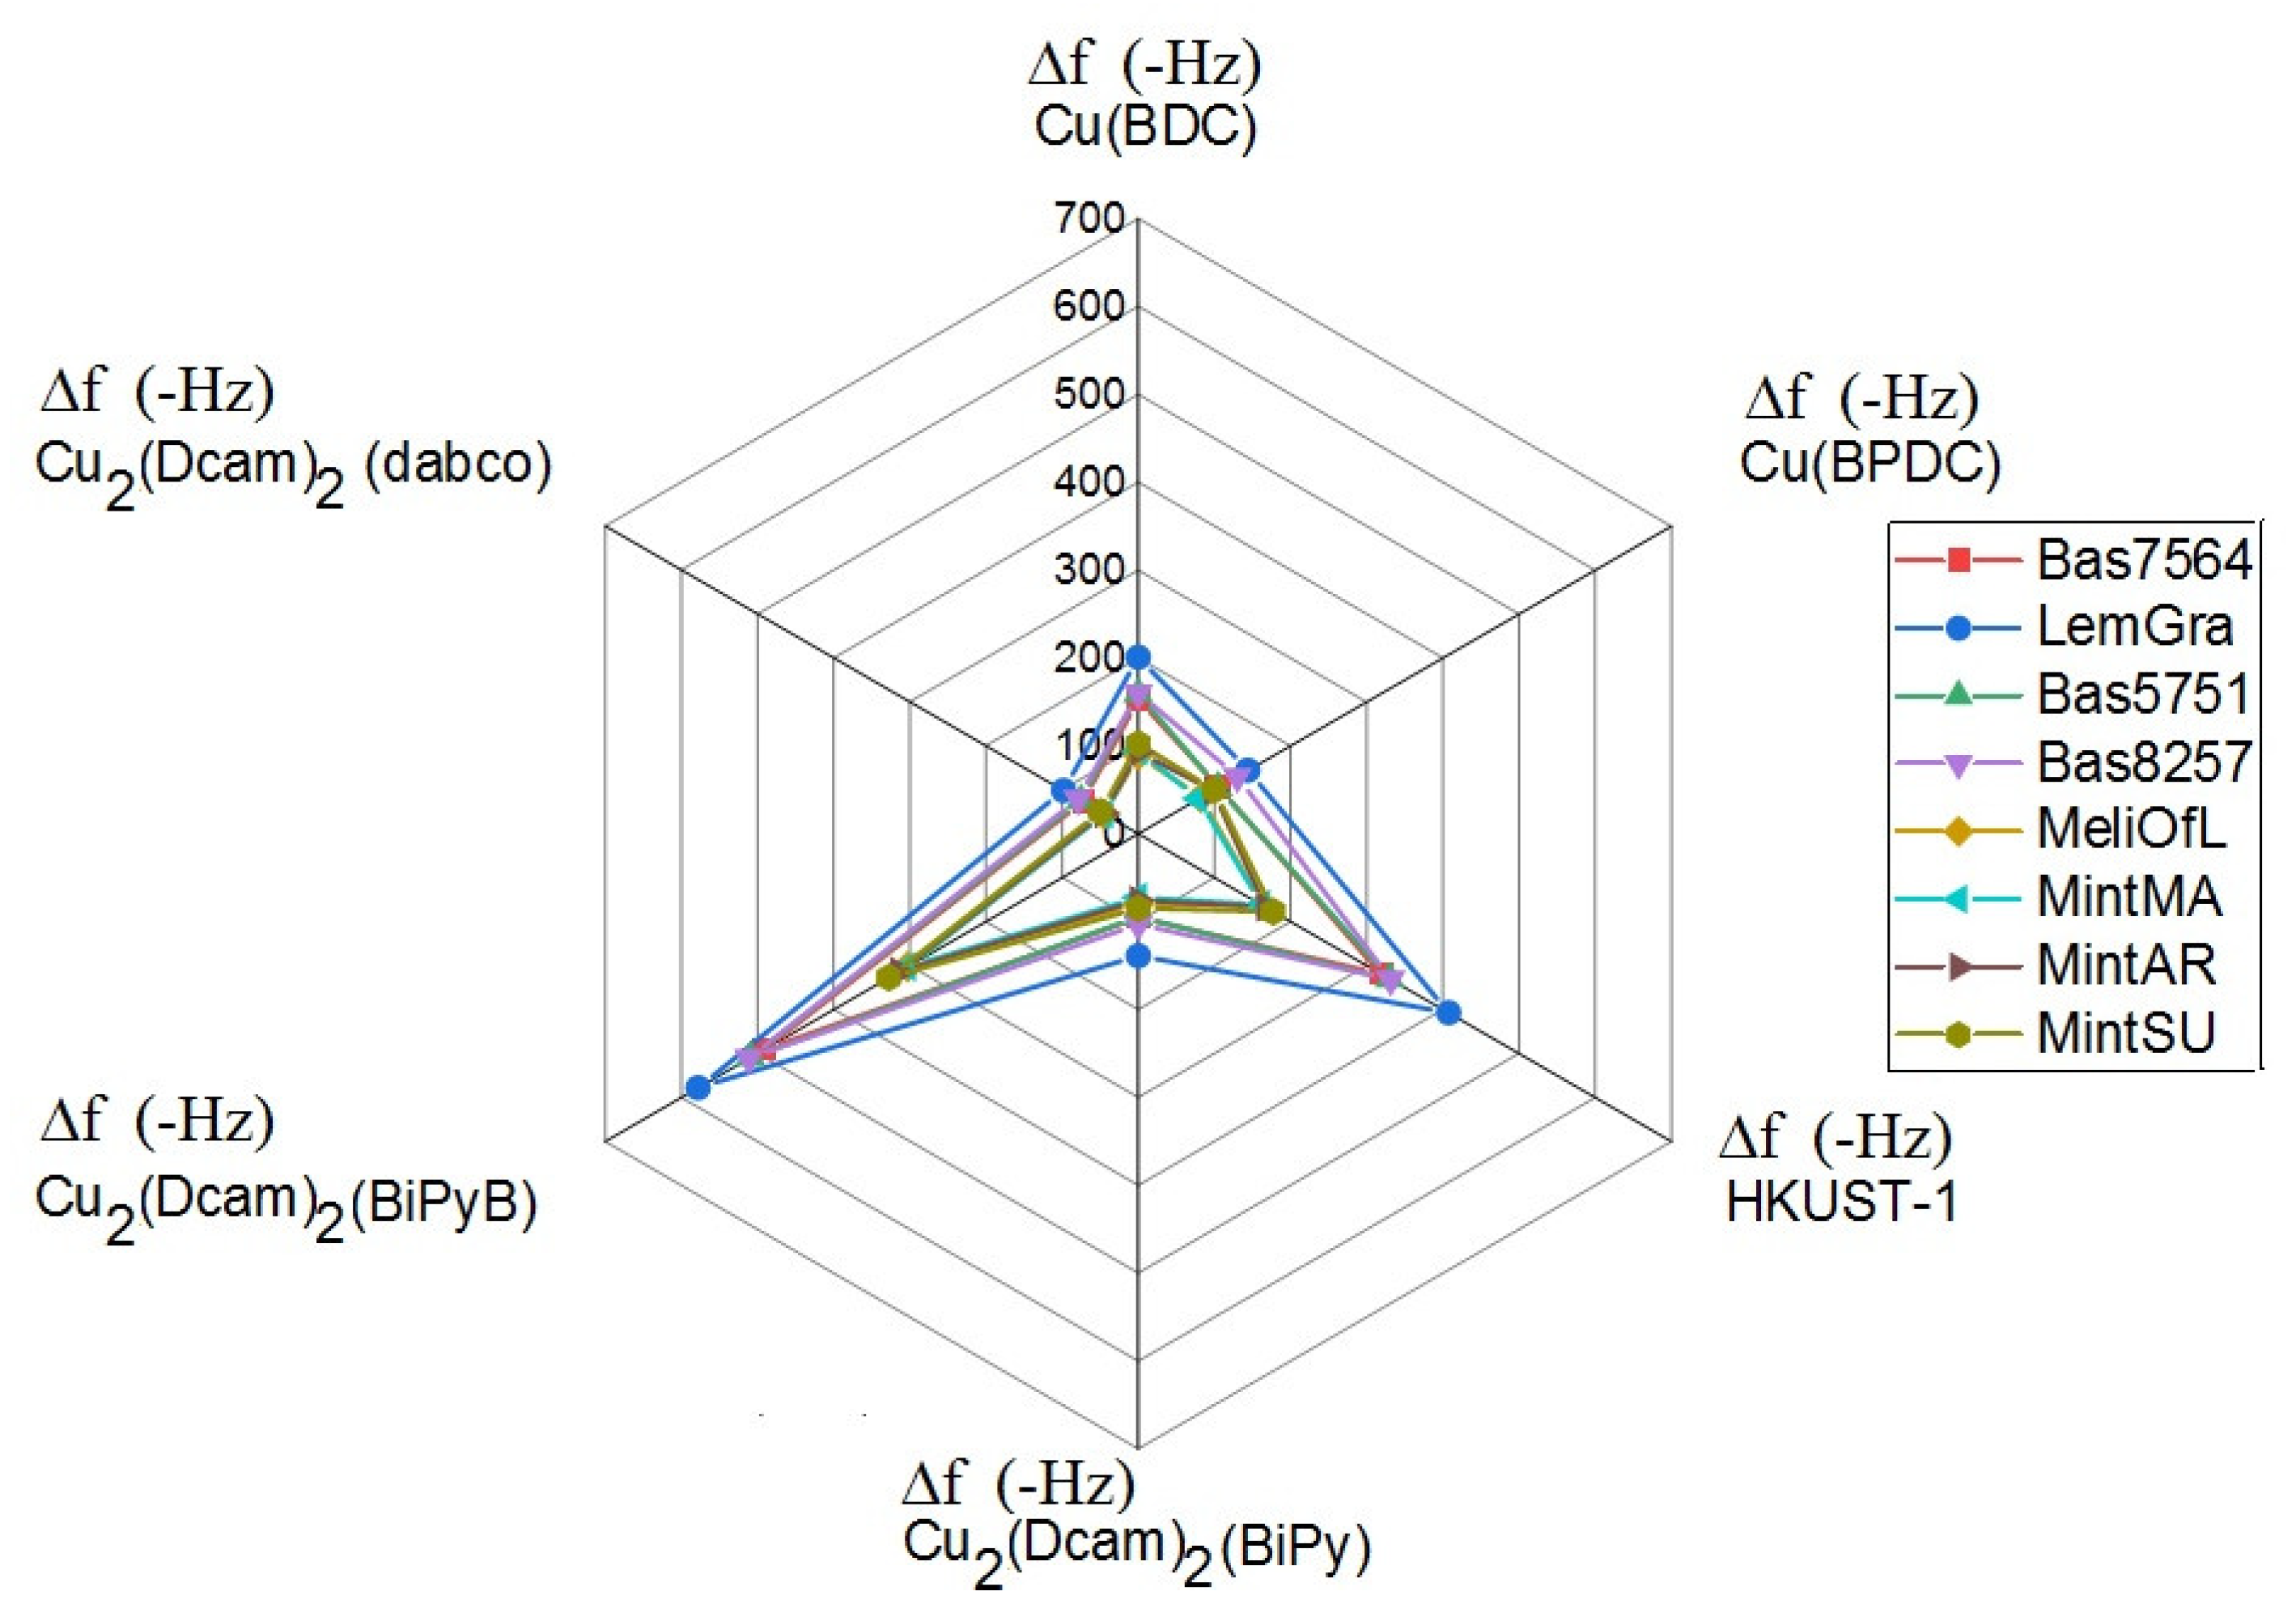
3.1. Sensor Array Responses
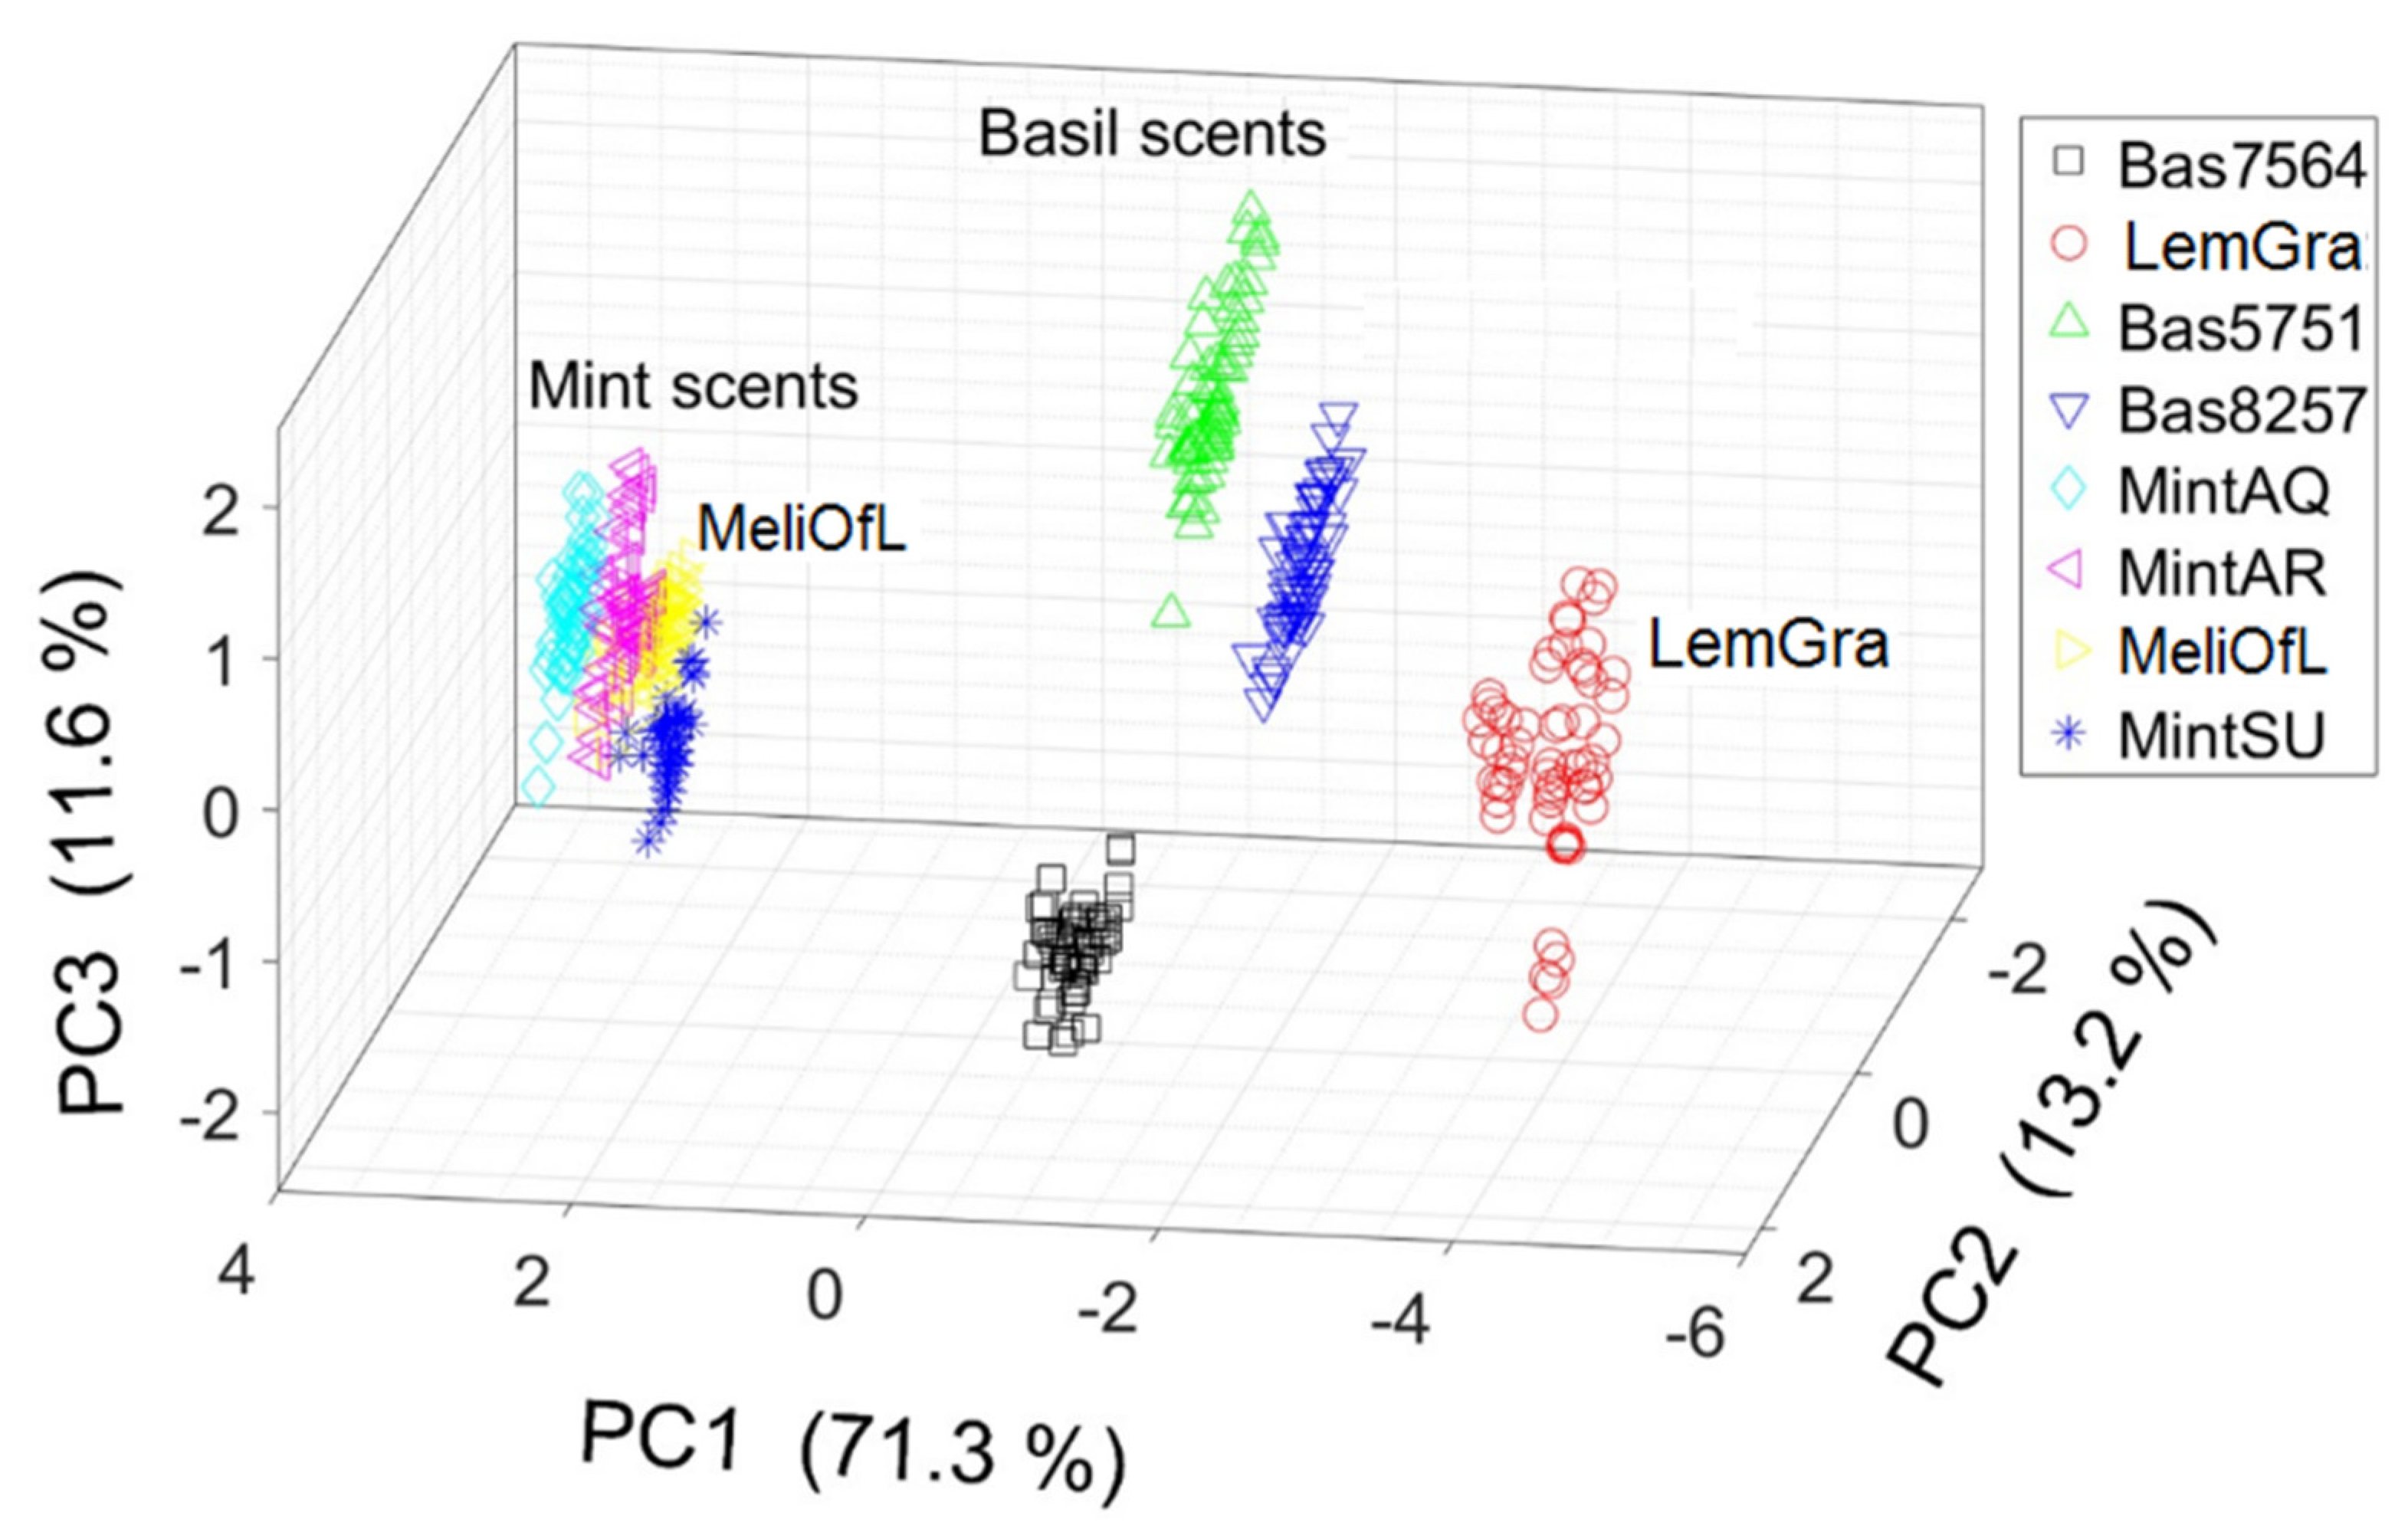
3.2. Principal Component Analysis (PCA)
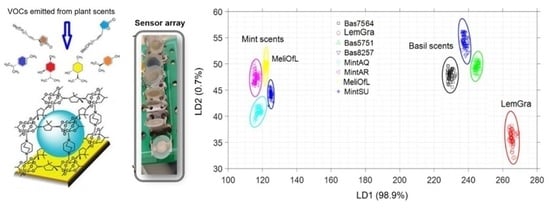
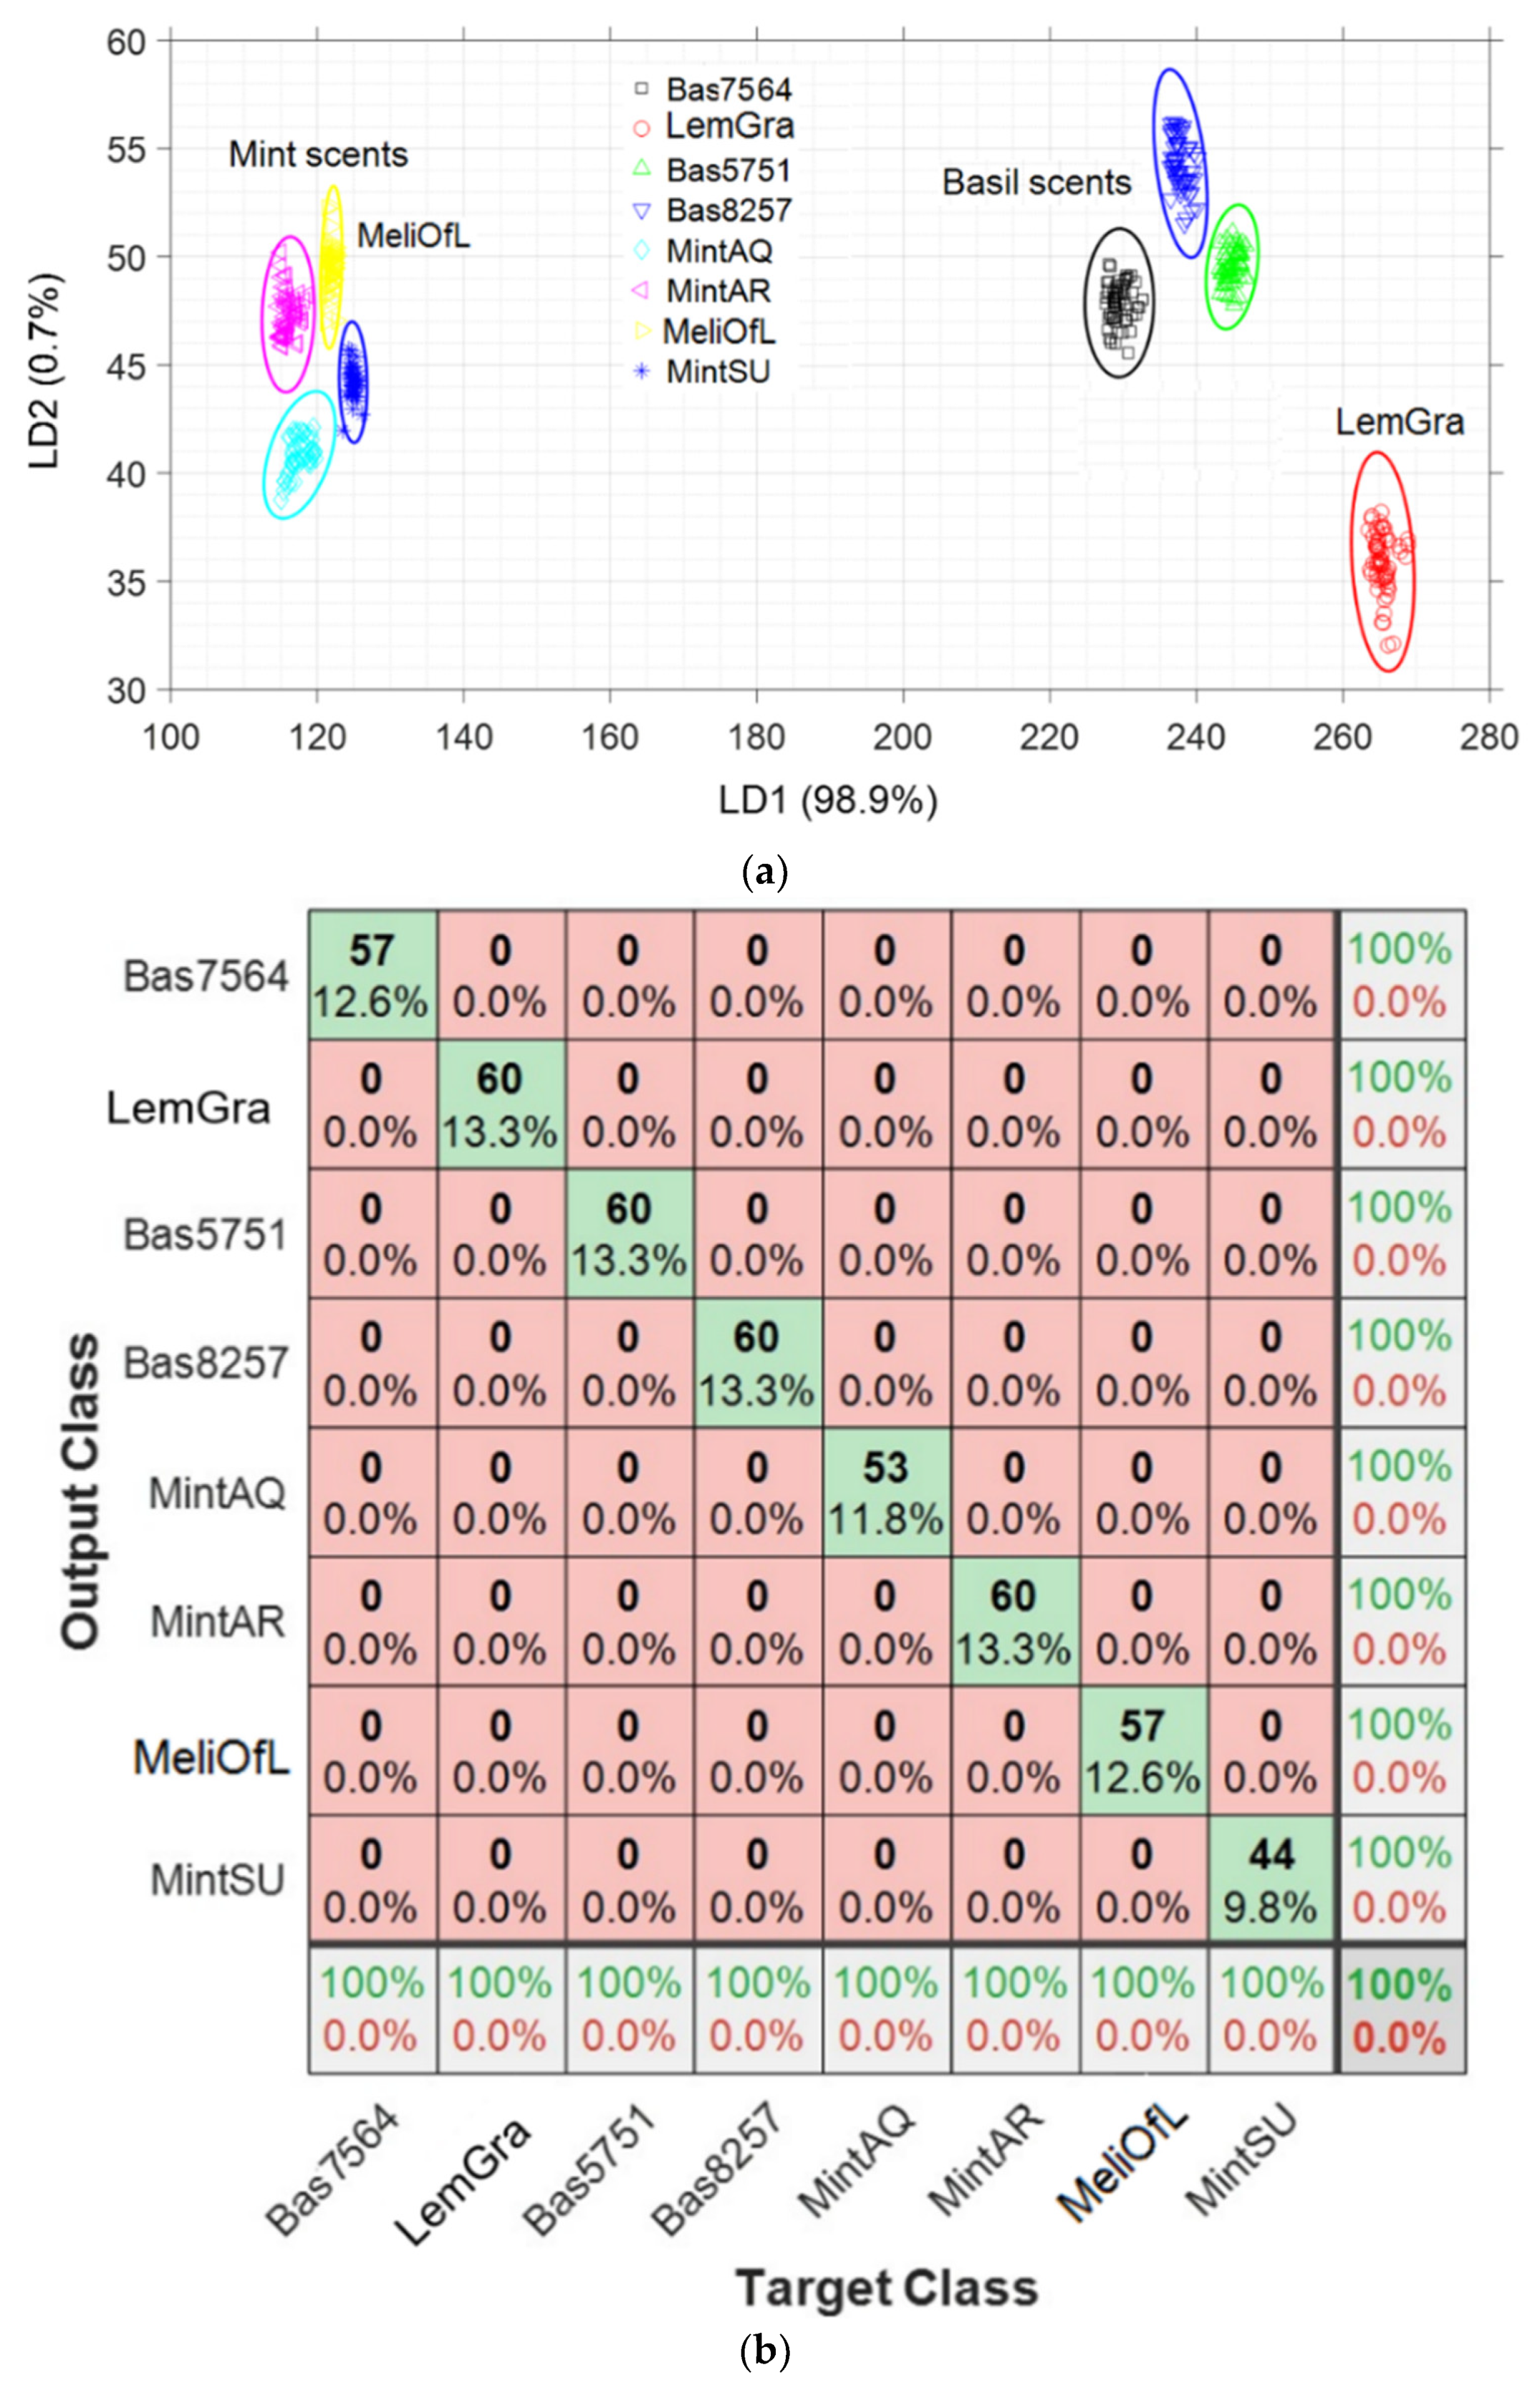
3.3. Linear Discrimination Analysis (LDA)
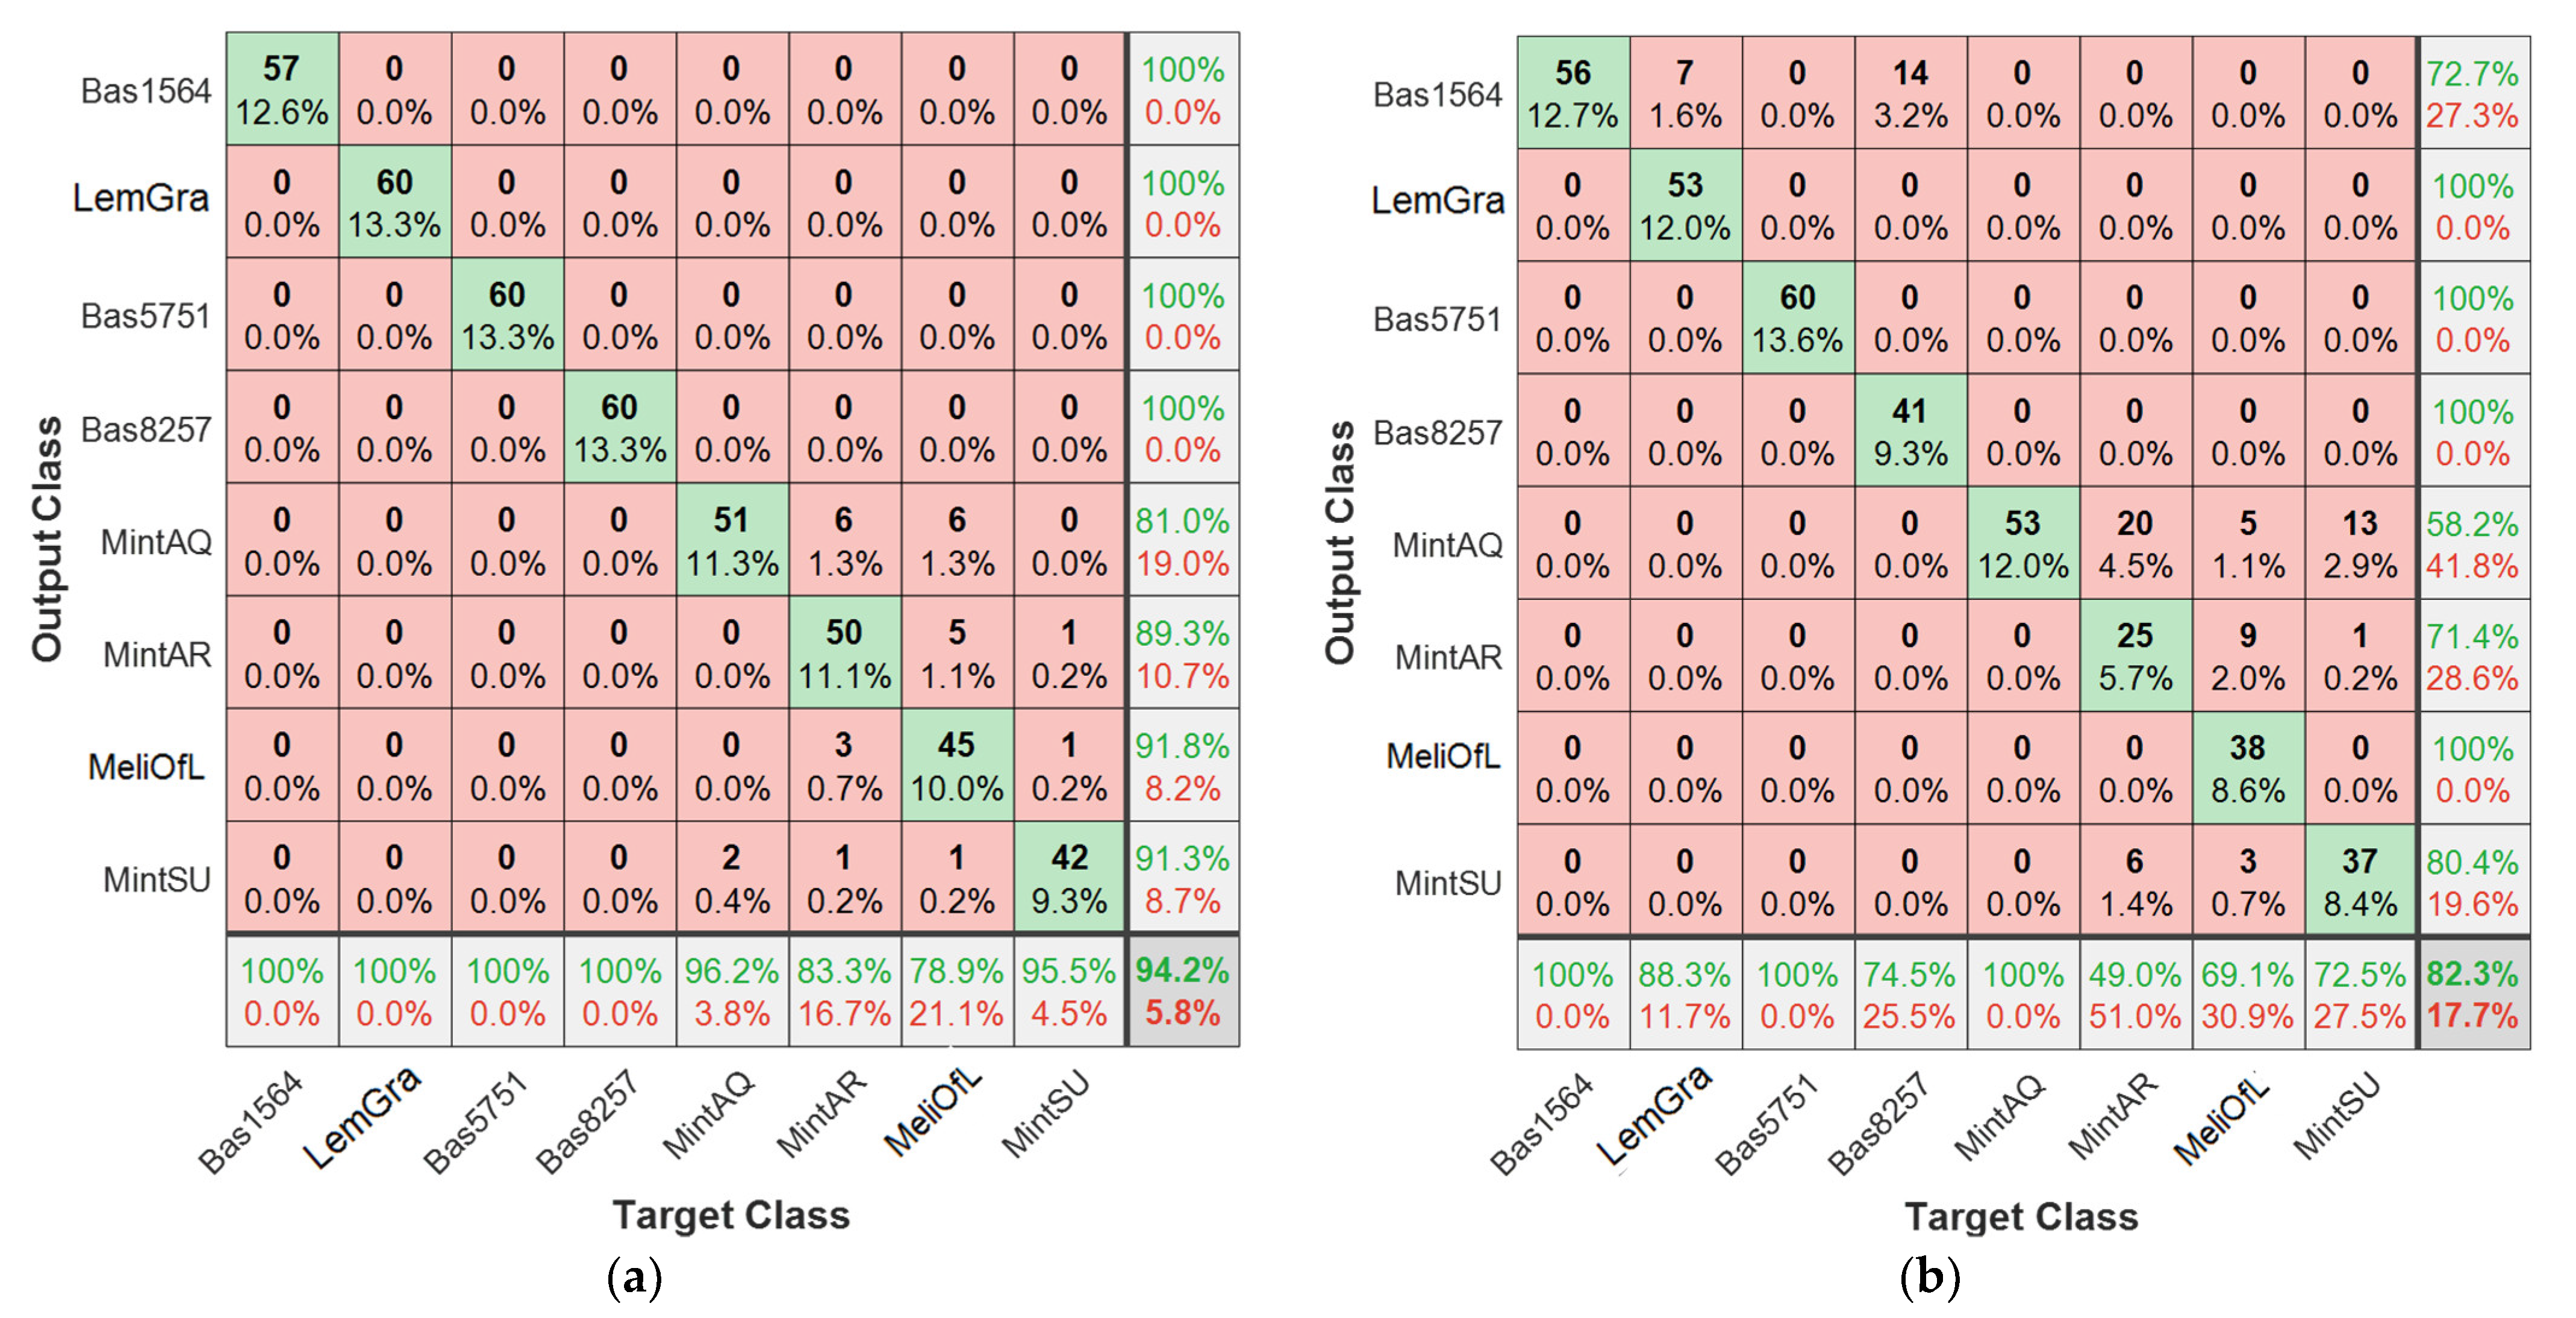
3.4. Nearest Neighbor Analysis (k-NN)
4. Conclusions
Supplementary Materials
Author Contributions
Funding
Institutional Review Board Statement
Data Availability Statement
Acknowledgments
Conflicts of Interest
References
- Choesin, D.N.; Boerner, R.E. Allyl isothiocyanate release and the allelopathic potential of Brassica napus (Brassicaceae). Am. J. Bot. 1991, 78, 1083–1090. [Google Scholar] [CrossRef]
- Bruneton, J. Pharmacognosy, Phytochemistry, Medicinal Plants; Lavoisier Publishing: Paris, France, 1995. [Google Scholar]
- Kubitzki, K.; Rohwer, J.; Bittrich, V. The Families and Genera of Vascular Plants; Springer: Berlin/Heidelberg, Germany, 1990; Volume 1. [Google Scholar]
- Butterworth, M.; Davis, G.; Bishop, K.; Reyna, L.; Rhodes, A. What Is a Superfood Anyway? Six Key Ingredients for Making a Food “Super”. Gastronomica 2020, 20, 46–58. [Google Scholar] [CrossRef]
- Zoller, A.; Nordwig, H. Heilpflanzen der Ayurvedischen Medizin; Narayana Verlag: Kandern, Germany, 2017. [Google Scholar]
- Murthy, K.S.R.; Reddy, M.C.; Rani, S.S.; Pullaiah, T. Bioactive principles and biological properties of essential oils of Burseraceae: A review. J. Pharmacogn. Phytochem. 2016, 5, 247. [Google Scholar]
- Malladi, S.; Ratnakaram, V.N.; Pullaiah, T. Phytochemical screening of Caralluma lasiantha: Isolation of C21 pregnane steroid. Orient. J. Chem. 2017, 33, 963–967. [Google Scholar] [CrossRef]
- Mediratta, P.; Sharma, K. Effect of essential oil of the leaves and fixed oil of the seeds of Ocimum sanctum on immune responses. J. Med. Aromat. Plant Sci. 2000, 22, 694–700. [Google Scholar]
- Jürges, G.; Beyerle, K.; Tossenberger, M.; Häser, A.; Nick, P. Development and validation of microscopical diagnostics for ‘Tulsi’(Ocimum tenuiflorum L.) in ayurvedic preparations. Eur. Food Res. Technol. 2009, 229, 99–106. [Google Scholar] [CrossRef]
- Cohen, Y.; Ben Naim, Y.; Falach, L.; Rubin, A.E. Epidemiology of basil downy mildew. Phytopathology 2017, 107, 1149–1160. [Google Scholar] [CrossRef] [Green Version]
- Agrawal, P.; Rai, V.; Singh, R. Randomized placebo-controlled, single blind trial of holy basil leaves in patients with noninsulin-dependent diabetes mellitus. Int. J. Clin. Pharmacol. Ther. 1996, 34, 406. [Google Scholar]
- Jürges, G.; Sahi, V.; Rios Rodriguez, D.; Reich, E.; Bhamra, S.; Howard, C.; Slater, A.; Nick, P. Product authenticity versus globalisation—The Tulsi case. PLoS ONE 2018, 13, e0207763. [Google Scholar] [CrossRef]
- Riemer, B.; Weber, B. Lebensmittelbedarfsgegenstände und Verpackungsrecht; Behr’s Verlag: Hamburg, Germany, 2014. [Google Scholar]
- Ichim, M.C.; Häser, A.; Nick, P. Microscopic authentication of commercial herbal products in the globalized market: Potential and limitations. Front. Pharmacol. 2020, 11, 876. [Google Scholar] [CrossRef]
- Zaheer, S.H.; Prasad, B.; Chopra, R.N.; Santapau, H.; Krishnan, M.S.; Deshaprabhu, S.B. Wealth of India–A Dictionary of Raw Materials and Industrial Products; CSIR: New Delhi, India, 1966; Volume VII, p. 10. [Google Scholar]
- Vani, S.R.; Cheng, S.; Chuah, C. Comparative study of volatile compounds from genus Ocimum. Am. J. Appl. Sci. 2009, 6, 523. [Google Scholar] [CrossRef]
- Ganie, S.H.; Upadhyay, P.; Das, S.; Sharma, M.P. Authentication of medicinal plants by DNA markers. Plant Gene 2015, 4, 83–99. [Google Scholar] [CrossRef] [Green Version]
- Zou, H.-Q.; Lu, G.; Liu, Y.; Bauer, R.; Tao, O.; Gong, J.-T.; Zhao, L.-Y.; Li, J.-H.; Ren, Z.-Y.; Yan, Y.-H. Is it possible to rapidly and noninvasively identify different plants from Asteraceae using electronic nose with multiple mathematical algorithms? J. Food Drug Anal. 2015, 23, 788–794. [Google Scholar] [CrossRef] [Green Version]
- Wasilewski, T.; Szulczyński, B.; Wojciechowski, M.; Kamysz, W.; Gębicki, J. A Highly Selective Biosensor Based on Peptide Directly Derived from the HarmOBP7 Aldehyde Binding Site. Sensors 2019, 19, 4284. [Google Scholar] [CrossRef] [PubMed] [Green Version]
- Iqbal, N.; Mustafa, G.; Rehman, A.; Biedermann, A.; Najafi, B.; Lieberzeit, P.A.; Dickert, F.L. QCM-arrays for sensing terpenes in fresh and dried herbs via bio-mimetic MIP layers. Sensors 2010, 10, 6361–6376. [Google Scholar] [CrossRef] [PubMed] [Green Version]
- Wojnowski, W.; Majchrzak, T.; Dymerski, T.; Gębicki, J.; Namieśnik, J. Portable electronic nose based on electrochemical sensors for food quality assessment. Sensors 2017, 17, 2715. [Google Scholar] [CrossRef] [PubMed] [Green Version]
- Kiani, S.; van Ruth, S.M.; Minaei, S.; Ghasemi-Varnamkhasti, M. Hyperspectral imaging, a non-destructive technique in medicinal and aromatic plant products industry: Current status and potential future applications. Comput. Electron. Agric. 2018, 152, 9–18. [Google Scholar] [CrossRef]
- Kiani, S.; Minaei, S.; Ghasemi-Varnamkhasti, M. Real-time aroma monitoring of mint (Mentha spicata L.) leaves during the drying process using electronic nose system. Measurement 2018, 124, 447–452. [Google Scholar] [CrossRef]
- Rasekh, M.; Karami, H.; Wilson, A.D.; Gancarz, M. Classification and Identification of Essential Oils from Herbs and Fruits Based on a MOS Electronic-Nose Technology. Chemosensors 2021, 9, 142. [Google Scholar] [CrossRef]
- Dong, W.; Tan, L.; Zhao, J.; Hu, R.; Lu, M. Characterization of fatty acid, amino acid and volatile compound compositions and bioactive components of seven coffee (Coffea robusta) cultivars grown in Hainan Province, China. Molecules 2015, 20, 16687–16708. [Google Scholar] [CrossRef] [PubMed]
- Gancarz, M.; Malaga-Toboła, U.; Oniszczuk, A.; Tabor, S.; Oniszczuk, T.; Gawrysiak-Witulska, M.; Rusinek, R. Detection and measurement of aroma compounds with the electronic nose and a novel method for MOS sensor signal analysis during the wheat bread making process. Food Bioprod. Process. 2021, 127, 90–98. [Google Scholar] [CrossRef]
- Slimani, S.; Bultel, E.; Cubizolle, T.; Herrier, C.; Rousselle, T.; Livache, T. Opto-Electronic Nose Coupled to a Silicon Micro Pre-Concentrator Device for Selective Sensing of Flavored Waters. Chemosensors 2020, 8, 60. [Google Scholar] [CrossRef]
- Okur, S.; Sarheed, M.; Huber, R.; Zhang, Z.; Heinke, L.; Kanbar, A.; Wöll, C.; Nick, P.; Lemmer, U. Identification of Mint Scents Using a QCM Based E-Nose. Chemosensors 2021, 9, 31. [Google Scholar] [CrossRef]
- Okur, S.; Zhang, Z.; Sarheed, M.; Nick, P.; Lemmer, U.; Heinke, L. Towards a MOF e-Nose: A SURMOF sensor array for detection and discrimination of plant oil scents and their mixtures. Sens. Actuators B Chem. 2020, 306, 127502. [Google Scholar] [CrossRef]
- Okur, S.; Qin, P.; Chandresh, A.; Li, C.; Zhang, Z.; Lemmer, U.; Heinke, L. An enantioselective e-nose: An array of nanoporous homochiral MOF films for stereospecific sensing of chiral odors. Angew. Chem. Int. Ed. 2020, 132, 1–7. [Google Scholar]
- Shekhah, O.; Wang, H.; Kowarik, S.; Schreiber, F.; Paulus, M.; Tolan, M.; Sternemann, C.; Evers, F.; Zacher, D.; Fischer, R.A. Step-by-step route for the synthesis of metal−organic frameworks. J. Am. Chem. Soc. 2007, 129, 15118–15119. [Google Scholar] [CrossRef] [PubMed]
- Okur, S.; Kuş, M.; Özel, F.; Yılmaz, M. Humidity adsorption kinetics of water soluble calix [4] arene derivatives measured using QCM technique. Sens. Actuators B Chem. 2010, 145, 93–97. [Google Scholar] [CrossRef] [Green Version]
- Horzum, N.; Taşçıoglu, D.; Okur, S.; Demir, M.M. Humidity sensing properties of ZnO-based fibers by electrospinning. Talanta 2011, 85, 1105–1111. [Google Scholar] [CrossRef] [Green Version]
- Muckley, E.S.; Anazagasty, C.; Jacobs, C.B.; Hianik, T.; Ivanov, I.N. Low-cost scalable quartz crystal microbalance array for environmental sensing. In Proceedings of the Organic Sensors and Bioelectronics IX, San Diego, CA, USA, 28 August–1 September 2016; p. 99440Y. [Google Scholar]
- Heinke, L.; Wöll, C. Surface-Mounted Metal–Organic Frameworks: Crystalline and Porous Molecular Assemblies for Fundamental Insights and Advanced Applications. Adv. Mater. 2019, 31, 1806324. [Google Scholar] [CrossRef]
- Sarheed, M.M. Allelopathic Compounds from Mint Target the Cytoskeleton from Cell Biology Towards Application as Bioherbicides. Ph.D. Thesis, Karlsruher Institut für Technologie (KIT), Karlsruhe, Germany, 2019. [Google Scholar]
- Sarheed, M.M.; Rajabi, F.; Kunert, M.; Boland, W.; Wetters, S.; Miadowitz, K.; Kaźmierczak, A.; Sahi, V.P.; Nick, P. Cellular base of mint allelopathy: Menthone affects plant microtubules. Front. Plant Sci. 2020, 11, 1320. [Google Scholar] [CrossRef]
- Gu, Z.-G.; Grosjean, S.; Bräse, S.; Wöll, C.; Heinke, L. Enantioselective adsorption in homochiral metal–organic frameworks: The pore size influence. Chem. Commun. 2015, 51, 8998–9001. [Google Scholar] [CrossRef]
- Heinke, L.; Gu, Z.; Wöll, C. The surface barrier phenomenon at the loading of metal-organic frameworks. Nat. Commun. 2014, 5, 1–6. [Google Scholar] [CrossRef] [PubMed]
- Zhou, W.; Wöll, C.; Heinke, L. Liquid-and gas-phase diffusion of ferrocene in thin films of metal-organic frameworks. Materials 2015, 8, 3767–3775. [Google Scholar] [CrossRef] [Green Version]
- Heinke, L. Diffusion and photoswitching in nanoporous thin films of metal-organic frameworks. J. Phys. D Appl. Phys. 2017, 50, 193004. [Google Scholar] [CrossRef]
- Sauerbrey, G.; Jung, G. Vibrational Modes of Planoconvex Quartz Plates. Z. Angew. Phys. 1968, 24, 100–106. [Google Scholar]
- Kambhatla, N.; Leen, T.K. Dimension reduction by local principal component analysis. Neural Comput. 1997, 9, 1493–1516. [Google Scholar] [CrossRef]
- Sharifzadeh, S.; Ghodsi, A.; Clemmensen, L.H.; Ersbøll, B.K. Sparse supervised principal component analysis (SSPCA) for dimension reduction and variable selection. Eng. Appl. Artif. Intell. 2017, 65, 168–177. [Google Scholar] [CrossRef] [Green Version]
- Shaoning, P.; Ozawa, S.; Kasabov, N. Incremental linear discriminant analysis for classification of data streams. IEEE Trans. Syst. ManCybern. Part B (Cybern.) 2005, 35, 905–914. [Google Scholar]
- Chalchat, J.-C.; Özcan, M.M. Comparative essential oil composition of flowers, leavesand stems of basil (Ocimum basilicum L.) used as herb. Food Chem. 2008, 110, 501–503. [Google Scholar] [CrossRef]
- Bilal, A.; Jahan, N.; Ahmed, A.; Bilal, S.N.; Habib, S.; Hajra, S. Phytochemical and pharmacological studies on Ocimum basilicum Linn-A review. Int. J. Curr. Res. Rev. 2012, 4, 73–83. [Google Scholar]
- Iqbal, N. QCM Sensor Arrays for Monitoring Volatile Plant Emanations via Molecularly Imprinted Polymers. Ph.D. Thesis, uniwien, Wien, Austria, 2011. [Google Scholar]


| Plant | Common Name | Abbreviation | KIT Voucher |
|---|---|---|---|
| Ocimumcampechianum Mill. | Amazon Basil | Bas7564 | 7564 |
| Ocimumtenuiflorum L. | Tulsi | Bas5751 | 5751 |
| Ocimumtenuiflorum L. | Krishna Tulsi | Bas8257 | 8257 |
| Cymbopogon citratus | Lemongrass | LemGra | 5722 |
| Melissa officinalis L | Common Balm | MeliOfL | 4643 |
| Mentha aquatica L. | Water Mint | MintAQ | 8680 |
| Agastache rugosa | Korean Mint | MintAR | 7576 |
| Mentha suaveolens | Apple Mint | MintSU | 3638 |
| Bas7564 | LemGra | Bas5751 | Bas8257 | MeliOfL | MintMA | MintAR | MintSU | |
|---|---|---|---|---|---|---|---|---|
| Δf(−Hz) | Δf(−Hz) | Δf(−Hz) | Δf(−Hz) | Δf(−Hz) | Δf(−Hz) | Δf(−Hz) | Δf(−Hz) | |
| Cu(BDC) | 153.1 | 200.9 | 159.4 | 160.0 | 89.5 | 94.4 | 93.1 | 102.4 |
| Cu(BPDC) | 105.4 | 144.0 | 104.8 | 130.1 | 82.6 | 78.9 | 98.2 | 100.1 |
| HKUST-1 | 319.1 | 407.6 | 330.6 | 331.3 | 163.3 | 162.1 | 166.7 | 177.3 |
| Cu2(Dcam)2 (BiPy) | 95.9 | 139.0 | 95.0 | 103.0 | 80.4 | 72.5 | 76.1 | 84.8 |
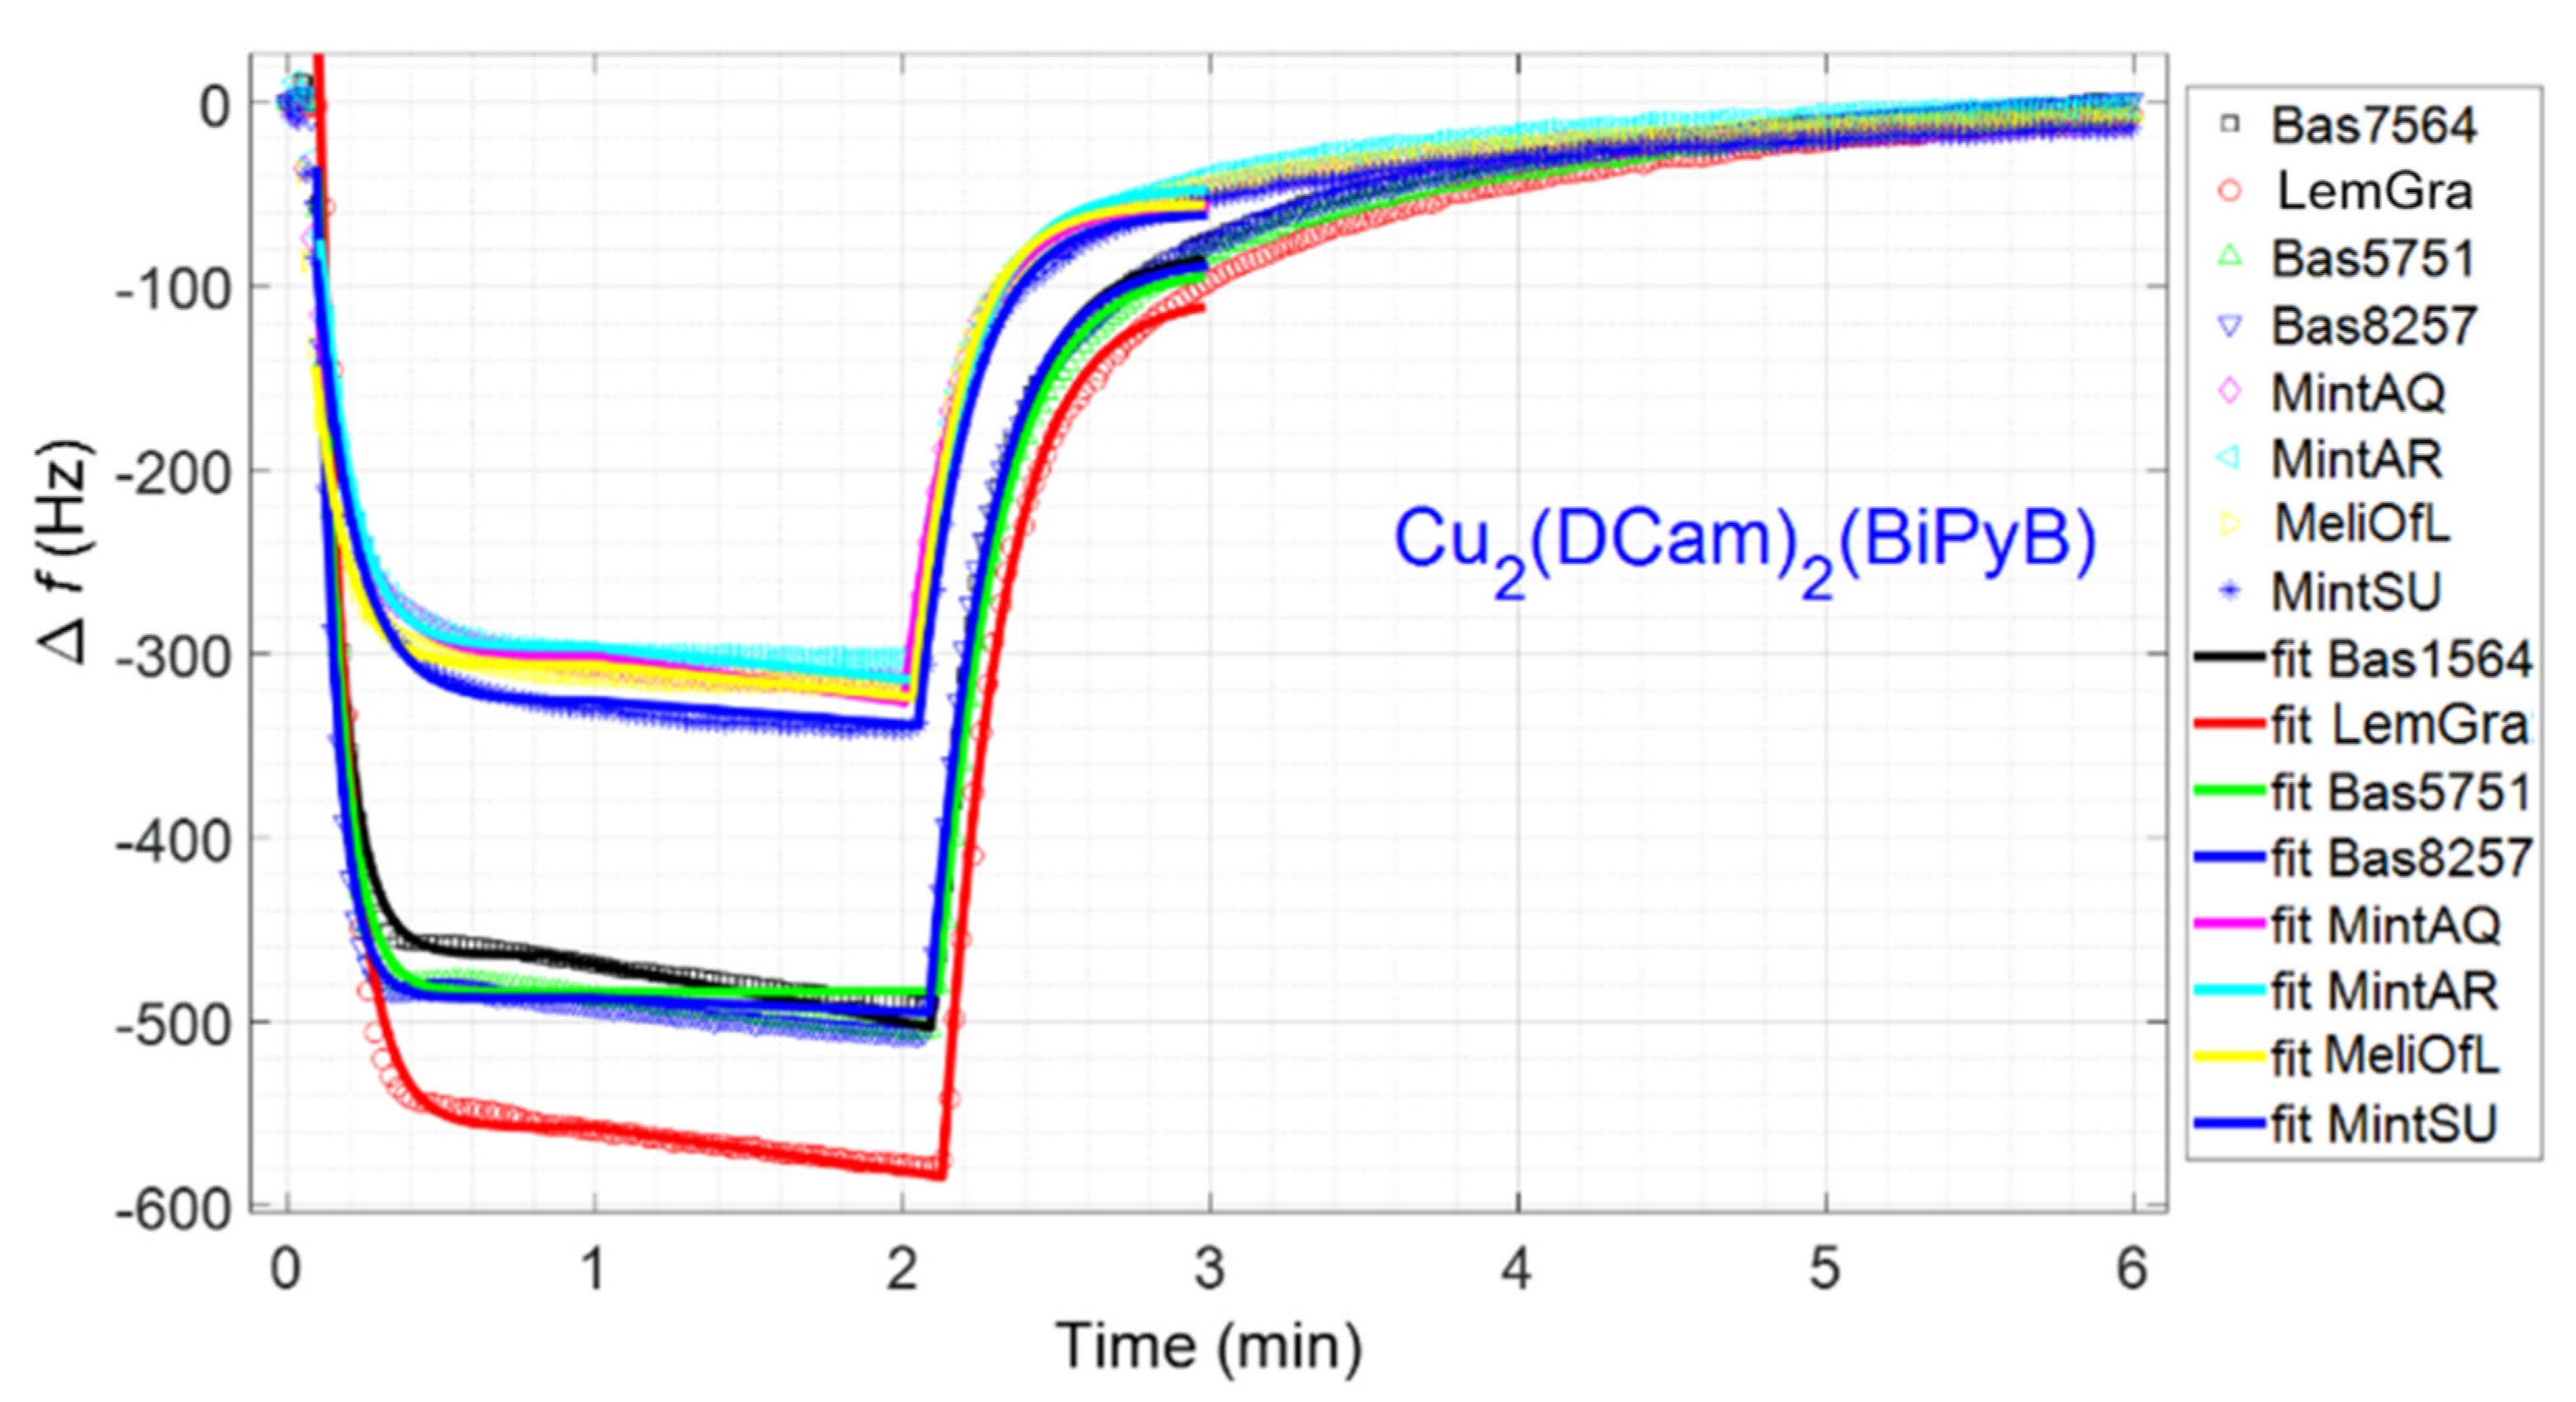
| Cu2(Dcam)2 (BiPyB) | 492.6 | 578.3 | 509.0 | 510.9 | 302.8 | 303.4 | 314.4 | 327.6 |
| Cu2(Dcam)2 (dabco) | 72.9 | 98.2 | 75.4 | 79.0 | 44.7 | 44.5 | 45.9 | 49.3 |
| Training Data | Unknown Test Data | Discrimination Accuracy | Prediction Accuracy |
|---|---|---|---|
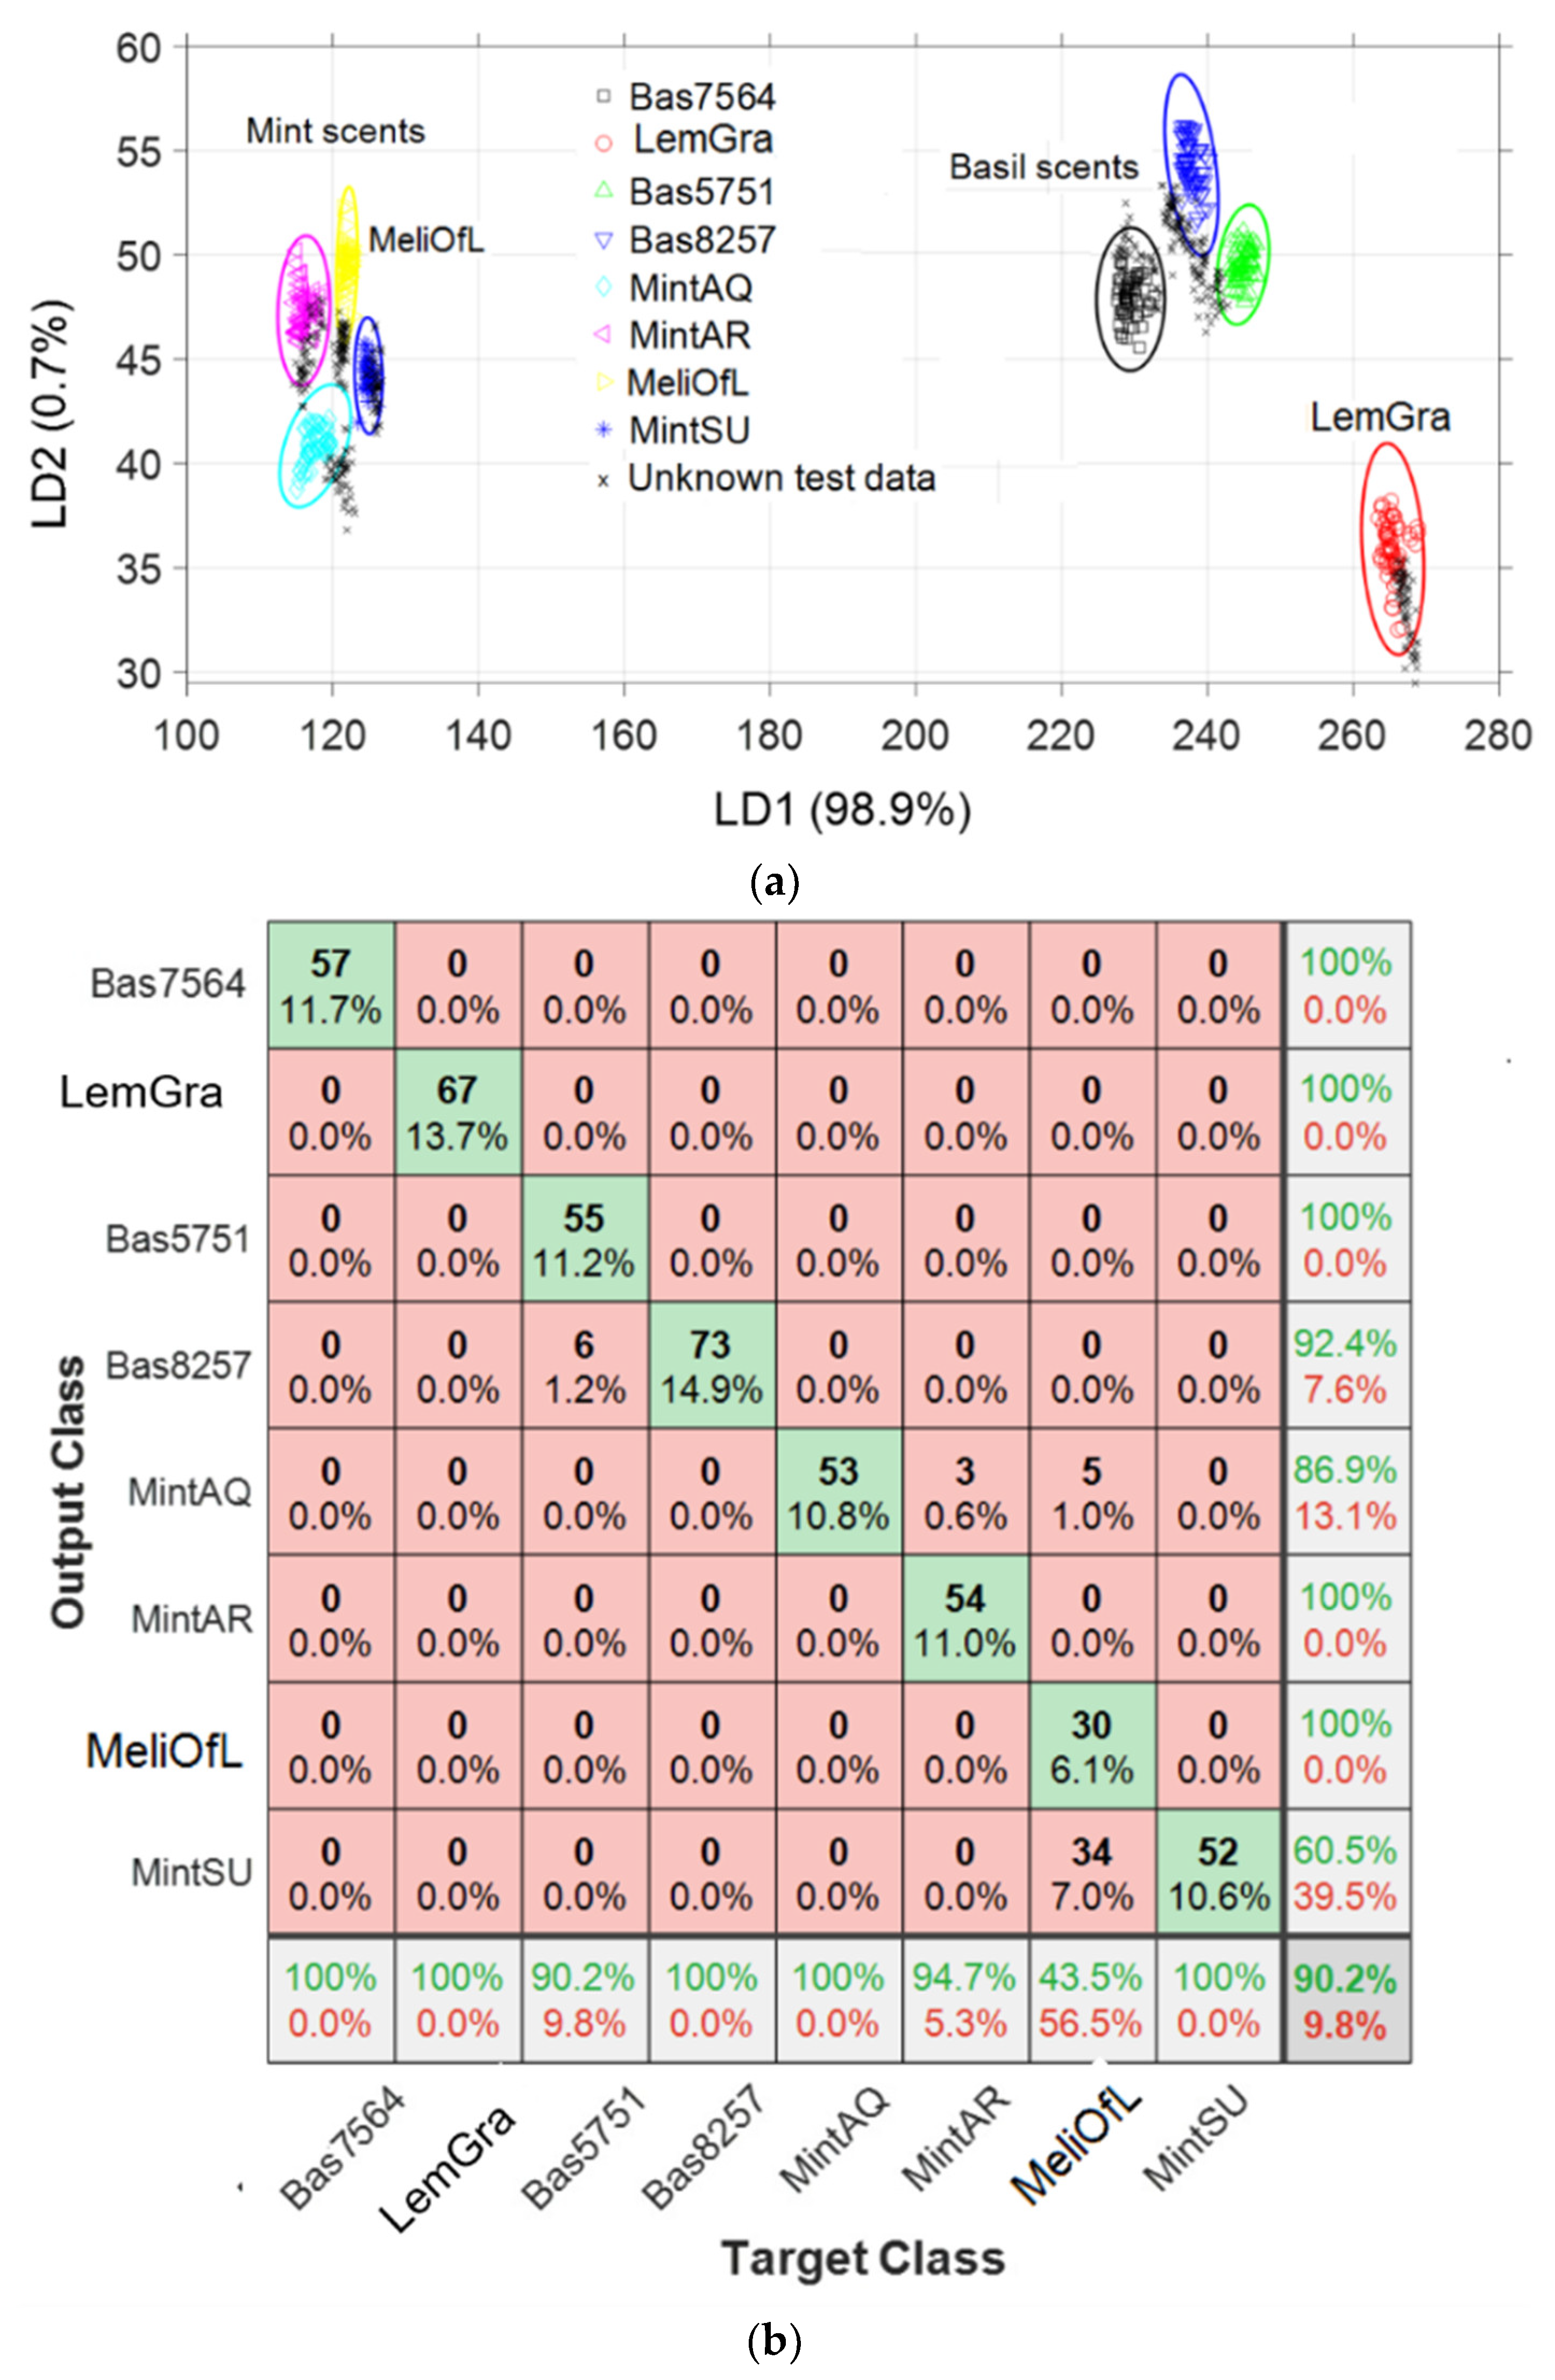
| first cycle | second cycle | 100 | 90.2% |
| first cycle | third cycle | 100 | 75.3% |
| first cycle | fourth cycle | 100 | 77.7% |
| second cycle | third cycle | 100 | 79.3% |
| second cycle | fourth cycle | 100 | 79.0% |
| third cycle | fourth cycle | 100 | 73.5% |
Publisher’s Note: MDPI stays neutral with regard to jurisdictional claims in published maps and institutional affiliations. |
© 2021 by the authors. Licensee MDPI, Basel, Switzerland. This article is an open access article distributed under the terms and conditions of the Creative Commons Attribution (CC BY) license (https://creativecommons.org/licenses/by/4.0/).
Share and Cite
Okur, S.; Li, C.; Zhang, Z.; Vaidurya Pratap, S.; Sarheed, M.; Kanbar, A.; Franke, L.; Geislhöringer, F.; Heinke, L.; Lemmer, U.; et al. Sniff Species: SURMOF-Based Sensor Array Discriminates Aromatic Plants beyond the Genus Level. Chemosensors 2021, 9, 171. https://doi.org/10.3390/chemosensors9070171
Okur S, Li C, Zhang Z, Vaidurya Pratap S, Sarheed M, Kanbar A, Franke L, Geislhöringer F, Heinke L, Lemmer U, et al. Sniff Species: SURMOF-Based Sensor Array Discriminates Aromatic Plants beyond the Genus Level. Chemosensors. 2021; 9(7):171. https://doi.org/10.3390/chemosensors9070171
Chicago/Turabian StyleOkur, Salih, Chun Li, Zejun Zhang, Sahi Vaidurya Pratap, Mohammed Sarheed, Adnan Kanbar, Leonard Franke, Felix Geislhöringer, Lars Heinke, Uli Lemmer, and et al. 2021. "Sniff Species: SURMOF-Based Sensor Array Discriminates Aromatic Plants beyond the Genus Level" Chemosensors 9, no. 7: 171. https://doi.org/10.3390/chemosensors9070171
APA StyleOkur, S., Li, C., Zhang, Z., Vaidurya Pratap, S., Sarheed, M., Kanbar, A., Franke, L., Geislhöringer, F., Heinke, L., Lemmer, U., Nick, P., & Wöll, C. (2021). Sniff Species: SURMOF-Based Sensor Array Discriminates Aromatic Plants beyond the Genus Level. Chemosensors, 9(7), 171. https://doi.org/10.3390/chemosensors9070171