Article

Absolute Configuration Sensing of Chiral Aryl- and Aryloxy-Propionic Acids by Biphenyl Chiroptical Probes

Department of Sciences, University of Basilicata, Via dell’Ateneo Lucano 10, 85100 Potenza, Italy
*
Author to whom correspondence should be addressed.
Chemosensors 2021, 9(7), 154; https://doi.org/10.3390/chemosensors9070154
Submission received: 1 June 2021 / Revised: 21 June 2021 / Accepted: 22 June 2021 / Published: 24 June 2021

Abstract

:
The absolute configuration of chiral 2-aryl and 2-aryloxy propionic acids, which are among the most common chiral environmental pollutants, has been readily and reliably established by either electronic circular dichroism spectroscopy or optical rotation measurements employing suitably designed 4,4′-disubstituted biphenyl probes. In fact, the 4,4′-biphenyl substitution gives rise to a red shift of the diagnostic electronic circular dichroism signal of the biphenyl A band employed for the configuration assignment, removing its overlap with other interfering dichroic bands and allowing its clear sign identification. The largest A band red shift, and thus the most reliable results, are obtained by employing as a probe the 4,4′-dinitro substituted biphenylazepine 3c. The method was applied to the absolute configuration assignment of 2-arylpropionic acids ibuprofen (1a), naproxen (1b), ketoprofen (1c) and flurbiprofen (1d), as well as to the 2-aryloxypropionic acids 2-phenoxypropionic acid (2a) and 2-naphthoxypropionic acid (2b). This approach, allowing us to reveal the sample’s absolute configuration by simple optical rotation measurements, is potentially applicable to online analyses of both the enantiomeric composition and absolute configuration of these chiral pollutants.

1. Introduction

The interaction of chiral molecules with living organisms is heavily determined by their absolute configuration. In fact, the bioactivity of chiral natural products [1], the pharmacological activity of chiral drugs [2,3], the taste and smell of chiral flavors and fragrances [4,5], the herbicidal or insecticidal activity of chiral agrochemicals [6,7] and the environmental role of chiral pollutants [8] usually strongly differ between the two possible enantiomeric forms. Therefore, the detection of the absolute configuration of chiral molecules of either natural or synthetic origin is a fundamental task to be addressed for their characterization. Even though several approaches are available for the absolute configuration assignment to chiral molecules, most of them require time-consuming procedures and/or lack versatility [9]. On the contrary, the necessity to analyze chiral non-racemic compounds in different matrices makes necessary the development of novel faster and more versatile approaches, without sacrificing high reliability. To this end, useful tools are provided by methods based on polarized light (or chiroptical) spectroscopies, such as optical rotation (OR), electronic circular dichroism (ECD) and vibrational circular dichroism (VCD) [10,11]. In fact, chiroptical spectroscopies allow analysis in solution and, especially with the more sensitive ECD technique, on a microscale [12]. A breakthrough in this field has been recently achieved with the advance of ab initio predictions of chiroptical properties, which has been successfully applied [13,14] to a vast number of examples of natural [15] and synthetic [16] compounds. However, this approach still presents some limitations and/or difficulties when dealing with highly flexible molecules, giving rise to low chiroptical responses. In these cases, the so-called “chiroptical probes” offer a practical and reliable alternative which is also available to non-specialists in spectroscopy and computations, with the advantage that the configurational assignment can be obtained by a simple visual inspection of the spectrum. Some years ago, we introduced flexible 2,2′-bridged biphenyls as chiroptical probes for absolute configuration assignment to chiral diols [17,18], carboxylic acids [19,20] and primary amines [21], eventually extending the chiral detection from ECD to OR measurements [20]. In these systems, thanks to the low aryl–aryl rotational barrier displayed by the biphenyl moiety [17,19], a central-to-axial chirality induction occurs between the chiral substrate and the biphenyl itself which, in turn, assumes a preferred M or P twist depending on the substrate’s absolute configuration. Moreover, the sense of the biphenyl twist can be detected by the sign of the ECD Cotton effect at 250 nm (biphenyl A band) [22], which is positive for an M torsion and negative for a P torsion [23,24,25]. Therefore, once the mechanism of the twist induction in the biphenyl moiety is determined, the absolute configuration of the chiral substrate can be determined simply by looking at the diagnostic band in the ECD spectrum of the biphenyl derivative. In this paper, we describe the application of this approach to the sensing and detection of the absolute configuration of chiral 2-aryl and 2-aryloxy propionic acids, compounds of great interest in pharmaceutics and agriculture, respectively. In fact, 2-arylpropionic acids belong to the class of nonsteroidal anti-inflammatories (NSAIDs), and are among the most widely employed analgesic, antipyretic and anti-inflammatory compounds [26], the most popular being ibuprofen (1a), naproxen (1b), ketoprofen (1c) and flurbiprofen (1d) (Figure 1). On the other hand, 2-aryloxypropionic acids (e.g., 2a,b) (Figure 1) are employed as pesticides and herbicides for agriculture [27], and as antihyperlipidemic agents in pharmaceutics [28].
In both cases, the biological properties were found to be strictly connected to the absolute configuration of the chiral acid. As far as 2-arylpropionic acids are concerned, it was found that, in all cases, the (S) isomer is a more effective NSAID than the (R), such that nowadays some of them are commercialized as a single (S) enantiomer [2]. In the case of 2-aryloxypropionic acids, only the (R) enantiomer of herbicides shows the repressive activity in certain plants [29], while in their use as antihyperlipidemic drugs both enantiomers display similar activity, but significantly different—potentially dangerous—side effects [30]. Moreover, with the 2-aryl and 2-aryloxy propionic acids being among the most common chiral organic pollutants [29,31,32,33], the detection of their absolute configuration in complex matrices is a fundamental step for the analysis of their enantioselective biotic and abiotic degradation processes, and for their toxicology profile assessment [34,35,36,37]. These results highlight the need for effective, reliable and straightforward approaches for the determination of the absolute configuration of chiral 2-aryl propionic and 2-aryloxy propionic acids in solution, and the use of the biphenyl chiroptical probes appears to be particularly suitable for this purpose. We also show herein that, in the presence of large aryl chromophores on the chiral acid, absorbing in the 220–300 nm range and then overlapping to the diagnostic 250 nm biphenyl A band, it is necessary to employ specifically designed 4,4′-substituted biphenyl probes.

2. Materials and Methods

2.1. General Experimental Procedures

The NMR spectra were acquired on spectrometers running at 500 MHz for 1H, 125 MHz for 13C, at 400 MHz for 1H, and at 100 MHz for 13C. The chemical shifts (δ) are reported in ppm relative to the TMS signal. The 13C spectra were acquired in broad-band decoupled mode. The optical rotations were measured on a JASCO DIP-370 polarimeter, with [α]D values given in deg·cm3·g−1·dm−1; the concentration c is in g (100 mL)−1. The UV and ECD spectra were recorded at room temperature on a JASCO J815 spectropolarimeter, using 0.1 mm cells and concentrations of about 1 × 10⁻³ M in THF solutions. The dichloromethane used in the anhydrous conditions was dried by distillation over CaH2. The analytical grade solvents and commercially available reagents were used without further purification. The ESIMS spectra were recorded on an Agilent Technologies 6120 Quadrupole LC/MS instrument. The analytical and preparative TLC were performed on silica gel plates (Merck, Kieselgel 60, F254, 0.25 and 0.5 mm respectively), and the column chromatography was performed on silica gel (Merck, Kieselgel 60, 0.063–0.200 mm). The 2-aryloxy acids (R)-2-phenoxypropionic acid (2a) and (R)-2-β-naphthoxypropionic acid (2b) were prepared as reported [38]. The biphenylazepines 3ad were prepared as previously described [19,20].

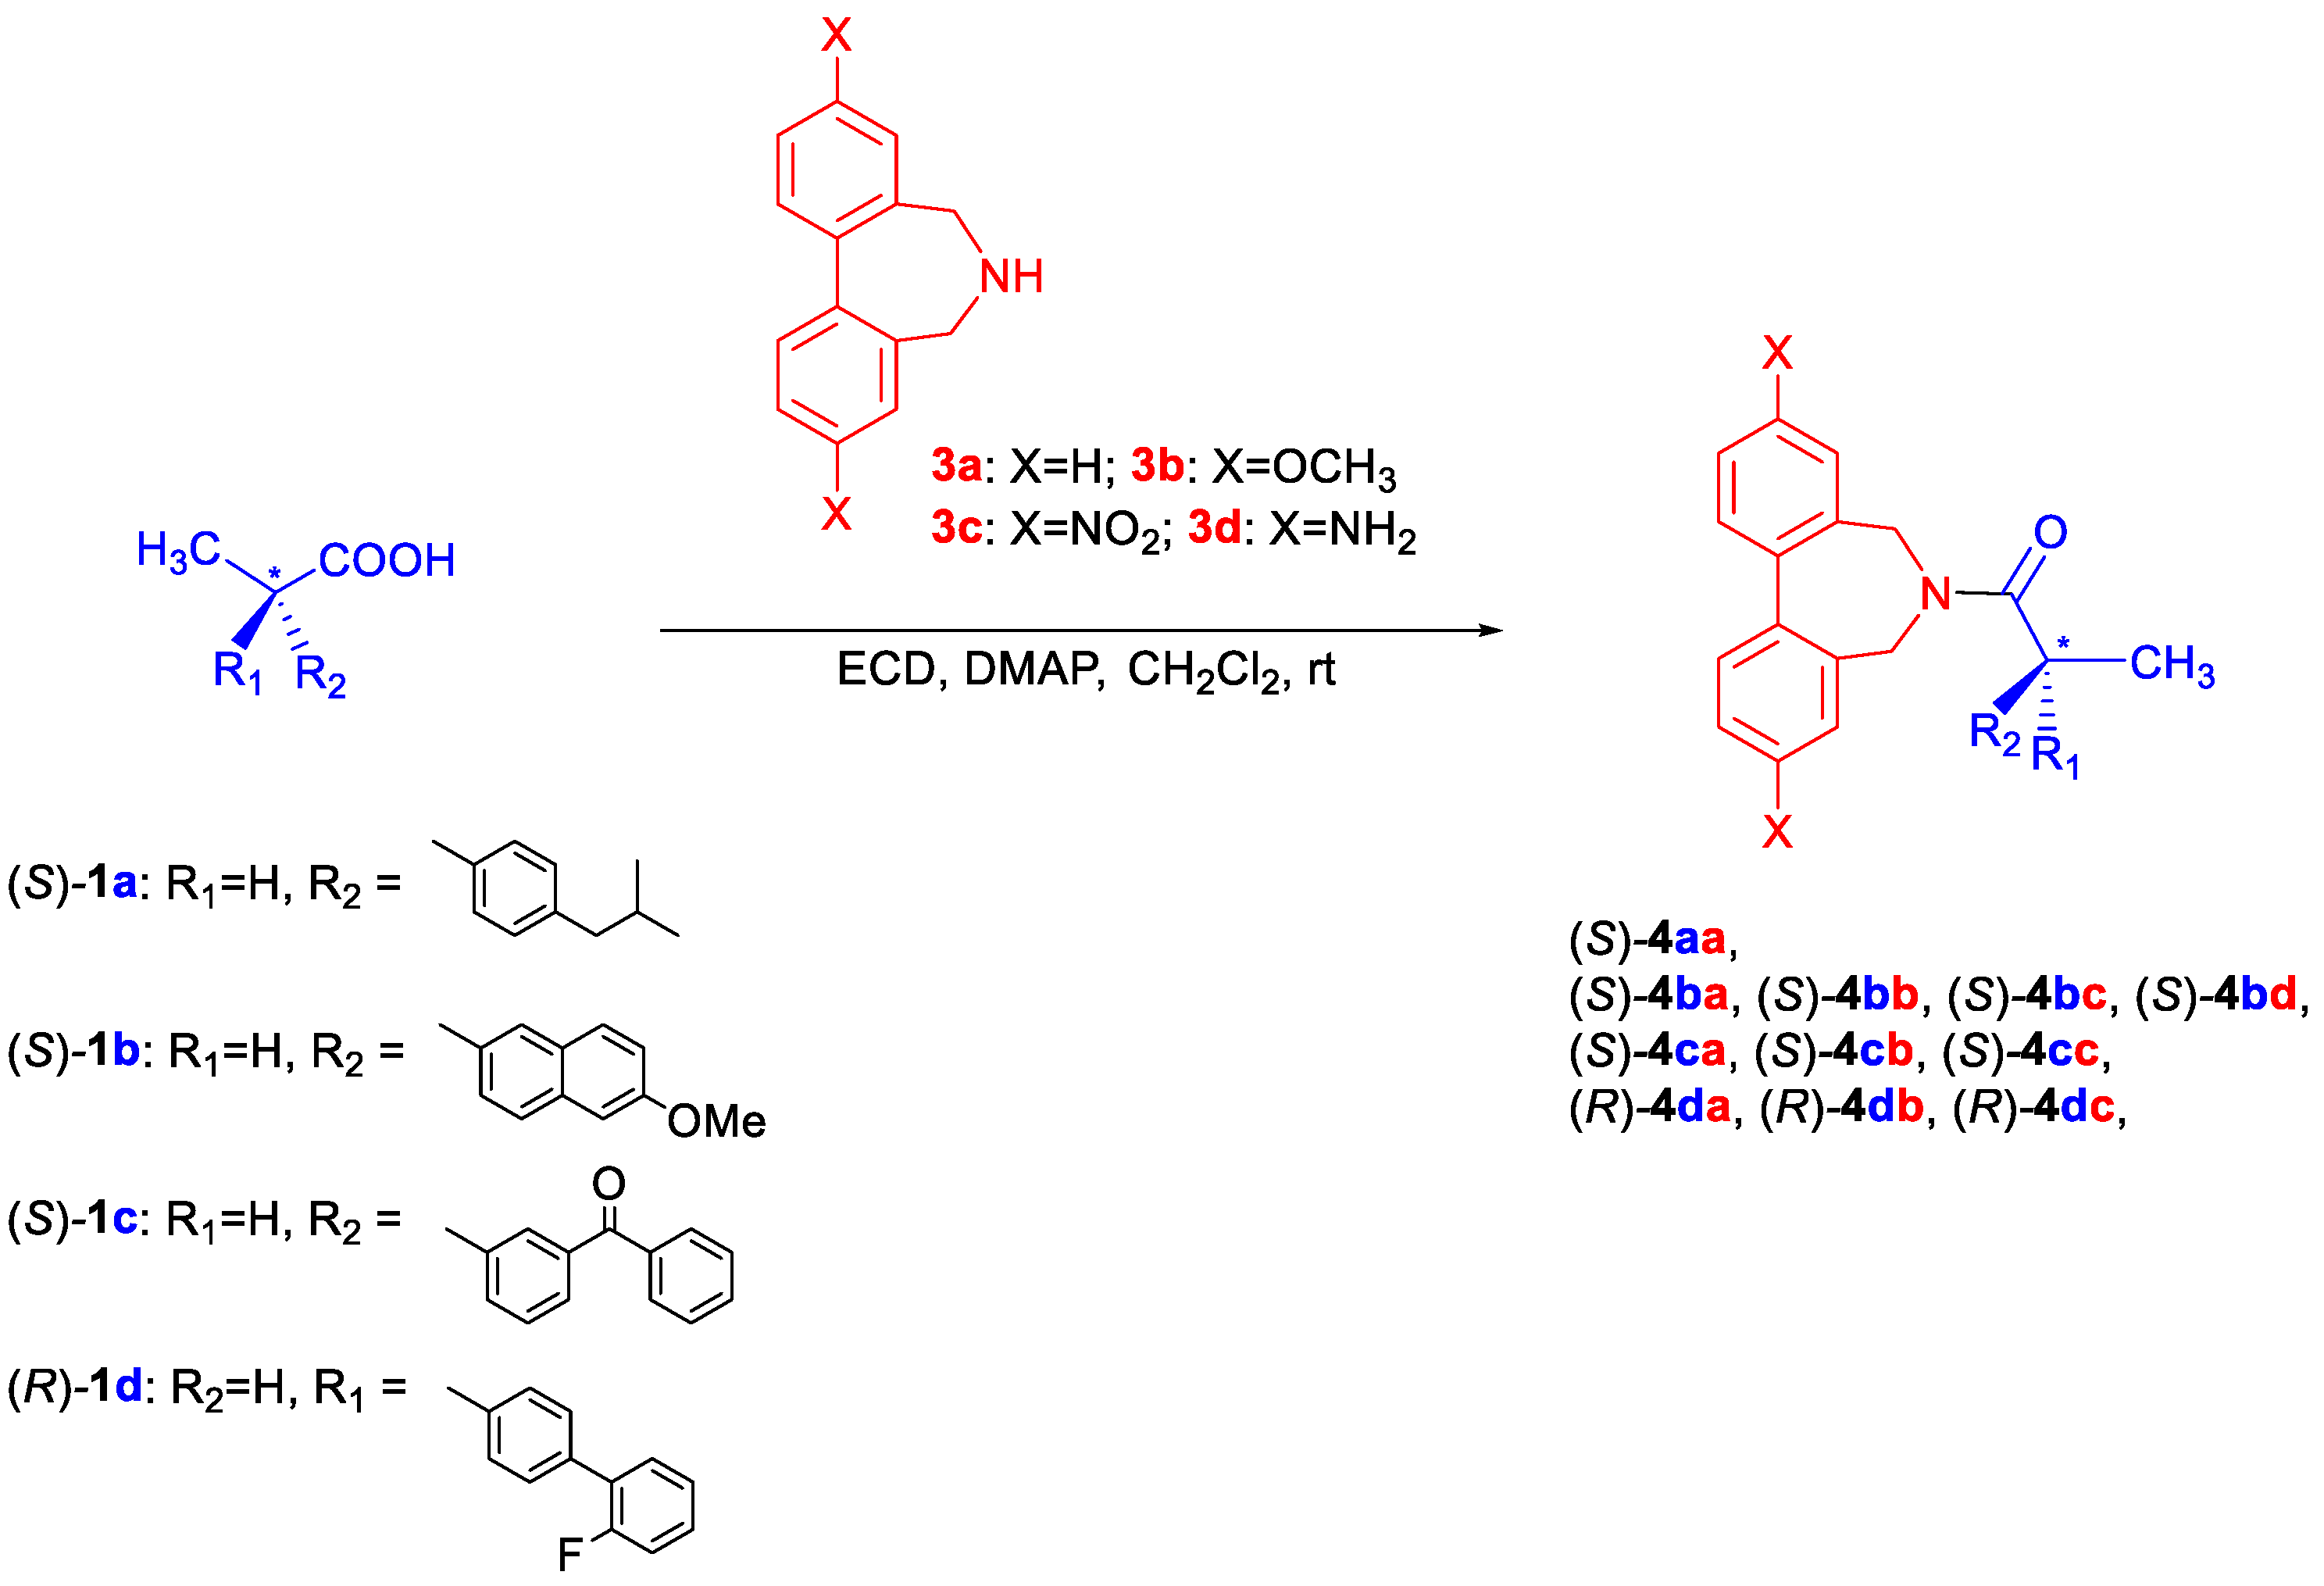
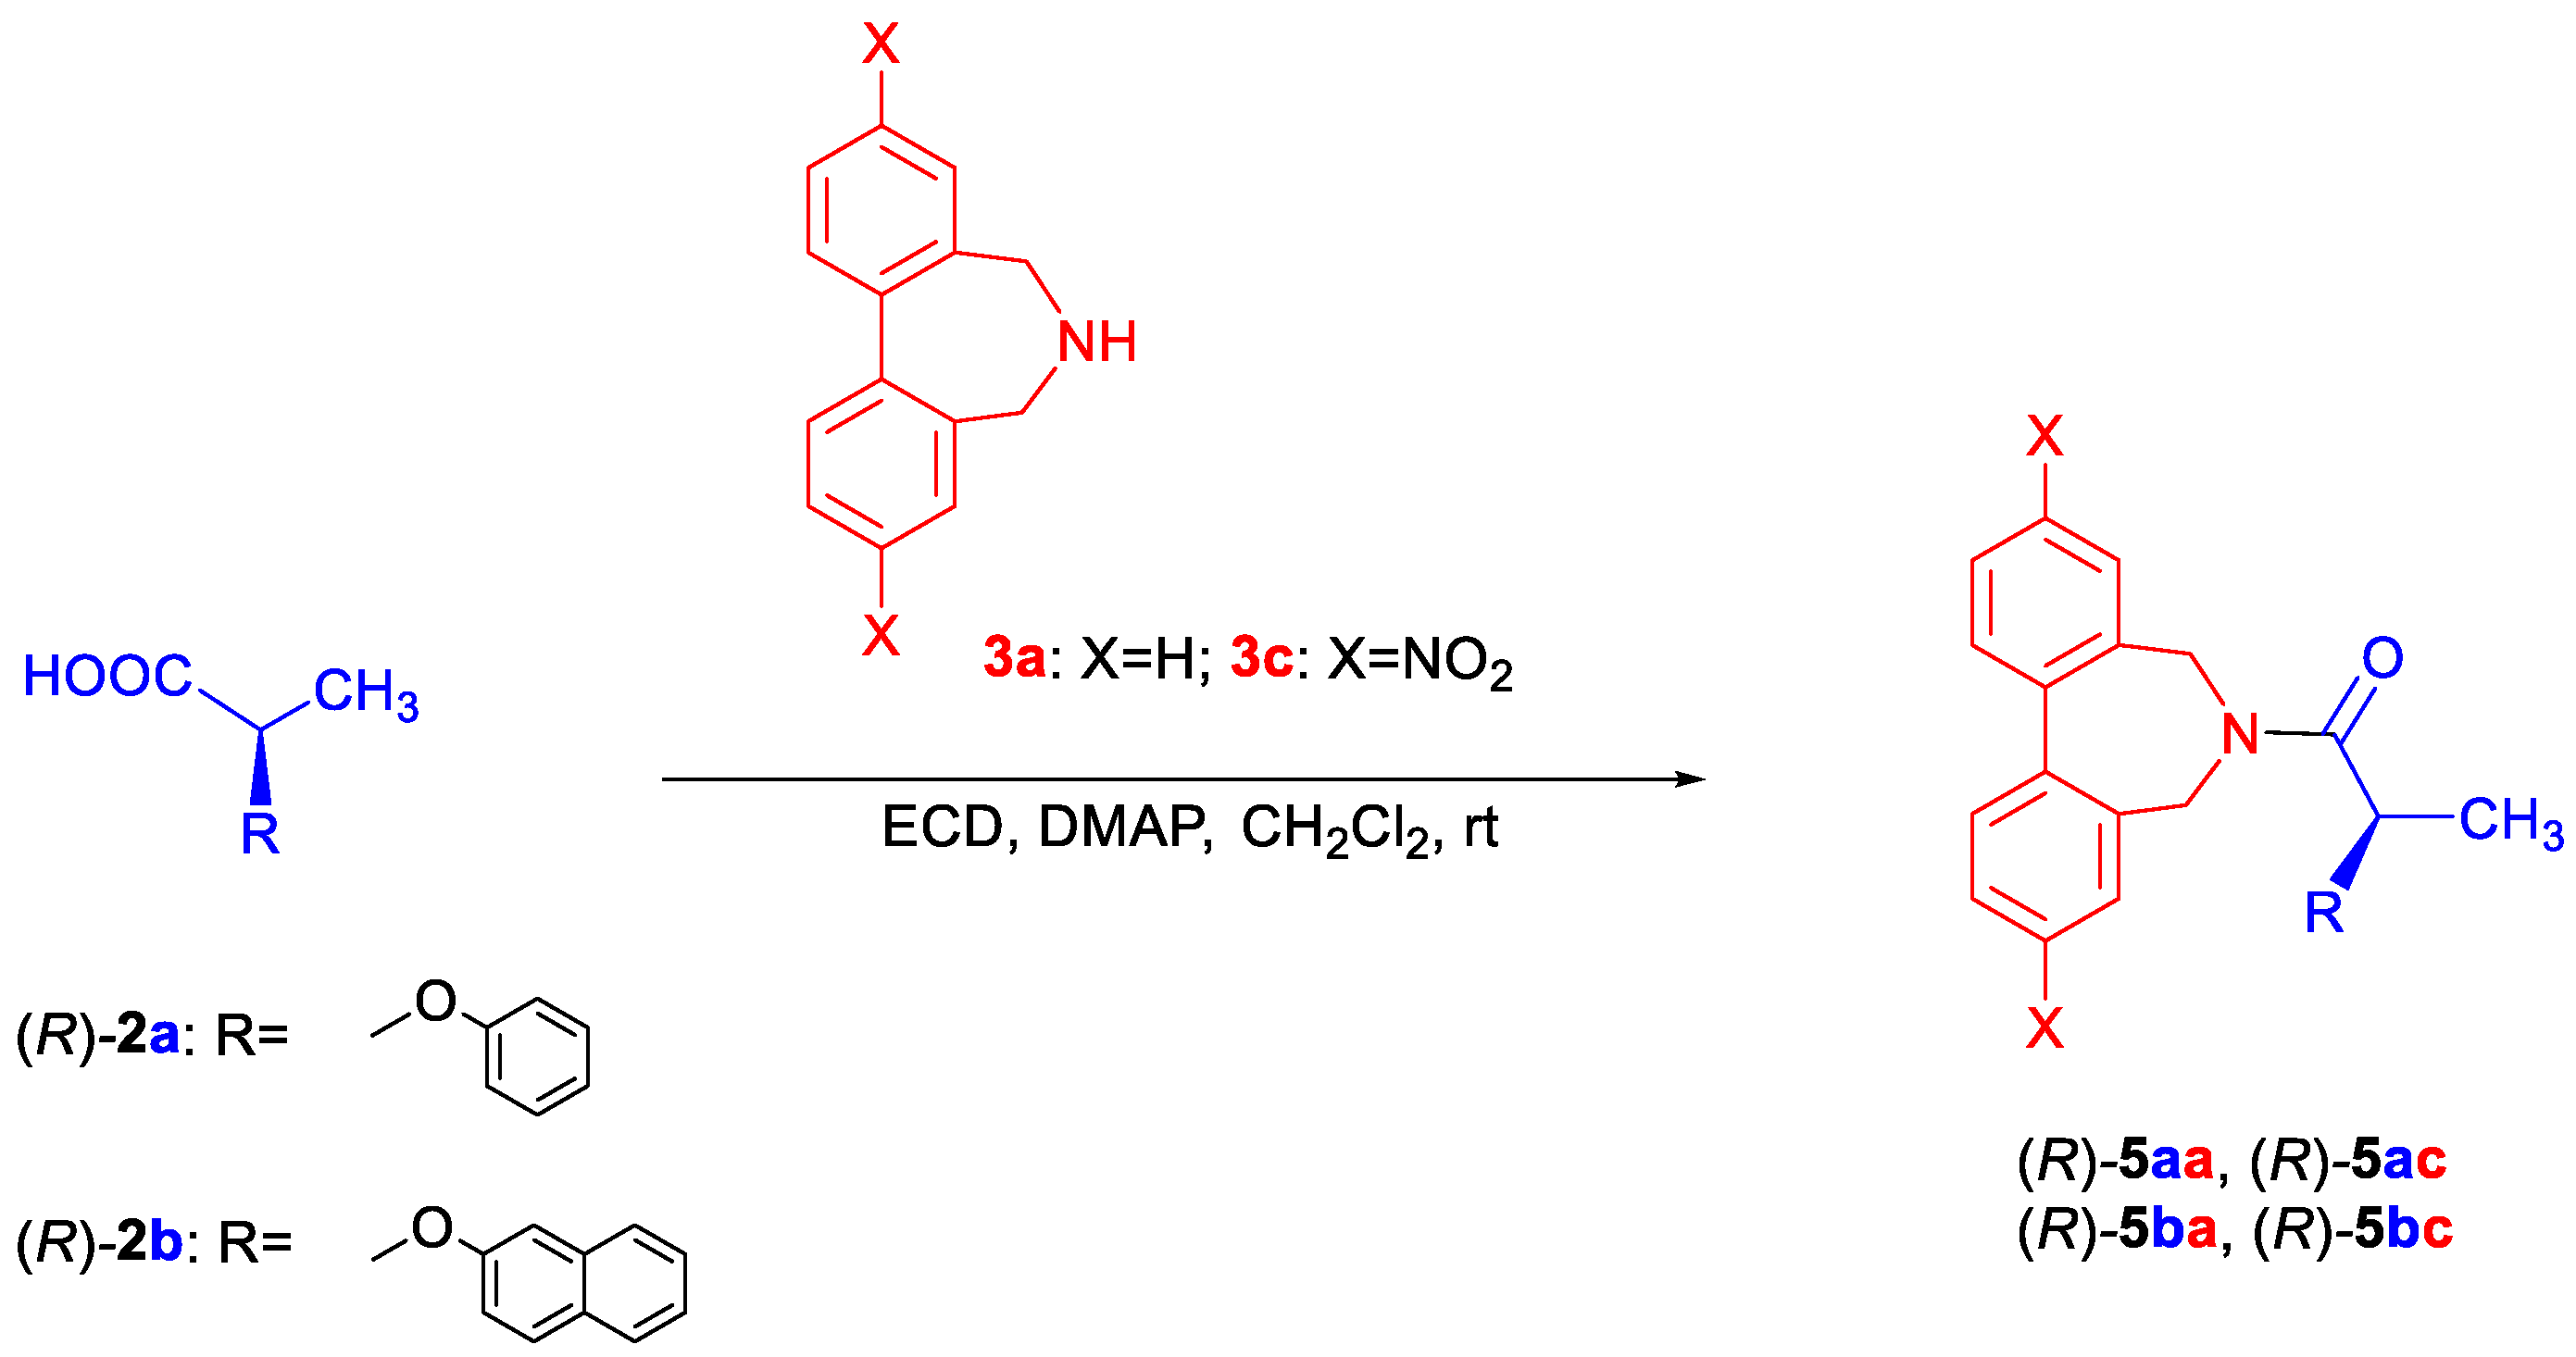
2.2. General Procedure for the Synthesis of Biphenyl Amides 4 and 5

To a solution of the biphenylazepine 3ad (1.25 equiv.) in anhydrous CH2Cl2 were added, in sequence, the optically active acid 1a–d or 2a,b (1 equiv., 0.05 M), 1-[3-(dimethylamino)propyl]-3-ethylcarbodiimide hydrochloride (EDC·HCl) (1.7 equiv.) and DMAP (1 equiv.). The resulting solution was stirred overnight at room temperature, then diluted with CH2Cl2, washed with 10% aqueous NaHCO3 and brine, and dried over anhydrous Na2SO4. After the evaporation of the solvent, the recovered residue was purified by column chromatography.
The optical rotations and 1H NMR and 13C NMR data for biphenylamides 4 and 5 are reported in the Supplementary Materials (SM).

3. Results and Discussion

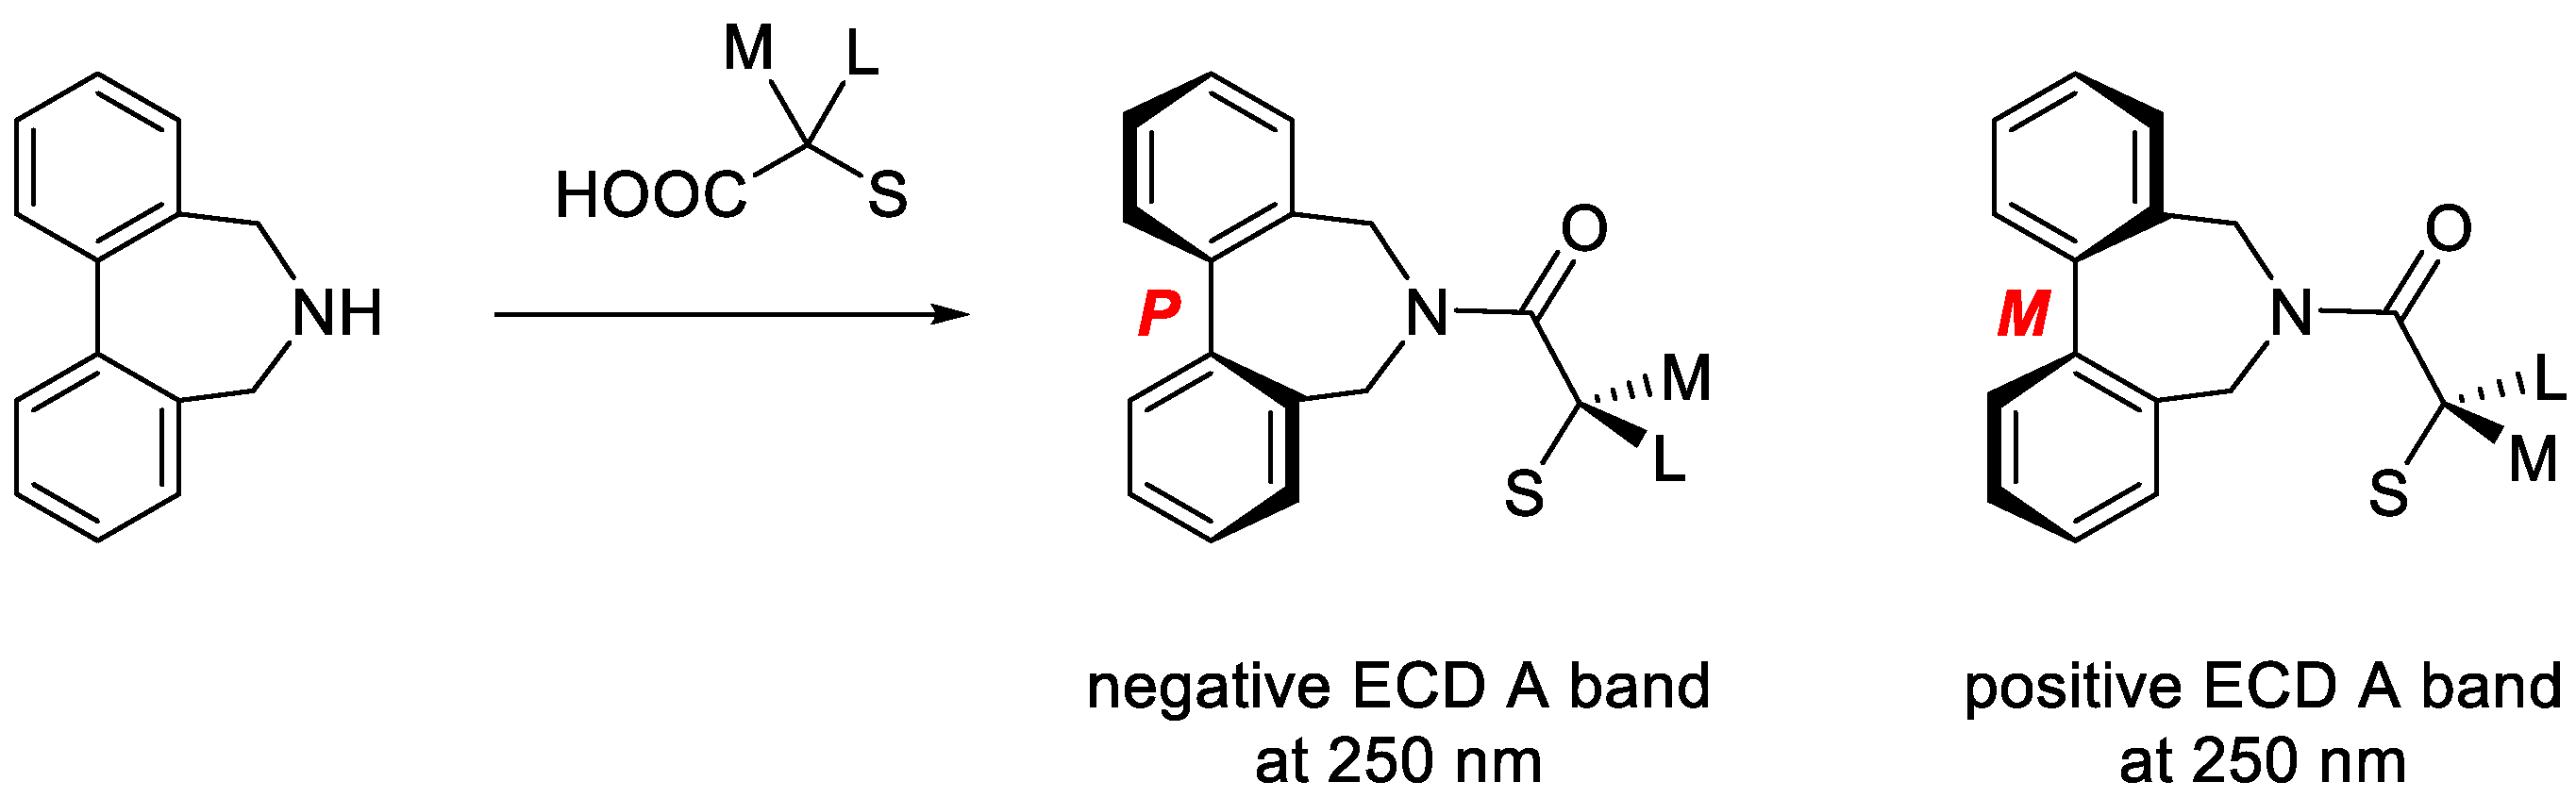
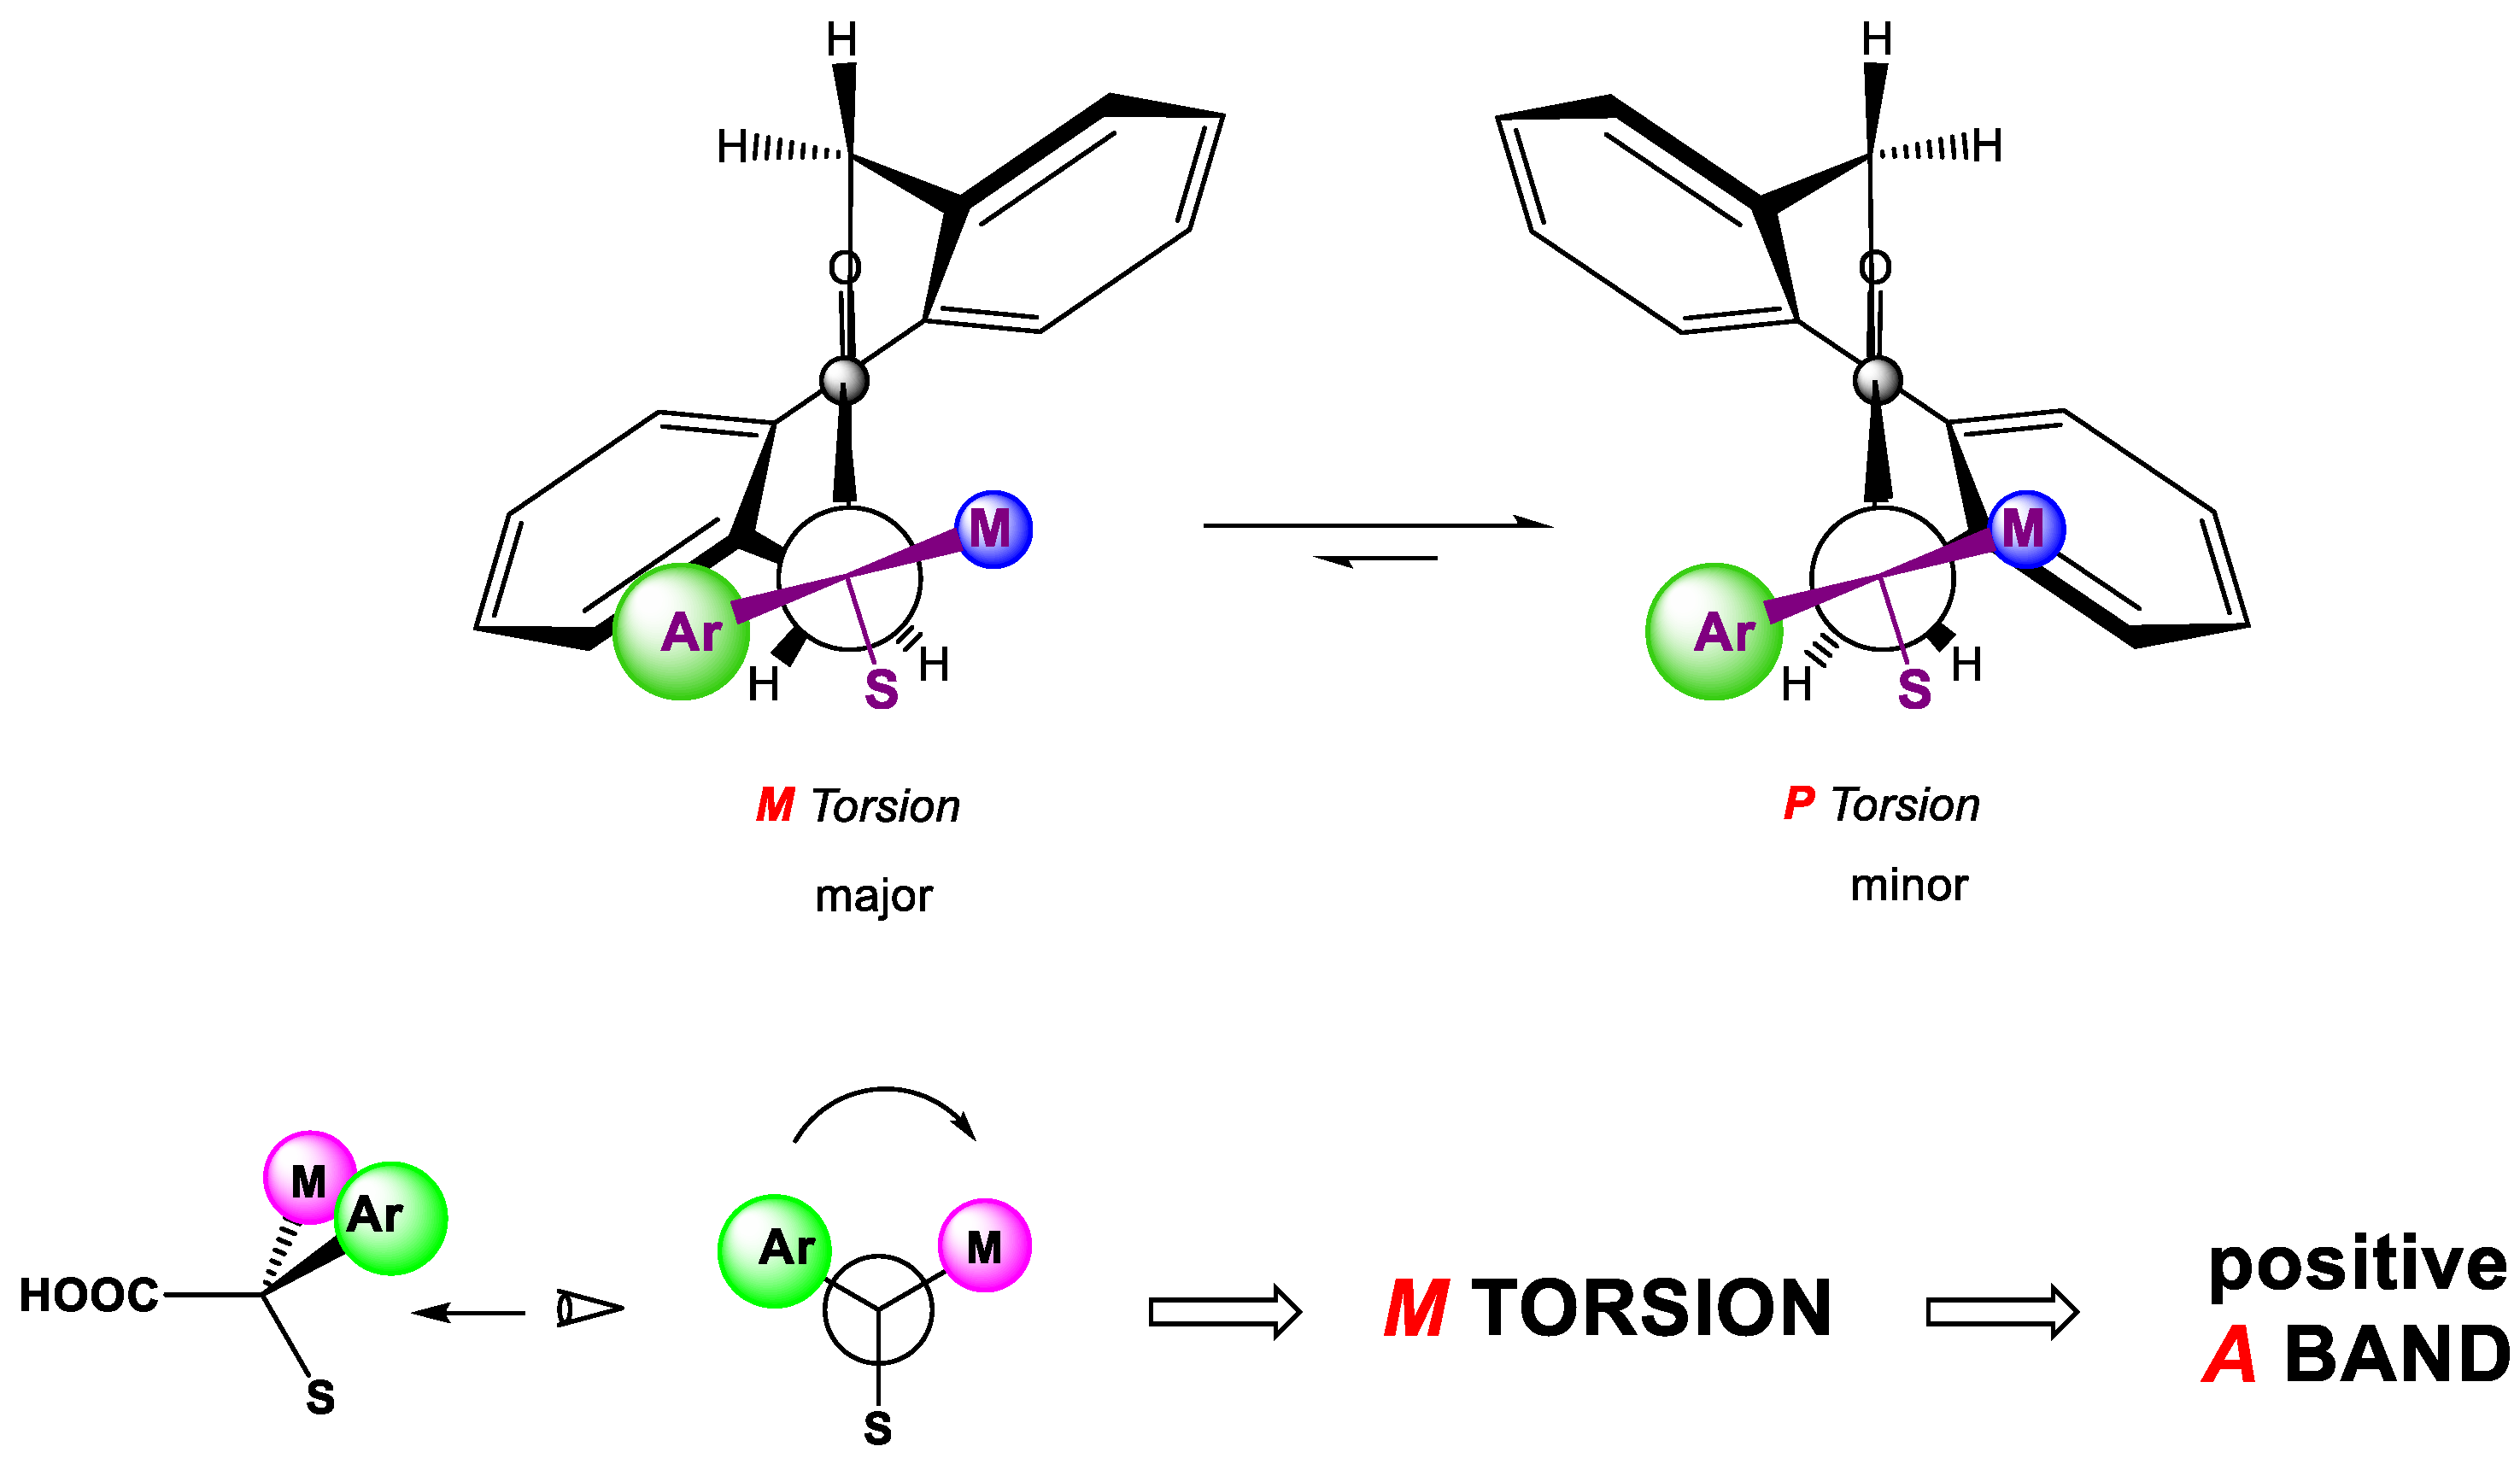
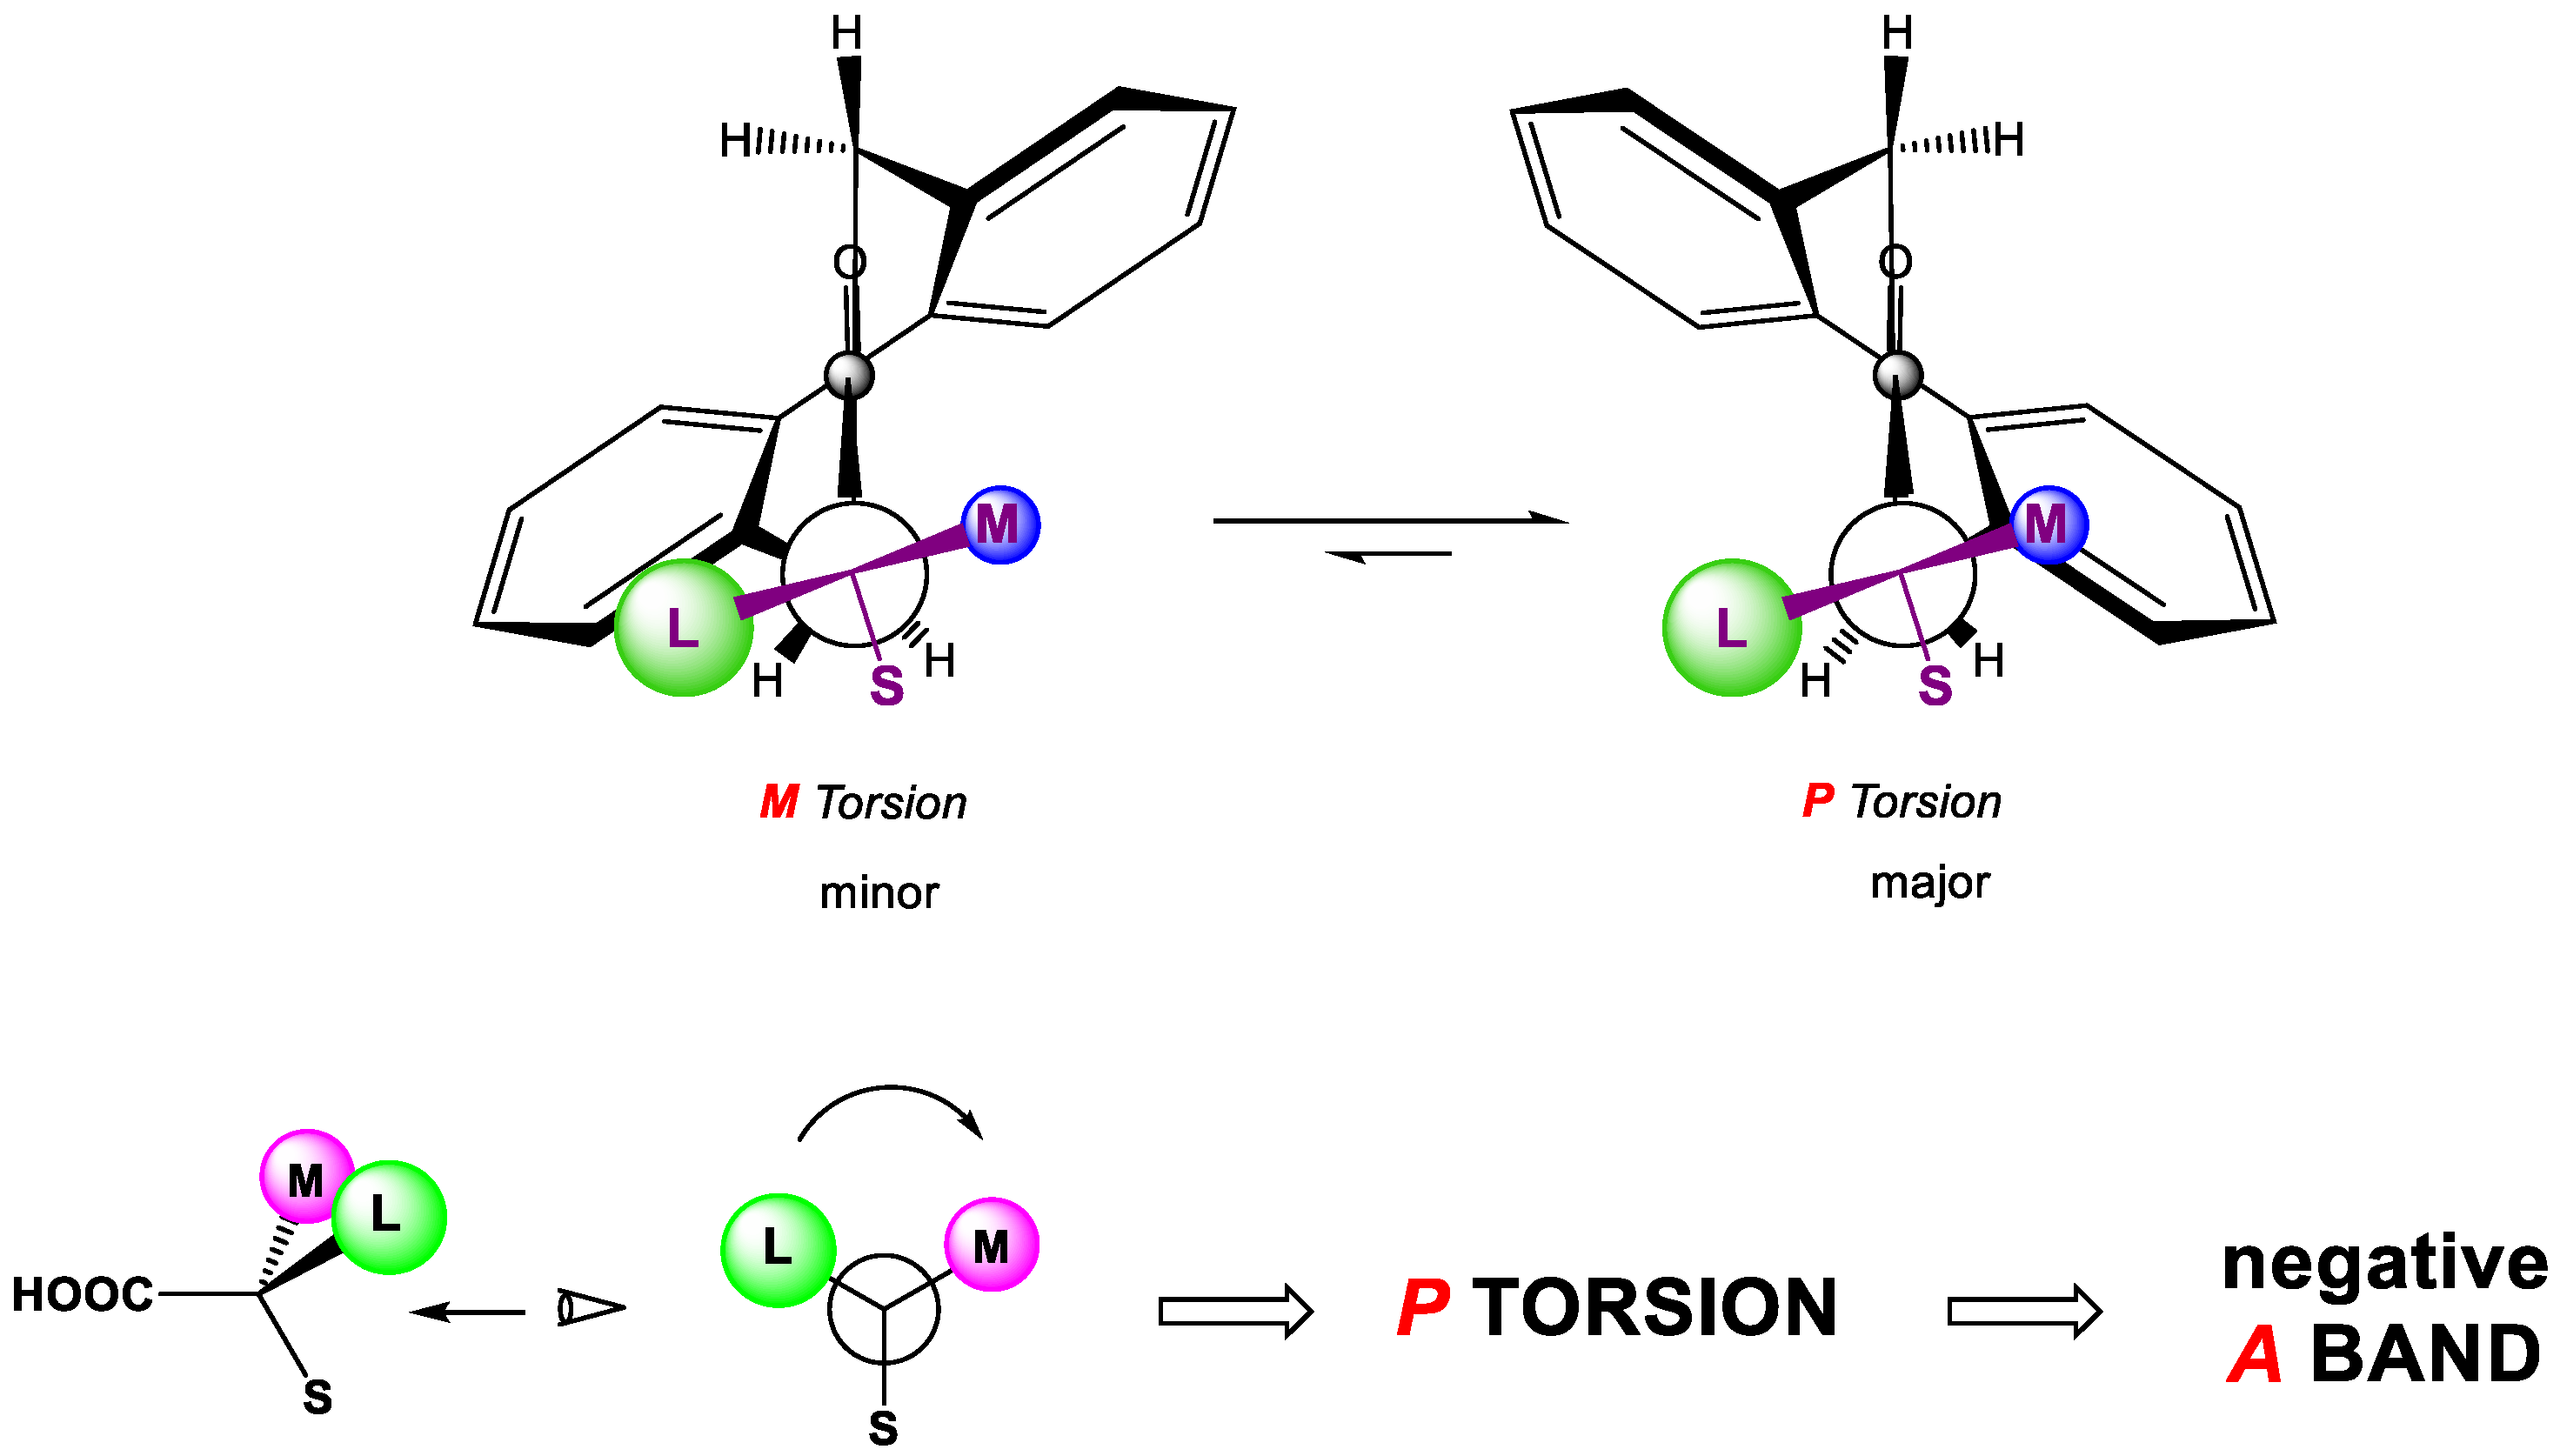
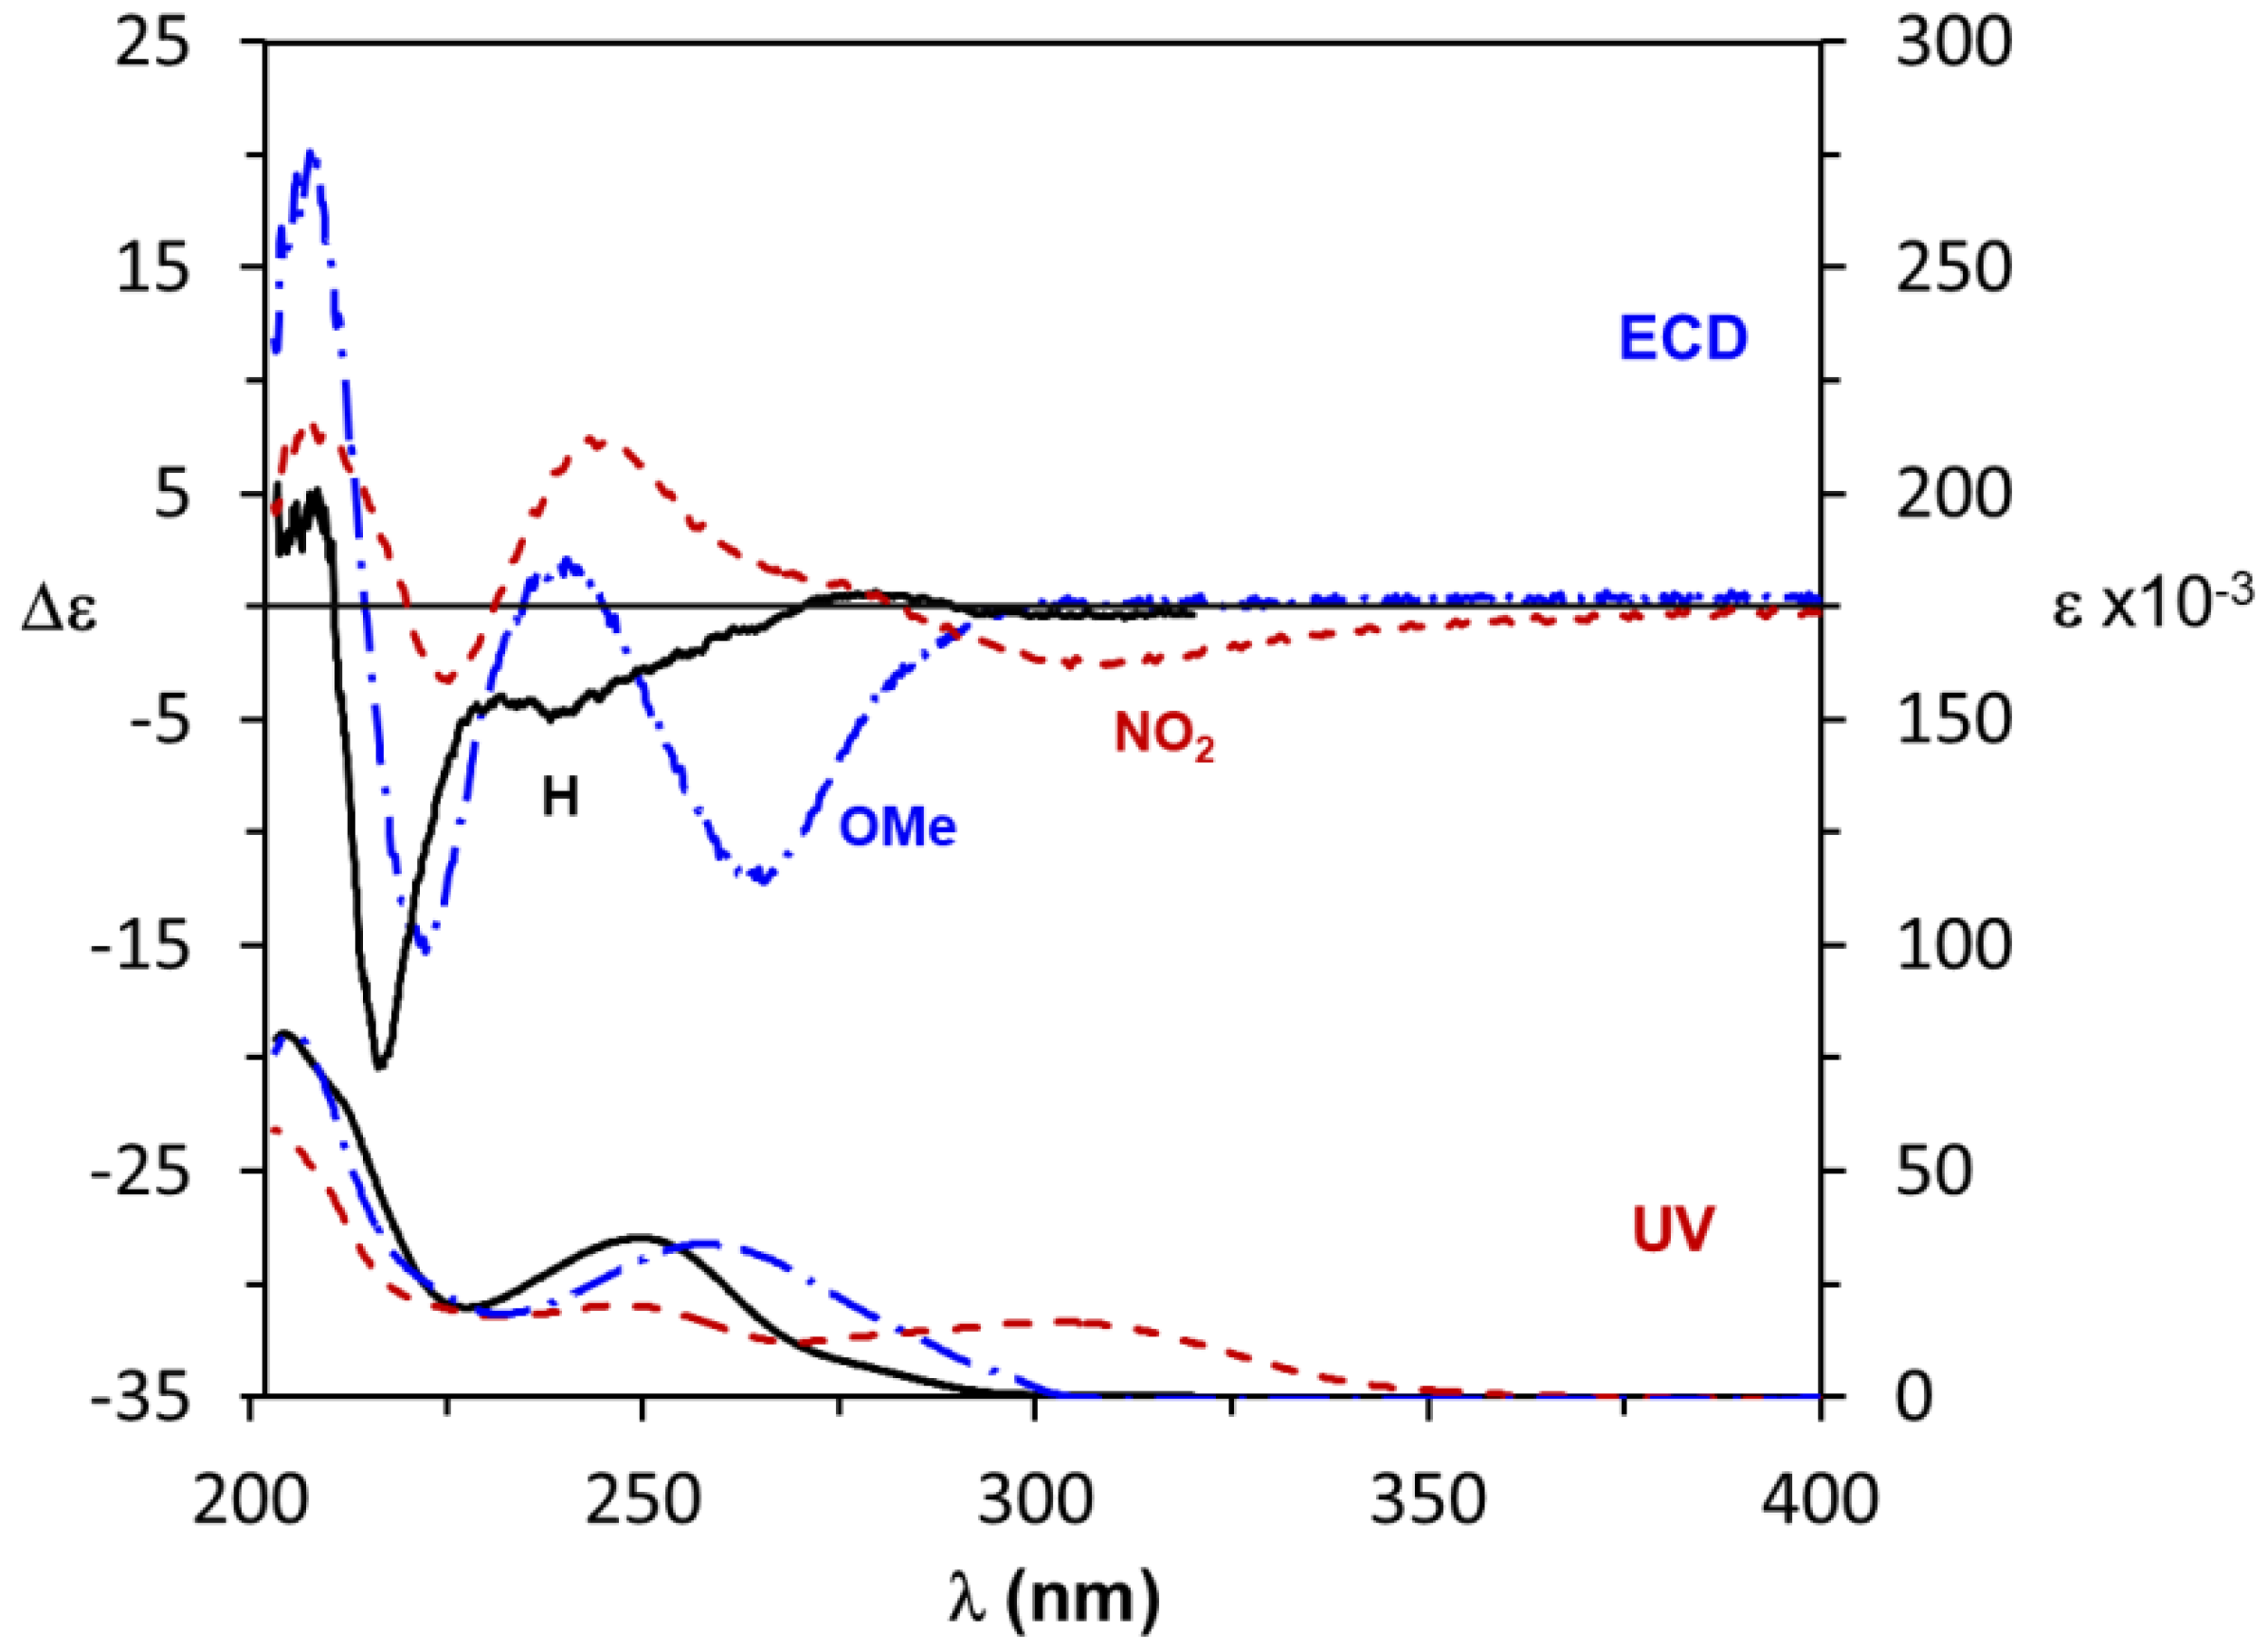
3.1. The Biphenyl Amide Probe

According to the biphenyl chiroptical probe approach, 2-substituted chiral carboxylic acids are transformed into the corresponding biphenylamides (Scheme 1). The pair of diastereomeric amides obtained—with opposite biphenyl twists—are in a thermodynamic equilibrium, and the most stable atropisomer is also the major one.
We demonstrated [19] that, for the absolute configuration depicted in Figure 2, the diastereomer with M torsion is more hindered, and therefore less stable, because it locates the largest group (L) in a more sterically crowded area, and the medium-size group (M) is in a less hindered region [39]. On the contrary, the P diastereomer has the medium-size group (M) closer to the biphenyl aromatic ring and the largest group (L) in a less crowded area, thus being more stable (and thus more abundant) than the M-twisted one [19]. For 2-substituted chiral carboxylic acids, a non-empirical rule was then established in order to determine the absolute configuration by inspecting the sign of the biphenyl A band at ~250 nm in the ECD spectrum of their biphenylamides. According to such rule, a P biphenyl twist is preferred for 2-substituted aliphatic chiral carboxylic acids with absolute configurations such that a clockwise rotation leads from the largest to the medium-size substituent on the acid moiety, and thus a negative A band is expected at around 250 nm in the ECD spectrum of the corresponding biphenyl derivatives. Vice versa, an M twist is preferred for a counterclockwise disposition of the substituents, and a positive A band arises in the ECD spectrum (Figure 2).
Notably, the opposite rule holds for 2-aryl-substituted chiral carboxylic acids, for which the most stable conformation is not determined by steric repulsion but by attractive π–π interactions between the aryl substituent and the biphenyl moiety, as clearly revealed by X-ray and 1H NMR analyses [19,40]. Therefore, for 2-aryl substituted acids, the major diastereoisomer is the one with the aryl moiety (Ar) closer to one of the biphenyl rings, and the rule in Figure 3 holds. More recently, by applying suitably designed 4,4′-disubstituted biphenyl azepines as chiroptical probes, we were able to connect the sign of the diagnostic ECD A band to the sign of the OR at the sodium D line, thus opening the way to employ such simpler and routine measurements for the absolute configuration assignment [20].

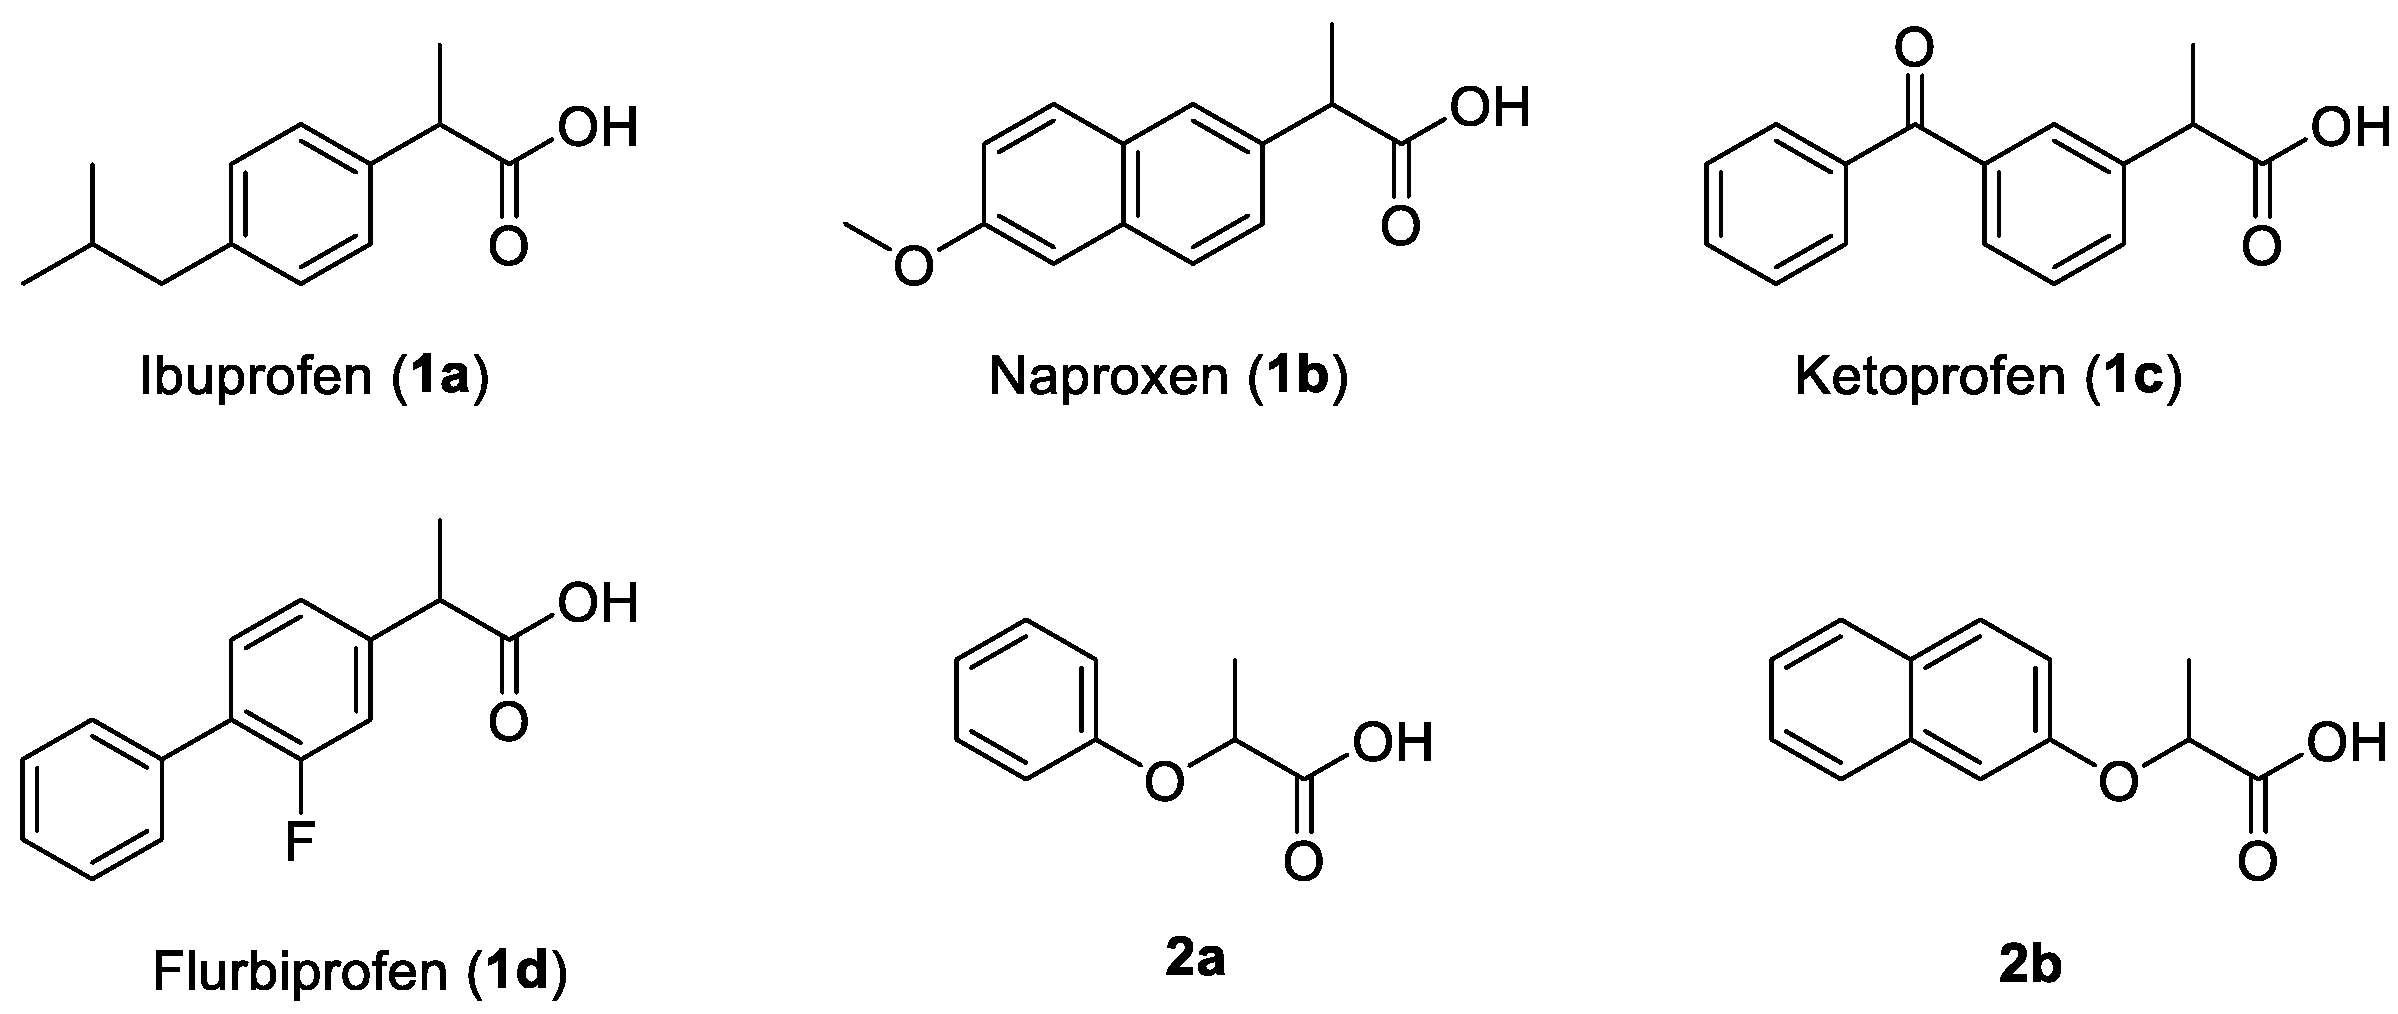
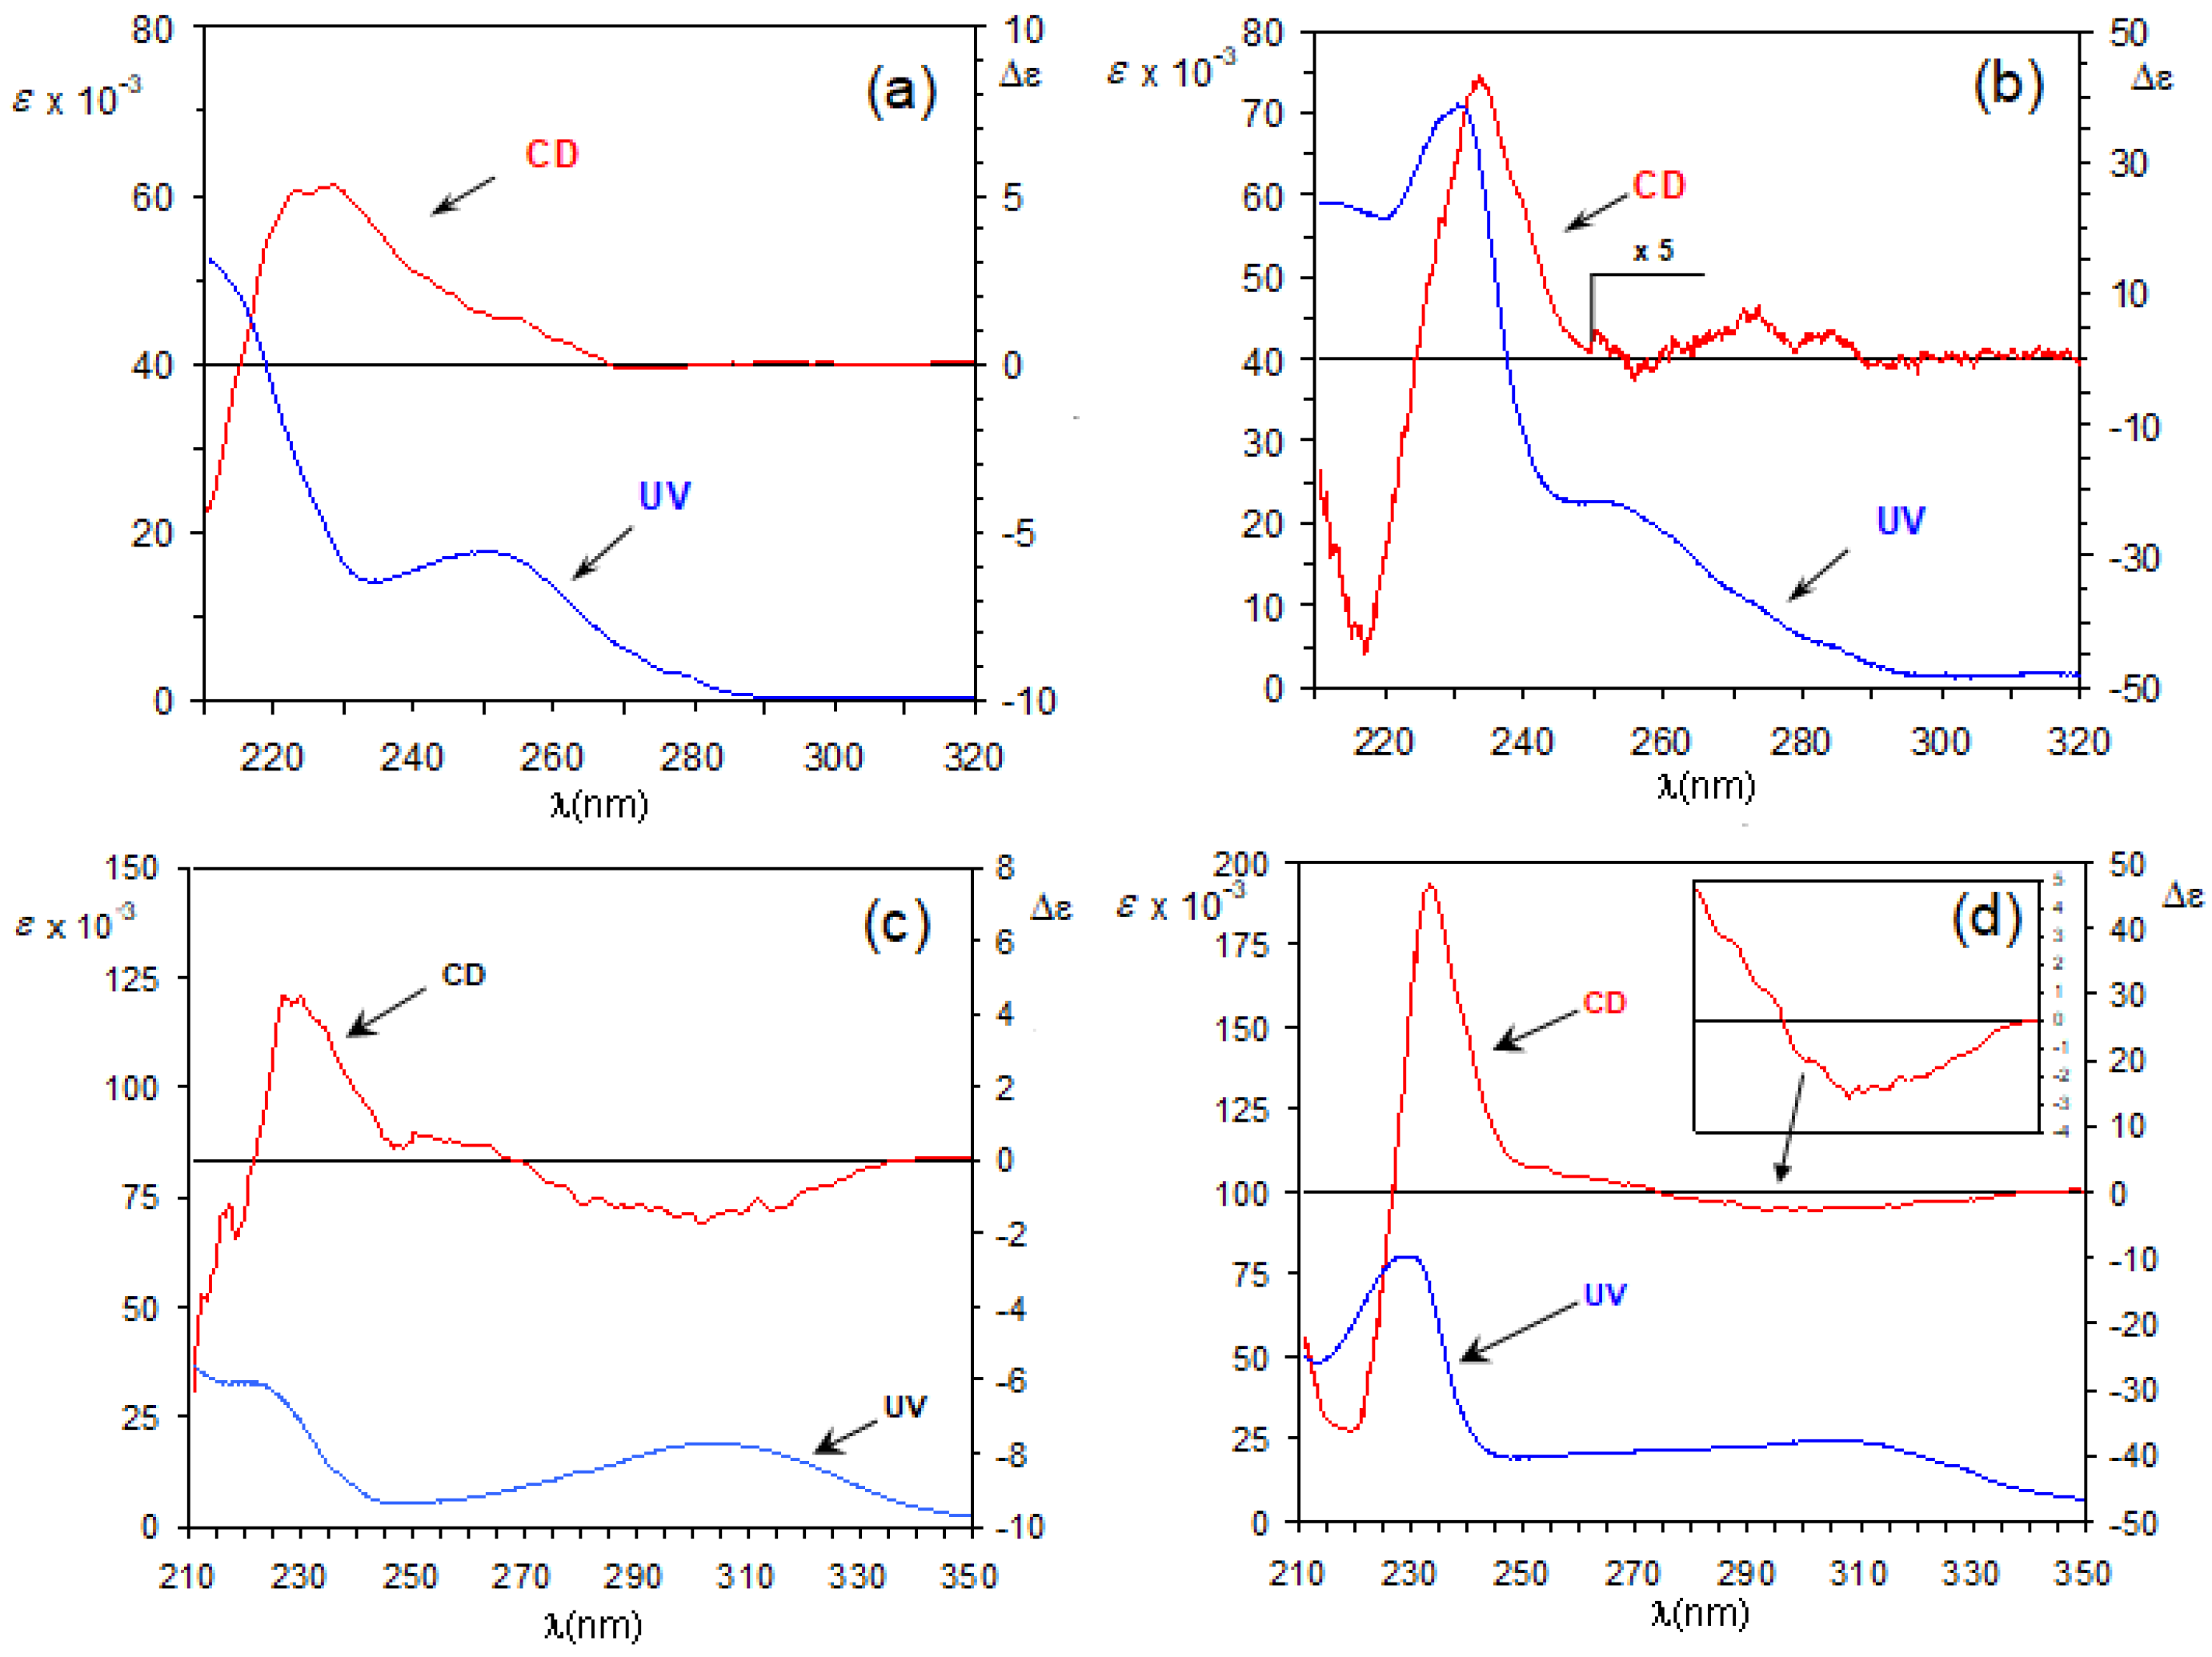
3.2. Assignment of the Absolute Configuration to 2-Arylpropionic Acids

In order to assign the absolute configuration of the arylpropionic acids ibuprofen (1a), naproxen (1b), ketoprofen (1c) and flurbiprofen (1d), the above-described biphenyl chiroptical probe approach was applied by employing, at first, the unsubstituted biphenylazepine 3a as chirality detector. Accordingly, biphenylamides (S)-4aa, (S)-4ba, (S)-4ca, and (R)-4da were prepared from biphenylazepine 3a and the arylpropionic acids (S)-1a, (S)-1b, (S)-1c, and (R)-1d (Scheme 2), and their UV and ECD were recorded in the THF in the 200–320 nm range (Figure 4).
The UV spectrum of amide (S)-4aa, derived from (S)-1a (Figure 4a) displays the typical spectral features of a twisted biphenyl system, with an intense C band at ca 210 nm followed by weaker absorption allied to the biphenyl A band at 250 nm [25]. The ECD spectrum of (S)-4aa (Figure 4a) also fully corresponds to those observed in precedence [19] with both alkyl- and aryl-substituted biphenylamides, clearly showing a visible Cotton effect allied to the A band at about 250 nm. The positive sign of such a Cotton effect is then in agreement with the prediction of the M biphenyl twist expected on the basis of the mnemonic rule in Figure 3 for an (S) configured 2-aryl substituted carboxylic acids like (S)-1a. This result could be an expected result, taking into account that the alkylphenyl chromophore of (S)-1a does not give rise to strong UV absorptions in the A band detection range. On the contrary, the UV spectrum of amide (S)-4ba (Figure 4b), derived from (S)-naproxen (1b), appears to be quite different from that of a typical biphenyl. In fact, we can notice a medium size band at about 210 nm, ascribable to the 1Bb biphenyl long-axis transition, followed by an intense absorption band at ~235 nm due to the long axis-polarized 1Bb transition of the substituted naphthalene chromophore, together with a broader, less intense absorption allied to the overlap of the biphenyl A band at 250 nm with the 1La short-axis polarized transition of the naphthalene located at ~270 nm (Figure 5).
The ECD spectrum of (S)-4ba also appears to be quite different from the typical ones provided by biphenylamides, even aryl-substituted examples [19], because a couplet-like feature provided by two strong and opposite-sign bands is visible between 200 and 240 nm. This can be interpreted as an exciton effect [41] due to the coupling between the 1Bb long-axis biphenyl transition at 200 nm and the 1Bb naphthalene one at 235 nm (Figure 5). At 250 nm is present, instead, a broader band that could be ascribed to the diagnostic biphenyl A band. Even if the sign of such a band corresponds to the one predicted by the mnemonic scheme in Figure 3, the unusual spectral shape does not allow a reliable spectral interpretation or absolute configuration assignment. A similar problem is encountered in the case of amide (S)-4ca, derived from (S)-ketoprofen (1c). In fact, the diphenylketone chromophore of 1c presents a somewhat intense transition at ~250 nm (Figure 5), which fully overlaps with the biphenyl A band (Figure 4c). Also in this case, the ECD spectrum is very different in shape from the typical situation shown by (S)-4aa, preventing any reliable spectral and absolute configuration assignment. Finally, in (R)-4da, from (R)-flurbiprofen (1d), two almost identical biphenyl chromophoric systems are present on the molecular backbone, giving rise to complex exciton coupling effects [41] allied to their long-axis polarized transitions (C band at 200 nm and A band at 250 nm, see Figure 5) in both the UV the ECD spectra. Such complex spectral features completely mask the main spectral bands of the biphenyl probe employed for the configurational assignment, preventing any reliable interpretation. In fact, the ECD spectrum of (R)-4da shows, in correspondence to the UV A band absorption, a weak shoulder which does not allow a clear absolute configuration assignment.
These results clearly show that the use of the simple unsubstituted biphenyl chiroptical probe 3a appears to be unsuitable to provide a reliable configurational assignment in the case of those propionic acids with aryl chromophoric moieties giving rise to intense electronic transitions in the 200–300 nm range, and then overlapping to the diagnostic biphenyl A band. We envisaged that a possible solution could be obtained by employing, as chiroptical probes, suitably designed biphenyl azepines 4,4′-disubstituted with groups extending the electron conjugation which, as we have recently shown, give rise to a red shift of the A band absorption, avoiding the above spectral overlap problems [20]. In particular, the 4,4′-dimethoxy substitution red-shifts the A band’s maximum absorption by about 20 nm, the 4,4′-diamino by about 50 nm, and the 4,4′-dinitro by about 70 nm. A corresponding ECD band red shift is accordingly observed.
Therefore, the 4,4′-disubstituted biphenylazepines 3b-d were prepared as previously described [20] and employed to obtain the corresponding biphenylamides from arylpropionic acids (S)-1b, (S)-1c, and (R)-1d (Scheme 2). As inferred from the UV and ECD spectra of amides (S)-4ba, (S)-4bb, (S)-4bc, and (S)-4bd (Figure 6), derived from naproxen (S)-1b and the four biphenylazepines 3ad, the presence of 4,4′-substituents on the biphenyl moiety of the azepines 3bd gives rise to a sharp bathochromic shift of the A biphenyl band both in the UV and in the ECD spectrum, which is larger in the case of the 4,4′-dinitro substituted probe 3c (Table 1). The other ECD and UV bands, mainly allied to the naphthalene chromophore, are instead left substantially unchanged in position. This effect allows them to remove the spectral overlap between the diagnostic A band and the remaining spectral features, leading to its clear detection and providing a reliable assessment of its sign. In fact, the positive sign of such a band is now perfectly in agreement with the prediction of the rule in Figure 3 for an (S)-configured 2-aryl substituted carboxylic acid like (S)-1b.
In a similar way, looking at the UV and ECD spectra of amides (S)-4ca, (S)-4cb, and (S)-4cc (Figure 7), derived from ketoprofen (S)-1c and the three biphenylazepines 3a–c, we can clearly notice the same red-shift effect of the biphenyl A band, visible both in the UV and ECD spectra. Again, such bathochromic shift, larger with the dinitro substituted azepine 3c (Table 1), means that the A band signal is completely free from other possible spectral overlap, allowing its clear detection and sign assessment. Its positive sign confirms the prediction of an M biphenyl twist expected on the basis of the rule in Figure 3 for an (S)-configured 2-aryl substituted carboxylic acid like (S)-1c.
Finally, we investigated the case of amide (R)-4da, (R)-4db, and (R)-4dc, derived from flurbiprofen (R)-1d and the three biphenylazepines 3a–c. The UV and ECD spectra of the amide (R)-4da-dc (Figure 8) confirm the spectral red-shift of the A band signal which, in the case of the 4,4′-dinitro derivative 3d, appears at ca 310 nm and is then fully free of any other spectral overlap. This allows the clear and reliable detection of the A band sign which, being negative, fully agrees with the prediction in Figure 3 for an (R)-configured 2-aryl substituted carboxylic acid like (R)-1d. The use of suitably designed 4,4′-disubstituted biphenylazepines as chiroptical probes thus allows the bathochromic shift in the UV and ECD spectra of the biphenyl A band, employed as a reporter of the absolute configuration of chiral arylpropionic acids, with the best outcome in the case of the 4,4′-dinitro substituted derivative 3c. In this way, any spectral overlap due to the aromatic moiety of the substrate is removed and the band sign can be clearly and reliably assigned.
Interestingly, as inferred from Table 1, in all of the substituted biphenylamides, the [α]D sign is always in accordance with the sign of the A band Cotton effect in the ECD spectrum. As already shown in our previous studies [20], this opens the way to the use of the simpler OR measurements for the assignment of the absolute configuration of arylpropionic acids, thus widening the scope of the method and allowing the online detection of the molecular absolute configuration.

3.3. Assignment of the Absolute Configuration to 2-Aryloxypropionic Acids

Finally, the same approach was applied to the assignment of the absolute configuration to 2-aryloxypropionic acids. Accordingly, biphenylamides (R)-5aa and (R)-5ba were prepared from the biphenylazepine 3a and aryloxypropionic acids (R)-2a and (R)-2b (Scheme 3), respectively, and their UV and ECD were recorded in THF in the 210–320 nm range (Figure 9a,b).
First of all, the presence of π–π* interactions between the aryl moieties of the acid and the biphenyl moieties was verified in (R)-5aa and (R)-5ba by 1H NMR analysis. In fact, such interactions are clearly revealed by the strong upfield shift of one of the proton signals of the biphenyl moiety [19]. As inferred from the 1H NMR spectra (see Supplementary Materials), these interactions are not present in either (R)-5aa or (R)-5ba, whereas they are clearly observed in all of the amides derived from 2-arylpropionic acids, as also shown in a previous study on 2-aryl-substituted acids [19]. In amides derived from 2-aryloxypropionic acids, the conformational preference is then dictated by steric interactions, and the mnemonic rule reported in Figure 2 for 2-alkyl-substituted acids must be employed. This is also in agreement with what was observed before for the structurally similar 2-benzyl substituted acids [19], which follow the “alkyl rule”. The UV spectrum of amide (R)-5aa, derived from (R)-2a (Figure 9a), displays the typical features of the biphenyl chromophore, with a strong band at ca 210 nm and a weaker one at 250 nm corresponding to the biphenyl A band [25]. The ECD spectrum of (R)-5aa (Figure 9a) shows a couplet-like feature centered at about 220 nm, but it does not allow a clear detection of the diagnostic A band because this is overlapped by the signals of the phenoxy chromophore. On the other hand, the UV spectrum of amide (R)-5ba (Figure 9b) appears to be dominated by the naphthalene chromophore absorption, and consequently, in the ECD spectrum, the diagnostic A band is completely missing, preventing any configurational assignment. Therefore, in this case too, the employment of 4,4′-disubstitued biphenyl probes to remove the spectral overlap through the red-shift of the A band signal was necessary.
Then, amides (R)-5ac and (R)-5bc were prepared from the 4,4′-dinitro-substituted azepine 3c, and their UV and ECD were recorded in THF in the 210–320 nm range (Figure 9c,d). As inferred from Figure 9c, the 4,4′-dinitro substitution of the azepine gives rise to a strong red shift of the A band in both the UV and ECD spectra of (R)-5ac, which now appears at about 305 nm. This makes such a band completely free from any overlap, allowing its clear detection. The ECD A band is negative in sign, revealing a P twist of the biphenyl. This implies that, in the mnemonic scheme in Figure 2, the phenoxy substituent has a larger size than the methyl group. Such a substituent size scale disagrees with that on the basis of the A-values [39], while it is in full agreement with the more recent steric scale based on computed ligand repulsive energies [42]. In fact, the latter scale takes into account only steric effects, while experimentally based measures like A-values show a mix of steric and electronic effects, which can give rise to incorrect results in the case of the heteroatom-based substituents like the aryloxy ones.
In the 2-napthoxy biphenylamide (R)-5bc derived from azepine 3c as well, the A band is strongly red shifted both in the UV and ECD spectrum (Figure 9d), and is thus clearly detectable. Its negative ECD sign reveals, again, a P biphenyl twist, which is in agreement with the predictions of the “alkyl” rule in Figure 2.

4. Conclusions

In conclusion, we have shown that the use of suitably designed 4,4′-disubstituted biphenyl probes allows the detection and sensing, by either ECD spectroscopy or OR measurements, of the absolute configuration of chiral 2-aryl and 2-aryloxy propionic acids, which are among the most common chiral environmental pollutants. In fact, the 4,4′-biphenyl substitution gives rise to a red shift of the diagnostic ECD signal of the biphenyl A band, which is employed for the configuration assignment, removing its overlap with other interfering dichroic bands and allowing its clear sign identification. The larger A band red shift, and thus the most reliable results, are obtained by employing the 4,4′-dinitro substituted biphenylazepine 3c as probe. Notably, the possibility to reveal the acid’s absolute configuration by simple OR measurements opens the way to online analyses, and to the simultaneous enantiomer separation and absolute configuration determination by chiral HPLC coupled with OR detectors.

Supplementary Materials

The following are available online at https://www.mdpi.com/article/10.3390/chemosensors9070154/s1, experimental procedures, characterization data, and 1H and 13C NMR spectra. Figure S1: NMR spectra of 4ba, Figure S2: NMR spectra of 4bb, Figure S3: NMR spectra of 4bc, Figure S4: NMR spectra of 4bd, Figure S5: NMR spectra of 4ca, Figure S6: NMR spectra of 4cb, Figure S7: NMR spectra of 4cc, Figure S8: NMR spectra of 4da, Figure S9: NMR spectra of 4db, Figure S10: NMR spectra of 4dc, Figure S11: NMR spectra of 5aa, Figure S12: NMR spectra of 5ba, Figure S13: NMR spectra of 5ac, Figure S14 NMR spectra of 5bc.

Author Contributions

Conceptualization, S.S.; methodology, S.S., S.V., S.O., P.S. and S.B.; investigation, S.V., S.O. and P.S.; data curation, S.V., S.O. and P.S.; writing—original draft preparation, S.S.; writing—review and editing, S.S., S.V. and S.B.; supervision, S.S.; funding acquisition, S.S. All authors have read and agreed to the published version of the manuscript.

Funding

This research was funded by the Italian Ministry of Education, University and Research (MIUR) by Project PON RI 2014-2020 BIOFEEDSTOCK, grant number ARS01_00985.

Institutional Review Board Statement

Not applicable.

Informed Consent Statement

Not applicable.

Data Availability Statement

Not applicable.

Conflicts of Interest

The authors declare no conflict of interest.

References and Note

  1. Finefield, J.M.; Sherman, D.H.; Kreitman, M.; Williams, R.M. Enantiomeric Natural Products: Occurrence and Biogenesis. Angew. Chem. Int. Ed. 2012, 51, 4802–4836. [Google Scholar] [CrossRef] [PubMed] [Green Version]
  2. Lin, G.-Q.; You, Q.-D.; Cheng, J.-F. (Eds.) Chiral Drugs: Chemistry and Biological Action; John Wiley & Sons, Inc.: Hoboken, NJ, USA, 2011; ISBN 9781118075647. [Google Scholar]
  3. Francotte, E.; Lindner, W. (Eds.) Chirality in Drug Research, 1st ed.; Wiley: Hoboken, NJ, USA, 2006; Volume 33, ISBN 9783527310760. [Google Scholar]
  4. Brenna, E.; Fuganti, C.; Serra, S. Enantioselective Perception of Chiral Odorants. Tetrahedron Asymmetry 2003, 14, 1–42. [Google Scholar] [CrossRef]
  5. Engel, K.-H. Chirality: An Important Phenomenon Regarding Biosynthesis, Perception, and Authenticity of Flavor Compounds. J. Agric. Food Chem. 2020, 68, 10265–10274. [Google Scholar] [CrossRef] [PubMed]
  6. Jeschke, P. Current Status of Chirality in Agrochemicals: Chirality in Agrochemicals. Pest. Manag. Sci. 2018, 74, 2389–2404. [Google Scholar] [CrossRef]
  7. Maia, A.S.; Ribeiro, A.R.; Castro, P.M.L.; Tiritan, M.E. Chiral Analysis of Pesticides and Drugs of Environmental Concern: Biodegradation and Enantiomeric Fraction. Symmetry 2017, 9, 196. [Google Scholar] [CrossRef] [Green Version]
  8. Wong, C.S. Environmental fate processes and biochemical transformations of chiral emerging organic pollutants. Anal. Bioanal. Chem. 2006, 386, 544–558. [Google Scholar] [CrossRef]
  9. Edwards, A.; Jenkinson, S. 8.3 Perspective and Concepts: Overview of Techniques for Assigning Stereochemistry. In Comprehensive Chirality; Elsevier: Amsterdam, The Netherlands, 2012; pp. 39–53. ISBN 9780080951683. [Google Scholar]
  10. Berova, N.; Polavarapu, P.L.; Nakanishi, K.; Woody, R.W. (Eds.) Comprehensive Chiroptical Spectroscopy: Applications in Stereochemical Analysis of Synthetic Compounds, Natural Products, and Biomolecules; John Wiley & Sons, Inc.: Hoboken, NJ, USA, 2012; ISBN 9781118120392. [Google Scholar]
  11. Polavarapu, P.L. Chiroptical Spectroscopy: Fundamentals and Applications; CRC Press, Taylor & Francis: Boca Raton, FL, USA, 2017; ISBN 9781315374888. [Google Scholar]
  12. Superchi, S.; Rosini, C.; Mazzeo, G.; Giorgio, E. Determination of Molecular Absolute Configuration: Guidelines for Selecting a Suitable Chiroptical Approach. In Comprehensive Chiroptical Spectroscopy; Berova, N., Polavarapu, P.L., Nakanishi, K., Woody, R.W., Eds.; John Wiley & Sons, Inc.: Hoboken, NJ, USA, 2012; Volume 2, pp. 421–447. ISBN 9781118120392. [Google Scholar]
  13. Superchi, S.; Scafato, P.; Gorecki, M.; Pescitelli, G. Absolute Configuration Determination by Quantum Mechanical Calculation of Chiroptical Spectra: Basics and Applications to Fungal Metabolites. CMC 2018, 25, 287–320. [Google Scholar] [CrossRef]
  14. Mándi, A.; Kurtán, T. Applications of OR/ECD/VCD to the Structure Elucidation of Natural Products. Nat. Prod. Rep. 2019, 36, 889–918. [Google Scholar] [CrossRef]
  15. Vergura, S.; Santoro, E.; Masi, M.; Evidente, A.; Scafato, P.; Superchi, S.; Mazzeo, G.; Longhi, G.; Abbate, S. Absolute Configuration Assignment to Anticancer Amaryllidaceae Alkaloid Jonquailine. Fitoterapia 2018, 129, 78–84. [Google Scholar] [CrossRef]
  16. Belviso, S.; Santoro, E.; Lelj, F.; Casarini, D.; Villani, C.; Franzini, R.; Superchi, S. Stereochemical Stability and Absolute Configuration of Atropisomeric Alkylthioporphyrazines by Dynamic NMR and HPLC Studies and Computational Analysis of HPLC-ECD Recorded Spectra. Eur. J. Org. Chem. 2018, 2018, 4029–4037. [Google Scholar] [CrossRef]
  17. Superchi, S.; Casarini, D.; Laurita, A.; Bavoso, A.; Rosini, C. Induction of a Preferred Twist in a Biphenyl Core by Stereogenic Centers: A Novel Approach to the Absolute Configuration of 1,2- and 1,3-Diols. Angew. Chem. Int. Ed. Engl. 2001, 40, 451–454. [Google Scholar] [CrossRef]
  18. Santoro, E.; Vergura, S.; Scafato, P.; Belviso, S.; Masi, M.; Evidente, A.; Superchi, S. Absolute Configuration Assignment to Chiral Natural Products by Biphenyl Chiroptical Probes: The Case of the Phytotoxins Colletochlorin A and Agropyrenol. J. Nat. Prod. 2020, 83, 1061–1068. [Google Scholar] [CrossRef] [PubMed]
  19. Superchi, S.; Bisaccia, R.; Casarini, D.; Laurita, A.; Rosini, C. Flexible Biphenyl Chromophore as a Circular Dichroism Probe for Assignment of the Absolute Configuration of Carboxylic Acids. J. Am. Chem. Soc. 2006, 128, 6893–6902. [Google Scholar] [CrossRef]
  20. Vergura, S.; Scafato, P.; Belviso, S.; Superchi, S. Absolute Configuration Assignment from Optical Rotation Data by Means of Biphenyl Chiroptical Probes. Chem. Eur. J. 2019, 25, 5682–5690. [Google Scholar] [CrossRef] [PubMed]
  21. Vergura, S.; Pisani, L.; Scafato, P.; Casarini, D.; Superchi, S. Central-to-Axial Chirality Induction in Biphenyl Chiroptical Probes for the Stereochemical Characterization of Chiral Primary Amines. Org. Biomol. Chem. 2018, 16, 555–565. [Google Scholar] [CrossRef]
  22. Sagiv, J.; Yogev, A.; Mazur, Y. Application of Linear Dichroism to the Analysis of Electronic Absorption Spectra of Biphenyl, Fluorene, 9,9’-Spirobifluorene, and [6.6]Vespirene. Interpretation of the Circular Dichroism Spectrum of [6.6]Vespirene. J. Am. Chem. Soc. 1977, 99, 6861–6869. [Google Scholar] [CrossRef]
  23. Bunnenberg, E.; Djerassi, C.; Mislow, K.; Moscowitz, A. Inherently Dissymmetric Chromophores and Circular Dichroism. J. Am. Chem. Soc. 1962, 84, 2823–2826. [Google Scholar] [CrossRef]
  24. Mislow, K.; Bunnenberg, E.; Records, R.; Wellman, K.; Djerassi, C. Inherently Dissymmetric Chromophores and Circular Dichroism. II. J. Am. Chem. Soc. 1963, 85, 1342–1349. [Google Scholar] [CrossRef]
  25. Rashidi-Ranjbar, P.; Sandström, J. The UV and CD Spectra of a 60∘ Twisted Bridged Biphenyl: An Experimental and CNDO/S Study. J. Mol. Struct. 1991, 246, 25–32. [Google Scholar] [CrossRef]
  26. Collins, A.N.; Sheldrake, G.N.; Crosby, J. (Eds.) Chirality in Industry II; Wiley: Chichester, UK, 1997; ISBN 9780471935957. [Google Scholar]
  27. Haga, T.; Crasby, K.E.; Schussler, J.R.; Palmer, C.J.; Yoshii, H.; Kimura, F.; Kurihara, N. Aryloxypropanoate Herbicides in Chirality in Agrochemicals; Kurihara, N., Miyamoto, J., Eds.; Wiley Series in Agrochemicals and Plant Protection; Wiley: New York, NY, USA, 1998; ISBN 9780471981213. [Google Scholar]
  28. Staels, B.; Dallongeville, J.; Auwerx, J.; Schoonjans, K.; Leitersdorf, E.; Fruchart, J.-C. Mechanism of Action of Fibrates on Lipid and Lipoprotein Metabolism. Circulation 1998, 98, 2088–2093. [Google Scholar] [CrossRef] [Green Version]
  29. Kurihara, N.; Miyamoto, J.; Paulson, G.D.; Zeeh, B.; Skidmore, M.W.; Hollingworth, R.M.; Kuiper, H.A. Pesticides Report 37: Chirality in Synthetic Agrochemicals: Bioactivity and Safety Consideration (Technical Report). Pure Appl. Chem. 1997, 69, 2007–2026. [Google Scholar] [CrossRef]
  30. Ferorelli, S.; Loiodice, F.; Tortorella, V.; Conte-Camerino, D.; De Luca, A.M. Carboxylic Acids and Skeletal Muscle Chloride Channel Conductance: Effects on the Biological Activity Induced by the Introduction of Methyl Groups on the Aromatic Ring of Chiral α-(4-Chloro-Phenoxy)Alkanoic Acids. Il Farmaco 2001, 56, 239–246. [Google Scholar] [CrossRef]
  31. Buser, H.-R.; Poiger, T.; Müller, M.D. Occurrence and Environmental Behavior of the Chiral Pharmaceutical Drug Ibuprofen in Surface Waters and in Wastewater. Environ. Sci. Technol. 1999, 33, 2529–2535. [Google Scholar] [CrossRef]
  32. Schneiderheinze, J.M.; Armstrong, D.W.; Berthold, A. Plant and soil enantioselective biodegradation of racemic phenoxyalkanoic herbicides. Chirality 1999, 11, 330–337. [Google Scholar] [CrossRef]
  33. Cai, X.; Liu, W.; Sheng, G. Enantioselective Degradation and Ecotoxicity of the Chiral Herbicide Diclofop in Three Freshwater Alga Cultures. J. Agric. Food Chem. 2008, 56, 2139–2146. [Google Scholar] [CrossRef]
  34. Buser, H.R.; Muller, M.D. Enantioselective analyses of persistent and modern pesticides. A step toward sustainable agriculture. Chimia 1997, 51, 694–700. [Google Scholar]
  35. Sanganyado, E.; Lu, Z.; Fu, Q.; Schlenk, D.; Gan, J. Chiral Pharmaceuticals: A Review on Their Environmental Occurrence and Fate Processes. Water Res. 2017, 124, 527–542. [Google Scholar] [CrossRef]
  36. Kasprzyk-Hordern, B. Pharmacologically Active Compounds in the Environment and Their Chirality. Chem. Soc. Rev. 2010, 39, 4466. [Google Scholar] [CrossRef] [Green Version]
  37. Ribeiro, A.R.; Castro, P.M.L.; Tiritan, M.E. Chiral Pharmaceuticals in the Environment. Environ. Chem. Lett. 2012, 10, 239–253. [Google Scholar] [CrossRef]
  38. Tottie, L.; Baeckström, P.; Moberg, C.; Tegenfeldt, J.; Heumann, A. Molecular Sieve Controlled Diastereoselectivity: Effect in the Palladium-Catalyzed Cyclization of Cis-1,2-Divinylcyclohexane with α-Oxygen-Substituted Acids as Chiral Nucleophiles. J. Org. Chem. 1992, 57, 6579–6587. [Google Scholar] [CrossRef]
  39. Eliel, E.L.; Wilen, S.H.; Mander, L.N. (Eds.) The groups size was inferred from the Winstein A steric parameters. In Stereochemistry of Organic Compounds; Wiley: New York, NY, USA, 1994; pp. 696–697. ISBN 9780471016700. [Google Scholar]
  40. As inferred from X-ray structure and computations reported in reference [19], the π-π aryl-aryl interactions give rise to an edge-to-face or T-shape arrangement of the biphenyl and aryl moieties. Anslyn, E.V.; Dougherty, D.A. (Eds.) Modern Physical Organic Chemistry; University Science: Sausalito, CA, USA, 2006; p. 184. ISBN 9781891389313.
  41. Harada, N.; Nakanishi, K. Exciton Chirality Method and Its Application to Configurational and Conformational Studies of Natural Products. Acc. Chem. Res. 1972, 5, 257–263. [Google Scholar] [CrossRef]
  42. White, D.P.; Anthony, J.C.; Oyefeso, A.O. Computational Measurement of Steric Effects: The Size of Organic Substituents Computed by Ligand Repulsive Energies. J. Org. Chem. 1999, 64, 7707–7716. [Google Scholar] [CrossRef]
Figure 1. 2-Arylpropionic acids NSAIDs (1ad) and 2-aryloxypropionic acids (2a,b).
Chemosensors 09 00154 g001
Scheme 1. Biphenyl probes for the absolute configuration determination of chiral acids by ECD. L = largest group, M = medium size group, S = smallest group. See [19] for details.
Chemosensors 09 00154 sch001
Figure 2. Top: schematic representation of the conformational equilibrium in 2-alkyl-substituted biphenyl amides. Bottom: mnemonic scheme relating the absolute configuration and the sign of the A band in the ECD spectrum of biphenylamides. L = largest group, M = medium size group, S = smallest group. Reprinted with permission from [19]. Copyright 2006, American Chemical Society.
Chemosensors 09 00154 g002
Figure 3. Top: schematic representation of the conformational equilibrium in 2-aryl-substituted biphenyl amides. Bottom: mnemonic scheme relating the absolute configuration and the sign of the A band in the ECD spectrum of biphenylamides. Ar = aromatic group, M = medium size group, S = smallest group. Reprinted with permission from [19]. Copyright 2006, American Chemical Society.
Chemosensors 09 00154 g003
Scheme 2. Synthesis of 4,4′-disubstituted biphenylamides from arylpropionic acids 1a1d.
Chemosensors 09 00154 sch002
Figure 4. UV and ECD spectra (THF) of biphenylamides (S)-4aa panel (a), (S)-4ba panel (b), (S)-4ca panel (c) and (R)-4da panel (d).
Chemosensors 09 00154 g004
Figure 5. Main UV transitions of naproxen (1b), ketoprofen (1c) and flurbiprofen (1d) in the 200–300 nm spectral range.
Chemosensors 09 00154 g005
Figure 6. UV and ECD spectra of biphenylamides (S)-4ba (solid black line), (S)-4bb (dashed dotted blue line), (S)-4bc (dashed red line) and (S)-4bd (dotted green line).
Chemosensors 09 00154 g006
Figure 7. UV and ECD spectra of the biphenylamides (S)-4ca (solid black line), (S)-4cb (dashed dotted blue line) and (S)-4cc (dashed red line).
Chemosensors 09 00154 g007
Figure 8. UV and ECD spectra of the biphenylamides (R)-4da (solid black line), (R)-4db (dashed dotted blue line) and (R)-4dc (dashed red line).
Chemosensors 09 00154 g008
Scheme 3. Synthesis of 4,4′-disubstituted biphenylamides from 2-aryloxypropionic acids 2a,b.
Chemosensors 09 00154 sch003
Figure 9. UV and ECD spectra (THF) of biphenylamides (R)-5aa panel (a), (R)-5ba panel (b), (R)-5ac panel (c) and (R)-5bc panel (d).
Chemosensors 09 00154 g009
Table 1. ECD and [α]D data of biphenylamides derived from (S)-1b, (S)-1c and (R)-1d.
Arylpropionic Acid a
(S)-1b(S)-1c(R)-1d
AzepineX bλmax c (Δε)[α]Dλmax c (Δε)[α]Dλmax c (Δε)[α]D
3aH253 (+7.5)+95250 (+11.2)+121243 (−3.8)−88
3bOMe260 (+19.0)+113262 (+14.2)+85263 (−11.8)−139
3cNO2306 (+2.8)+67312 (+2.7)+153310 (−2.5)−97
3dNH2283 (+5.7)+69----
a ECD recorded in THF and [α]D measured in CHCl3 at 25 °C. b The 4,4′-substituent of biphenylazepine. c Wavelength maximum of the A band in nm.
Publisher’s Note: MDPI stays neutral with regard to jurisdictional claims in published maps and institutional affiliations.

