Article

Sensing Atrazine Herbicide Degradation Products through Their Interactions with Humic Substances by Surface-Enhanced Raman Scattering

by
Giulia Zanasi
1,
Rafael J. G. Rubira
2,*,
Ornella Francioso
1,
Maria Vega Cañamares
3,
Carlos J. L. Constantino
2 and
Santiago Sanchez-Cortes
3,*
1
Dipartimento di Scienze e Tecnologie Agro-Alimentari, Univerisità di Bologna, V.le Fanin 40, 40127 Bologna, Italy
2
School of Technology and Applied Sciences, Sao Paulo State University (UNESP), Presidente Prudente 19060-900, SP, Brazil
3
Instituto de Estructura de la Materia (IEM-CSIC), Serrano 121, E-28006 Madrid, Spain
*
Authors to whom correspondence should be addressed.
Chemosensors 2021, 9(6), 148; https://doi.org/10.3390/chemosensors9060148
Submission received: 25 April 2021 / Revised: 18 May 2021 / Accepted: 9 June 2021 / Published: 16 June 2021
(This article belongs to the Section Optical Chemical Sensors)

Abstract

:
In this work, we have developed a simple method to carry out the quantitative analysis of deethylhydroxyatrazine (DEHA), the most abundant metabolite of atrazine herbicide (ATZ), based on the surface-enhanced Raman scattering technique. Since this ATZ product can undergo pH-dependent tautomerization, a previous characterization of the DEHA vibrational spectrum was accomplished. This study consisted of the Raman scattering study, both experimental and theoretical, of the enolic and ketonic tautomers of this molecule. SERS spectra were recorded at different pH in order to assess the effect of the metal surface in nanoparticles along with the pH on the structure of DEHA and to find the optimal experimental conditions of the quantitative detection of DEHA. Additionally, the interaction of DEHA with two types of humic acid reference standards, the Elliot humic and leonardite humic ones, was also performed by SERS. This interaction was conducted with two different objectives: to evaluate the interaction mechanism of the ATZ degradation product with humic substances and to check if this interaction can modify the sensitivity of the SERS detection of DEHA. The results presented in this study have clearly demonstrated that SERS spectroscopy is a very powerful technique for characterizing DEHA and other triazine sub-products at a very low concentration in water and also for analyzing the interaction of these important pollutants with humic substances.

1. Introduction

s-Triazines have been considered one of the most effective selective herbicides used for the control of a variety of weeds in agricultural crops [1,2]. Among chloro-s-triazine derivatives, atrazine (2-chloro-4-ethylamino-6-isopropylamino-s-triazine) is the most applied throughout the world [3,4]. Although s-triazines have been banned in most countries, their residues persist in the soil and may constitute a significant source of environmental contamination [5]. The fate of triazines in the soil is recognized to be controlled by interaction with a variety of components possessing a wide range of typical chemical reactivity (ionic, polar, and non-polar). Ionic and polar sites interact with the polar functional groups of triazine even though these sites also have a high affinity for water and compete with the same sites present in the soil surface. Non-polar sites on the soil surface readily interact with the non-polar portions of triazine molecules (alkyl side chains). In the specific case of atrazine, this pesticide exhibits a great affinity for soil organic matter, and the sorption process is correlated positively with organic C content [6]. The contribution of soil organic matter to atrazine sorption appears to be considerable. In particular, the affinity of atrazine is much more pronounced regarding the soil solid phase if the soluble organic matter content is very high [7].
The role of humic substances (HS) in the atrazine sorption on soils has been investigated in several studies [8,9,10]. Humic acids (HA) are a prominent fraction of HS that have been hypothesized to interact with atrazine via proton transfer, electron transfer, and hydrophobic interactions. However, no clear and definitive result has yet been obtained. This is primarily explained by the great complexity and heterogeneity of humic substances. In this regard, a critical knowledge of the interactions is fundamental for an accurate estimate of the environmental impact of the pollutants released and the effectiveness of remediation strategies [11,12].
Another crucial issue concerning the effects of these kinds of pesticides is their stability once released into the environment. It has been shown that atrazine degradation is high and can proceed mainly via the soil microbial activity [13,14], even though chemical hydrolysis and redox reactions are implicated [15]. The degradation is influenced not only by the chemical property of atrazine but also by its interaction with the soil component or environment [16].
Abiotic degradation of triazine herbicides is also possible through regular hydrolysis, which proves to be relatively fast in acid and alkaline soils, but is relatively slow in neutral soils [17,18]. Moreover, redox reactions are affected by oxygen present in minerals (Fe, Mn, and Co) and HS. Free radicals existing in HS may also act as oxidants promoting the oxidation reactions [19,20]. Adsorption on soil particle surfaces also contributes to the breakdown of herbicides [21]. Furthermore, in a recent work, we reported several degradation mechanisms that atrazine and prometryn can undergo under different chemical conditions [22].
Atrazine was found to be mainly degraded by dealkylation, leading to deethyl-atrazine (DEA) and deisopropyl-atrazine (DIA), and also by hydroxylation, resulting in the hydroxyl-atrazine (OHA), deethylhydroxyatrazine (DEHA), and deisopropylhydroxyatrazine (DIHA) metabolites [14,23,24]. Although all these metabolites are produced by biodegradation, some of them (desethyl-atrazine and desisopropyl-atrazine) were obtained by photocatalytic trials [25]. In soil, these metabolites tend to establish hydrophobic interactions with soil organic matter, which, by aging, form residues irreversibly bound by covalent binding or chemical incorporation into organic matter [26].
Methods for determining atrazine metabolites typically demand complicated analytical procedures mainly depending on extraction efficiencies, including types of extraction solvents, and additional cleaning of the extracts [27]. However, the polar nature of the resulting products represents a great disadvantage in the analysis and detection of all the products by conventional techniques, and there are therefore limitations regarding the detection of degradation products [24]. Accordingly, the development of alternative sensitive methods for analyzing such compounds is extremely helpful. Such methods need to be extremely selective to detect very low concentrations of atrazine degradation products, including the presence of humic substances.
Raman spectroscopy has been frequently employed in the analysis of triazine herbicides thanks to the different fingerprints characterizing each of the original and degradation products, which have a similar chemical structure [24]. However, the low sensitivity of normal Raman suggests the use of a surface-enhanced Raman scattering (SERS) technique that exhibits high selectivity and sensitivity properties and, thus, represents a good alternative to study triazines and their degradation products [20]. This technique is extremely sensitive and can give rise to an average enhancement of the Raman signal of about 106, reaching, in some extreme cases, an enhancement of 1010 in scattering efficiency over normal Raman scattering [28]. Therefore, SERS can nowadays be considered a powerful analytical technique for herbicide analysis. The enhancement of the Raman intensity is based on the adsorption of the analyzed molecules on nanostructured noble metal surfaces. The electric field enhancement is associated with localized surface plasmon resonance (LSPR) induced on the metal surface [28,29,30,31].
The main objective of the present study is to develop an ultrasensitive and selective analytical method for triazine degradation products using the SERS technique. Although SERS was applied for the detection of atrazine, no work has been performed to identify the degradation products of triazines. This is surprising in light of the fact that most triazines immediately degrade to other products in aqueous media, especially at high temperature and low pH values.
Specifically, in this study, we focused on the most abundant metabolite of atrazine (ATZ), identified as atrazine-desethyl-2-hydroxy or deethylhydroxyatrazine (DEHA, Figure 1), and its structural modifications under different pH values that lead to tautomeric forms. Another important issue concerns the stability and the fate of DEHA as a result of its interaction with soil humic substances. For this reason, the interaction of DEHA with two humic acid reference standards, Leonardite humic acid (LHA) and Elliot soil humic acid (EHA), was investigated based on the specific fingerprints provided by SERS. These two HAs were selected based on the different structure and functional groups’ content.

2. Materials and Methods

2.1. Reagents

AgNO3, Na3C6H5O7 (CT), and NH2OH.HCl were purchased from Sigma-Aldrich (Saint Louis, MO, USA). Atrazine-desethyl-2-hydroxy (DEHA-C6H11N5O, PESTANAL®, analytical standard) was purchased from Sigma-Aldrich (Saint Louis, MO, USA). Highly purified standard of Leonardite humic acid (LHA, code 1S104H) and Elliot soil humic acid (EHA, code 1S102H) were bought from the International Humic Substances Society (IHSS, Denver, CO, USA).

2.2. Preparation of Silver Nanoparticles (AgNPs)

Hydroxylamine AgNPs were obtained by the method previously described [32]. The method consists of adding 300 μL of sodium hydroxide (1.0 mol/L) in 90 mL of hydrochloride hydroxylamine aqueous solution (1.66 × 10⁻³ mol/L) under stirring. Then, 10.0 mL of Ag nitrate aqueous solution (1.0 × 10⁻² mol/L) was added to this mixture, drop by drop. Finally, the colloidal suspension remained 10 min under stirring and at room temperature for at least 24 h before starting the experiments.

2.3. Sample Preparation

Stock aqueous solutions of DEHA were prepared at a final concentration of 10−2 M. The mother solutions of HAs were prepared by dissolving 1 mg of each HA in 1 mL of 1 M NaOH. Different pH values of HA solutions were obtained by adding 0.1 N NaOH or 0.1 N HCl. Ultrapure water (≥18.0 MΩ cm) was utilized in the preparation of all solutions. All chemical reagents were analytical grade.

2.4. UV-Vis Spectra

Samples for the extinction spectra of the individual colloidal solution of AgNPs were obtained by adding 2500 µL of water and 500 µL of AgNPs colloidal solution to a quartz cuvette; other samples were prepared by adding 2480 µL of water, 500 µL of AgNPs colloidal solution, and 20 µL of NaCl 0.05 M to a quartz cuvette to study the nanoparticles’ aggregation. UV-vis extinction spectra of all the samples (AgNPs, AgNPs + DEHA, and AgNPs + NaCl + DEHA) are shown in the Supplementary Material (Figure S1). UV-vis extinction spectra of Ag NPs suspensions were recorded with a Shimadzu 3600 spectrometer using quartz cells, 1 cm optical path. Samples were diluted in Milli-Q water (v/v).

2.5. Raman and SERS Sample Preparations

A sample of solid DEHA was used to obtain a normal Raman spectrum. Samples for SERS measurements were prepared by adding 20 µL of the analytes solution (DEHA 10−2 mol/L and HA 1 mg/mL) to 980 µL of AgNPs suspensions. The HA solutions were obtained by dissolving 1 mg of the corresponding humic fraction in 1 mL of tri-distilled water. The activation was performed by adding 20 µL of NaCl 0.05 M to the silver colloid. The final concentrations of DEHA in the sample ranged from 10−4 to 10−7 mol/L. Samples for SERS measurements of DEHA/humic acids’ interaction were prepared as follows: 30 µL of DEHA at different concentrations (from 10−2 to 10−7 mol/L) were added to 50 µL of HA at different concentrations (from 1 to 0.1 mg/mL). Then, 20 µL of this solution was added to 980 µL of AgNPs; NaOH was used for changing the pH of the solutions. Raman and SERS spectra were recorded with a Renishaw Raman In Via Spectrometer (Renishaw Iberica S.A.U., Gavá, Spain), equipped with a Leica microscope and an electrically refrigerated CCD camera, using the 532 (Nd:YAG) excitation line and a power of 2 mW. The SERS spectra were the result of one scan registered with an integration time of 10 s and a resolution of 2 cm−1.

2.6. Quantitative Analysis

Quantitative analysis was performed by averaging the SERS intensity values obtained from a set of three measurements for each concentration. The water band was applied as the internal standard. The limit of detection (LOD) was calculated using the Origin Pro 7.5 software (Origin Lab, Northampton, MA, USA) and estimated using 3σ/sensitivity, where σ is the blank noise intensity, and sensitivity (b) is interpreted as the slope of the fitted curve [33,34]. The values for calculating the LOD are listed in Table 1.

2.7. Theoretical Raman Calculations

Normal Raman spectrum of DEHA was calculated with the B3LYP hybrid functional and 6–31+G(d,p) one-electron atomic basis set. DEHA geometry was previously optimized using the same functional and basis set. All the calculations were performed in vacuum conditions. Thus, DEHA was considered a single molecule without intermolecular interactions. Calculations were carried out using the Gaussian 09 computational chemistry package [35]. Detailed assignments of the vibrational normal modes were based on the best fit comparison of the wavenumbers of calculated and experimental Raman bands. Several scaling factors were used to reduce the frequency deviations between the calculated wavenumbers and the experimental ones: 0.95 for wavenumbers above 1650 cm−1, 0.9648 between 1650 and 1100 cm−1, and 1.0117 below 1100 cm−1 [36].

3. Results and Discussion

3.1. Morphology of AgNPs: Extinction Spectra and TEM

The extinction spectra of the Ag colloid in the absence and presence of the NaCl and DEHA show a plasmon with a maximum at 403 nm (Figure S1). In addition, a band appears at high wavelengths around 596 nm, which shows that DEHA in the presence of NaCl salt causes the aggregation of the colloid. Possibly this factor with the addition of HA helped in the detection of DEHA. These Ag nanoparticles synthesized with the reducing agent hydroxylamine are well studied in the literature. Our group has already shown in previous studies [37] that these types of nanoparticles with plasmon around 403 have an average size of about 26 ± 2 nm, with a predominant spherical shape. The inset in Figure S1 confirms the diameter mentioned in the work and shows the predominantly spherical shape of the Ag nanoparticles using a transmission electron microscopy (TEM) image.

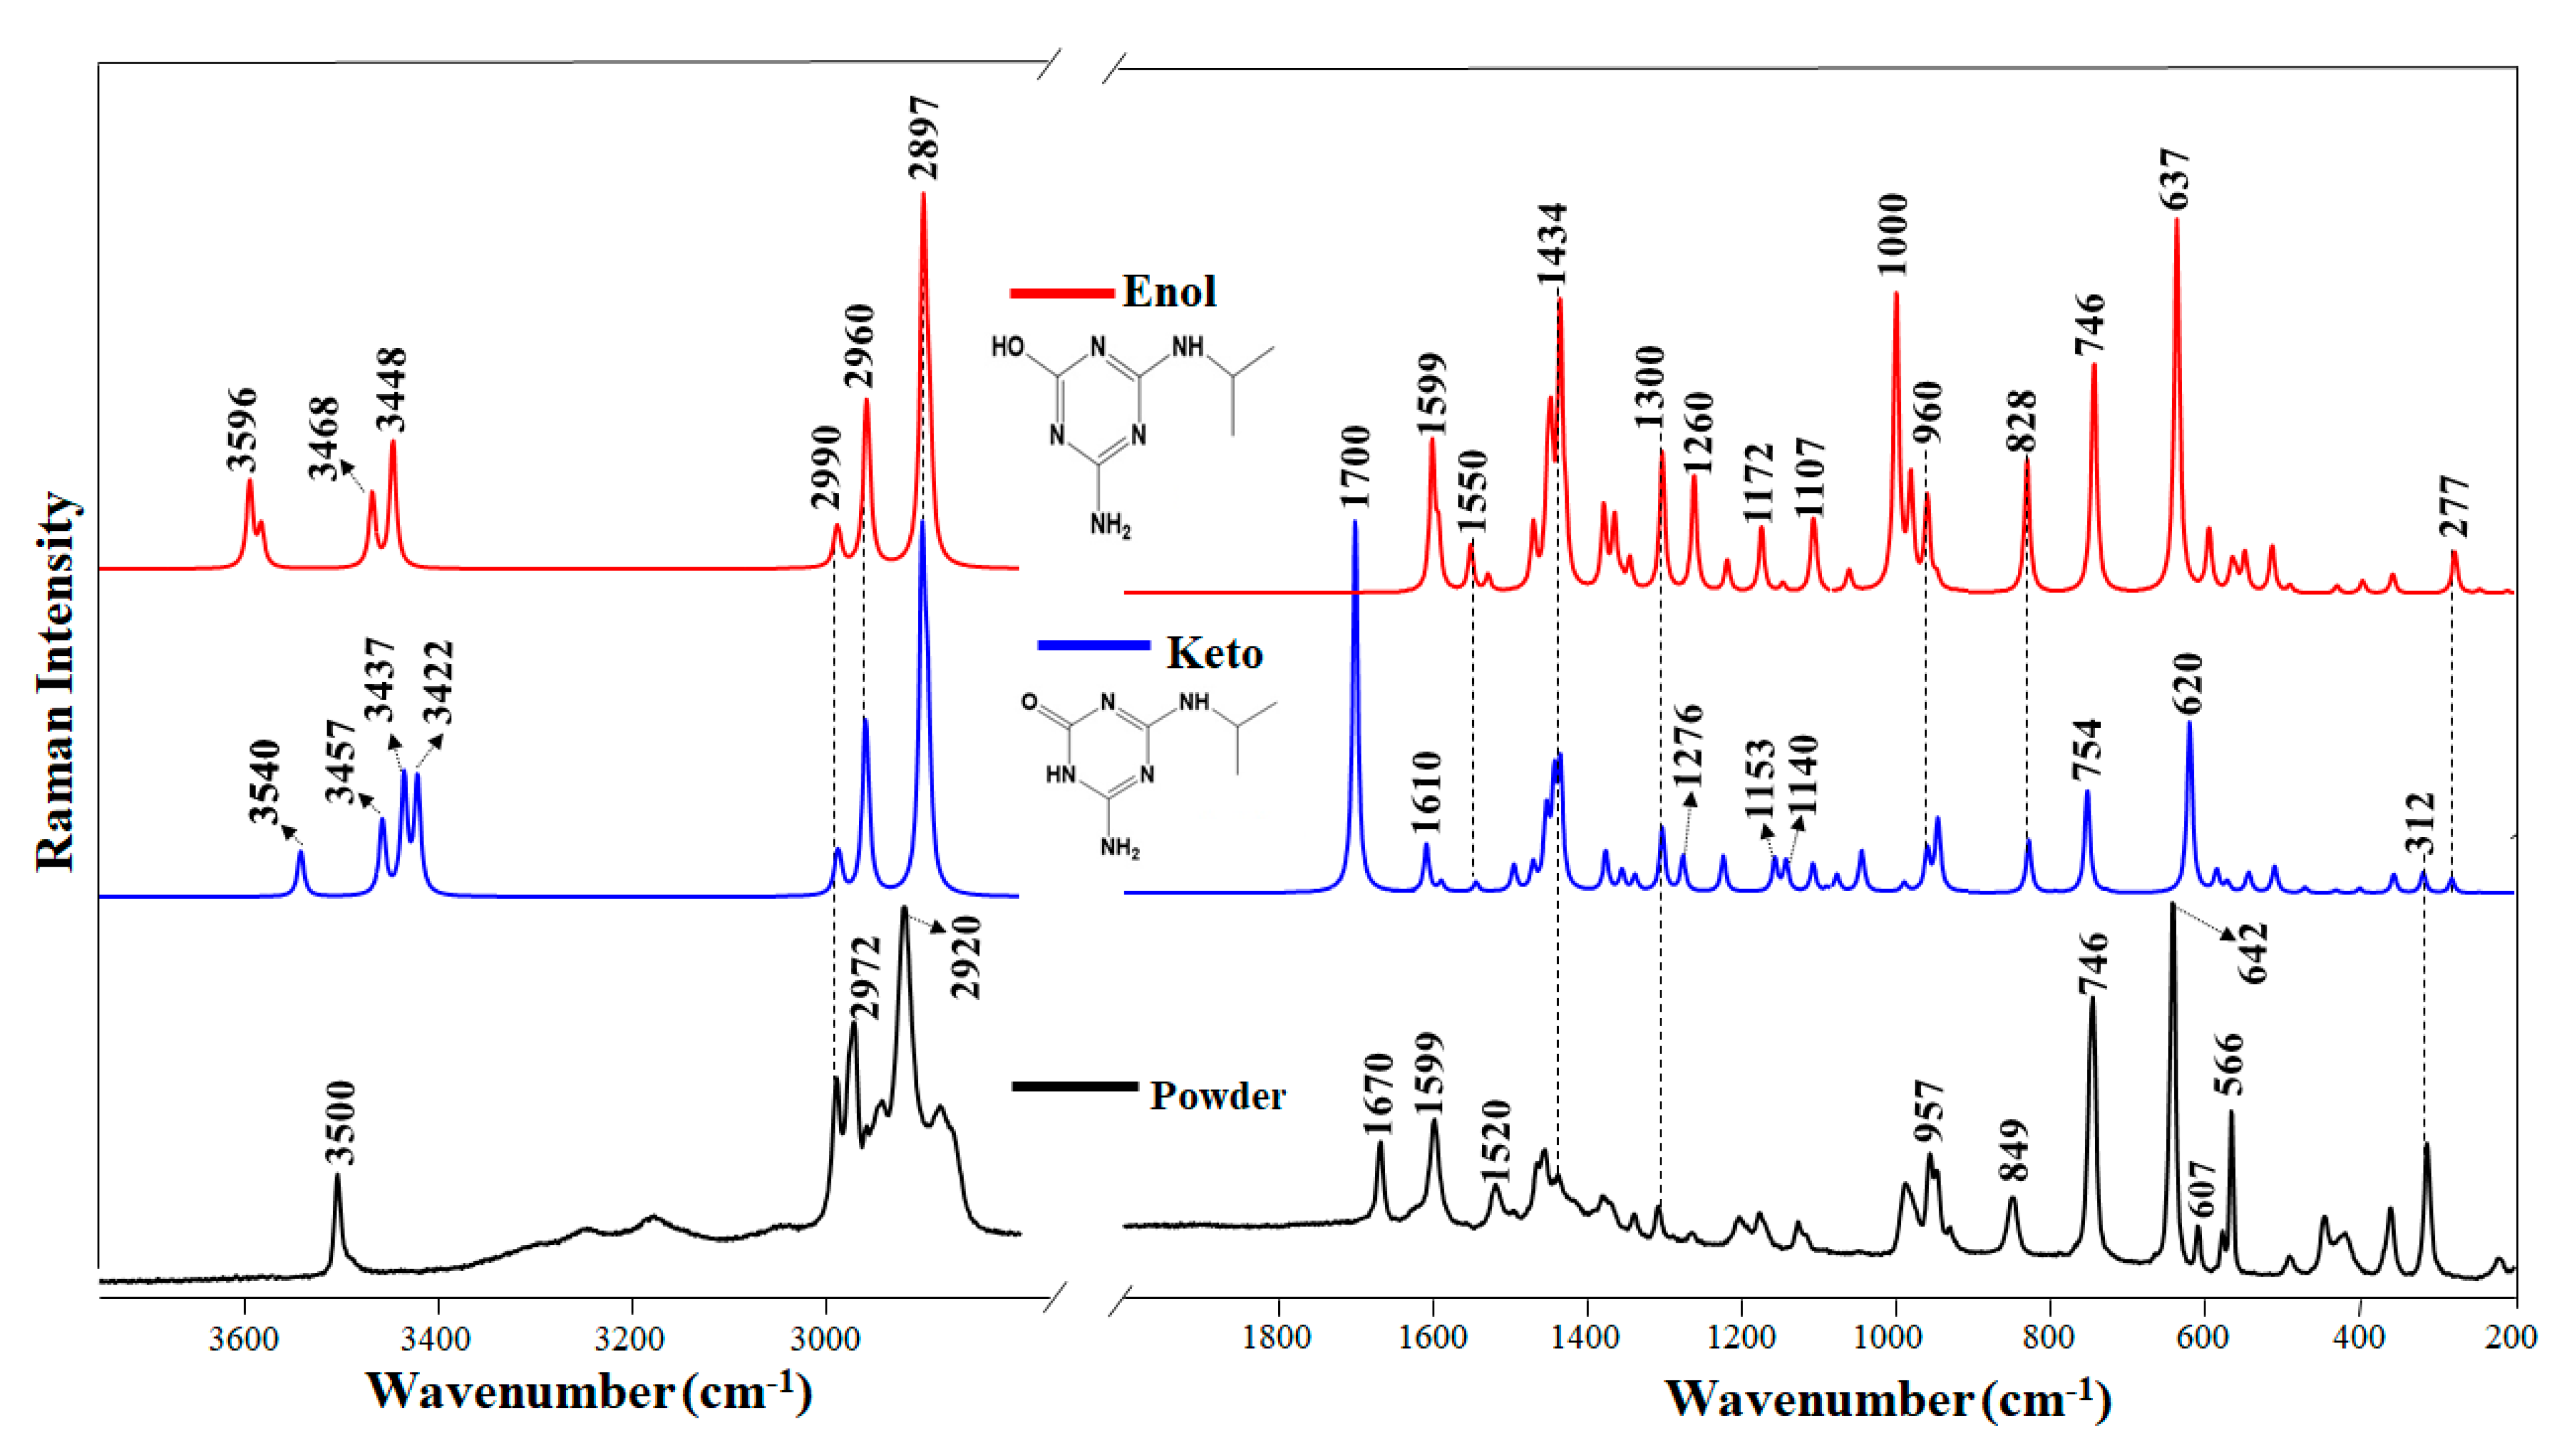
3.2. Experimental and Theoretical Raman Spectra of DEHA

Figure 1 shows the Raman spectrum of solid DEHA and the corresponding calculated spectrum of the enol structure. The main wavenumber positions and assignments of this spectrum are shown in Table S1. However, as DEHA molecules can undergo keto-enol tautomerism, we also calculated the theoretical Raman spectrum of the keto form (Figure 1). Since Raman has not been applied up to now to the study of these triazine products, the attribution of vibrational bands of Raman spectra was performed on the basis of the theoretical analysis along with the comparison with molecules structurally similar that were characterized by Raman. Calculations made for the two different tautomers that can render the atrazine (ATZ) products (enol and keto) were employed to better understand the dynamic of these molecules at different pH. Previous works based on the use of the infrared technique have shown that metabolites resulting from the atrazine degradation were subjected to a conversion from enol to keto form with the decreasing of the pH [38].
The keto–enol tautomerism has an evident effect on the Raman spectrum that provides a fingerprint for every form. In the case of peripheral moieties, the most involved group is that of keto, with a ureide structure, which can be identified by the intense band seen in the experimental spectrum of the powder at 1670 cm−1, which corresponds to the calculated band in the keto form appearing at 1700 cm−1. The latter band is assigned to the C=O stretching motion (ν(C=O)). Other bands associated with the ureide structure appear in the 1200–1300 cm−1 region of the calculated spectrum, which are attributed to C-N stretching according to the theoretical calculation, while the band at 1610 cm−1 is attributed to ν(C=N) vibrations.
The enol structure of DEHA is characterized by the disappearance of the ν(C=O) band (1700 cm−1) and the corresponding changes affecting the ureide moiety in the 1200–1300 cm−1 region. In addition, an intense band appearing at 3596 cm−1 is attributed to ν(O-H) stretching in the enol structure, while the other bands appearing at 3468 and 3448 cm−1 are attributed to ν(N-H) motions.
The vibrations corresponding to the triazine ring are also affected by the tautomerization. For instance, the ν(C=N) band of the keto form appearing at 1610 cm−1 moves downward to 1599 cm−1 in the enol form due to a higher electronic delocalization, while the ring breathing band at 642 cm−1 undergoes a shift upward. One of the most significant characteristics of DEHA is the prominent ring deformation band (Kekulé mode) at 960 cm−1, which is a strong fingerprint of the triazine ring associated with the enol structure, and that it is intensified in the enol form.
The analysis of the calculated Raman vibrational spectra of enol and keto DEHA suggests that the solid atrazine derivative has contributions from both the keto and enol structures. The intense band at 3500 cm−1 is attributed to the ν(O-H) motion, while the broad bands seen in the 3000–3400 cm−1 can be attributed to the ν(N-H) motions, that are involved in H-bonds. The presence of intense bands at 3500, 1599, 746, and 642 cm−1 points out the presence of the enol form, since they correlate well with similar bands in the enol calculated spectrum. On the other hand, the presence of bands at 1670, 1520, and 607 indicates that the keto form is also contributing to the final structure of DEHA in the solid state.
The Raman of DEHA in an aqueous solution or ethanol could not be obtained due to the weak Raman efficiency of this molecule. The only way to observe a vibrational Raman spectrum in solution and low concentration was SERS on silver NPs.

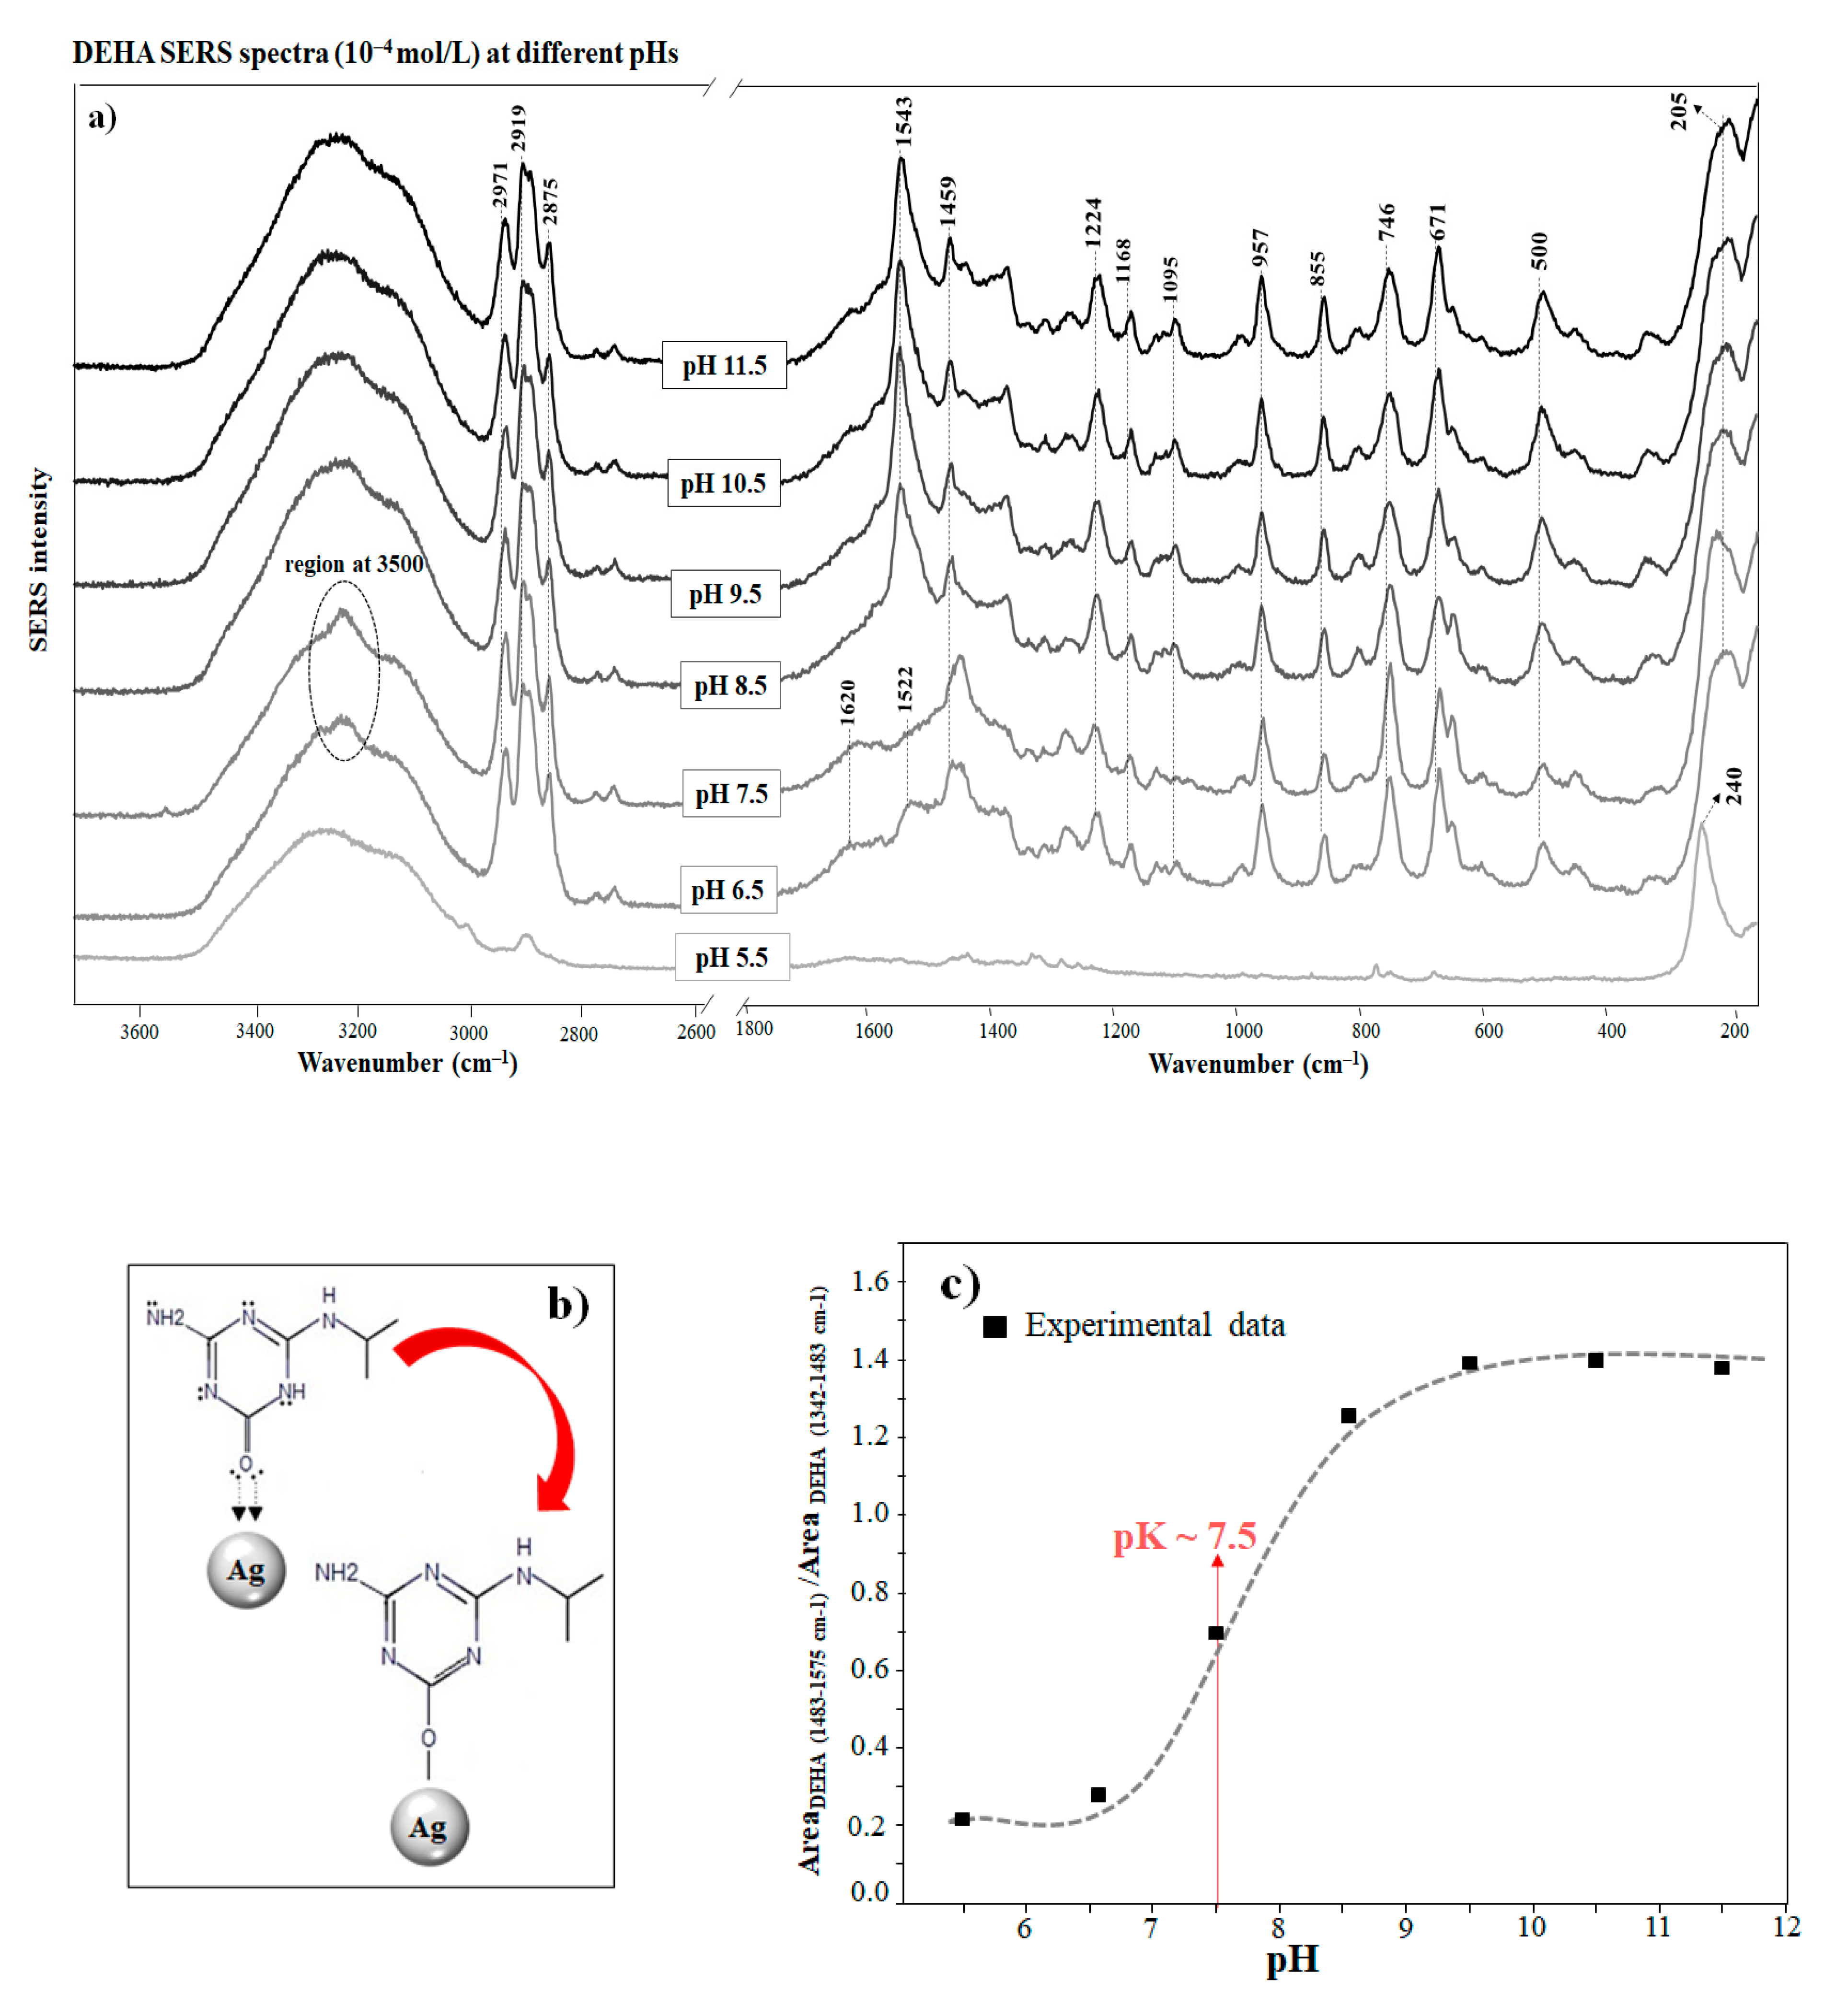
3.3. SERS Spectra of DEHA at Different pHs

Figure 2a shows the SERS spectra of DEHA on AgNPs at different pHs. The changes observed in the SERS spectra in relation to the solid are attributed to the interaction of DEHA with the metal surface. The adsorption of DEHA on silver nanoparticles is necessary for the intensification of the Raman, but the adsorption in this case implies an actual chemisorption on NPs that can change the structure of the molecule. In particular, the disappearance at pH above 8.0 of the bands associated with the keto structure in the ureide moiety at 1620 and 3500 cm−1 of the solid DEHA suggests the tautomerization of the molecule from the keto to the enol form upon adsorption on the surface, in agreement with the calculated spectra of DEHA.
The tautomerization of DEHA is mainly caused by the C=O interaction of the keto DEHA form with the metal. This bond is highly involved in the chemisorption of the molecule on the silver surface of the nanoparticle because of its electron donor activity (Figure 2b). Silver atoms on the surface have empty orbitals in the highest electron levels that account for their high tendency to accept electrons to complete the almost filled shells. In this respect, the chemisorption of oxygen is possibly due to the paired electron configuration and the formation of coordination bonds between the metal and the keto group [39]. The chemisorption and interaction of the C=O group with the metal occur through the formation of an Ag–O bond, which usually falls in the spectral region between 200–300 cm−1 [28]. In Figure 2a, the band at 205 cm−1 indicates the interaction between oxygen atoms of DEHA and the metal nanoparticle. Similar bands were also observed in the case of other O-containing molecules chemisorbed on Ag surfaces [40,41,42,43,44].
The pH also plays an important role in the adsorption and tautomerization of DEHA on AgNPs, two processes that are of the highest relevance when studying the behavior and fate of this molecule in soils at a pH below 7.5; the bands corresponding to the ureide form (those at 1620, 1522, and 642 cm−1) are seen again, due to the subsequent tautomerization to the keto form on the surface induced by the pH decrease. The band at 1620 cm−1 is attributed to ν(C=O)/(ν(C=N) vibrations. In addition, the band at 1522 cm−1 can be also attributed to the keto structure according to the theoretical Raman calculations, and it can be attributed to the C-N stretching in the ring, the deformation of the N-H and C-H bonds, and the scissoring of the NH2 group (Table S1).
Therefore, a simultaneous existence of DEHA in the enol and keto forms on the surface is possible. Finally, at pH below 5.5, the intensity of the SERS spectra is weakened due to the much lower affinity of the keto form. The variation of SERS intensity with the pH is evidently related to the ionization of DEHA at different pH as well as the different affinities of the enol and keto forms and on the silver surface. The pH dependence of tautomerization has also been reported for other triazine degradation byproducts such as cyanuric acid [45] and ammeline [45,46]. For hydroxypropazine, a structurally related molecule, it has also been reported that a decrease in pH increased its solubility due to tautomerization and protonation effects [47]. Therefore, hydroxyatrazine also changed from an enol to a keto form and then to a protonated keto form as the pH decreased [48]. Thus, the higher affinity of DEHA towards the silver surface at alkaline pH indicates that enol DEHA molecules have a higher affinity for this surface. This pH-dependence must be highly considered when implementing an analytical method of triazine pesticides and their sub-products based on the SERS technique.
The interaction of DEHA with Ag NPs under the enol form at alkaline pH leads to important structural variations on this structure that makes the SERS spectrum very different from that observed in the solid or the solution. For instance, the intense band at 1598 cm−1 present in the Raman spectrum (Figure 1) of the powder and assigned to ν(C=N) bonds is strongly shifted to 1543 cm−1 in the SERS spectrum at alkaline pH. This shift demonstrates the presence of the enol form, as this band is also shifted in the calculated spectra from the enol tautomer to the keto one (Figure 1, Table S1). This shift is related to the higher delocalization of aromatic electrons that decreases the bond order of the C=N bonds in going from the keto to the enol tautomers. An important feature of SERS at alkaline pH is the appearance of the medium band at 1224 cm−1. This band can be assigned to ν(C-O)/ν(C-N) of the enolate form of DEHA (Table S1), which is formed by the interaction with the silver nanoparticles or at basic pH.
The coordination of DEHA with the metal has a significant effect on the ring structural vibrations. For instance, the band appearing at 566 cm−1 in the Raman spectrum of the powder (Figure 1), attributed to ring deformation (NCN) coupled with δ(NH2), undergoes a down shift to 500 cm−1 when interacting with silver (Figure 2a). Conversely, the more intense band appearing at 642 cm−1 in the powder spectrum (Figure 1), attributed to the ring breathing motion of DEHA, moves to 671 cm−1 in the SERS. A similar effect was observed in the SERS of the structural related melamine [49]. All these structural vibrations together with the Kekulé band at 957 cm−1, assigned to δ(CNC)/δ(NCN) ring deformations, undergo a clear weakening in the SERS. These effects highlight the existence of a strong interaction of DEHA with the metal, which strongly affects the structural motions of the full molecule.
As the pH decreases, the interaction mechanism changes, since the interacting model of DEHA is directly linked to the chemical structure of the adsorbate. The predominance of the keto form at a pH below 7.5 leads to the adoption of an alternative interaction model based on the formation of ion pairs between protonated amino groups and chloride ions existing on the silver surface, as demonstrated by the existence of an intense Ag-Cl stretching band at 240 cm−1. This new model implies a weaker ring–surface interaction, as indicated by the down shift of the ring breathing mode to 637–671 cm−1. On the other hand, the enhancement of bands corresponding to the aliphatic isopropyl chain (1459, 746 cm−1) similarly points to the existence of an interaction between the -NH2+- group and the Cl.
The variation of the SERS intensity of DEHA with the pH is plotted in Figure 2c. As can be seen, the SERS increases as the pH rises, and this is related to the increasing adsorption ability of DEHA at alkaline pH. In addition, this is also due to the higher affinity of the enol form, which is more probable at alkaline pH due to the consequent enolization and the silver surface. The sigmoidal curve plotted in Figure 2c shows an inflection at pH 7.5 that may correspond to the pH at which the enolization starts to grow significantly.

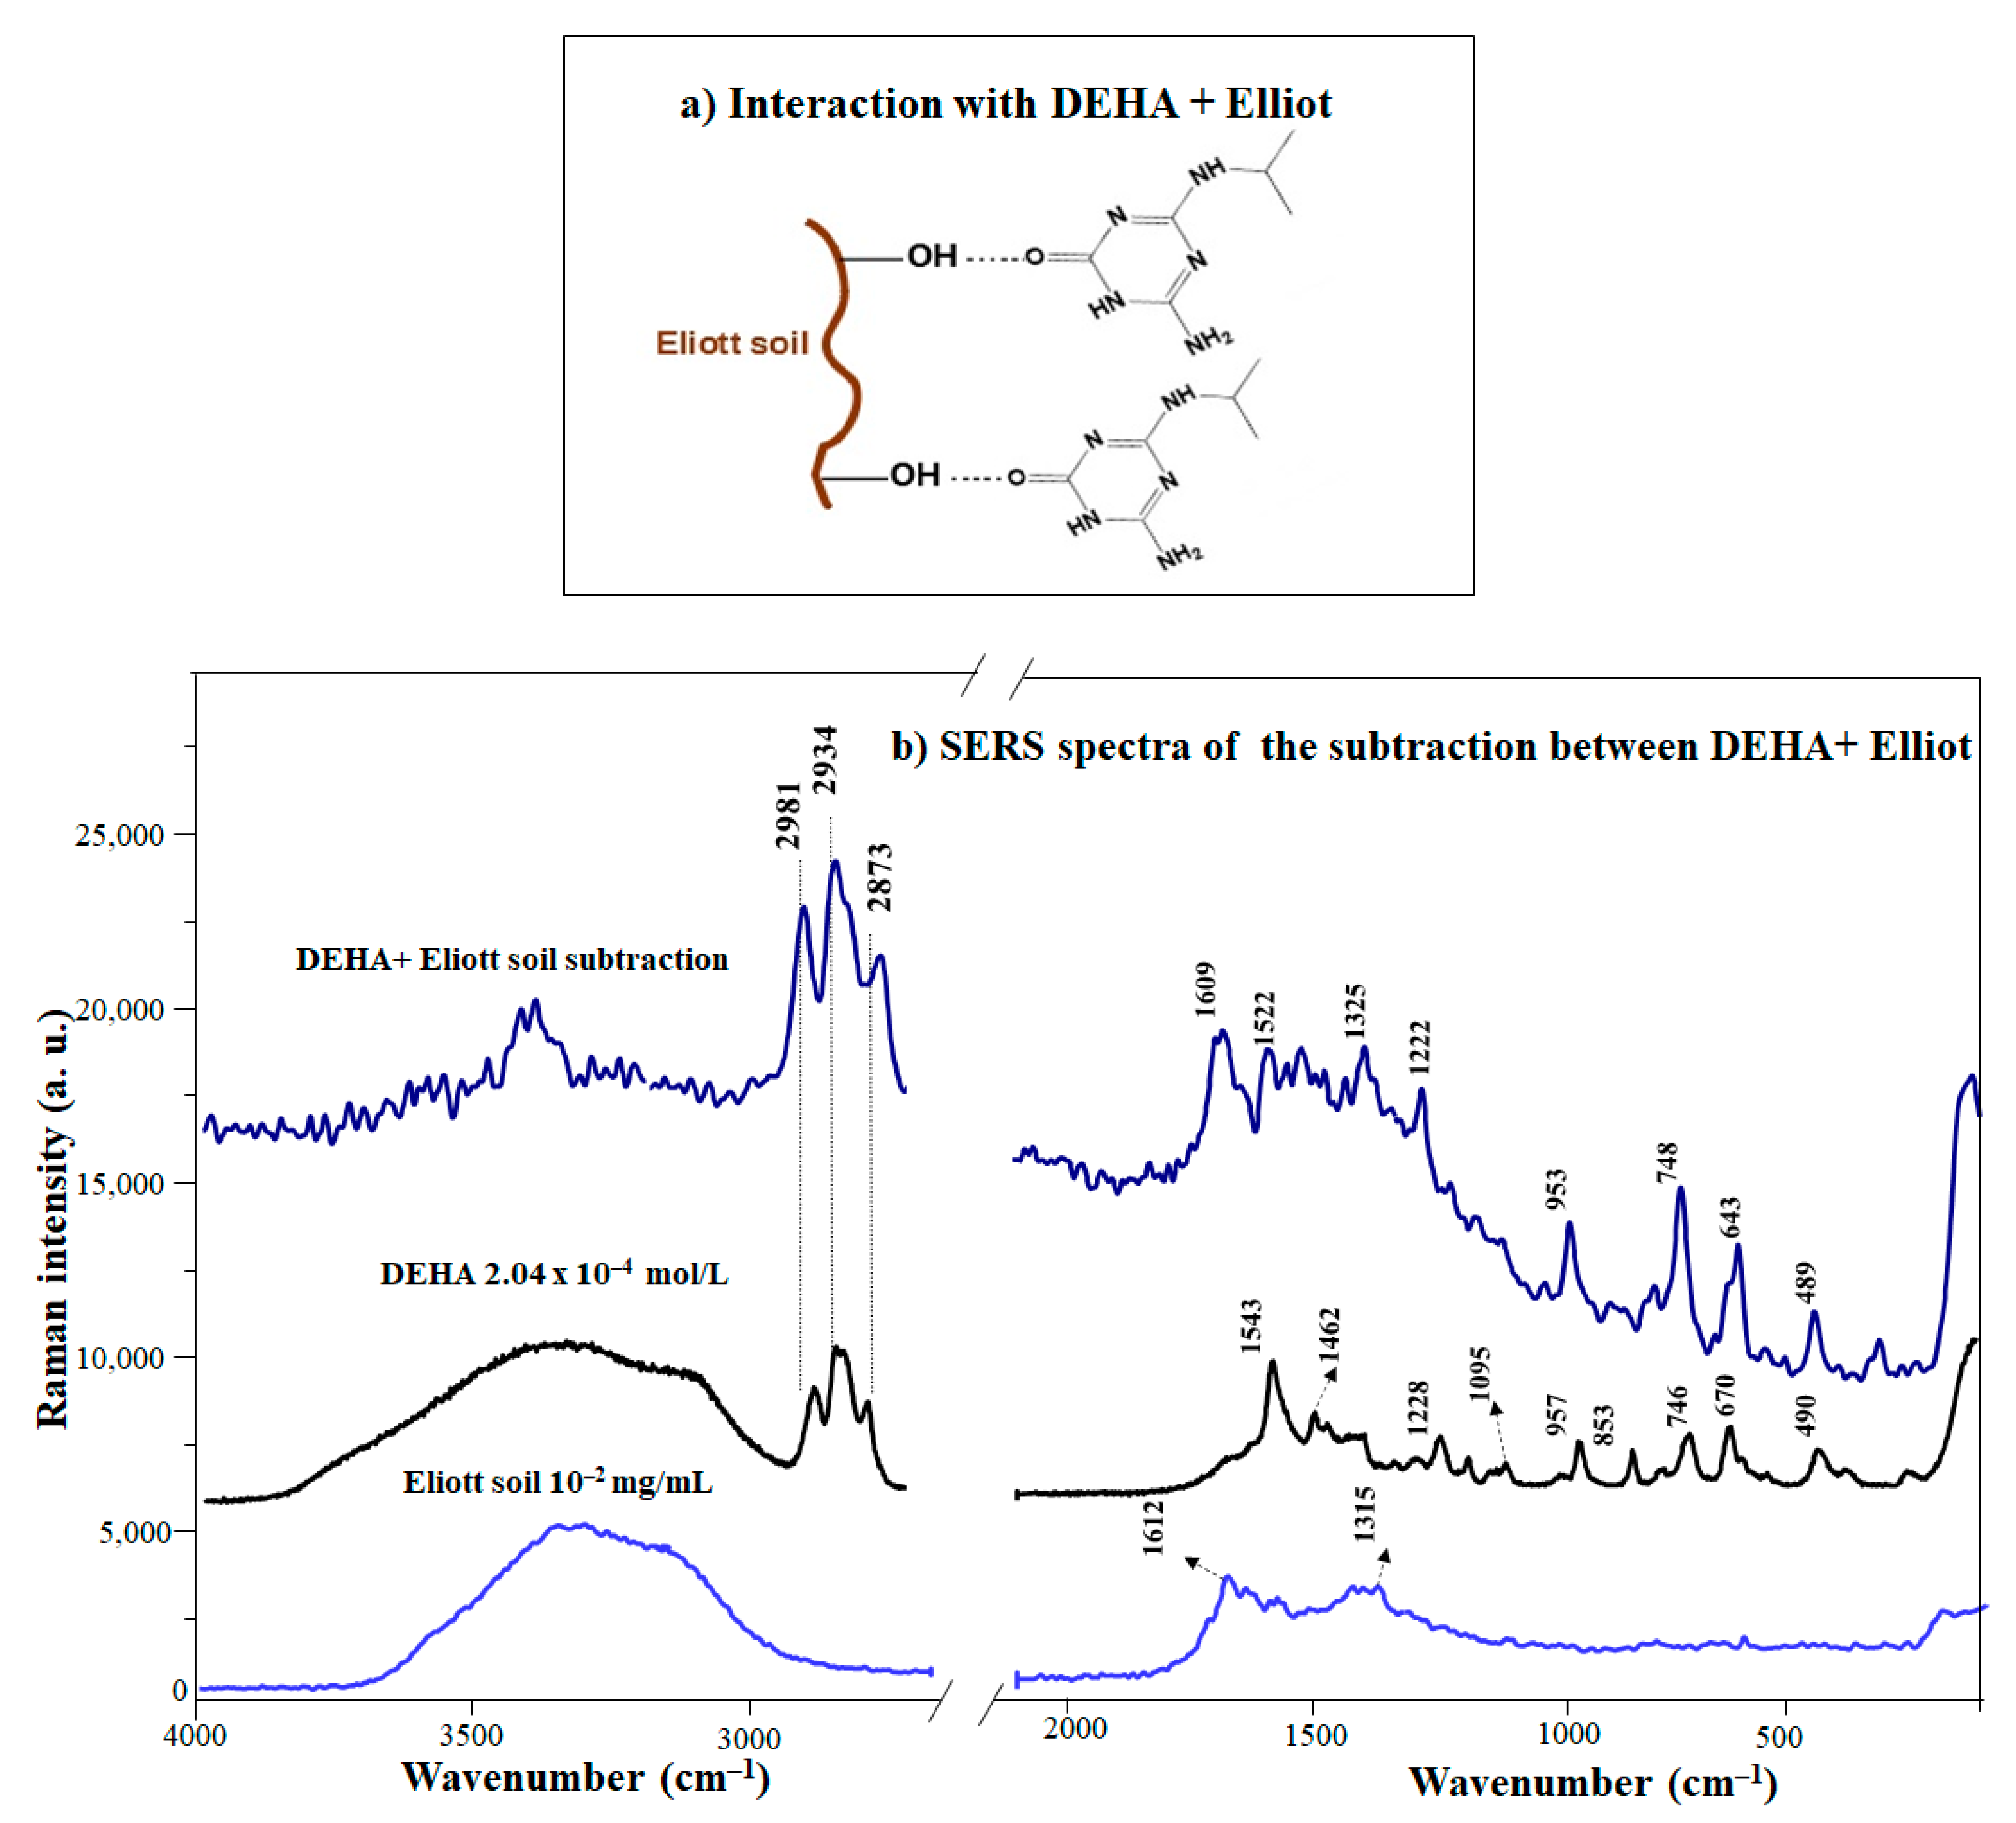
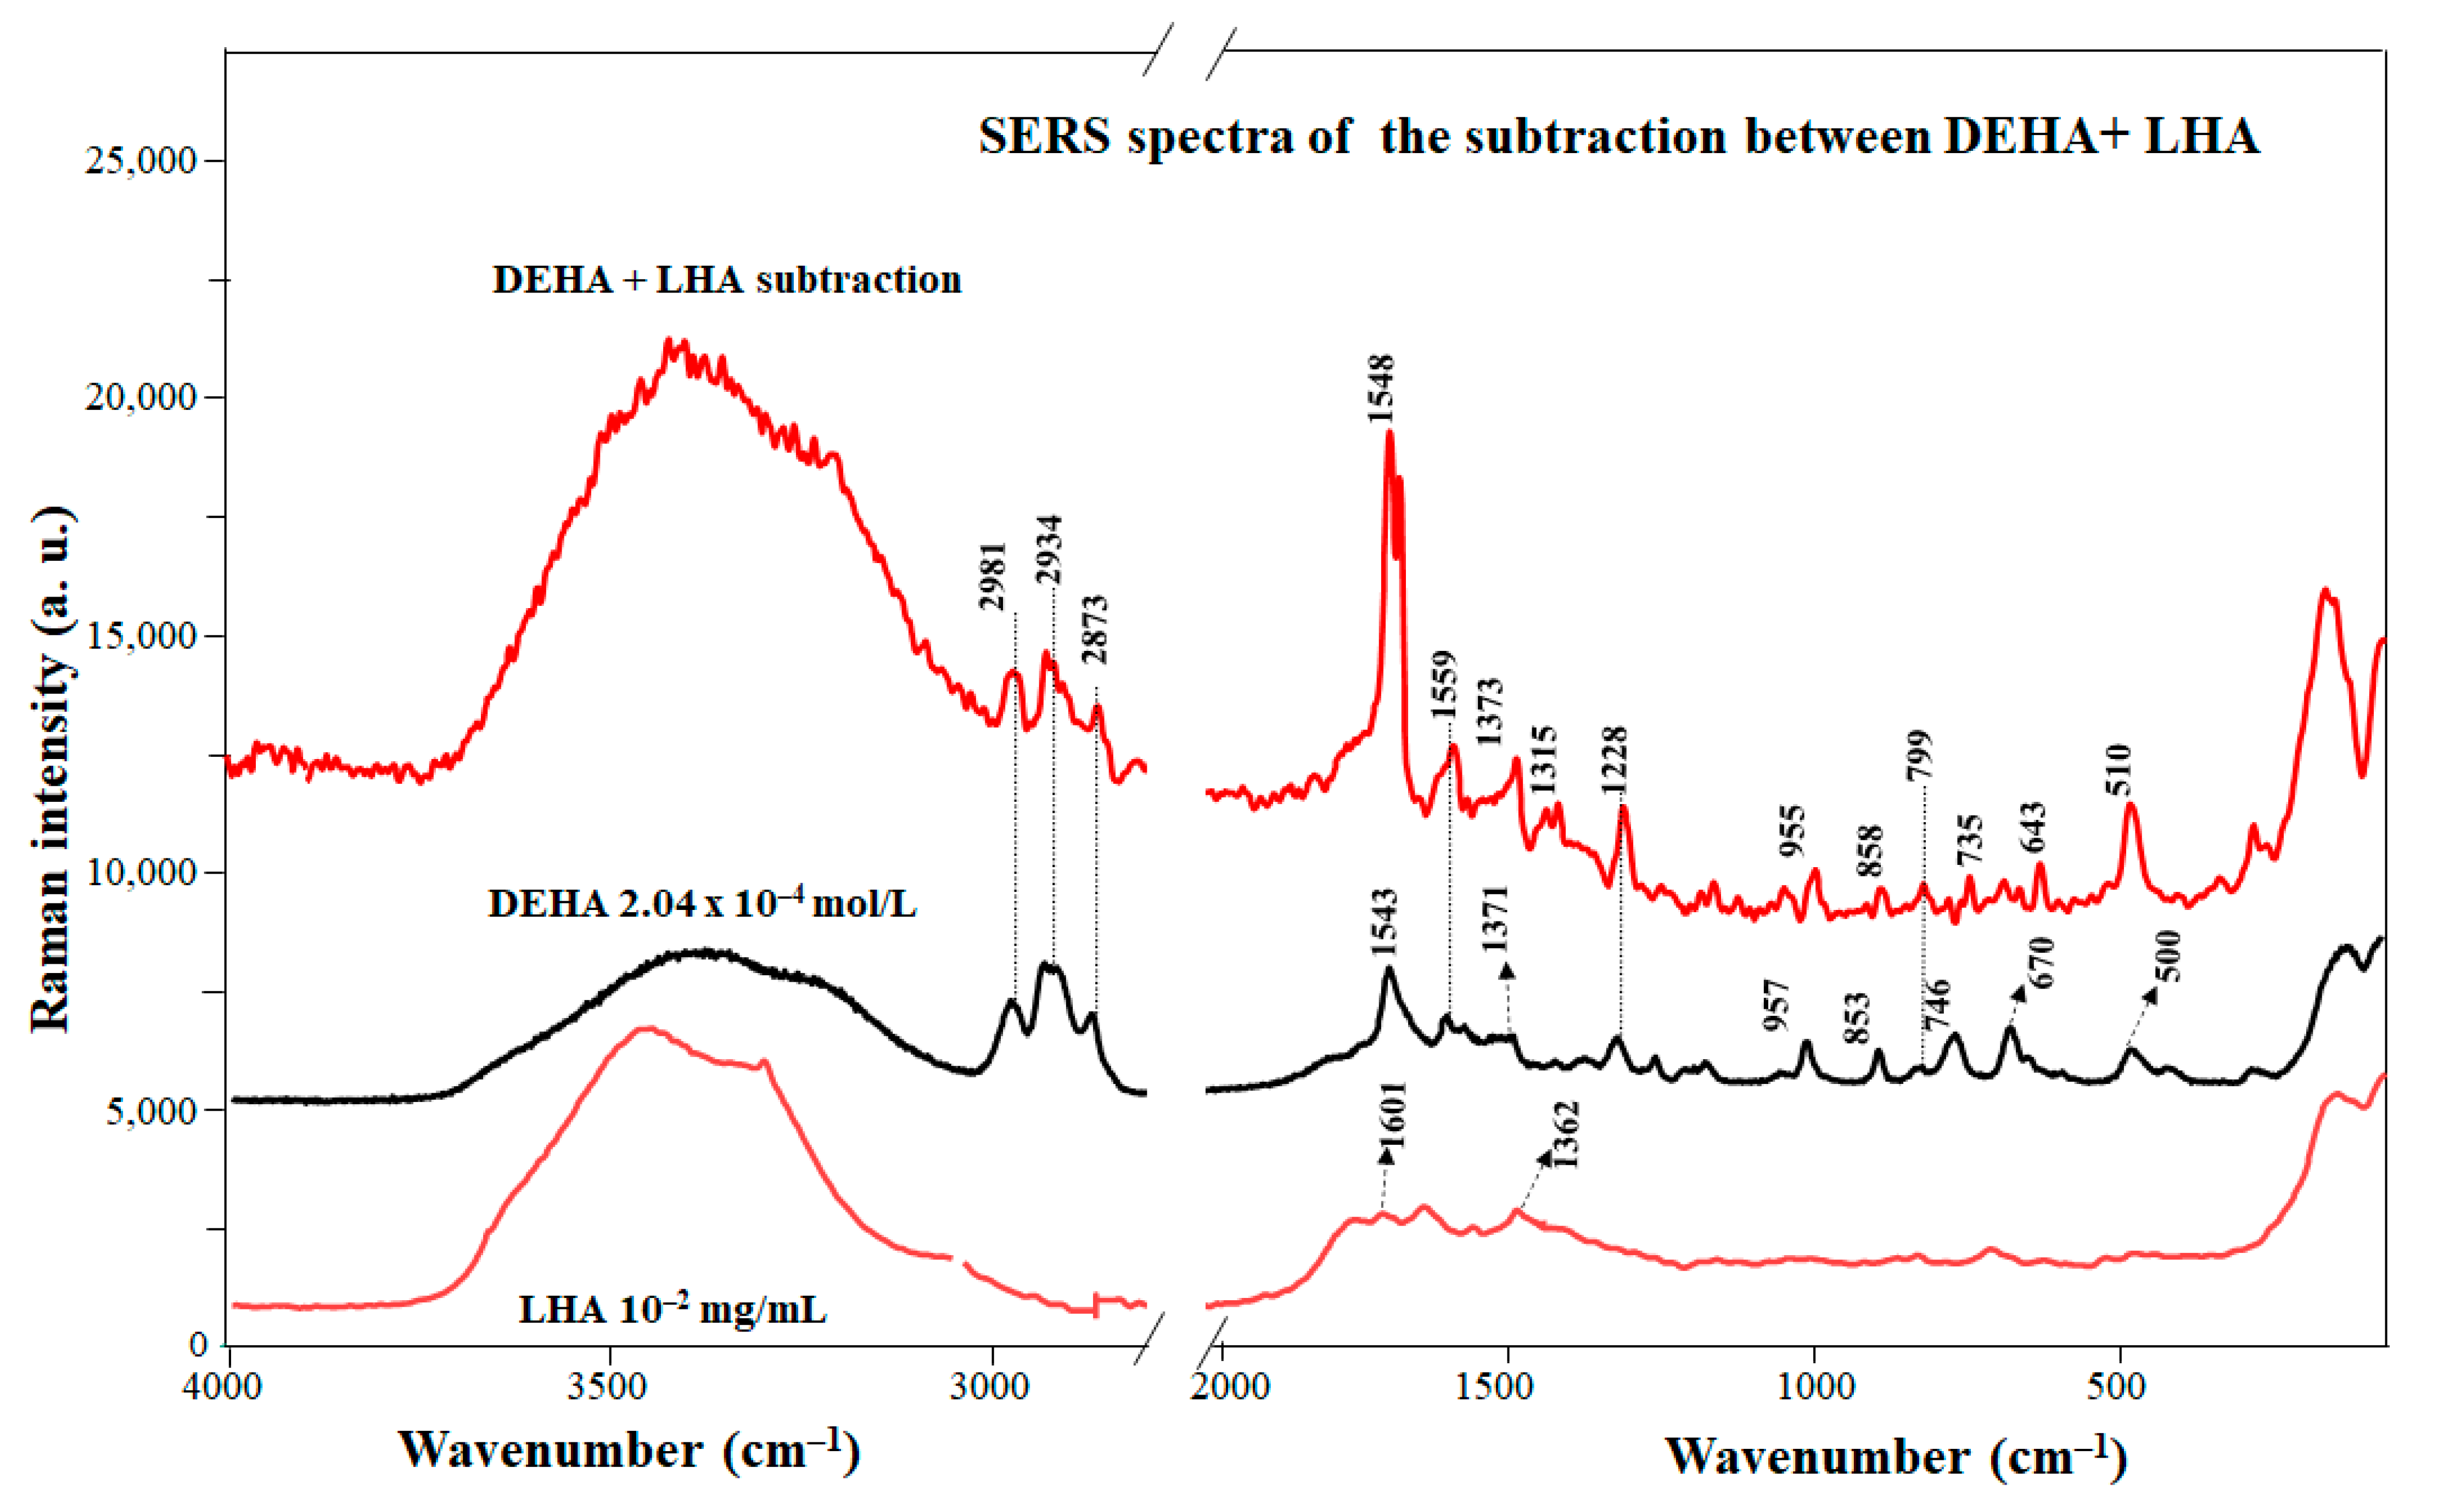
3.4. Interaction of DEHA with Humic Substances

Triazine has shown high affinities with both humic and fulvic acids [18,50,51,52,53]. The interaction ability of humic substances regarding pesticides is enhanced due to the presence of both highly polar and aliphatic groups in their structure [18]. These functional groups present in HS are believed to be the key factor in the dynamics of triazines in soil through the interaction by different mechanisms, both hydrophilic and hydrophobic (Figure 3a). A general description of the interactions between the DEHA and HS is complicated due to their extreme heterogeneity; for this reason, the studies were focused on two IHSS standards: Elliot soil humic acids (EHA) and the Leonaredite humic acids (LHA). EHA are characterized by a high content of acidic functional groups [54,55] and aliphatic moieties compared to LHA, where there is a higher content of aromatic moieties than aliphatic ones [56]. Thus, these HS represent a good reference model for studying the interaction of triazine products with two different structural organic substances. Figure 3b displays the SERS spectrum of DEHA and the difference spectrum of the DEHA/EHA complex (displayed in Figure S2) and that of non-complexed DEHA (at a concentration 10−4 M). The pH of all suspensions was maintained at 8.5 in order to promote the interaction between DEHA and humic substances.
The comparative analysis of the difference spectrum between the DEHA/EHA complex and the SERS of DEHA reveals the presence of bands corresponding to the keto form, specifically those observed at 3500, 1609, and 1522 cm−1. In addition, the bands attributed to the isopropyl chain (748, 2873, 2934, and 2981 cm−1) are also enhanced (Figure 3b). Finally, further evidence of the increasing importance of the keto structure in DEHA/EHA complexes is that the difference ring breathing band appearing at 643 cm−1 is also seen in the keto form of SERS spectra in free DEHA (Figure 2a). The increase of the keto form in complexes with EHA is attributed to the establishment of H-bonds between the high amount of existing acidic functional groups in the EHA (-OH, -COOH) of EHA [18,57] and amino and keto groups in the keto DEHA (Figure 3a).
A focal point of the present study is that the interaction between DEHA and HA depends primarily on the original chemical composition of HA and the pH of the system. In particular, HAs change their conformation from coiling (pH < 5) to uncoiling (pH > 7) at different pH values [58]. Two different interactions between DEHA and LHA/EHA complexes can be inferred: (i) electrostatic interactions and (ii) hydrogen bonding formation. This difference is essentially determined by the composition of the HAs. At alkaline pH, these interactions were particularly strong because of the abundance of negative charges, arising from the deprotonation of the carboxylic groups of the HAs, which favors the DEHA electrostatic attraction.
Figure 4 shows the difference spectrum between the SERS spectra of the DEHA/LHA complex (displayed in Figure S3) and DEHA at pH 8.5. The SERS of LHA is also shown for comparison. As in the case of EHA, the difference spectrum emphasizes better the effect of the HA on the pesticide. In general, the resulting difference bands of the DEHA/LHA complexes correspond to the enol form of DEHA. This is, for instance, corroborated by the presence of characteristic bands of this structure in the SERS difference spectrum observed at 1228 and 1548 cm−1. This fact indicates that DEHA preserves its enolic structure even in the presence of LHA.
Nevertheless, some changes can be seen in the bands concerning the ring vibrations. For instance, the positive bands at 510 and 1228 cm−1 and the most intense band at 1548 cm−1 suggest that the triazine ring must be involved in the interaction with LHA. As can be seen, all the ring vibrations shift towards the position that they adopted in absence of the silver surface. This suggests that DEHA molecules could be detached from the surface and linked to the LHA matrix, a result of π–π stacking between the LHA aromatic rings and the aromatic part of DEHA. Furthermore, the importance of the interaction through aromatic moieties explains why the enolic structure, where the aromatic character is notably higher in relation to that of keto, is enhanced in complexes with LHA.

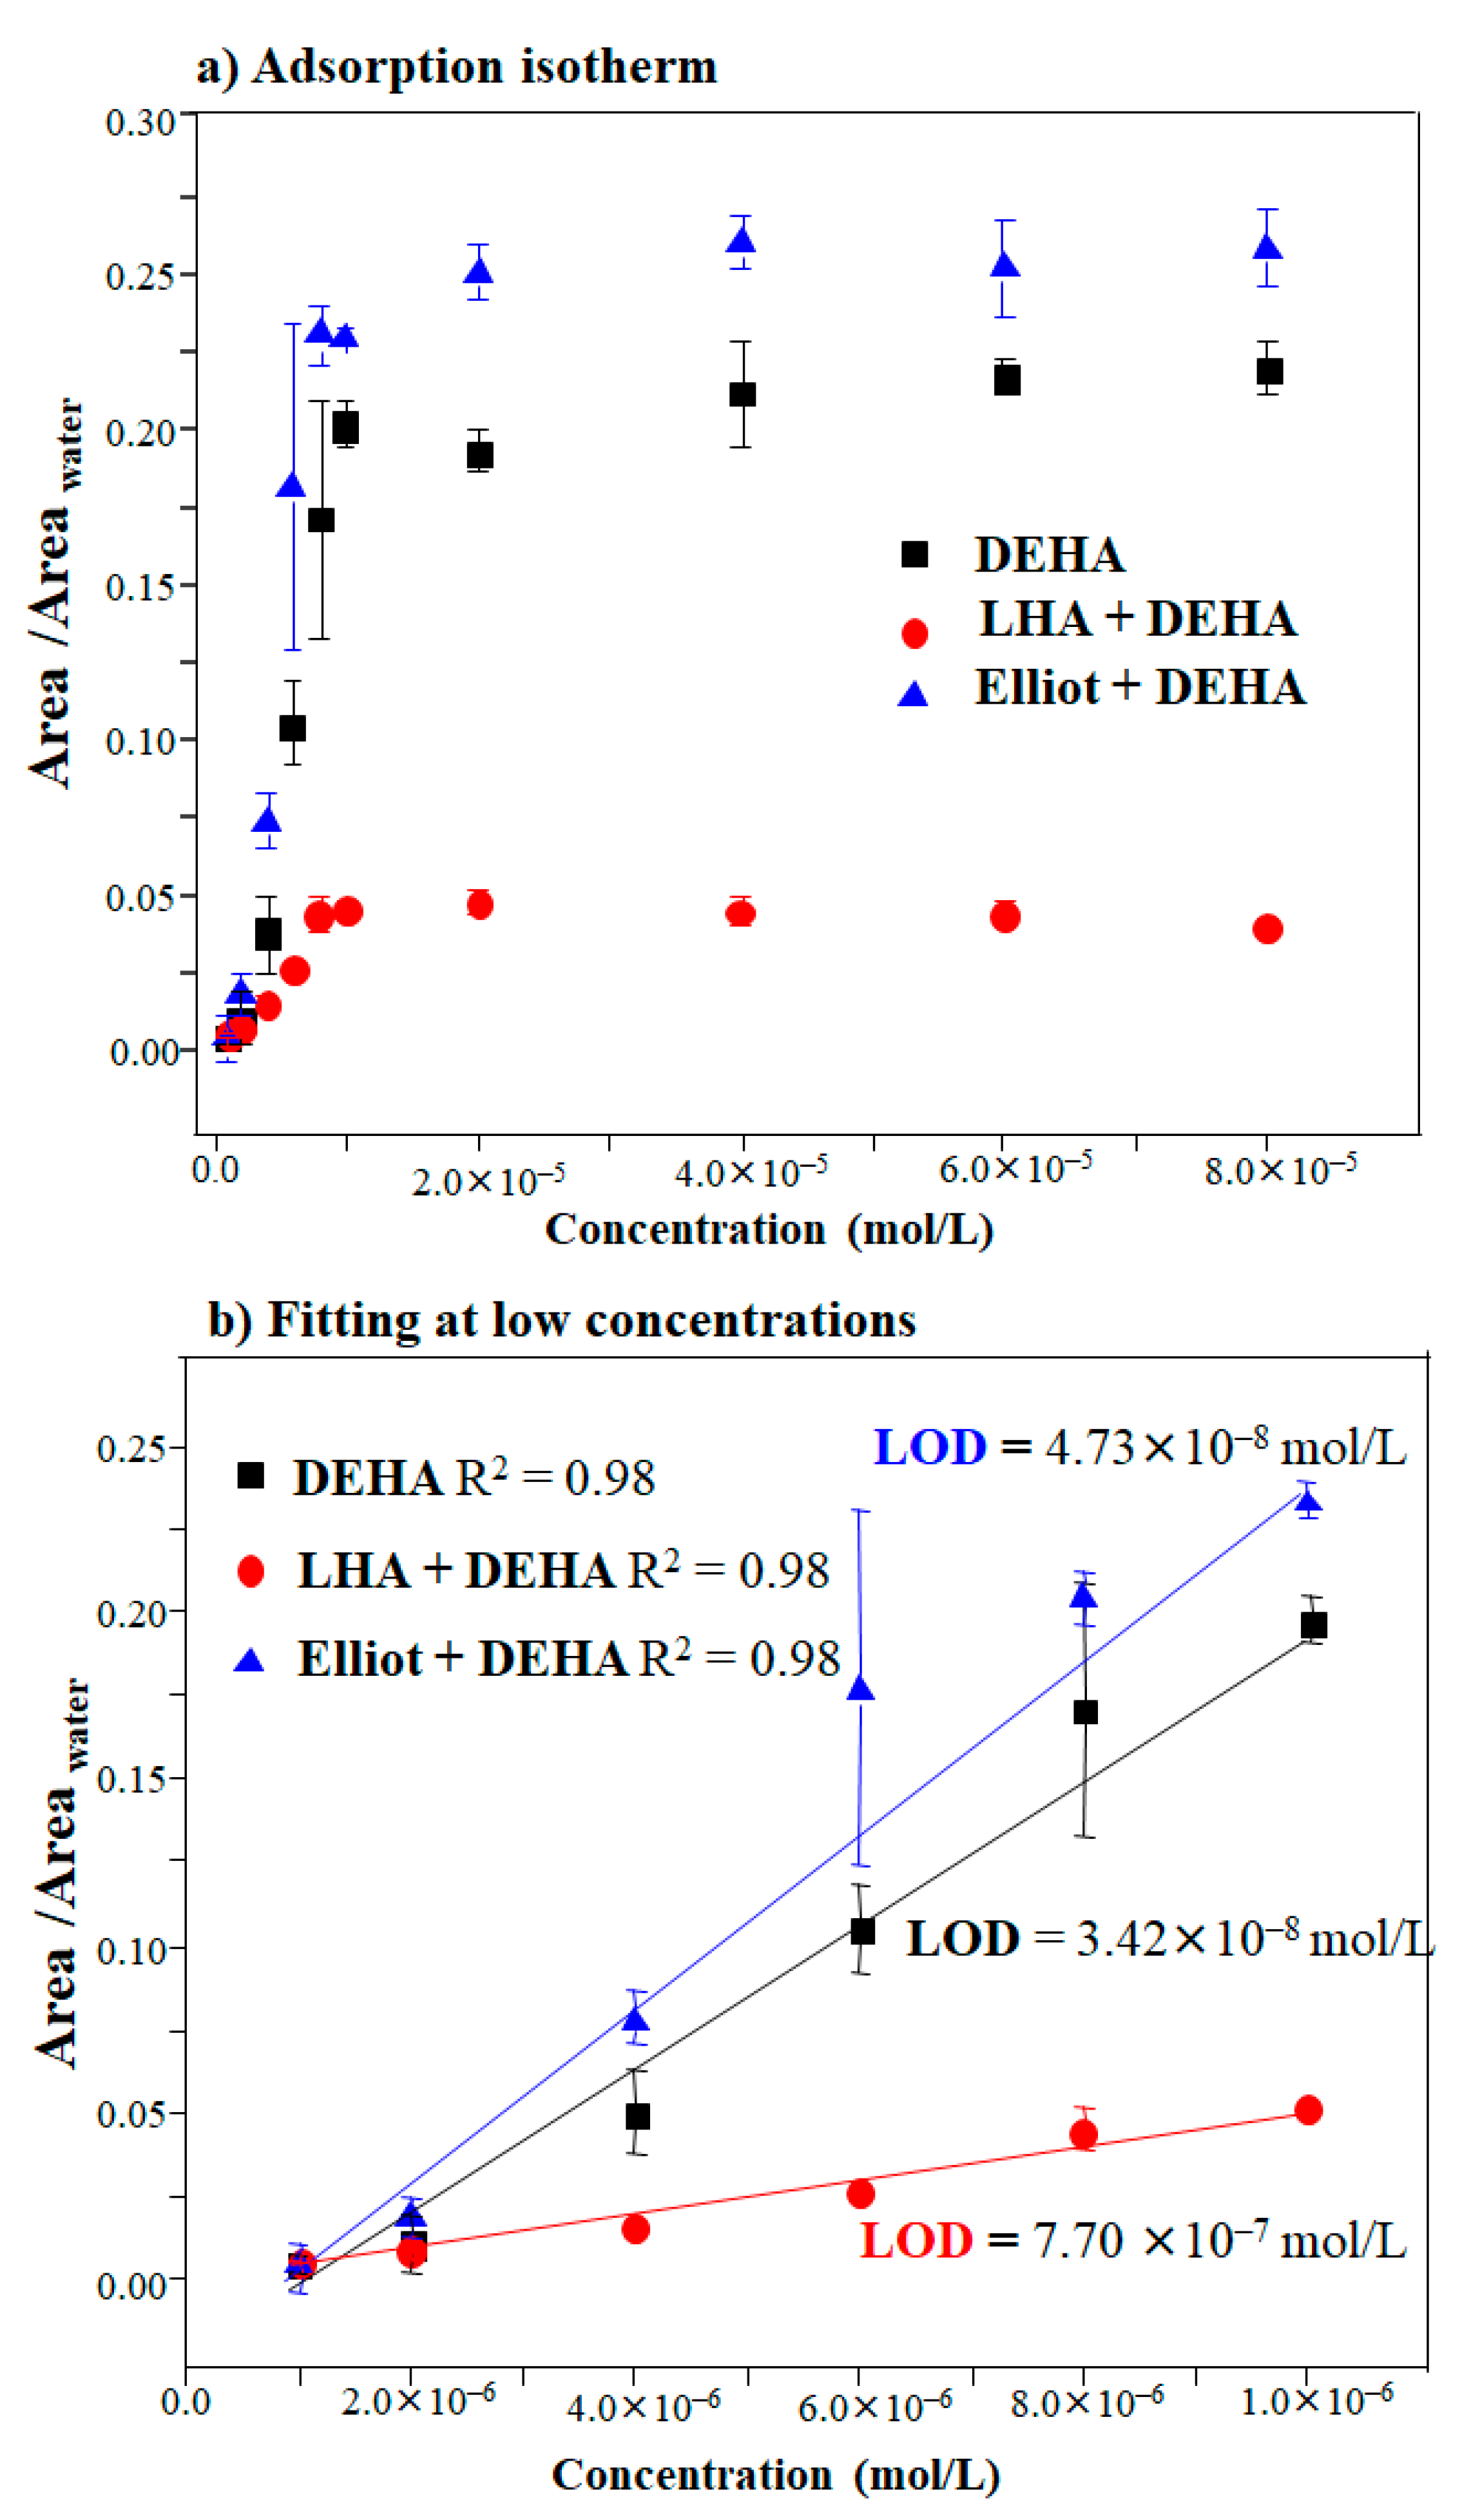
3.5. Quantitative Analysis

In the present study, the limit of detection (LOD) was calculated by considering DEHA in the absence and presence of LHA or EHA, respectively, and testing whether humic acids could enhance or diminish the sensitivity of DEHA detection. In order to deduce both the sensitivity and LOD of the SERS analysis of DEHA, the spectra of DEHA were recorded for concentrations ranging from 2.04 × 10⁻⁶ to 1.63 × 10⁻⁴ mol/L on AgNPs nanoparticles (Figure S4) at pH 8.5. This pH value was selected because it corresponds to pH conditions at which the SERS of DEHA can be measured at optimal intensity for all the analyzed cases. The SERS intensity versus concentration curve (Figure 5) was obtained by calculating the ratio between the area of the 1483–1575 cm−1 region and the integrated area between 3020 and 3750 cm−1 at different DEHA concentrations regarding Figures S2–S4. The curve was plotted considering three experimental measures for every concentration. The curves of Figure 5a can be adjusted to Langmuir isotherms [59,60], where the concentration-dependent calibration curve can be fitted to the following expression:
θ = ϕ ϕ 0 = K a d · [ DEHA ] 1 + K a d · [ DEHA ]
where φ0 is the maximum number of molecules that can be adsorbed on the AgNPs surface and φ is the number of molecules adsorbed, while Kad is the DEHA adsorption constant. Here [DEHA] is the concentration of DEHA molecules in the bulk, but we can assume that it actually corresponds to the total number of molecules, due to the fact that the number of molecules adsorbed on the metal surface is negligible in comparison to the total one. Before the saturation point, the SERS intensity (ISERS) exhibits a linear dependence with the number of adsorbed molecules ( I S E R S = α · φ ) and reaches a maximum when all nanoparticles are completely covered with the adsorbate. At this saturation point, we have I s m = α · φ 0 , where Ism is the SERS intensity at saturation. Thus, the θ = φ φ 0 ratio can be rewritten in terms of the ISERS/Ism ratio as follows:
I S E R S I s m = K a d · [ DEHA ] 1 + K a d · [ DEHA ]
and from this we lead to [61]:
I S E R S = K a d · I s m · [ DEHA ] 1 + K a d · [ DEHA ]
The Langmuir-like behavior of the DEHA adsorption suggests that this molecule forms a monolayer onto the AgNPs surface that reaches a saturation at a limit concentration of ca. 1 × 10⁻⁵ mol/L (Figure 5a). Before this threshold, the SERS intensity follows a linear dependence on the DEHA concentration displayed in Figure 5b where the linear dependence can be expressed in the following way: I S E R S = K a d · I s m · [ DEHA ] . The LOD value was calculated from this linear dependence as shown in Figure 5b, by considering the concentration [DEHA]LOD at which a relative intensity of I′SERS = 3σ is obtained, with σ being the standard deviation of the blank measurement [33].
The black line in Figure 5b shows the theoretical fitting in the linear region. The LOD calculated for the detection of DEHA corresponded to the concentration of 3.42 × 10⁻⁸ mol/L (6 ppb), which is in the same range of detection of other works [22,33,62,63,64,65].
SERS spectra of DEHA/HA were also obtained at different DEHA concentrations in a range of concentration from 2.04 × 10⁻⁶ to 1.63 × 10⁻⁴ mol/L, keeping the concentration of the humic acid constant (Figures S3 and S4).
The LOD and sensitivity (IsmKad) of the values for DEHA and the DEHA/HA complex deduced from the latter treatment are shown in Table 1. As can be seen, the sensitivity of the DEHA detection varied in the following order: EHA/DEHA > DEHA alone > LHA/DEHA. The greater sensitivity achieved with EHA is probably related to the higher degree of affinity of interaction of this substance with DEHA. Thus, this humic acid can attract more DEHA molecules to the surface due to the occlusive effect of the macromolecules, which can act as actual DEHA accumulators, even if some of the pesticide molecules are not so close to the surface. On the contrary, the sensitivity is very much reduced when using LHA. This is attributed to the formation of π–π interactions between the aromatic rings of LHA and DEHA that may lead to a detachment of DEHA from the surface, which causes a lowering of the SERS intensity.

4. Conclusions

Although triazines have been banned in many countries, the impact of degradation products on the environment and human health has yet to be elucidated. In the present study, it was shown that DEHA, one of the major degradation products found in the environment, can be sensitively and selectively detected by SERS using AgNPs. A tight pH dependence of DEHA through protonation and tautomerization of the molecule itself has also emerged, which was found to be well identified by SERS. A relevant issue related to the structure of DEHA that can have a great impact on the environment is its molecular modification by protonation and tautomerization. All of this can be revealed by the vibrational spectra provided by SERS. Theoretical calculation of these spectra was very useful for the identification of key structural bands related to the two DEHA tautomeric forms: enol and keto. From this analysis, it was deduced that solid DEHA has a keto structure.
This molecule is able to interact with the silver surface in AgNPs, leading to an aggregation of the NPs suspension. Moreover, the adsorption mechanism of DEHA on AgNPs takes place through the interaction between the oxygen atom of the keto form of DEHA and the Ag surface. As a consequence of this interaction, DEHA is adsorbed under the enolate form at pH above 7.5. Under this value, DEHA in the keto form is also seen, and the SERS intensity decreases. Therefore, the DEHA tautomerization and the interaction of DEHA with the metal surface strongly depend on the pH.
The interaction of DEHA with two standard reference humic acids was also developed in an attempt to increase the sensitivity of the technique. SERS spectra in particular revealed a marked difference between the two humic acids’ standards in terms of chemical composition and reactivity towards DEHA. In particular, EHA leads to an increase in the sensitivity, while SERS spectra reveal an increase in the keto structure. This phenomenon is closely related to the higher content of oxygenated functional groups that are characteristic of Elliot soil humic acid. By contrast, the interaction of DEHA with LHA reduces the sensitivity of the detection, giving rise to a higher LOD value. In addition, LHA induced major changes in the bands associated with the aromatic ring vibrations, and this is associated with the higher content of aromatic rings present in the leonardite humic acid.
The results presented in this study have clearly demonstrated that SERS spectroscopy is a very powerful technique for characterizing DEHA at a very low concentration in water and also for analyzing the interaction with humic substances.

Supplementary Materials

The following are available online at https://www.mdpi.com/article/10.3390/chemosensors9060148/s1, Table S1: Wavenumbers and assignments of theoretical DEHA keto and enolic forms and comparison with the experimental spectra. Figure S1: UV-Vis extinction and TEM characterization of the AgNPs employed in this work. Figure S2: DEHA + LHA SERS spectra at different concentrations of DEHA at pH 8.5. Figure S3: DEHA + Eliott soil SERS spectra at different concentrations of DEHA at pH 8.5. Figure S4: DEHA SERS spectra at different concentrations at pH 8.5.

Author Contributions

We declare that each author has made substantial contributions to the conception or design of the work, both the theoretical and experimental works developed for the acquisition, analysis, or interpretation of data developed to create this paper. Likewise, all authors have approved the submitted version and agree to be personally accountable for the author’s own contributions and for ensuring that questions related to the accuracy or integrity of any part of the work, even ones in which the author was not personally involved, are appropriately investigated, resolved, and documented in the literature. The contribution of the different authors can be summarized as follows: conceptualization, S.S.-C., C.J.L.C. and O.F.; formal analysis, R.J.G.R. and G.Z.; funding acquisition, S.S.-C., C.J.L.C. and O.F.; investigation, R.J.G.R., G.Z. and M.V.C.; methodology, R.J.G.R., G.Z. and M.V.C.; project administration, S.S.-C., C.J.L.C. and O.F.; resources, S.S.-C. and O.F.; supervision, S.S.-C.; writing—original draft, R.J.G.R. and G.Z.; writing—review and editing, S.S.-C., C.J.L.C., O.F. and M.V.C. We also declare that all authors contributed to revise the sections of the manuscript and read and approved the submitted version. All authors have read and agreed to the published version of the manuscript.

Funding

This research received funding from the University of Bologna (RFO 2020), FAPESP (2020/05423-0, 2016/09634-0; 2018/04628-8) and the MINECO/FEDER project FIS2017-84318-R.

Institutional Review Board Statement

Not applicable.

Informed Consent Statement

Not applicable.

Data Availability Statement

Not applicable.

Conflicts of Interest

The authors declare no conflict of interest.

References

  1. Barceló, D. Occurrence, handling and chromatographic determination of pesticides in the aquatic environment. A review. Analyst 1991, 116, 681–689. [Google Scholar] [CrossRef] [PubMed]
  2. Yaseen, T.; Pu, H.; Sun, D.-W. Functionalization techniques for improving SERS substrates and their applications in food safety evaluation: A review of recent research trends. Trends Food Sci. Technol. 2018, 72, 162–174. [Google Scholar] [CrossRef]
  3. Rehan, M. Microbial biodegradation of S-triazine herbicides in soil. JCRF 2016, 1, 1–3. [Google Scholar] [CrossRef]
  4. Mandelbaum, R.T.; Wackett, L.P.; Allan, D.L. Mineralization of the S-triazine by stable bacterial mixed cultures. Appl. Environ. Microbiol. 1993, 59, 1695–1701. [Google Scholar] [CrossRef] [PubMed] [Green Version]
  5. Almeida Lage, A.L.; Ribeiro, J.M.; de Souza-Fagundes, E.M.; Brugnera, M.F.; Martins, D.C.d.S. Efficient atrazine degradation catalyzed by manganese porphyrins: Determination of atrazine degradation products and their toxicity evaluation by human blood cells test models. J. Hazard. Mater. 2019, 378, 120748. [Google Scholar] [CrossRef] [PubMed]
  6. Binet, F.; Kersanté, A.; Munier-Lamy, C.; Le Bayon, R.-C.; Belgy, M.-J.; Shipitalo, M.J. Lumbricid macrofauna alter atrazine mineralization and sorption in a silt loam soil. Soil Biol. Biochem. 2006, 38, 1255–1263. [Google Scholar] [CrossRef] [Green Version]
  7. Ben-Hur, M.; Letey, J.; Farmer, W.J.; Williams, C.F.; Nelson, S.D. Soluble and solid organic matter effects on atrazine adsorption in cultivated soils. Soil Sci. Soc. Am. J. 2003, 67, 1140–1146. [Google Scholar] [CrossRef]
  8. Piccolo, A.; Conte, P.; Scheunert, I.; Paci, M. Atrazine interactions with soil humic substances of different molecular structure. J. Environ. Qual. 1998, 27, 1324–1333. [Google Scholar] [CrossRef]
  9. Martin-Neto, L.; Traghetta, D.G.; Vaz, C.M.P.; Crestana, S.; Sposito, G. On the interaction mechanisms of atrazine and hydroxyatrazine with humic substances. J. Environ. Qual. 2001, 30, 520–525. [Google Scholar] [CrossRef] [PubMed]
  10. Abate, G.; Penteado, J.C.; Cuzzi, J.D.; Vitti, G.C.; Lichtig, J.; Masini, J.C. Influence of Humic acid on adsorption and desorption of atrazine, hydroxyatrazine, deethylatrazine, and deisopropylatrazine onto a clay-rich soil sample. J. Agric. Food Chem. 2004, 52, 6747–6754. [Google Scholar] [CrossRef]
  11. Tao, Q.-H.; Tang, H.-X. Effect of dye compounds on the adsorption of atrazine by natural sediment. Chemosphere 2004, 56, 31–38. [Google Scholar] [CrossRef]
  12. Celano, G.; Šmejkalová, D.; Spaccini, R.; Piccolo, A. Interactions of three s-triazines with humic acids of different structure. J. Agric. Food Chem. 2008, 56, 7360–7366. [Google Scholar] [CrossRef] [PubMed]
  13. Mulbry, W.W. Purification and characterization of an inducible s-triazine hydrolase from Rhodococcus corallinus NRRL B-15444R. Appl. Environ. Microbiol. 1994, 60, 613–618. [Google Scholar] [CrossRef] [Green Version]
  14. Lin, C.H.; Lerch, R.N.; Garrett, H.E.; George, M.F. Bioremediation of Atrazine-contaminated soil by forage grasses: Transformation, uptake, and detoxification. J. Environ. Qual. 2008, 37, 196–206. [Google Scholar] [CrossRef] [Green Version]
  15. Lovley, D.R.; Coates, J.D.; Blunt-Harris, E.L.; Phillips, E.J.P.; Woodward, J.C. Humic substances as electron acceptors for microbial respiration. Nature 1996, 382, 445–448. [Google Scholar] [CrossRef]
  16. Olu-Owolabi, B.I.; Diagboya, P.N.; Okoli, C.P.; Adebowale, K.O. Sorption behaviour of pentachlorophenol in sub-Saharan tropical soils: Soil types sorption dynamics. Environ. Earth Sci. 2016, 75, 1494. [Google Scholar] [CrossRef]
  17. Barrett, M.R. The Environmental Impact of Pesticide Degradates in Groundwater. In ACS Symposium Series; Meyer, M.T., Thurman, E.M., Eds.; American Chemical Society: Washington, DC, USA, 1996; Volume 630, pp. 200–225. [Google Scholar] [CrossRef]
  18. LeBaron, H.M.; McFarland, J.E.; Burnside, O.C.; Farland, M.; Burnside, O. The Triazine Herbicides: A Milestone in the Development of Weed Control Technology. In The Triazine Herbicides: 50 Years Revolutionizing Agriculture, 1st ed.; LeBaron, H.M., McFarland, J.E., Burnside, O.C., Eds.; Elsevier: San Diego, CA, USA, 2008; pp. 1–12. [Google Scholar]
  19. Steelink, C.; Tollin, G. Free radicals in soil. In Soil Biochemistry; McLaren, A.D., Peterson, G.M., Eds.; Dekker: New York, NY, USA, 1967; pp. 147–169. [Google Scholar]
  20. Crosby, D.G. Nonbiological degradation of herbicides in the soil. In Herbicides: Physiology, Biochemistry, and Ecology; Audus, L.J., Ed.; Academic Press: New York, NY, USA, 1976; Volume 2, pp. 65–97. [Google Scholar]
  21. Laird, D.A.; Koskinen, W. Triazine Soil Interactions. The Triazine Herbicides: 50 Years Revolutionizing Agriculture, 1st ed.; LeBaron, H.M., McFarland, J.E., Burnside, O.C., Eds.; Elsevier: San Diego, CA, USA, 2008; pp. 275–299. [Google Scholar]
  22. Oliveira, M.J.S.; Rubira, R.J.G.; Furini, L.N.; Batagin-Neto, A.; Constantino, C.J.L. Detection of thiabendazole fungicide/parasiticide by SERS: Quantitative analysis and adsorption mechanism. Appl. Surf. Sci. 2020, 517, 145786. [Google Scholar] [CrossRef]
  23. Mandelbaum, R.T.; Wackett, L.P.; Allan, D.L. Rapid hydrolysis of atriazine to hydroxyatrazine by soil bacteria. Environ. Sci. Technol. 1993, 27, 1943–1946. [Google Scholar] [CrossRef]
  24. Rubira, R.J.G.; Constantino, C.J.L.; Otero, J.C.; Sanchez-Cortes, S. Abiotic degradation of s-triazine pesticides analyzed by surface-enhanced Raman scattering. J. Raman Spectrosc. 2020, 51, 264–273. [Google Scholar] [CrossRef]
  25. Klementova, S.; Piskova, V. UV Photodegradation of triazines atrazine, simazine and propazine and of atrazine metabolites desethylatrazine and desisopropylatrazine. Res. J. Chem. Environ. 2005, 4, 20–23. [Google Scholar]
  26. Calderbank, A. The occurrence and significance of bound pesticide residues in soil. Rev. Environ. Contam. Toxicol. 1989, 108, 71–103. [Google Scholar] [CrossRef]
  27. Johnson, R.M.; Halaweish, F.; Furmann, J.J. Analysis of atrazine and associated metabolites by reverse-phase high performance thin layer chromatography. J. Liq. Chromatogr. 1992, 15, 2941–2957. [Google Scholar] [CrossRef]
  28. Aroca, R. Surface-Enhanced Vibrational Spectroscopy; John Wiley & Sons, Ltd.: Chichester, UK, 2006. [Google Scholar]
  29. Moskovits, M. Surface-enhanced spectroscopy. Rev. Mod. Phys. 1985, 57, 783–826. [Google Scholar] [CrossRef]
  30. Wokaun, A. Surface enhancement of optical fields: Mechanism and applications. Mol. Phys. 1985, 56, 1–33. [Google Scholar] [CrossRef]
  31. Guerrini, L.; Campos-Vallette, M.; Domingo, C.; Garcia-Ramos, J.V.; Sanchez-Cortes, S.L.P. Detection of persistent organic pollutants using SERS sensors based on organically functionalized Ag nanoparticles. In Surface Enhanced Raman Spectroscopy; Schlücker, S., Ed.; Wiley: Hoboken, NJ, USA, 2010; pp. 103–128. [Google Scholar]
  32. Cañamares, M.V.; Garcia-Ramos, J.V.; Gómez-Varga, J.D.; Domingo, C.; Sanchez-Cortes, S. Comparative Study of the Morphology, Aggregation, Adherence to Glass, and Surface-Enhanced Raman Scattering Activity of Silver Nanoparticles Prepared by Chemical Reduction of Ag + Using Citrate and Hydroxylamine. Langmuir 2005, 21, 8546–8553. [Google Scholar] [CrossRef]
  33. Furini, L.N.; Sanchez-Cortes, S.; López-Tocón, I.; Otero, J.C.; Aroca, R.F.; Constantino, C.J.L. Detection and quantitative analysis of carbendazim herbicide on Ag nanoparticles via surface-enhanced Raman scattering. J. Raman Spectrosc. 2015, 46, 1095–1101. [Google Scholar] [CrossRef]
  34. International Union of Pure and Applied Chemistry (IUPAC). Available online: https://iupac.org/greeniupac2016/ (accessed on 1 December 2017).
  35. Zheng, G.; Lundberg, M.; Jakowski, J.; Vreven, T.; Frisch, M.J.; Morokuma, K. Implementation and benchmark tests of the DFTB method and its application in the ONIOM method. Int. J. Quantum Chem. 2009, 109, 1841–1854. [Google Scholar] [CrossRef] [Green Version]
  36. Merrick, J.P.; Moran, D.; Radom, L. An evaluation of harmonic vibrational frequency scale factors. J. Phys. Chem. A 2007, 111, 11683–11700. [Google Scholar] [CrossRef] [PubMed]
  37. Rubira, R.J.G.; Furini, L.N.; Constantino, C.J.L.; Sanchez-Cortes, S. SERS detection of prometryn herbicide based on its optimized adsorption on Ag nanoparticles. Vib. Spectrosc. 2021, 114, 103245. [Google Scholar] [CrossRef]
  38. Skipper, H.D.; Volk, V.V.; Mortland, M.M.; Raman, K.V. Hydrolysis of atrazine on soil colloids. Weed Sci. 1978, 26, 46–51. [Google Scholar] [CrossRef]
  39. Schmidt, M.; Bréchignac, C. Silver and oxygen: Transition from clusters to nanoparticles. Comptes Rendus Phys. 2016, 17, 481–484. [Google Scholar] [CrossRef] [Green Version]
  40. Dhafer, C.E.B.; Mezni, A.; Smiri, L.S. Surface-enhanced Raman scattering study of Ag-PVP interactions in the biocompatible Ag@PVP nanoparticles. J. Tunis. Chem. Soc. 2017, 19, 152–157. [Google Scholar]
  41. Gao, Y.; Jiang, P.; Liu, D.F.; Yuan, H.J.; Yan, X.Q.; Zhou, Z.P.; Wang, J.X.; Song, L.; Liu, L.F.; Zhou, W.Y.; et al. Evidence for the Monolayer Assembly of Poly(vinylpyrrolidone) on the surfaces of silver nanowires. J. Phys. Chem. B 2004, 108, 12877–12881. [Google Scholar] [CrossRef]
  42. Mdluli, P.S.; Sosibo, N.M.; Revaprasadu, N.; Karamanis, P.; Leszczynski, J. Surface enhanced Raman spectroscopy (SERS) and density functional theory (DFT) study for understanding the regioselective adsorption of pyrrolidinone on the surface of silver and gold colloids. J. Mol. Struct. 2009, 935, 32–38. [Google Scholar] [CrossRef]
  43. Chowdhury, U.K.; Biswas, B.K.; Chowdhury, T.R.; Samanta, G.; Mandal, B.K.; Basu, G.C.; Chanda, C.R.; Lodh, D.; Saha, K.C.; Mukherjee, S.K.; et al. Groundwater arsenic contamination in Bangladesh and West Bengal, India. Environ. Health Perspect. 2000, 108, 393–397. [Google Scholar] [CrossRef] [PubMed]
  44. Baia, M.; Astilean, S.; Iliescu, T. Raman and SERS Investigations of Pharmaceuticals; Springer: Berlin/Heidelberg, Germany, 2008; ISBN 9783540782827. [Google Scholar]
  45. Hirt, R.C.; Schmitt, R.G. Ultraviolet absorption spectra ot derivatives of symmetric triazine—II. Spectrochim. Acta 1958, 12, 127–138. [Google Scholar] [CrossRef]
  46. Boitsov, E.N.; Finkel’shtein, A.I. Optical investigation of the molecular structure of s-triazine derivatives. VI. Ultraviolet absorption spectra of aqueous solution of cyanuric acid derivatives at various pH. Opt. Spectrosc. 1960, 9, 26–28. [Google Scholar]
  47. Ward, T.M.; Weber, J.B. Aqueous solubility of alkylamino-s-triazine as a function of pH and molecular structure. J. Agric. Food Chem. 1968, 16, 959–961. [Google Scholar] [CrossRef]
  48. Skipper, H.D.; Volk, V.V. Biological and chemical degradation of atrazine in three oregon soils. Weed Sci. 1972, 20, 344–347. [Google Scholar] [CrossRef]
  49. Mircescu, N.E.; Oltean, M.; Chiş, V.; Leopold, N. FTIR, FT-Raman, SERS and DFT study on melamine. Vib. Spectrosc. 2012, 62, 165–171. [Google Scholar] [CrossRef]
  50. Hayes, M.H.B. Adsorption of triazine herbicides on soil organic matter, including a short review on soil organic matter chemistry. In Single Pesticide Volume: The Triazine Herbicides; Gunther, F.A., Gunther, J.D., Eds.; Springer Science and Business Media LLC: New York, NY, USA, 1970; pp. 131–174. [Google Scholar] [CrossRef]
  51. Stevenson, F.J. Organic matter reactions involving herbicides in soil. J. Environ. Qual. 1972, 1, 333–343. [Google Scholar] [CrossRef]
  52. Senesi, N.; D’Orazio, V.; Miano, T.M. Adsorption mechanisms of s-triazine and bipyridylium herbicides on humic acids from hop field soils. Geoderma 1995, 66, 273–283. [Google Scholar] [CrossRef]
  53. Gorup, L.F. Nanopartículas Coloidais de ouro e Prata e sua Funcionalização com Dibutil-Doicalgenetos. Master’s Thesis, Universidade de São Paulo, São Carlos, Brazil, 2010. [Google Scholar]
  54. Korak, J.; Rosario-Ortiz, F.L.; Summers, R.S. Fluorescence Characterization of Humic Substance Coagulation: Application of New Tools to an Old Process. In Advances in the Physicochemical Characterization of Organic Matter, ACS Symposium Serie; Rosario-Ortiz, F.L., Ed.; American Chemical Society: Washington, DC, USA, 2014; Volume 1160, pp. 281–300. [Google Scholar] [CrossRef]
  55. Ritchie, J.D.; Perdue, E.M. Proton-binding study of standard and reference fulvic acids, humic acids, and natural organic matter. Geochim. Cosmochim. Acta 2003, 67, 85–96. [Google Scholar] [CrossRef]
  56. Thorn, K.A.; Folan, D.W.; McCarthy, P. Characterization of the International Humic Substances Society Standard and Reference Fulvic and Humic Acids by Solution State Carbon-13 (13c) and Hydrogen-1 (1h) Nuclear Magnetic Resonance Spectrometry; Water-Resources Investigations Report 89-4196; U.S. Geological Survey: Denver, CO, USA, 1989.
  57. Kalouskova, N. Adsorption of atrazine on humic acids. J. Environ. Sci. Health Part B 1989, 24, 599–617. [Google Scholar] [CrossRef]
  58. Corrado, G.; Sanchez-Cortes, S.; Francioso, O.; Garcia-Ramos, J.V. Surface-enhanced Raman and fluorescence joint analysis of soil humic acids. Anal. Chim. Acta 2008, 616, 69–77. [Google Scholar] [CrossRef] [PubMed]
  59. Langmuir, I. The constitution and fundamental properties of solids and liquids. II. Liquids. 1. J. Am. Chem. Soc. 1917, 39, 1848–1906. [Google Scholar] [CrossRef] [Green Version]
  60. Langmuir, I. The constitution and fundamental properties of solids and liquids. Part I. Solids. J. Am. Chem. Soc. 1916, 38, 2221–2295. [Google Scholar] [CrossRef] [Green Version]
  61. Izquierdo-Lorenzo, I.; Sanchez-Cortes, S.; Garcia-Ramos, J.V. Adsorption of beta-adrenergic agonists used in sport doping on metal nanoparticles: A detection study based on surface-enhanced raman scattering. Langmuir 2010, 26, 14663–14670. [Google Scholar] [CrossRef] [PubMed]
  62. Saleh, N.; Al-Rawashdeh, N.A.F. Fluorescence enhancement of carbendazim fungicide in cucurbit[6]uril. J. Fluoresc. 2006, 16, 487–493. [Google Scholar] [CrossRef]
  63. Liu, B.; Zhou, P.; Liu, X.; Sun, X.; Li, H.; Lin, M. Detection of pesticides in fruits by surface-enhanced raman spectroscopy coupled with gold nanostructures. Food Bioprocess. Technol. 2013, 6, 710–718. [Google Scholar] [CrossRef]
  64. Luo, S.; Wu, Y.; Gou, H. A voltammetric sensor based on GO–MWNTs hybrid nanomaterial-modified electrode for determination of carbendazim in soil and water samples. Ionics 2013, 19, 673–680. [Google Scholar] [CrossRef]
  65. Janči, T.; Mikac, L.; Ivanda, M.; Marušić Radovčić, N.; Medić, H.; Vidaček, S. Optimization of parameters for histamine detection in fish muscle extracts by surface-enhanced Raman spectroscopy using silver colloid SERS substrates. J. Raman Spectrosc. 2017, 48, 64–72. [Google Scholar] [CrossRef]
Figure 1. Raman spectrum of the DEHA powder and DEHA calculated spectra in keto and enol form.
Chemosensors 09 00148 g001
Figure 2. (a) DEHA SERS spectra (10−4 mol/L) obtained at different pHs (the spectra are normalized separately). (b) Adsorption mechanism on the silver surface in the keto and enol form. (c) Variation of the integrated areas of band at different pHs.
Chemosensors 09 00148 g002
Figure 3. (a) Mechanisms of interactions between DEHA in the presence of EHA (1 mg/mL). (b) SERS spectrum of the DEHA/EHA complex and non–complexed DEHA.
Chemosensors 09 00148 g003
Figure 4. SERS spectrum of the DEHA/LHA complex and non-complexed DEHA.
Chemosensors 09 00148 g004
Figure 5. (a) Langmuir-type adsorption isotherm of DEHA in the absence and presence of LHA and EHA onto AgNPs (colloid) and (b) its linear fitting at low concentrations.
Chemosensors 09 00148 g005
Table 1. Analytical parameters obtained from the calibration curve and used in the LOD calculations.
SampleSensitivity
(IsmKad)
Limit of Detection
EHA + DEHA32734.73 × 10−8 mol/L8 ppb
DEHA21493.42 × 10−8 mol/L6 ppb
LHA + DEHA337.70 × 10−7 mol/L130 ppb
Publisher’s Note: MDPI stays neutral with regard to jurisdictional claims in published maps and institutional affiliations.

