1. Introduction
The shelf life of enzymatic biosensors has been widely covered over the years, including in recent publications [
1,
2,
3], which focus particularly on the link between shelf life and the commercialization of these devices [
4] and the extended use of these devices over time, even many days after their construction [
3].
In enzymatic biosensors, the biocomponent is the major factor that limits shelf life [
5], the stability of which is connected to several factors inherent in the construction of a biosensor [
3,
6]. The catalytic activity of the enzyme is the most important function that decays over time and to which the reuse and the operating periods of biosensors are intimately linked. The loss of enzymatic activity occurs mainly due to denaturation processes that are induced by several phenomena, such as ageing, the loss of co-factors, irreversible poisoning, or protein unfolding [
1,
6].
In the case of biosensors, factors such as immobilization techniques can induce protein denaturation, affecting the device’s thermodynamic (or conformational) stability, as well as its long-term stability [
7].
It is widely known that glycols and polyhydric compounds can stabilize enzymatic activity [
7,
8,
9] and protect and prolong catalytic activity, even when used in conjunction with enzymatic boosters such as polyethyleneimine (PEI) [
8,
10] by interacting with enzyme molecules, thereby preventing enzyme deactivation by influencing their aqueous microenvironments [
6].
It was also demonstrated that the mid-term storage of biosensors at very low temperatures (−80 °C) does not produce any significant changes in biosensor performance but instead maintains their stability over time [
3].
These features are particularly important for enzyme-based biosensors, which are employed in a wide range of matrices. Biosensors can be used for monitoring food or food processes [
11], in marine applications, for environmental monitoring, and—most commonly—for biomedical purposes [
12,
13,
14]. Because of their low invasiveness, ability to be miniaturized, sensitivity, very low temporal and spatial resolution, low cost, and relative ease of use, these devices are commonly used in preclinical studies with animal models [
6,
10].
The main feature of enzymatic biosensors lies in exploiting the ability of a biological element to selectively recognize the analyte under examination even in complex matrices [
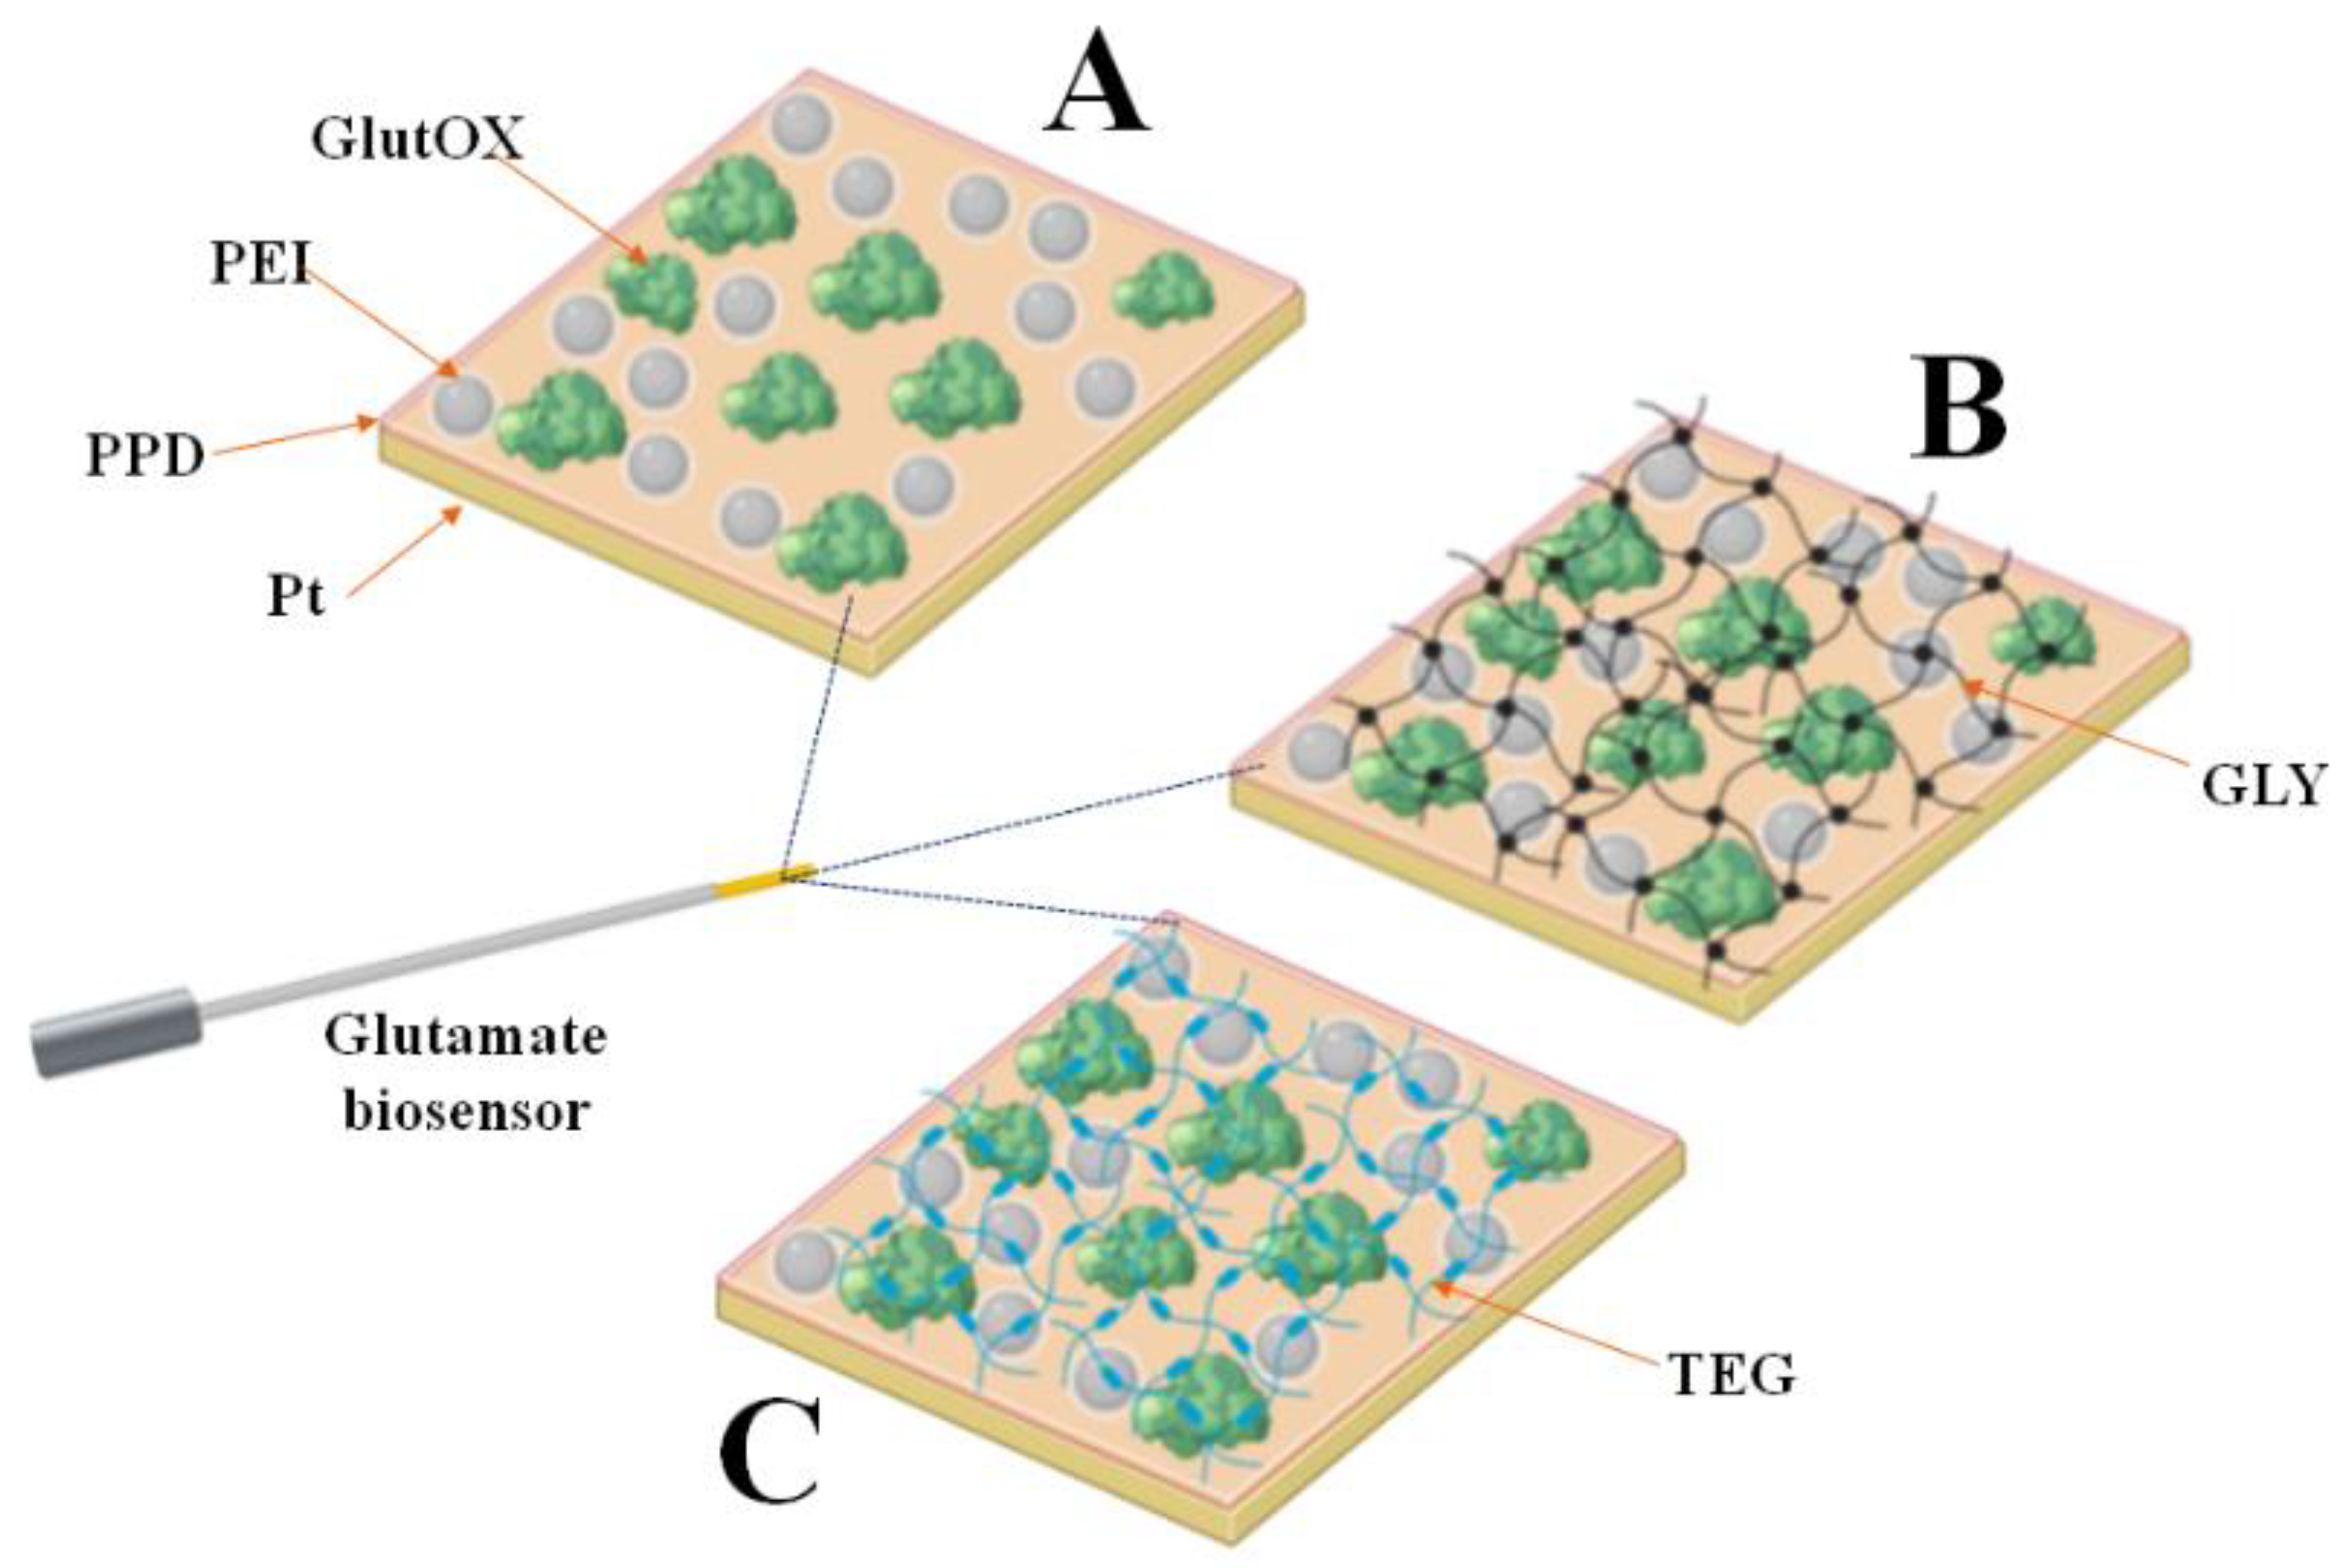
15], particularly in the extracellular fluids present in the brain tissues of animal models. In the present study, different biosensor designs were proposed, all of which exploit the capability of glutamate oxidase (GlutOx) to convert glutamate (Glut) as follows:
The hydrogen peroxide (H
2O
2), produced by the enzymatic reaction, which is proportional to the glutamate concentration, can be amperometrically measured on a Pt surface by applying a high fixed anodic potential of +0.7 V vs. Ag/AgCl [
8,
10] as follows:
These characteristics make such biosensors particularly useful for the preclinical monitoring of brain glutamate, which is of fundamental importance in the functioning of the brain.
Glutamate is an excitatory amino acid neurotransmitter [
16] that is involved in multiple functions including cognitive processes and memory, movement [
10], neuronal development, and aging [
8].
Glutamate is also involved in excitotoxicity [
17,
18] and several pathologies, some of which affect the nervous system, such as amyotrophic lateral sclerosis, Alzheimer’s disease, and Parkinson’s disease [
10,
19,
20,
21].
It has been demonstrated that physiological glutamate basal concentrations can range from ≃1.0 to ≃5.0 μM [
21], while pathological conditions are able to increase these concentrations to over ≃35 μM [
22].
Therefore, to enhance biosensor performance, particularly when biosensors are used for implants in preclinical models, the block of the interfering species has become important [
8,
10]. One of the most predominant interfering species is ascorbic acid (AA), which represents the archetype of the interfering species and is present at sig-nificantly high concentrations (~500 μM) in extracellular fluid (ECF), thereby exerting some of the most impactful interference on the biosensor response [
8,
10].
Hence, it has become crucial to develop an implantable glutamate biosensor that is as sensitive as possible and shielded from interfering species while also maintaining stability and analytical performance as long as possible when not in use. The present work sought to improve the performance of a glutamate biosensor with the aim of im-planting the sensor in the CNS of animal models.
To modify the immobilized enzyme loaded on the biosensor (i.e., its stability and specificity), several parameters were taken into account: V
MAX(app) and K
M(app) as indexes of enzymatic activity and the Linear Region Slope (LRS) as an indicator of analytical performance. As widely demonstrated, V
MAX(app) represents the highest catalytic rate that is achieved when all the enzyme molecules are engaged in interactions with the substrate [
3,
6,
23]. In biosensing, it is widely accepted that V
MAX(app) can reflect the number of the active enzyme molecules loaded in the biosensor design [
3,
15,
24], while the apparent Michaelis–Menten constant K
M(app), which defines the concentration of the substrate at which 1/2 of V
MAX(app) occurs, highlights the affinity of the enzyme to the substrate [
6,
15,
25].
As analytical parameters, the Linear Region Slope (LRS) and the limit of detection (LOD) were evaluated. The LRS is considered one of the best parameters for reflecting the analytical performance of the proposed biosensors and explaining their efficiency and sensitivity in the matrix under study [
3,
6,
26,
27]. The LOD, on the other hand, was used to describe the lowest concentration reliably measured by the proposed biosensor designs, thus providing an index for the applicability of the device in the matrix under study. Shielding against a 500 µM AA concentration was also monitored using all bio-sensor designs at different storage temperatures.
Hence, the aim of the present study was to combine the use of glycols, which have proven useful in the medium- and long-term stabilization of biosensors for glutamate monitoring [
8,
10], with the storage of biosensors at low temperatures, which have been proven to protect the analytical performance of biosensors for glucose and lactate over a long period of time [
3]. The combination of glycols and low-temperature storage was monitored for 5 months to evaluate the enzymatic and analytical stability of the proposed biosensor designs in terms of V
MAX(app), K
M(app), and LRS.
3. Results
3.1. Role of the Storage Temperature in the Enzymatic Parameters in the Control Design
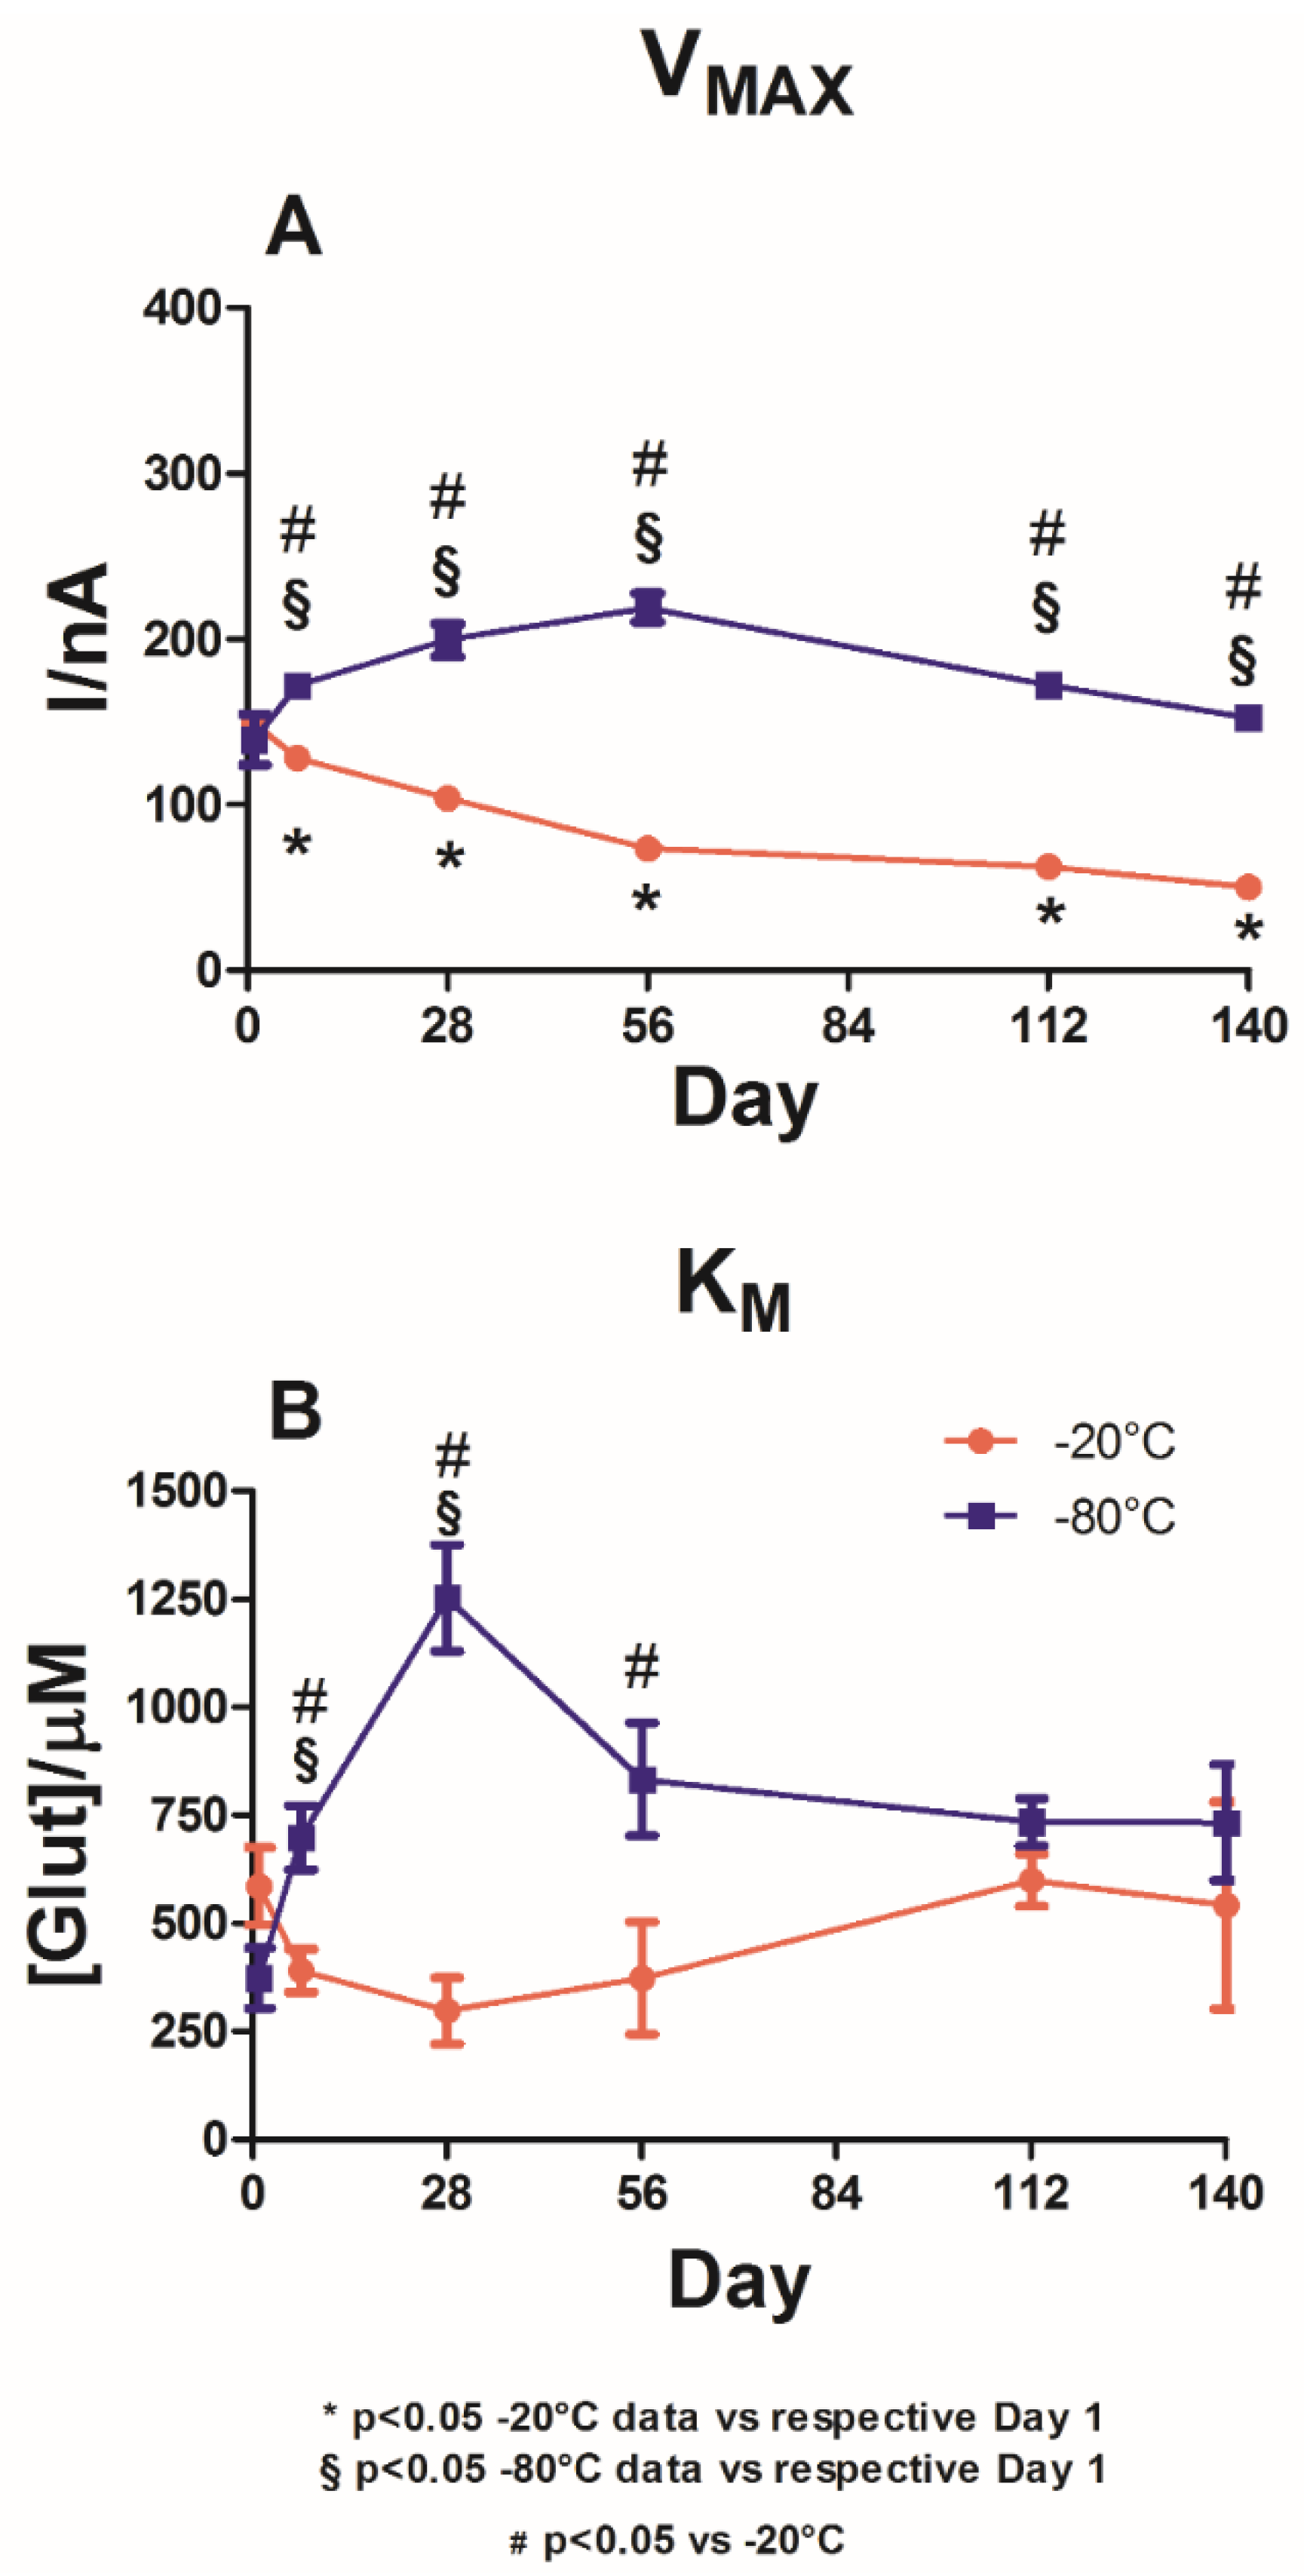
As shown in
Figure 2, the effect of the two different storage temperatures is reported in terms of the V
MAX(app) (Panel A) and K
M(app) (Panel B).
In the graph, it is possible to highlight that at Day 1, no statistical differences were observed in VMAX(app) between the two different groups. Indeed, for the −20 °C storage temperature group (red plot), a value of 149.2 ± 1.1 nA was observed, while for the −80 °C storage temperature group (blue plot) a value of 139.1 ± 15.4 nA was observed. The same phenomenon was observed for KMS(app), whose values were not significantly different between the two groups, settling around 500 μM for the group maintained at −20 °C and 400 μM for the group maintained at −80 °C.
As shown in panel A, a −20 °C storage temperature yielded significant variations in VMAX(app) values over time when compared to Day 1. The VMAX(app) values experienced a significant decrease between Day 1 and Day 7, reaching 128.0 ± 3.4 nA. This downward trend was maintained until Day 140, when VMAX(app)) reached 50.1 ± 3.6 nA, although the figures were still significantly lower (p < 0.05) than those on Day 1.
In the blue plot in Panel A, the VMAX(app) variations are reported for the biosensors stored at −80 °C. As shown in this panel, VMAXS(app) experienced a significant increase on Day 7, arriving at the value of 171.8 ± 4.4 nA by Day 56. Subsequently, a downward trend was recorded up to Day 140, when VMAX(app) reached a value of 152.4 ± 6.8 nA. Throughout the observation period, VMAX(app) was significantly higher (p < 0.05) than the value on Day 1.
Overall, a significant difference was observed in the VMAX(app) scores between the two groups. For the entire observation period, the group stored at −80 °C showed a higher value (p < 0.05) of VMAX(app) when compared to the values for the group stored at −20 °C.
Panel B shows that the −20 °C storage temperature (red plot) produced a fluctuating trend for the biosensors’ KMS(app), reaching an interesting minimum value of 297.6 ± 76.6 μM on Day 28 but reaching a value equal to 599.7 ± 60.8 μM on Day 112 and then decreasing to 541.3 ± 239.9 μM. However, over the entire observation period, KMS(app) did not differ significantly (p < 0.05) from the value on Day 1.
The blue plot, which shows the results from the −80 °C storage temperature group, indicates a deterioration in KM(app) values over the 140 days of the study. Indeed, KM(app) dramatically increased up to 1253.0 ± 123.8 μM by Day 28, decreased up to Day 140, and settled around 730 μM.
In general, when compared to the group stored at −20 °C, the biosensors in the control group stored at −80 °C produced a significantly worse trend (p < 0.05) until Day 56. No significant differences were observed between the two groups from Day 112 onwards.
As shown in
Table S1 in the Supplementary Material, the control group showed a significant increase in LOD values for both storage temperatures as early as Day 7, lasting throughout the entire observation period. Furthermore, in the medium term, the group stored at −80 °C demonstrated significantly lower (
p < 0.05) LOD values than the group stored at −20 °C.
The LOD values were shown to be compatible with those already present in the literature [
25,
29] up to Day 28 for the group stored at −20 °C and up to day 56 for the group stored at −80 °C, reaching 0.324 ± 0.022 μM and 0.358 ± 0.029 μM, respectively.
3.2. Role of the Storage Temperature on the Enzymatic Parameters in Glycerol Loading Design
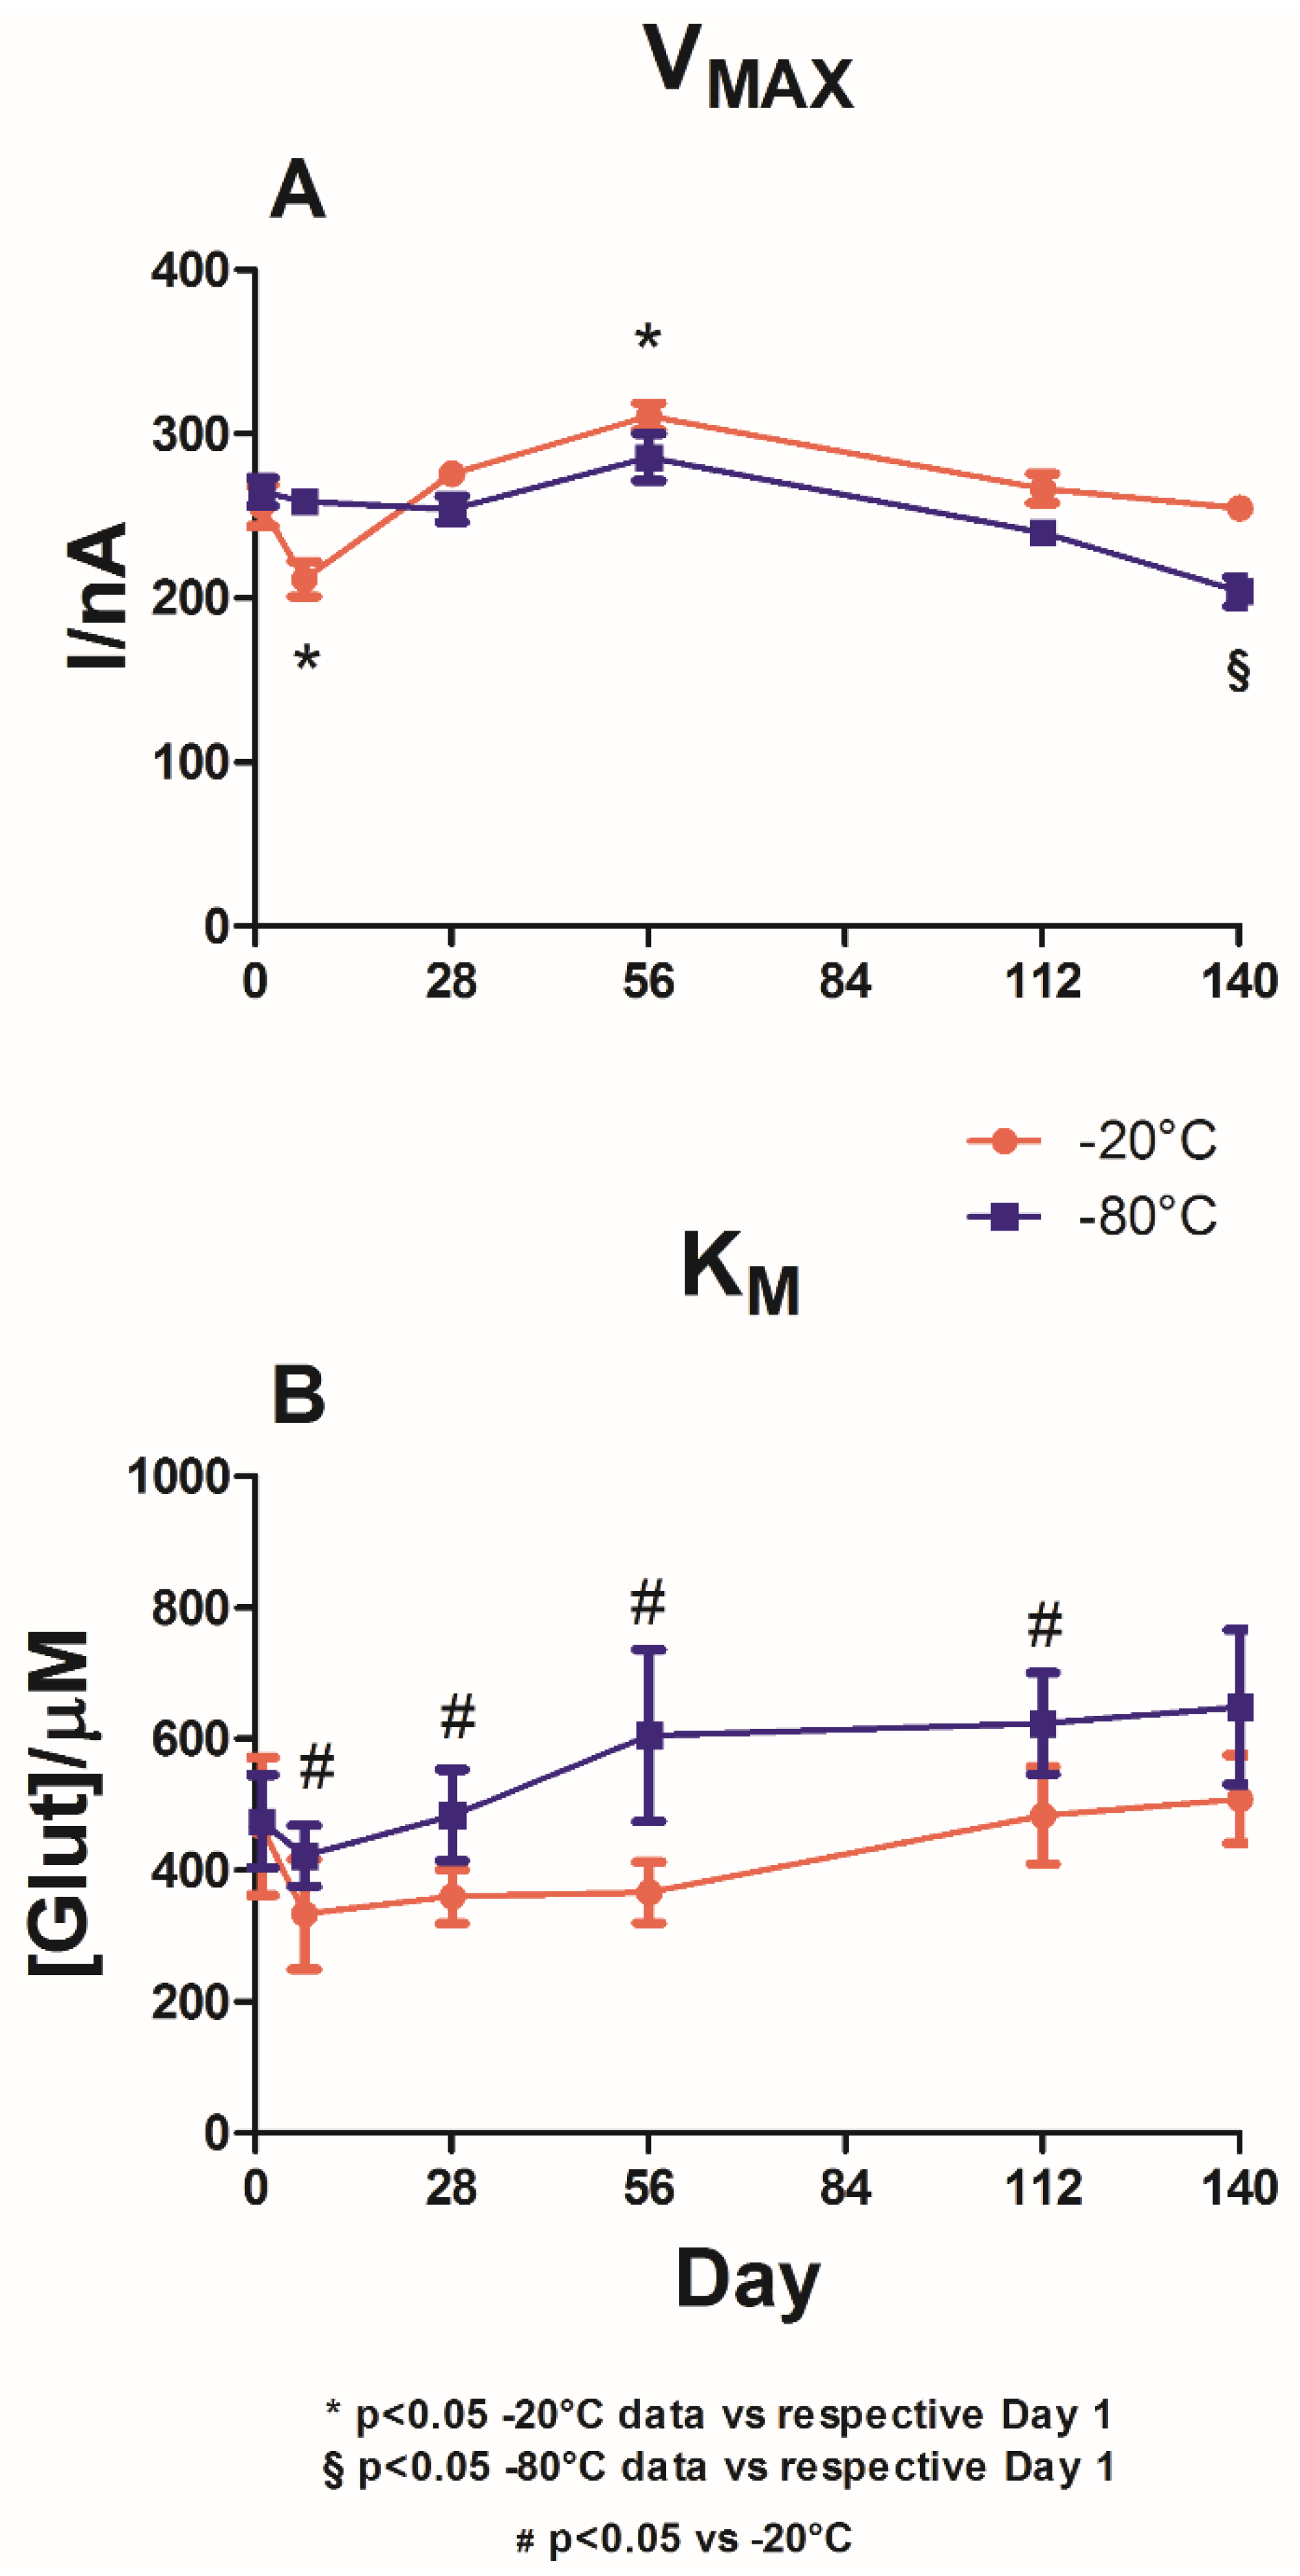
Figure 3 illustrates the impact of the presence of GLY on the enzymatic performance of the biosensors when stored at −20 °C (red plot) and −80 °C (blue plot).
Even in this group, no significant differences between groups were observed on Day 1, neither in terms of VMAX(app) nor in terms of KM(app). Indeed, the values of VMAX(app) were around 260 nA, and those of KM(app) were around 470 μM.
As shown in panel A, after presenting a significant (p < 0.05) decrease in VMAX(app) on Day 7 (211.4 ± 10.7 nA), a slight upward trend was recorded for the group stored at −20 °C (red plot) up to Day 56 (310.7 ± 8.2 nA), followed by a slight decrease to 254.8 ± 7.5 nA by Day 140.
The changes in VMAX(app) were found to be significantly different (p < 0.05) from the values on Day 1 only on Day 7 and Day 56.
In the group stored at −80 °C (Panel A, blue plot), a trend similar to that of the −20 °C group was observed. A small but not significant increase in VMAX(app) was recorded on Day 56, at which point the value was 285.9 ± 14.3 nA. Later, a downward trend, albeit non-significant, was observed.
The graph demonstrates that the two different storage temperatures did not yield significant differences in VMAXS(app) when comparing the two groups. The only significant difference was observed on Day 140.
Panel B shows that both storage temperatures did not yield substantial variations in KMS(app) when compared with the respective values on Day 1. However, under −20 °C storage, a constant increase up to Day 140 was observed after a decrease on Day 8, at which point KM(app) reached its lowest value of 333.4 ± 83.7 μM.
Storage at −80 °C yielded comparable behavior for KMS(app), presenting a decrease on Day 7, at which point KM(app) was equal to 422.3 ± 46.5 μM, followed by a constant increase up to Day 140. From Day 7 onwards, the KMS(app) values under −80 °C storage were significantly different (p < 0.05) from those observed under −20 °C storage.
Table S2 in the
Supplementary Materials shows that the biosensors loading the GLY experienced a general, constant, and significant increase over time for both storage temperatures. Although this increase was significant (
p < 0.05 vs. Day 1) as early as Day 7 for the −20 °C storage group, for the −80 °C storage group, this increase occurred from Day 28. Moreover, storage at −80 °C produced significantly lower (
p < 0.05) LOD values in the short term than storage at −20 °C. Even in the glycerol-loading group, at both storage temperatures, the LOD values were compatible with those present in the literature [
25,
29] up to Day 56.
3.3. Role of Storage Temperature on the Enzymatic Parameters in Tryethyleneglycol Loading Design
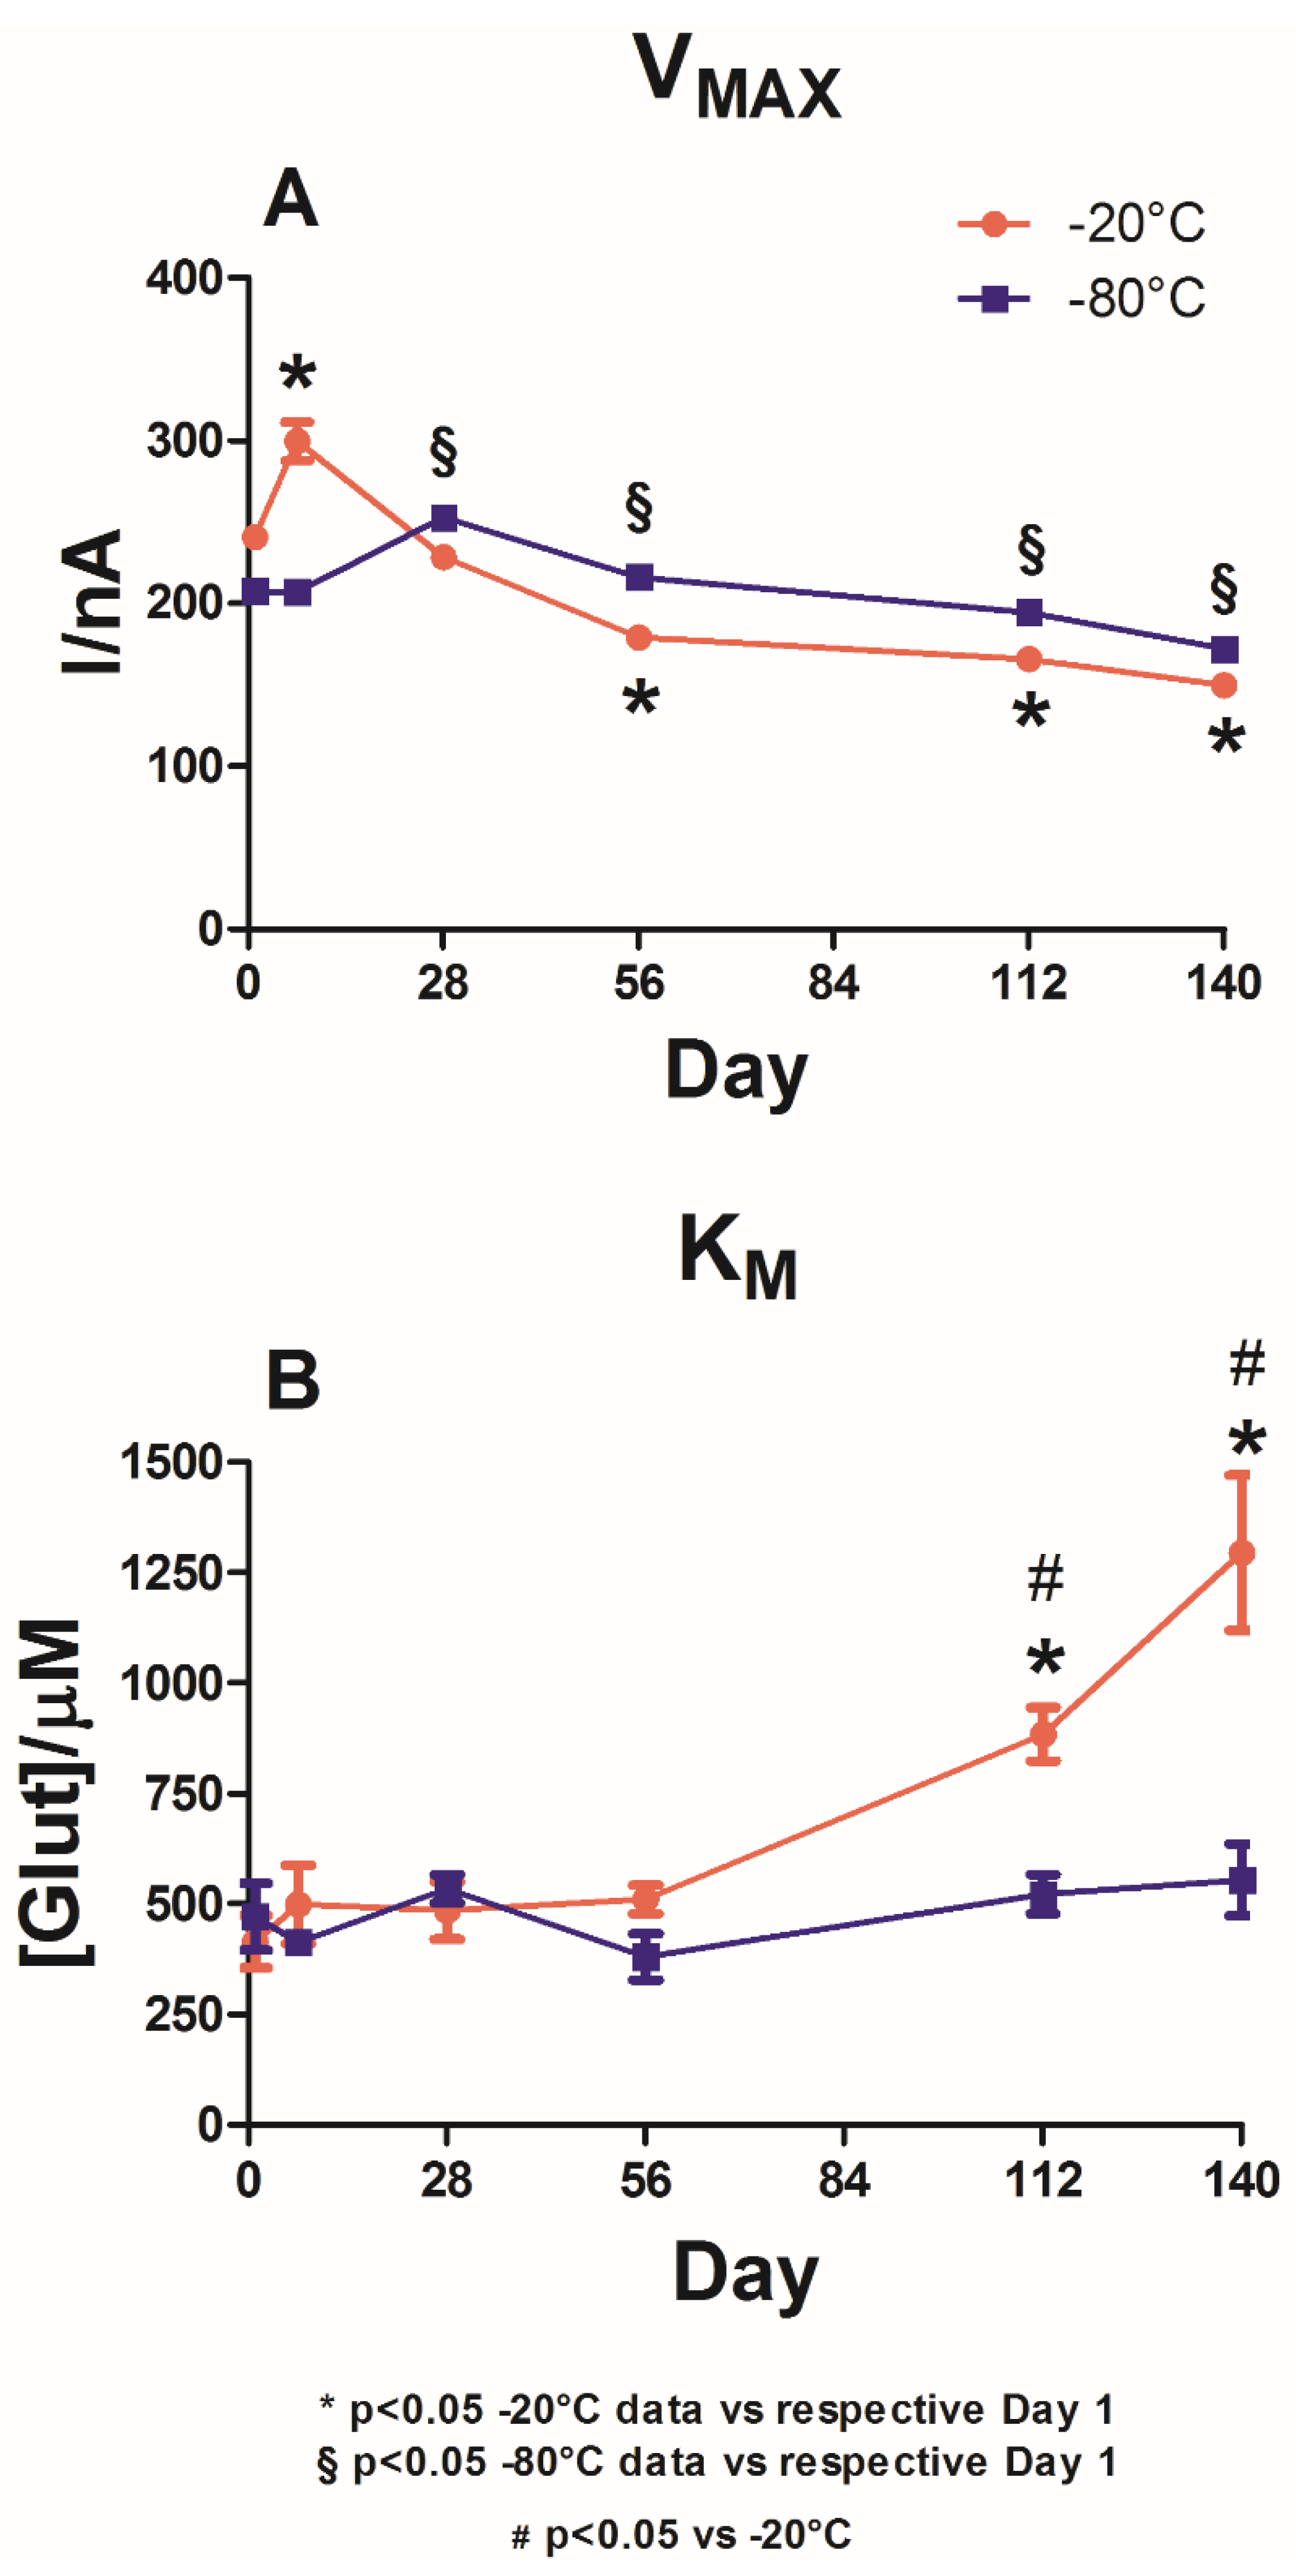
In
Figure 4, the impact of TEG is plotted for the biosensors stored at −20 °C (red plot) and −80 °C (blue plot). In both groups, no significant differences were observed for both V
MAX(app) (Panel A) and the K
M(app) (Panel B) on Day 1.
For VMAX(app), as shown in Panel A, both storage groups showed a similar trend, which was not statistically different (−20 vs. −80 °C) for the entire duration of the observations.
However, in the −20 °C storage group, a significant increase (p < 0.05 vs. Day 1) was observed on Day 7, at which point VMAX(app) reached 299.8 ± 11.9 nA in the −80 °C storage group. Following the overall stability of VMAX(app) between Day 1 and Day 7, there was a significant increase on Day 28, at which point VMAX(app) was equal to 252.7± 3.4 nA.
Panel B highlights the variations in KM(app) following the two different storage protocols. Storage at −20 °C (red plot) produced a slight but non-significant increase in KM(app) between Day 1 and Day 7 and remained stable for the next 7 weeks. On Day 112, a substantial and significant increase in KM(app) was recorded (884.1 ± 60.2 μM). This parameter reached its maximum value on Day 140 (1295.0 ± 175.6 μM).
In the −80 °C storage group, although there was a fluctuating trend in KM(app) with decreases on Day 7 (412.7 ± 24.6 μM) and Day 56 (380.3 ± 52.8 μM), these variations did not prove to be significantly different compared to those on Day 1, suggesting interesting stability related to the affinity of the enzyme towards its substrate. Only starting from Day 112 did the −20 °C storage group present significantly higher results (p < 0.05) than the −80 °C storage group.
Table S3 in the
Supplementary Materials shows that in the loading-TEG group, there was a general increase in LOD values under both storage temperatures. However, as with the GLY-loading group, although the increase was significant (
p < 0.05 vs. Day 1) as early as Day 7 for the −20 °C storage group, for the −80 °C storage group, this increase occurred starting from Day 28.
Furthermore, storage at −80 °C resulted in significantly lower (
p < 0.05) LOD values compared to those obtained at −20 °C over the entire observation period. In the TEG-loading group, the LOD values were also shown to be comparable with those present in the literature [
25,
29].
3.4. Role of the Storage Temperature on the Analytical Parameter of LRS
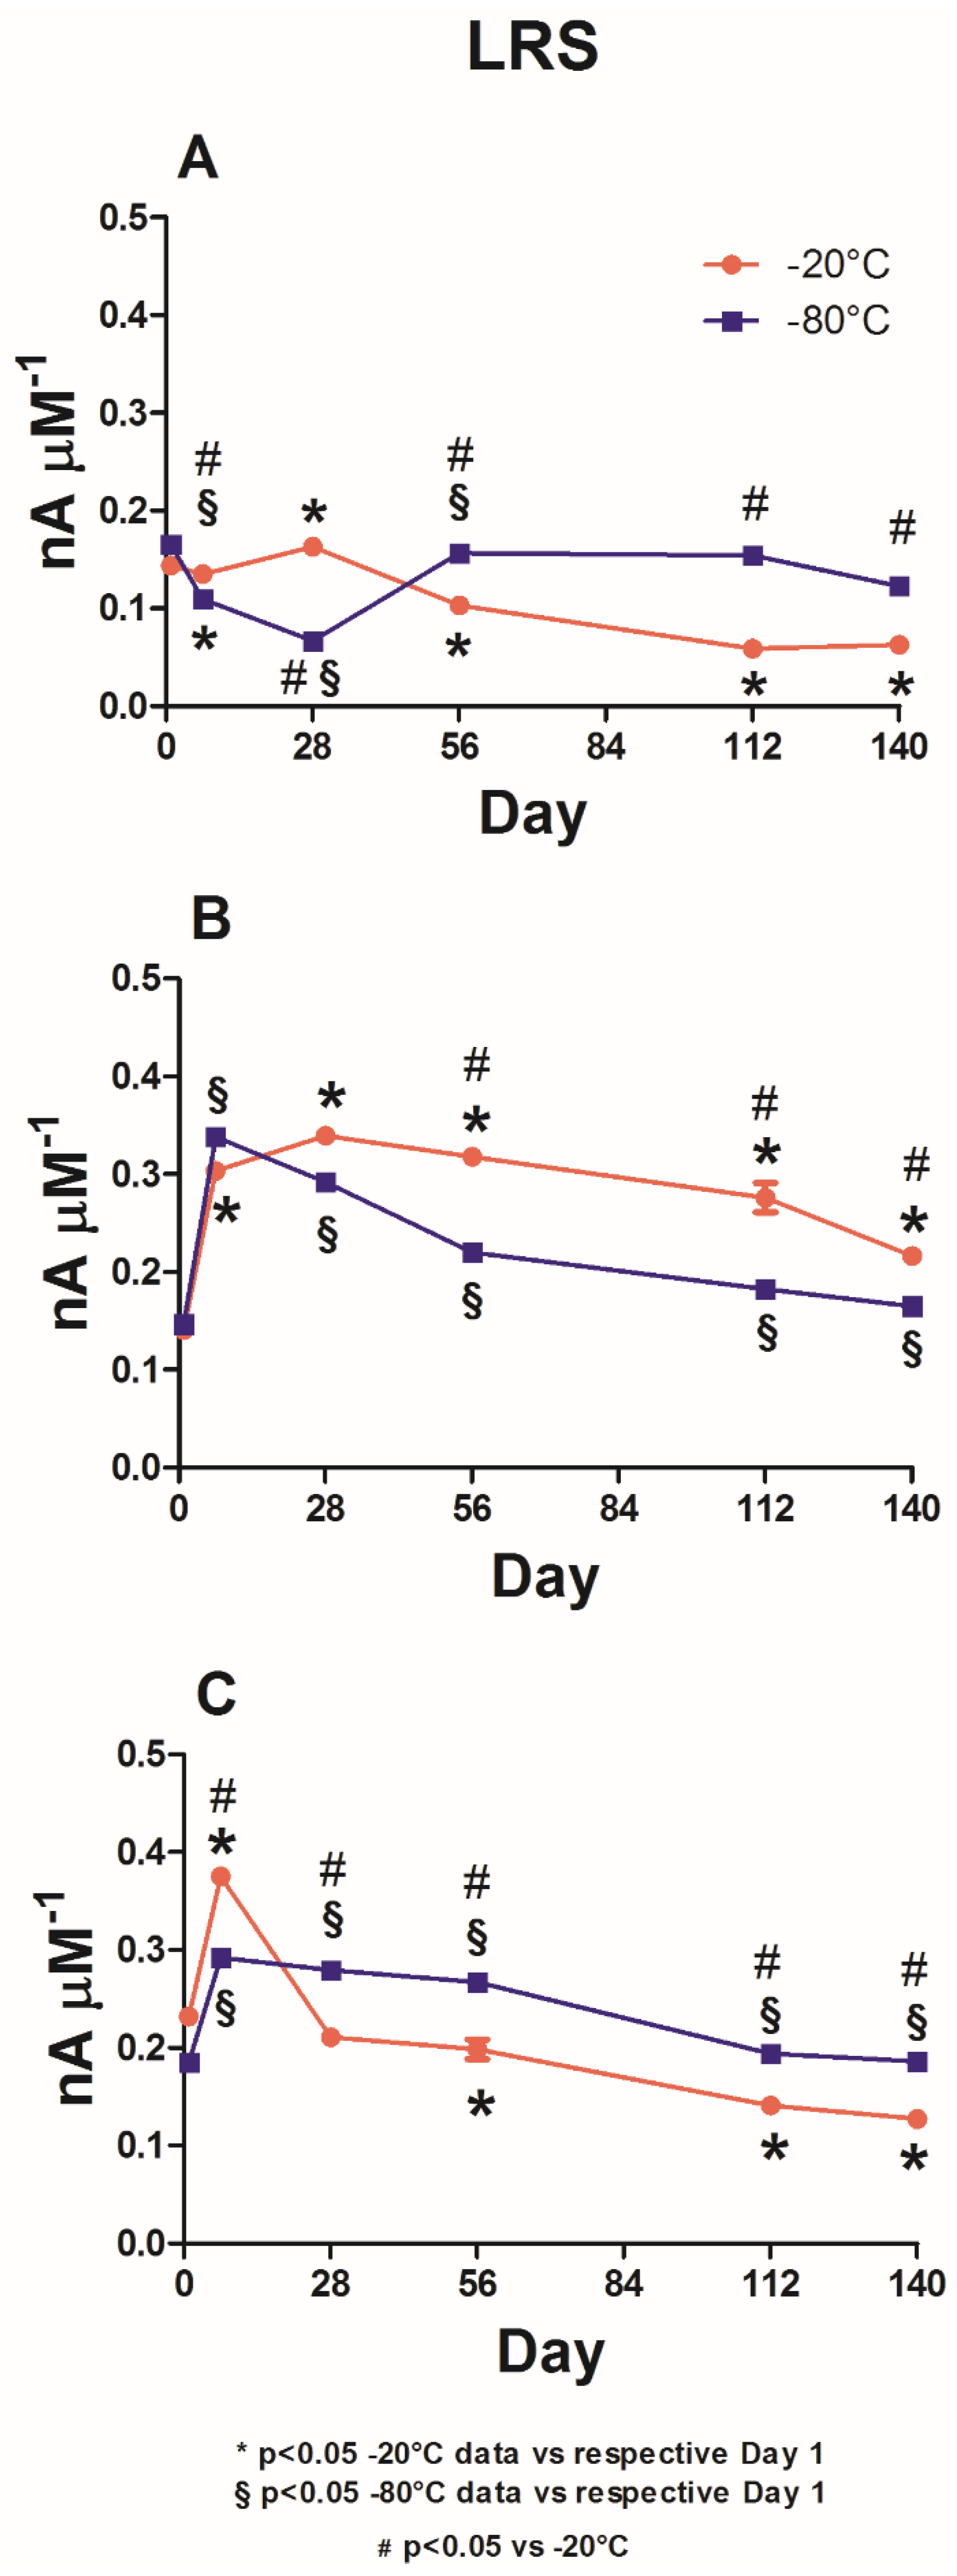
As shown in
Figure 5, LRS variations in the different biosensor groups are reported under storage at −20 °C (red plot) and −80 °C (blue plot).
Panel A provides data from the control group. In this group, the storage of biosensors at −20 °C produced an overall downward trend, which was statistically different from the value on Day 1. Apart from a small (albeit significant) increase that occurred on Day 28 and through which LRS reached a value of 0.163 ± 0.003 nA μM−1, the parameter gradually decreased until Day 140, reaching a value of 0.063 ± 0.001 nA μM−1.
When the same design was stored at −80 °C, the LRSs were statistically higher (p < 0.05) from Day 56 onwards compared with those on Day 1, settling around a value of about 145 nA μM−1. On Day 28, an evident and significant decrease occurred when LRS reached a value of 0.067 ± 0.003 nA μM−1.
Data from the glycerol-loading group are shown in Panel B. The red plot shows that −20 °C storage, in addition to indicating a significant increase up to 0.304 ± 0.003 nA μM−1 (p < 0.05 vs. Day 1) as early as Day 7, produced a further significant increase (0.339 ± 0.004 nA μM−1; p < 0.05 vs. Day 1) on Day 28. Subsequently, there was a downward trend until Day 140, at which point the value was 0.216 ± 0.001 nA μM−1, which was still significantly higher (p < 0.05) when compared to the value on Day 1.
The storage at −80 °C yielded a comparable trend in terms of LRS values. Specifically, the maximum value, which was significantly higher (p < 0.05) when compared to that on Day 1, was reached on Day 7 (0.338 ± 0.007 nA μM−1). From this moment on, there was a steady decrease until Day 140, at which point the value was 0.165 ± 0.002 nA μM−1. Moreover, all LRS values were significantly higher (p < 0.05) when compared to those on Day 1. Overall, throughout the observation period, the −80 °C data yielded significantly lower results (p < 0.05) compared to the −20 °C data.
Panel C presents data from the triethylene glycol-loading group. When the biosensors were stored at −20 °C (red plot), a significant increase (0.375 ± 0.009 nA μM−1; p < 0.05 vs. Day 1) was observed on Day 7. On Day 28, there was a substantial decrease, albeit not significant when compared to Day 1. Subsequently, there was a gradual decrease over time (significant (p < 0.05) compared to Day 1) until Day 140, at which point LRS reached a value of 0.127 ± 0.004 nA μM−1.
The −80 °C storage (blue plot) yielded a less sustained increase on Day 7 (0.292 ± 0.005 nA μM−1) compared to that obtained at −20 °C. However, this increase was still significant (p < 0.05) when compared to the increase on Day 1. In this group, LRS remained broadly constant until Day 56, reaching a value of 0.267 ± 0.007 nA μM−1 and decreasing from Day 112 to Day 140, when LRS acquired a value of 0.186 ± 0.005 nA μM−1. LRS was observed to be significantly higher (p < 0.05) throughout the observation period compared to both Day 1 and the corresponding data obtained at −20 °C.
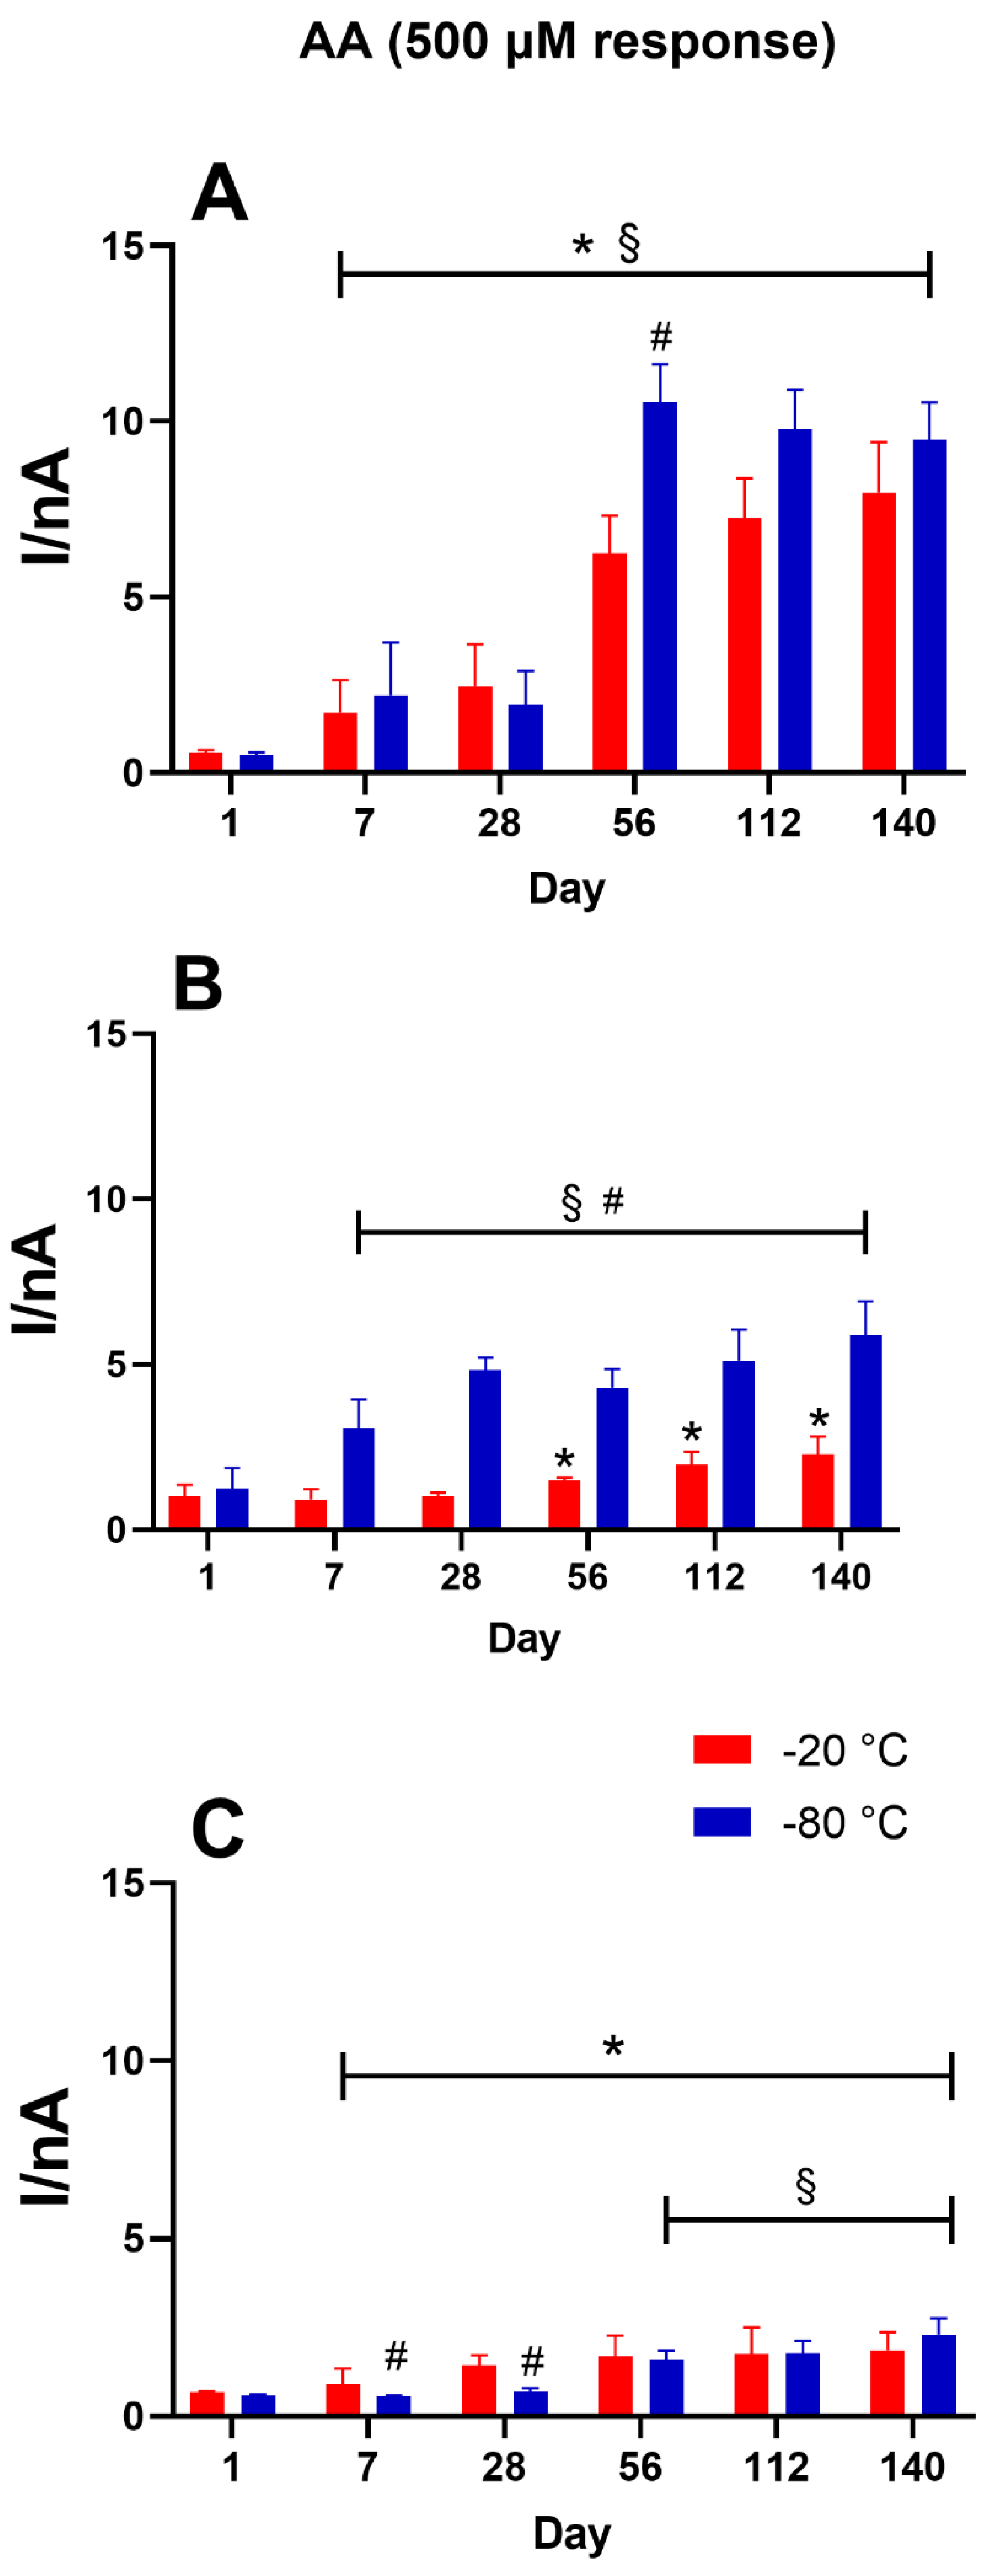
3.5. Role of the Storage Temperature on AA Interference Shielding
As shown in
Figure 6, variations in the AA 500 µM responses among the different biosensor groups are reported for storage conditions of −20 °C (red bars) and −80 °C (blue bars). Panel A presents the response of the control design to AA 500 µM. This plot shows that storage at −20 and −80 °C caused deterioration over time, starting from Day 7, in shielding against ascorbic acid, with overlaps between the two groups’ results. Panel B highlights the results from the glycerol-loaded biosensor design. The presence of GLY provided better blocking of AA interference at −20 °C compared to that obtained at −80 °C. The shielding remained stable until Day 28 (
p < 0.05 vs. Day 1), when the recorded current of AA 500 uM was 1.006 ± 0.116 nA. Starting from Day 56, a decline in protection against interference was observed. Conversely, −80 °C storage produced progressive worsening starting from Day 7. Panel C presents the response of the TEG-loading biosensor design to AA 500 µM. The graph indicates that the presence of TEG produced better shielding against AA when compared to other designs. Furthermore, −80 °C storage yielded stable shielding up to Day 28, which was statistically better (
p < 0.05) than that obtained at −20 °C. From Day 56 onward, both storage temperatures yielded general, as well as superimposable, worsening in the AA shielding.
4. Discussion
To improve the shelf life of glutamate biosensors, in this paper, we studied the impacts of two different glycols (GLY and TEG) coupled with low-temperature storage (−20 and −80 °C) on glutamate biosensor activity and stability over time.
Overall, based on the results obtained, we deduced that storage at low temperatures alone (the control design) increased enzymatic activity compared to Day 1, at which point the biosensors were left at room temperature for stabilization. Notably, storage at −80 °C resulted in a significant increase (p < 0.05) even compared to storage at −20 °C, thereby producing statistically higher VMAX(app) values.
Furthermore, while storage at −20 °C yielded greater stabilization of enzymatic activity in the presence of glycerol (given the increase in VMAX(app) and the over-time stability of LRS), the presence of TEG instead favored enzymatic stability when storing the biosensors at −80 °C.
In previous papers [
6,
8,
10], it was demonstrated that polyols, carbohydrates, and glycols are able to stabilize biosensor activity over short- to medium-term periods of time. This phenomenon relies on the capability of these compounds to create a stable hydration cover near the enzyme molecules, which preserves the native conformation of the protein [
8,
10,
30]. The favored interactions of glycol–enzyme proteins might be due to the high affinity of glycol molecules to both hydrophilic and hydrophobic residues of amino acids. Moreover, in this environment, negative interactions between the enzyme and surrounding solution can be avoided [
8,
10,
31],
de facto positively impacting the stability of the biosensor and yielding higher V
MAX(app) values for a longer period of time when compared with designs that do not load polyols [
8,
10]. In [
8], among different glycols, GLY and TEG were found to be particularly suitable for facilitating GlutOx stability and activity over time. Moreover, as previously demonstrated [
3], the low-temperature storage of glucose and lactate biosensors, particularly at −80 °C, yielded higher V
MAX(app) values and universally better stability level over time compared to storage at +4 and −20 °C.
Biosensor stability is a very complex issue because it is connected to enzymatic activity, which is influenced by several factors. One of the most impacting issues relates to the denaturation processes that occur under immobilization during biosensor fabrication [
6,
8,
10]. Moreover, the internal reorganization of the enzyme molecules within the biosensor over time, which could result in less (or in some case more) advantageous interactions with the substrate over time, plays an important role in this process, as the enzyme molecules are not covalently linked to the biosensor platinum surface [
6,
8,
10]. This phenomenon has been largely proven, as V
MAX(app) highlights the number of active enzyme molecules present on the biosensor design [
3,
6,
8,
10,
15,
24,
32]; thus, variations in V
MAX(app) are intimately correlated to a modification in enzyme activity.
Another important parameter to consider is LRS, which represents one of the most indicative parameters for explaining analytical performance. LRS, as a function of V
MAX(app) and K
M(app), was previously shown to be efficient and sensitive against the analyte monitored by the biosensor [
8,
10,
26,
27].
In the present study, we showed that glycols are able to increase biosensor efficiency because the LRS values were observed to be considerably higher compared to those obtained from the control biosensors. Indeed, the presence of glycols yielded LRS values 1.5 to 2 times higher than those of the control (
Figure 5). Moreover, these differences persisted for the entire duration of the observation period (5 months) and proved that glycols activate strong interactions with the enzyme protein, extending the protein’s stability over time.
We also recorded an interesting observation regarding low-temperature storage. In the control group, when the presence of glycol was omitted, −80 °C storage yielded a significant increase in V
MAX(app). This increase remained high and statistically different from the values under −20 °C storage throughout the 5 months of observation (
Figure 2, Panel A). This result not only showed that at very-low storage temperatures GlutOx maintained its activity, but also that the number of active molecules of enzymes on the biosensor surface increased, as demonstrated by the fact that enzyme activity increased under −80 °C but not −20 °C storage. Very low temperatures not only did not affect the number of active molecules but instead, despite the repeated freezing and thawing processes, favored the reorganization of those molecules on the biosensor surface, thereby increasing the number of favorable interactions with the substrate. It is also likely that lower temperatures better retained the catalytic activity of the enzyme molecules. The role played by PEI must also be considered in this aspect. This compound has been predominantly used as an enzyme activity booster in glutamate biosensors [
3,
8,
10,
24,
32] due to its ability to influence the electrostatic environment of the enzyme,
de facto yielding a remarkable improvement in biosensor performance. It was also demonstrated that PEI acts as a protective agent during freeze–thaw processes involving proteins because of its ability to affect the enzyme microenvironment by controlling ionic substrates and products. Moreover, at high concentrations comparable to those used in the present work, PEI was shown to facilitate the preservation of enzymatic activity, avoiding several denaturizing processes during the dissociation of subunits and unfolding that occur in the freezing state [
33,
34].
In the control group, behavior similar to that of V
MAXS(app) was observed for LRSs (
Figure 5, Panel A), which, as a function of V
MAX(app), were generally statistically different when compared to the values observed at −20 °C.
This evidence relies on the difference in K
M(app) (
Figure 2, Panel B), which significantly increased up to two months after the construction of the biosensors, when these were kept at −80 °C. On the contrary, −20 °C storage did not induce any valuable difference in K
MS(app).
This behavior requires a few comments concerning the role of the glycols in preserving biosensor performance during freezing–thawing processes.
As previously demonstrated, monomeric glycols, with the proper molecular length and structure, are able to maintain substrate specificity and prevent the loss of part of the active enzymes on the biosensor surface. This feature could be due to the formation of effective H-bonds with the hydrophilic residues of the amino acids and intramolecular interactions with the hydrophobic part of the enzyme [
8,
10]. These glycol–enzyme interactions should be strong enough to withstand the freezing–thawing process and improve over time.
Based on the data in the present study, the VMAX(app) obtained from glycol-loading biosensors was, on average, higher than that obtained in the control design, in which the presence of glycol was omitted (most evidently when the biosensors were stored at −20 °C). This phenomenon confirmed the ability of glycols to preserve their enzymatic functions even during freezing–thawing processes, as well as increase the number of active molecules present on the biosensor surface and, consequently, the number of favorable interactions with the substrate.
Based on the data, as previously demonstrated [
9], GLY was most effective in maintaining the loaded enzyme’s activity, as well as the enzyme’s efficiency in terms of LRS, at −20 °C. As shown in
Figure 3 (Panel A), V
MAXS(app) was higher in the −20 °C group when compared to the −80 °C group.
Interestingly, KMS(app) showed no significant variation throughout the observation period, neither at −20 °C nor at −80 °C, when compared with the corresponding values on Day 1. However, −20 °C storage yielded KM(app) values significantly lower than those of the −80 °C group, demonstrating that GLY was able to better preserve enzyme affinity under −20 °C storage than under −80 °C storage.
Remarkably, even LRSs were higher in the biosensors maintained at −20 °C throughout the observation period (
Figure 5, Panel B). It was proven that LRS, which describes the analytical efficiency and sensitivity of a biosensor, represents one of the most important analytical parameters for biosensors.
We also showed that glycols are able to increase biosensor efficiency because the LRS values were considerably higher than obtained in the control biosensors. Indeed, the presence of glycols yielded LRS values 1.5 to 2 times higher than those of the control (
Figure 5). These differences persisted for the entire duration of the observation period (5 months).
It is possible to explain the performance of the GLY-loading biosensor by considering the capability of GLY to inhibit protein denaturation processes through favorable interactions with the surface of the enzyme’s amino acids. GLY thus acts as an amphipathic molecule interposed between the hydrophobic portions of the enzyme surface and the placement of water molecules in the enzyme protein [
8,
35]. Moreover, as previously demonstrated [
8], GLY is able to create a net, which helps avoid enzyme loss over time. This phenomenon was particularly effective when the biosensors were stored at −20 °C, a temperature sufficient to ‘freeze’ the interactions with the enzyme surface, resulting in higher V
MAX(app) and LRS values.
For K
MS(app), GLY showed a comparable trend in both storage groups (
Figure 3, Panel B): After an initial decrease, indicating an improvement in the affinity of the enzyme to the substrate, K
M(app) suffered a constant increase and thus decreased in affinity. This phenomenon was worse (higher K
MS(app)) when the biosensors were kept at −80 °C. This resulted in a higher LRS in the −20°C group.
TEG was able to improve enzyme activity and stability when the biosensors were stored at −80 °C (
Figure 4, Panel A), while also providing better sensitivity and efficacy (
Figure 5, Panel C), resulting in higher V
MAXS(app) and LRS values when compared with the −20 °C results.
Surprisingly, TEG did not affect enzyme affinity when the biosensors were kept at −80 °C.
A recent paper showed that TEG was able to provide long-lasting high levels of biosensor stability and sensitivity. In comparison with GLY, the larger size and greater conformational flexibility of TEG allowed the glycol to interact deeply with the enzyme proteins, activating hydrophilic and hydrophobic interactions with the amino acid residues located in a more internal portion of the protein [
8,
36,
37].
Thus, since TEG establishes these kinds of relationships with proteins, even with fewer superficial amino acids, storage at lower temperatures (−80 °C) facilitated the development and consolidation of the inner interactions with the enzyme, fixing them and leading to a greater number of active molecules on the surface of the biosensor. As a result, the thawing process affected the lifetime of this biosensor less than that of the GLY biosensor.
In general, all the groups presented LOD values compatible with the glutamate concentrations found in different matrices, particularly in animal models [
21,
22]. Moreover, the data highlights that, in general, the LOD deteriorated, albeit slowly, over the observed time frame, particularly over the long term.
In the control and the GLY-loading groups, the different storage temperatures did not always produce significant differences in LOD values, while the TEG-loading group, when stored at −80 °C, presented surprisingly more stable LOD values.
Moreover, the data show that the presence of glycols favored the AA shielding of the biosensor (
Figure 6). Indeed, exposure of the biosensor at a concentration of 500 µM yielded far superior PPD polymer permeability in the control design omitting glycols.
Figure 6 (Panel B and C) shows that glycols could help block the interference current derived from AA. In particular, glycerol proved to be more efficient in shielding, specifically in the group of biosensors maintained at −20 °C, while TEG proved to be more effective in the group stored at −80 °C. Both glycols were particularly useful in the first month of storage.

 and
and 