Article

Label-Free Electrochemical Biosensor Based on Au@MoS₂–PANI for Escherichia coli Detection

1
Department of Convergence System Engineering, Chungnam National University, Daejeon 34134, Korea
2
Department of Microbiology, College of Science & Technology, and Center for Bio-Medical Engineering Core Facility, Dankook University, Cheonan 31116, Korea
3
Department of Technology Education and Department of Biomedical Engineering, Chungnam National University, Daejeon 34134, Korea
*
Authors to whom correspondence should be addressed.
Chemosensors 2021, 9(3), 49; https://doi.org/10.3390/chemosensors9030049
Submission received: 6 February 2021 / Revised: 24 February 2021 / Accepted: 25 February 2021 / Published: 1 March 2021
(This article belongs to the Special Issue Smart Polymer-Based Chemical and Biological Sensors)

Abstract

:
Bacterial infections have become a significant challenge in terms of public health, the food industry, and the environment. Therefore, it is necessary to address these challenges by developing a rapid, cost-effective, and easy-to-use biosensor for early diagnosis of bacterial pathogens. Herein, we developed a simple, label-free, and highly sensitive immunosensor based on electrochemical detection using the Au@MoS₂–PANI nanocomposite. The conductivity of the glassy carbon electrode is greatly enhanced using the Au@MoS₂–PANI nanocomposite and a self-assembled monolayer of mercaptopropionic acid on the gold nanoparticle surface was employed for the covalent immobilization of antibodies to minimize the nonspecific adsorption of bacterial pathogens on the electrode surface. The biosensor established a high selectivity and sensitivity with a low limit of detection of 10 CFU/mL, and detected Escherichia coli within 30 min. Moreover, the developed biosensor demonstrated a good linear detection range, practical utility in urine samples, and electrode regenerative studies.

1. Introduction

Research on bacterial pathogen detection and the related infectious diseases has become a hot topic in medical research because of the increasing demands of healthcare, the environment, and food monitoring [1,2]. Bacterial pathogens are the main cause of numerous infectious diseases and foodborne illnesses [3,4,5]. Every year, more than 550 million people become infected and 5.2 million people die worldwide from the consumption of bacteria-contaminated food and water [6,7]. Escherichia coli (E. coli) is a disease-causing bacterial pathogen that causes foodborne infection [8]. Shinga toxin-producing E. coli is highly infectious to humans and can cause lethal diseases, such as bloody diarrhea and the hemolytic uremic syndrome [9,10].
Nowadays, bacterial pathogens have become one of the major challenges for food safety and public health concerns [11,12]. The United States Food and Drug Administration has proposed the use of a label mark of E. coli in water and fresh food products as an indicator for bacterial contamination [13]. To prevent bacterial infection and related fatalities, it is highly imperative to develop rapid, sensitive, and portable analytical tools for early detection of bacterial pathogens [14,15]. The conventional techniques used for bacteria detection are culture-based colony counting methods, which are time-consuming and lack on-site detection [16,17]. The other detection technologies used are nucleic acid amplification tests, immunology-based methods, and flow cytometry, which can provide detection results within a day [18,19,20]. However, the major drawbacks of these techniques are the need for specialized laboratories and trained personnel, high cost, and a series of processing steps for incubation and washing, which restrict on-site detection [21,22].
A variety of nanomaterials have been used to develop biosensors for bacterial pathogen detection, such as colorimetry, fluorescence assays, surface-enhanced Raman scattering (SERS), microfluidic devices, and electrochemical biosensors [23,24,25,26,27,28]. Among these, electrochemical biosensors have gained much interest for bacterial pathogen detection because of easy handling, rapid response time, cost-effectiveness, and high sensitivity [29,30]. Moreover, these biosensors can be used to perform direct and label-free measurements without prior experience [31,32,33]. Recently, a reduced graphene oxide-based immunosensor has been developed for uropathogenic E. coli detection. A lower limit of detection (LOD) of ten colony-forming units (CFU)/mL was achieved, and the entire process was completed within 30 min [34]. Furthermore, an electrochemical biosensor using silica nanoparticles has been developed. This biosensor can detect E. coli within 5 to 30 min with an LOD of 103 CFU/mL [35]. Although the sensitivity of this biosensor is appreciable, the nonspecific adsorption of bacteria on silica nanoparticles may sometimes provide false positive results. Therefore, a more accurate, sensitive, and stable electrochemical biosensor is still required for early detection of E. coli.
In this study, we developed an electrochemical biosensor based on nanocomposites of polyaniline (PANI) with gold nanoparticles (AuNPs) and MoS₂ for bacterial pathogen detection. PANI and AuNPs increased the electrical conductivity and surface area of MoS₂. Furthermore, a self-assembled monolayer of mercaptopropionic acid on the AuNP surface was introduced for covalent immobilization of antibodies, which prevented the nonspecific adsorption of the target pathogen on the electrode surface. Hence, combining both organic (PANI) and inorganic components (MoS₂ and AuNPs) to form a hybrid nanocomposite (Au@MoS₂-PANI) with different properties than a single component offered high conductivity and stability with excellent electroactivity for bacterial pathogen detection. Furthermore, we achieved the simple and sensitive detection of E. coli at a concentration of 10 CFU/mL within 30 min.

2. Materials and Methods

2.1. Chemicals and Reagents

All chemicals were of analytical grade and used without any further purification. Aniline, hexaammonium heptamolybdate tetrahydrate [(NH4)6Mo7O24·4H2O], HAuCl4, thiourea, and ethanol were purchased from Thermofisher Scientific Inc (Waltham, MA, USA). Ammonium persulfate (NH4)2S2O8, sodium tricitrate (Na3C6H5O7), [Fe(CN)6]3−/4−, KCl, N-hydroxysuccinimide (NHS), bovine serum albumin (BSA), mercaptopropionic acid (MPA), 1-ethyl-3-(3-dimethylaminopropyl)carbodiimide (EDC), 0.01 M phosphate-buffered saline (PBS) buffer powder, and 100 mM PBS buffer were purchased from Sigma-Aldrich Co. Anti-E. coli antibody was purchased from Abcam plc. A Milli-Q system (Millipore, Merck KGaA, Darmstadt, Germany) supplied deionized (DI) water with a resistivity of 18.2 MΩ·cm at 25 °C throughout the experiments.

2.2. Instrumentation and Characterization

Transmission electron microscopy (TEM) and high-resolution TEM (HR-TEM) images were obtained using a Tecnai G2 F30 transmission electron microscope. The samples were deposited on a carbon-coated Cu grid and observed using a transmission electron microscope operated at 300 kV. The powder XRD pattern of samples were measured in the range of 2θ, 5 to 90 °C, with a step size of 0.02° and an acquisition time of 2 s per step using a Bruker AXS D8-ADVANCE diffractometer, equipped with a Linxeye 1-D detector along with a CuKa radiation source. The UV–visible absorption spectra of the samples were measured using a Scinco-S-3100 UV–visible absorption spectrophotometer. The samples were recorded in the absorption range of 190–1100 nm in a 10 × 10 mm quartz cuvette. The Fourier transform infrared spectrometer (FT-IR) spectra of the solid samples were obtained using an Alpha-P instrument with solid state assembly. All electrochemical studies were conducted using an Autolab/PGSTAT302N potentiostat, and investigated using the Nova 2.1 software. A glassy carbon electrode (GCE) as the working electrode, a platinum wire as the auxiliary electrode, and an Ag/AgCl as the reference electrode were used for this study. Cyclic voltammetry (CV), differential pulse voltammetry (DPV), and electrochemical impedance spectroscopy (EIS) were performed in 100 mM PBS buffer containing 5 mM [Fe(CN)6]3−/4− and 0.1 M KCl solution.

2.3. Synthesis of MoS2

MoS2 was synthesized using the green synthetic approach, a hydrothermal method. First, hexaammonium heptamolybdate tetrahydrate [(NH4)6Mo7O24·4H2O] (1 mM) and thiourea (30 mM) were dissolved in 50 mL of DI water in a round-bottom flask, and then stirred for 2 h to achieve complete solubilization. Then, the reaction mixture was shifted to a Teflon-lined stainless steel autoclave and maintained at a high temperature for one day. After 24 h, the black crude MoS2 was obtained, and then washed with water and ethanol to obtain a pure product.

2.4. Synthesis of the MoS2–PANI Composite

The MoS2–PANI composite was synthesized using an in situ oxidative polymerization reaction directed by MoS2 nanosheets [36]. A total of 20 mg of MoS2 nanosheets was dispersed in 30 mL of HCl (1 M) in a 200 mL beaker and sonicated for 40 min. The MoS2 solution in the beaker was transferred to an ice bath and cooled below 5 °C. In contrast, 0.92 mL of aniline in 20 mL of HCl (1 M) was added to a 200 mL beaker, followed by 10 mL of ethanol dispersed in 50 mL of DI water and poured into the MoS2 solution under stirring condition in the ice bath. After 15 min, the dropwise addition of 20 mL of ammonium persulfate (1 M) solution was accomplished over 2 h. Furthermore, the reaction mixture was stirred for 12 h in the ice pack. After 12 h, the suspension was filtered and washed several times using DI water and ethanol to remove unreacted aniline and (NH4)2S2O8. The MoS2–PANI composite was dried under a vacuum at 60 °C for 24 h.

2.5. Synthesis of AuNPs

AuNPs were synthesized using the chemical reduction method. An aqueous boiling solution of HAuCl4 (0.5 mM, 100 mL) was poured into a 400 mL beaker with constant stirring. Then, 50 mM of citrate solution (50 mL) was added instantly and stirred. A color change from pale yellow to deep red was observed in the resultant solution. Subsequently, the resultant solution was boiled for 30 min and then cooled to 24 °C.

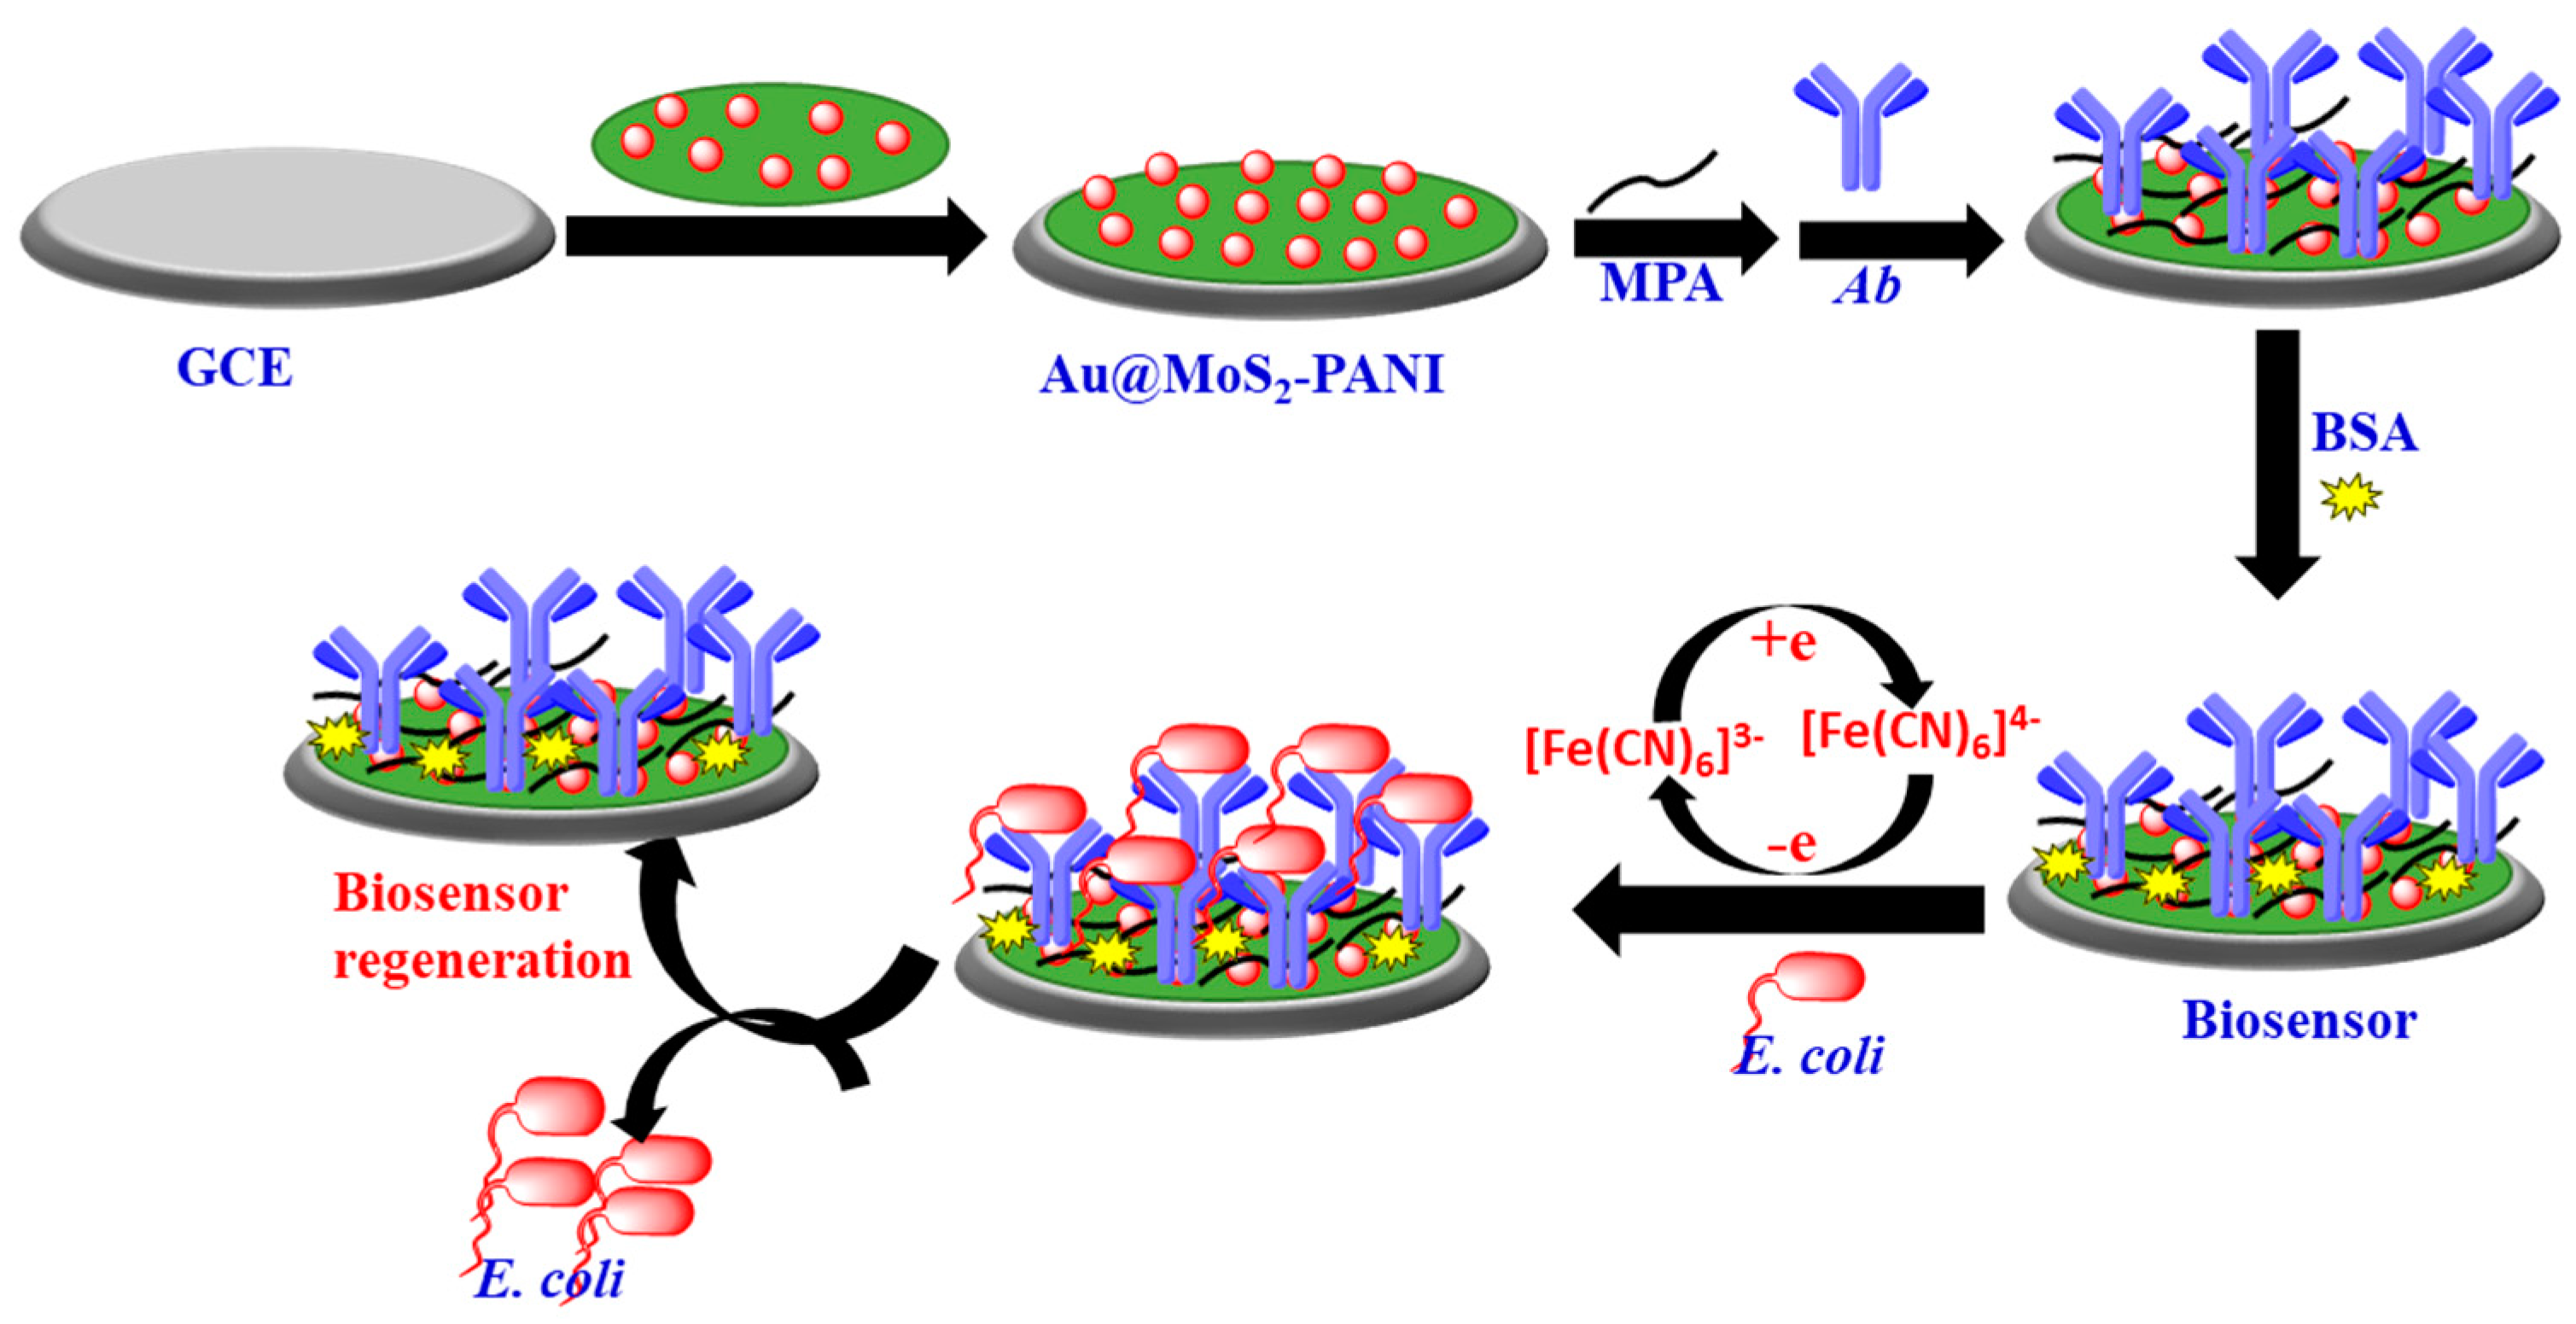
2.6. Electrochemical Immuosensor Fabrication

The GCE was polished with 0.5 μm of alumina slurry, followed by 0.005 μm of alumina slurry. Then, the polished GCE electrode was ultrasonically cleaned with DI water, followed by ethanol, and dried in air. The stock solution of MoS2–PANI (2 mg/mL) was prepared and fabricated (10 μL) on a GCE through a micropipette and dried in air. Next, the AuNP solution was drop-casted (10 μL) on the MoS2–PANI surface and dried in air. The self-assembled monolayers (SAMs) of mercaptopropionic acid on the Au@MoS2–PANI surface were prepared by drop-casting 10 μL solution (70:30 v/v, ethanol and DI water) of mercaptopropionic acid (1 mM) at room temperature and maintained for 2 h. The SAM-fabricated electrode was washed with ethanol and water to remove unreacted reagents. Subsequently, the mixed solution (1:1) of EDC and NHS (100 mM) in MES buffer (pH 6) was added to the SAM-coated surface and maintained for 1 h at 24 °C. After 1 h, 10 μL (1 mg/mL) solution of anti-E. coli antibody in PBS buffer (pH 8.5) was drop cast on the surface and maintained for 1 h at 24 °C. The immobilized electrode was washed several times with PBS buffer and blocked by 10 μL of BSA solution (1 mg/mL). After a final washing with PBS buffer, it was stored at 4 °C.

2.7. Electrochemical Measurement

The CV measurement was performed in a voltage range of −0.2 to 0.6 V at a scan rate of 50 mV·s−1 in 100 mM PBS buffer containing 5 mM of [Fe(CN)6]3−/4− and 0.1 M of KCl solution at 24 °C. The stable system was maintained, and then the CV experiment was recorded. The DPV measurement was recorded in a voltage range of −0.2 to 0.6 V with a modulation time of 0.05 s and a modulation amplitude of 50 mV. The impedance spectra were obtained in a frequency range of 0.1 Hz to 10 kHz with an amplitude of 0.05 V.

2.8. Bacterial Cell Preparation and Sensing Studies

Escherichia coli (Promega Corp., Madison, WI, USA), Acinetobacter baumannii (ATCC 19606), Staphylococcus aureus (ATCC 6538), and Pseudomonas aeruginosa (ATCC 9027) were utilized for sensing studies. All bacteria were grown in a nutrient broth medium (BD DifcoTM, BD Company, Franklin Lakes, NJ, USA). Each culture was serially diluted to obtain 107 CFU of each organism. The microdilution method was used to prepare the standard concentration of bacteria. The stock solution of bacteria (101 to 107 CFU/mL) was prepared in 1 × PBS buffer and used for sensing studies. Each bacterial concentration was loaded to each biosensor electrode and washed with PBS buffer, followed by incubation for 30 min. Subsequently, CV, DPV, and impedance measurements were obtained. To test the clinical utility of the designed biosensor, the biosensor was tested in urine sample analysis. The urine samples of healthy volunteers were collected in a sterile glass container. A range of bacterial concentrations (10 to 106 CFU/mL) were added to the urine samples.

3. Results and Discussion

3.1. Synthesis and Characterization of MoS2, MoS2–PANI, and AuNPs

MoS2 was synthesized using the hydrothermal method and characterized using TEM, FT-IR, powder XRD, and UV–visible absorption spectroscopy. The powder XRD pattern shows that the MoS2 sample is pure, crystalline, and has high phase purity (Figure S1). The detectable diffraction peaks (2θ) at 14.09°, 33.24°, 39.33°, 49.58°, and 58.99° are well matched with (002), (101), (103), (105), and (110) planes of the standard XRD data for the hexagonal structure of MoS2 [37,38]. The low-magnification TEM image of MoS2 shows that several layers are aggregated together, as shown in Figure 1A. The HR-TEM image of MoS2 clearly demonstrates that the layers are well stacked with an interlayer distance of 0.63 nm, as shown in Figure 1B,C. Moreover, to gain more detailed information, the HR-TEM image was further investigated and the lattice d spacing was matched with the (100) lattice plane of the hexagonal MoS2 phase, which was in good agreement with the powder XRD result. Before measuring the UV–visible absorption spectra of MoS2, the MoS2 powder was dispersed in DI water. The MoS2 solution was ultrasonicated for 40 min. The UV–visible absorption spectra of MoS2 reveals multiple absorption peaks at 303, 444, 613, and 674 cm−1 (Figure S2). The first two absorption peaks are associated with optical absorption of a band-edge exciton, whereas the last two absorption peaks are because of Van Hove singularities of the MoS2 monolayer. The optical spectra of MoS2 were well matched to the spectra reported in the literature, and demonstrated high optical properties and uniformity [39]. The FT-IR spectra of MoS2 exhibit an IR peak at 596 cm−1 that is assigned to Mo–S vibration, 700–1100 cm−1 that corresponds to the sulfate group, and 3400–3600 and 1620 cm−1, which correspond to the stretching and bending O–H vibration of water molecules, as shown in Figure S3 [40].
The MoS2–PANI composite was synthesized through in situ oxidative polymerization reaction and characterized by conducting UV–visible absorption, powder XRD, FT-IR, and TEM analyses. The UV–visible absorption spectra of the MoS2–PANI composite exhibit both characteristic absorption peaks of MoS2 and PANI, as shown in Figure 2A. The absorption band at 214 nm is because of the n–π* transition of PANI. In contrast, the absorption band at 445 and 778 nm is the characteristic band of MoS2–PANI and confirms the formation of the MoS2–PANI composite [41]. The composite materials exhibited visible light absorption because of the presence of MoS2 and PANI, known as visible light-driven materials. The FT-IR spectra of MoS2–PANI exhibited an IR band at 790 cm−1 because of out-of-plane C–H bending of the benzene ring. The peaks at 1235, 1466, and 1564 cm−1 indicate C–N stretching and C=C stretching in the quinone and benzene rings (Figure S4), respectively. The small peaks at 1035–1125 cm−1 are because of in-plane C–H vibration. The Mo–S and O–H stretching vibration of MoS2 was observed at 565 nm and 1650 cm−1, respectively. The powder XRD pattern of MoS2–PANI exhibits diffraction peaks (2θ) at 8.45°, 14.83°, 20.90°, and 26.31° corresponding to (001), (011), (020), and (200) reflections of PANI, respectively (Figure S5). The diffraction peaks (2θ) at 14.33°, 38.23°, 44.40°, 58.27°, 64.76°, 77.77°, and 81.96° correspond to (002), (103), (009), (110), (01111), (0010), and (0114) reflections of MoS2, respectively, and also to the hexagonal structure of MoS2. The broadening of the diffraction peaks is because of the amorphous nature of composite materials. The TEM images of MoS2–PANI show two different regions: the black zone indicates the ultrathin single MoS2 nanosheets, and the white zone indicates the PANI nanofibers, as shown in Figure 3A,B. The TEM analysis also shows that the agglomeration problem of MoS2 nanosheets was overcome by combination with PANI through electrostatic interaction.
The AuNPs were synthesized using the citrate reduction method and characterized by conducting UV–visible absorption and TEM analyses. The UV–visible absorption spectra of AuNPs exhibit an absorption peak at 522 nm, as shown in Figure 2B. This is the characteristic of the surface plasmon resonance band of AuNPs and indicates the size below 20 nm [42]. The TEM analysis of AuNPs was recorded, and the results indicate that the nanoparticles are spherical in shape with a size range of 10 to 14 nm (Figure 3C,D). The above two techniques confirm the formation of stable AuNPs.

3.2. Electrochemical Characterization of Biosensor

The biosensor was fabricated on the electrode surface (Figure 4) and characterized by conducting the CV, DPV, and EIS techniques. The CV and DPV experiments were performed in 5 mM of [Fe(CN)6]3−/4− that contained 0.1 M of KCl solution in the potential range of −0.2 to 0.6 V at a scan rate of 50 mV·s−1. The redox peak of [Fe(CN)6]3−/4− was investigated to characterize each fabrication step. The CV spectra of a bare GCE shows a reversible redox peak, as indicated in Figure 5A. After Au@MoS2–PANI immobilization on the GCE, the magnitude of the current peak was increased and slightly shifted to the negative side, revealing that the Au@MoS2–PANI composite assisted the redox process of [Fe(CN)6]3−/4−. This occurred because of the large surface area of the composite material and the functional group present on the surface of the composite material. After the immobilization of MPA and antibodies, the current significantly decreased, leading to higher peak separation. It indicated the successful immobilization of antibodies on the electrode surface (Figure 5A). Here, the covalent immobilization of antibodies on the electrode surface enhances the insulation properties, decreasing the faradaic currents. Moreover, the DPV spectra of each fabricated step were measured, and observations revealed that the peak current decreases with the antibody immobilization (Figure 5B). Therefore, both CV and DPV spectra confirmed the successful immobilization of the biosensor on the GCE surface.

3.3. Electrochemical Impedance Spectra

EIS was employed to measure the electrochemical properties of modified electrodes [43]. An immunosensor-immobilized electrode and a bare GCE were characterized using the Nyquist plot (Zimg vs. Zreal) at different frequencies (Figure 6). The higher-frequency electrochemical semicircular portion corresponds to the charge transfer resistance (Rct), whereas the low-frequency linear portion corresponds to the diffusion process. The GCE exhibited a large semicircle of 391.58 Ω, whereas MoS2–PANI fabricated on the GCE electrode exhibited a small semicircle of 345.5 Ω, indicating that the conductive and large surface area of MoS2–PANI enhance the electron transfer process from [Fe(CN)6]3−/4− to the electrode. Furthermore, upon addition of AuNPs, the semicircle decreased slightly (328.12 Ω) because of the conductive and large surface area of the AuNPs. The self-assembled monolayer of MPA on Au@MoS2–PANI increased the semicircle size (881.24 Ω), indicating the hindrance of electron transfer from solution to electrode surface. The antibody binding increased the semicircle size to 1418.81 Ω, confirming successful immobilization on the electrode surface. Furthermore, the unreacted surface was blocked using BSA, and the value of Rct was increased to 1873.40 Ω. This increase in the charge transfer resistance of the GCE confirmed successful fabrication of the immunosensor.

3.4. Electroanalytical Performance of Biosensors

The E. coli was loaded on the electrode and the CV (Figure S6) and DPV measurements were recorded. The DPV peak current of [Fe(CN)6]3−/4− decreases as the loading of E. coli concentration increases on the electrode surface (Figure 7A). This occurs because of the antibody–antigen complex formation between E. coli and antibodies of the biosensor, which cause steric hindrance to the flow of electrons from the solution to electrode surface. The peak current of [Fe(CN)6]3−/4− further decreases as the loading of E. coli on the electrode surface reaches a maximum of 107 CFU/mL. The calibration curve was plotted between the changes in peak current (ΔI) against the log of E. coli concentration (Figure 7B). This plot shows a linear relationship between the changes in peak current and E. coli concentration with a regression coefficient value (R2) of 0.98. Moreover, the impedance spectra of the biosensor in the presence of E. coli were also recorded (Figure 7C). The impedance spectra of the biosensor revealed that the charge transfer resistance (Rct) of the electrode increased from 30% to 220% with an increase in the loading of E. coli concentration from 10 to 107 CFU/mL. This large increase in electrode resistance value confirmed the binding between antibodies and E. coli, which created the steric hindrance to the flow of electrons from the solution to electrode surface. Furthermore, a plot of the change in the percentage of Rct with concentration was obtained (Figure 7D). This revealed a linear relationship between the changes in percentage charge transfer resistance to concentration with a R2 of 0.979. The LOD of the biosensor using the IUPAC-reported 3σ method was 10 CFU/mL. We compared the previously reported electrochemical biosensors for E. coli detection with our biosensor, as shown in Table S1. The proposed biosensor showed a relatively wide linear detection range, low detection limit, and short analysis time.

3.5. Selectivity Studies

To check the cross-reactivity of the biosensor toward E. coli, different bacteria, such as Acinetobacter baumannii, Staphylococcus aureus, and Pseudomonas aeruginosa, were utilized for sensing studies. The biosensor electrode was incubated with different bacteria (105 CFU/mL), and the DPV spectra were recorded. The DPV spectra of the sensor exhibited a significant change in peak current with E. coli. In contrast, other bacteria exhibited a small change in peak current at the same concentration (Figure S7). However, this can be regarded as nonspecific background. Further studies for higher affinity interactions are needed for the practical use of the proposed biosensor.

3.6. Biosensor Stability Studies

To check biosensor stability, the fabricated electrode was stored at 4 °C for 21 days, and the DPV spectra were recorded (Figure S8). The DPV spectra show that 75% of the DPV current signal of the biosensor is preserved, whereas 25% of the signal is lost. This shows that the proposed biosensor provides adequate stability and can be stored for long-term use.

3.7. Urine Sample Analysis

The clinical utility of the biosensor was determined by measuring E. coli in urine samples. The standard addition method was employed for the spike sample preparation. The results revealed that the added value of E. coli was highly consistent with the value found, as shown in Table 1. The recovery value was found to be 90–110%, which indicated the reliability of this biosensor in a complex liquid matrix and its applicability to the early detection of E. coli in the food industry and clinical diagnosis.

3.8. Electrode Regeneration Studies

A regenerative affinity surface electrode was studied because it reduces the cost and time of biosensor fabrication. The prepared biosensor was used for electrode regeneration by removing the antigen–antibody complex using 4 M of urea solution [44,45]. The bacteria-loaded biosensor was dipped into urea solution for 30 min, and then washed with PBS buffer. The electrode regeneration studies were conducted for three cycles (Figure S9). The observations showed that the biosensor lost 22% of its signal after the third regeneration cycle.

4. Conclusions

A label-free electrochemical biosensor was developed for simple and sensitive detection of bacterial pathogens. The electrochemical biosensor was fabricated using Au@MoS2–PANI nanocomposites because of their high conductivity and large surface area. The self-assembled monolayer of MPA was attached to the gold surface for covalent functionalization of antibodies. The DPV and EIS techniques were successfully utilized for sensing studies. The biosensor demonstrated high selectivity and sensitivity for E. coli detection with an LOD of 10 CFU/mL and a linear detection range of 10–107 CFU/mL. The biosensor exhibited practical applicability in urine sample analysis with good recovery of spike samples. It is possible to change the bioreceptor immobilized on the biosensor for detecting other bacterial pathogens. Further improvements str still required to allow the processing of more complex clinical samples such as serum, sputum, and whole blood for widespread use of the biosensor. More testing to determine interfering analytes is needed. Nevertheless, the developed biosensor shows a great potential for the analysis of microorganisms in clinical diagnosis, the food industry, and environment monitoring.

Supplementary Materials

The following are available online at https://www.mdpi.com/2227-9040/9/3/49/s1: Figure S1: Powder XRD pattern of MoS2 nanosheets; Figure S2: UV–visible absorption spectra of MoS2 nanosheets dispersed in DI water, the inset showing a photograph of MoS2 dispersed in DI water; Figure S3: FT-IR spectra of MoS2 nanosheets; Figure S4: FT-IR spectra of MoS2–PANI composites; Figure S5: Powder XRD pattern of MoS2–PANI composites; Figure S6: CV spectra of the biosensor in the presence of E. coli in 5 mM [Fe(CN)6]3−/4−, 0.1 M KCl, and 0.1 M PBS buffer (pH = 7.4); Figure S7: Change in the DPV current of the biosensor in the presence of different bacteria with a concentration of 105 CFU/mL; Figure S8: DPV spectra of the biosensor electrode after 21 days of storage at 4 °C in 5 mM [Fe(CN)6]3−/4−, 0.1 M KCl, and 0.1 M PBS buffer (pH = 7.4); Figure S9: Effect of regeneration on the DPV peak current of the biosensor; 104 CFU/mL of E. coli in 5 mM [Fe(CN)6]3−/4−, 0.1 M KCl, and 0.1 M PBS buffer (pH = 7.4); Table S1: Comparison of E. coli biosensors in the literature and the proposed biosensor.

Author Contributions

Conceptualization, T.Y.L.; methodology, P.R.; validation, P.R.; writing—original draft preparation, P.R.; resources, M.H.O.; writing—review and editing, T.Y.L. and K.H.; funding acquisition, T.Y.L. All authors have read and agreed to the published version of the manuscript.

Funding

This research was supported by a research fund from Chungnam National University.

Institutional Review Board Statement

Not applicable.

Informed Consent Statement

Not applicable.

Data Availability Statement

Data available on request to corresponding authors.

Acknowledgments

The authors gratefully acknowledge the Center for Bio-Medical Engineering Core Facility at Dankook University for providing critical reagents and research space.

Conflicts of Interest

The authors declare that there are no conflicts of interest.

References

  1. Kuss, S.; Amin, H.M.A.; Compton, R.G. Electrochemical Detection of Pathogenic Bacteria-Recent Strategies, Advances and Challenges. Chem. Asian J. 2018, 13, 2758–2769. [Google Scholar] [CrossRef] [PubMed]
  2. Azuma, T.; Otomo, K.; Kunitou, M.; Shimizu, M.; Hosomaru, K.; Mikata, S.; Ishida, M.; Hisamatsu, K.; Yunoki, A.; Mino, Y.; et al. Environmental fate of pharmaceutical compounds and antimicrobial-resistant bacteria in hospital effluents, and contributions to pollutant loads in the surface waters in Japan. Sci. Total Environ. 2019, 657, 476–484. [Google Scholar] [CrossRef]
  3. Lee, W.-I.; Park, Y.; Shrivastava, S.; Jung, T.; Meeseepong, M.; Lee, J.; Jeon, B.; Yang, S.; Lee, N.-E. A fully integrated bacterial path-ogen detection system based on count-on-a-cartridge platform for rapid, ultra-sensitive, highly accurate and culture-free assay. Biosens. Bioelectron. 2020, 152, 112007. [Google Scholar] [CrossRef]
  4. Zheng, L.; Cai, G.; Qi, W.; Wang, S.; Wang, M.-H.; Lin, J. Optical Biosensor for Rapid Detection of Salmonella typhimurium Based on Porous Gold@Platinum Nanocatalysts and a 3D Fluidic Chip. ACS Sens. 2020, 5, 65–72. [Google Scholar] [CrossRef]
  5. Chen, F.; Kim, S.; Na, J.-H.; Han, K.; Lee, T.Y. A single-tube sample preparation method based on a dual-electrostatic interaction strategy for molecular diagnosis of gram-negative bacteria. Microchim. Acta 2020, 187, 1–12. [Google Scholar] [CrossRef]
  6. Hessling, M.; Feiertag, J.; Hoenes, K. Pathogens provoking most deaths worldwide: A review, Biosci. Biotechnol. Res. Commun. 2017, 10, 1–7. [Google Scholar] [CrossRef]
  7. Sayad, A.; Ibrahim, F.; Uddin, S.M.; Cho, J.; Madou, M.; Thong, K.L. A microdevice for rapid, monoplex and colorimetric detection of foodborne pathogens using a centrifugal microfluidic platform. Biosens. Bioelectron. 2018, 100, 96–104. [Google Scholar] [CrossRef]
  8. Bintsis, T. Foodborne Pathogens. AIMS Microbiol. 2017, 3, 529–563. [Google Scholar] [CrossRef]
  9. Croxen, M.A.; Law, R.J.; Scholz, R.; Keeney, K.M.; Wlodarska, M.; Finlay, B.B. Recent advances in understanding enteric patho-genic Escherichia coli. Clin. Microbiol. Rev. 2013, 26, 822–880. [Google Scholar] [CrossRef] [PubMed] [Green Version]
  10. Joseph, A.; Cointe, A.; Kurkdjian, P.M.; Rafat, C.; Hertig, A. Shiga Toxin-Associated Hemolytic Uremic Syndrome: A Narrative Review. Toxins 2020, 12, 67. [Google Scholar] [CrossRef] [Green Version]
  11. Zhang, R.; Belwal, T.; Li, L.; Lin, X.; Xu, Y.; Luo, Z. Nanomaterial-based biosensors for sensing key foodborne pathogens: Ad-vances from recent decades. Compr. Rev. Food Sci. Food Saf. 2020, 19, 1465–1487. [Google Scholar] [CrossRef]
  12. Cesewski, E.; Johnson, B.N. Electrochemical biosensors for pathogen detection. Biosens. Bioelectron. 2020, 159, 112214. [Google Scholar] [CrossRef]
  13. Ranjbar, S.; Nejad, M.A.F.; Parolo, C.; Shahrokhian, S.; Merkoçi, A. Smart Chip for Visual Detection of Bacteria Using the Elec-trochromic Properties of Polyaniline. Anal. Chem. 2019, 91, 14960–14966. [Google Scholar] [CrossRef] [PubMed]
  14. Choi, J.R.; Yong, K.W.; Choi, J.Y.; Cowie, A.C. Emerging Point-of-care Technologies for Food Safety Analysis. Sensors 2019, 19, 817. [Google Scholar] [CrossRef] [Green Version]
  15. Chen, F.; Lee, S.-Y.; Han, K.; Lee, T.Y. N,N-Dimethyl-4,4′-azodianiline functionalized magnetic nanoparticles for enhanced sensitivity of nucleic acid amplification tests. Sens. Actuators B Chem. 2021, 332, 129461. [Google Scholar] [CrossRef]
  16. Guo, Q.; Han, J.-J.; Shan, S.; Liu, D.-F.; Wu, S.-S.; Xiong, Y.-H.; Lai, W.-H. DNA-based hybridization chain reaction and biotin–streptavidin signal amplification for sensitive detection of Escherichia coli O157:H7 through ELISA. Biosens. Bioelectron. 2016, 86, 990–995. [Google Scholar] [CrossRef]
  17. Eissa, S.; Zourob, M. A dual electrochemical/colorimetric magnetic nanoparticle/peptide-based platform for the detection of Staphylococcus aureus. Analyst 2020, 145, 4606–4614. [Google Scholar] [CrossRef]
  18. Bian, X.; Jing, F.; Li, G.; Fan, X.; Jia, C.; Zhou, H.; Jin, Q.; Zhao, J. A microfluidic droplet digital PCR for simultaneous detection of pathogenic Escherichia coli O157 and Listeria monocytogenes. Biosens. Bioelectron. 2015, 74, 770–777. [Google Scholar] [CrossRef] [PubMed]
  19. Law, J.W.-F.; Mutalib, N.-S.A.; Chan, K.-G.; Lee, L.-H. Rapid methods for the detection of foodborne bacterial pathogens: Prin-ciples, applications, advantages and limitations. Front. Microbiol. 2015, 5, 770. [Google Scholar] [CrossRef] [Green Version]
  20. Gunasekera, T.S.; Attfield, P.V.; Veal, D.A. A Flow Cytometry Method for Rapid Detection and Enumeration of Total Bacteria in Milk. Appl. Environ. Microbiol. 2000, 66, 1228–1232. [Google Scholar] [CrossRef] [Green Version]
  21. Shahrokhian, S.; Ranjbar, S. Development of a Sensitive Diagnostic Device Based on Zeolitic Imidazolate Frameworks-8 Using Ferrocene–Graphene Oxide as Electroactive Indicator for Pseudomonas aeruginosa Detection. ACS Sustain. Chem. Eng. 2019, 7, 12760–12769. [Google Scholar] [CrossRef]
  22. Ahmed, A.; Rushworth, J.V.; Hirst, N.A.; Millner, P.A. Biosensors for Whole-Cell Bacterial Detection. Clin. Microbiol. Rev. 2014, 27, 631–646. [Google Scholar] [CrossRef] [Green Version]
  23. Liu, Y.; Zhou, H.; Hu, Z.; Yu, G.; Yang, D.; Zhao, J. Label and label-free based surface-enhanced Raman scattering for pathogen bacteria detection: A review. Biosens. Bioelectron. 2017, 94, 131–140. [Google Scholar] [CrossRef] [PubMed]
  24. Sanvicens, N.; Pastells, C.; Pascual, N.; Marco, M.-P. Nanoparticle-based biosensors for detection of pathogenic bacteria. TrAC Trends Anal. Chem. 2009, 28, 1243–1252. [Google Scholar] [CrossRef]
  25. Inbaraj, B.S.; Chen, B. Nanomaterial-based sensors for detection of foodborne bacterial pathogens and toxins as well as pork adulteration in meat products. J. Food Drug Anal. 2016, 24, 15–28. [Google Scholar] [CrossRef] [Green Version]
  26. Tian, F.; Lyu, J.; Shi, J.; Yang, M. A polymeric microfluidic device integrated with nanoporous alumina membranes for simulta-neous detection of multiple foodborne pathogens. Sens. Actuators B Chem. 2016, 225, 312–318. [Google Scholar] [CrossRef]
  27. Mocan, T.; Matea, C.T.; Pop, T.; Mosteanu, O.; Buzoianu, A.D.; Puia, C.; Iancu, C.; Mocan, L. Development of nanoparticle-based optical sensors for pathogenic bacterial detection. J. Nano Biotechnol. 2017, 15, 1–14. [Google Scholar] [CrossRef] [Green Version]
  28. Erdem, Ö.; Saylan, Y.; Cihangir, N.; Denizli, A. Molecularly imprinted nanoparticles based plasmonic sensors for real-time En-terococcus faecalis detection. Biosens. Bioelectron. 2019, 126, 608–614. [Google Scholar] [CrossRef]
  29. Soares, R.R.A.; Hjort, R.G.; Pola, C.C.; Parate, K.; Reis, E.L.; Soares, N.F.F.; McLamore, E.S.; Claussen, J.C.; Gomes, C.L. Laser-Induced Graphene Electrochemical Immunosensors for Rapid and Label-Free Monitoring of Salmonella enterica in Chicken Broth. ACS Sens. 2020, 5, 1900–1911. [Google Scholar] [CrossRef]
  30. Khan, M.Z.H.; Hasan, M.R.; Hossain, S.I.; Ahommed, M.S.; Daizy, M. Ultrasensitive detection of pathogenic viruses with elec-trochemical biosensor: State of the art. Biosens. Bioelectron. 2020, 166, 112431. [Google Scholar] [CrossRef]
  31. Chen, Y.; Qian, C.; Liu, C.; Shen, H.; Wang, Z.; Ping, J.; Wu, J.; Chen, H. Nucleic acid amplification free bio-sensors for pathogen detection. Biosens. Bioelectron. 2020, 153, 112049. [Google Scholar] [CrossRef]
  32. Pandya, H.J.; Kanakasabapathy, M.K.; Verma, S.; Chug, M.K.; Memic, A.; Gadjeva, M.; Shafiee, H. Label-free electrical sensing of bacteria in eye wash samples: A step towards point-of-care detection of pathogens in patients with infectious keratitis. Biosens. Bioelectron. 2017, 91, 32–39. [Google Scholar] [CrossRef] [PubMed] [Green Version]
  33. Reta, N.; Saint, C.P.; Michelmore, A.; Prieto-Simon, B.; Voelcker, N.H. Nanostructured Electrochemical Biosensors for Label-Free Detection of Water- and Food-Borne Pathogens. ACS Appl. Mater. Interfaces 2018, 10, 6055–6072. [Google Scholar] [CrossRef]
  34. Jijie, R.; Kahlouche, K.; Barras, A.; Yamakawa, N.; Bouckaert, J.; Gharbi, T.; Szunerits, S.; Boukherroub, R. Reduced graphene ox-ide/polyethylenimine based immunosensor for the selective and sensitive electrochemical detection of uropathogenic Esche-richia coli. Sens. Actuators B Chem. 2018, 260, 255–263. [Google Scholar] [CrossRef]
  35. Mathelié-Guinlet, M.; Cohen-Bouhacina, T.; Gammoudi, I.; Martin, A.; Béven, L.; Delville, M.-H.; Grauby-Heywang, C. Silica nanoparticles-assisted electrochemical biosensor for the rapid, sensitive and specific detection of Escherichia coli. Sens. Actuators B Chem. 2019, 292, 314–320. [Google Scholar] [CrossRef]
  36. Huang, K.-J.; Zhang, J.-Z.; Liu, Y.-J.; Wang, L.-L. Novel electrochemical sensing platform based on molybdenum disulfide nanosheets-polyaniline composites and Au nanoparticles. Sens. Actuators B Chem. 2014, 194, 303–310. [Google Scholar] [CrossRef]
  37. Selvamani, P.S.; Vijaya, J.J.; Kennedy, L.J.; Saravanakumar, B.; Bououdina, M. High-performance supercapacitor based on Cu2O/MoS2/rGO nanocomposite. Mater. Lett. 2020, 275, 128095. [Google Scholar] [CrossRef]
  38. Liu, Y.-R.; Hu, W.-H.; Li, X.; Dong, B.; Shang, X.; Han, G.-Q.; Chai, Y.-M.; Liu, Y.-Q.; Liu, C.-G. One-pot syn-thesis of hierarchical Ni2P/MoS2 hybrid electrocatalysts with enhanced activity for hydrogen evolu-tion reaction. Appl. Surf. Sci. 2016, 383, 276–282. [Google Scholar] [CrossRef]
  39. Dumcenco, D.; Ovchinnikov, D.; Marinov, K.; Lazić, P.; Gibertini, M.; Marzari, N.; Sanchez, O.L.; Kung, Y.-C.; Krasnozhon, D.; Chen, M.-W.; et al. Large-Area Epitaxial Monolayer MoS2. ACS Nano 2015, 9, 4611–4620. [Google Scholar] [CrossRef]
  40. Ali, G.A.M.; Thalji, M.R.; Soh, W.C.; Algarni, H.; Chong, K.F. One-step electrochemical synthesis of MoS2/graphene composite for supercapacitor application. J. Solid State Electrochem. 2019, 24, 25–34. [Google Scholar] [CrossRef]
  41. Saha, S.; Chaudhary, N.; Mittal, H.; Gupta, G.; Khanuja, M. Inorganic–organic nanohybrid of MoS2-PANI for advanced photo-catalytic application. Int. Nano Lett. 2019, 9, 127–139. [Google Scholar] [CrossRef] [Green Version]
  42. Huang, X.; El-Sayed, M.A. Gold nanoparticles: Optical properties and implementations in cancer diagnosis and photothermal therapy. J. Adv. Res. 2010, 1, 13–28. [Google Scholar] [CrossRef] [Green Version]
  43. Devi, R.; Gogoi, S.; Barua, S.; Dutta, H.S.; Bordoloi, M.; Khan, R. Electrochemical detection of monoso-dium glutamate in foodstuffs based on Au@MoS2/chitosan modified glassy carbon electrode. Food Chem. 2019, 276, 350–357. [Google Scholar] [CrossRef]
  44. Goode, J.A.; Rushworth, J.V.H.; Millner, P.A. Biosensor Regeneration: A Review of Common Techniques and Outcomes. Langmuir 2015, 31, 6267–6276. [Google Scholar] [CrossRef] [PubMed]
  45. Mo, X.; Wu, Z.; Huang, J.; Zhao, G.; Dou, W. A sensitive and regenerative electrochemical immunosensor for quantitative detec-tion of Escherichia coli O157:H7 based on stable polyaniline coated screen-printed carbon electrode and rGO-NR-Au@Pt. Anal. Methods 2019, 11, 1475–1482. [Google Scholar] [CrossRef]
Figure 1. TEM images of MoS2: (A) low-magnification image; (B,C) high-resolution TEM image of layered MoS2.
Chemosensors 09 00049 g001
Figure 2. (A) UV–visible absorption spectra of MoS2–PANI nanocomposite dispersed in water, and inset showing a photograph of the MoS2–PANI composite; (B) UV–visible absorption spectra of AuNPs, and inset showing a photograph of the AuNP solution.
Chemosensors 09 00049 g002
Figure 3. (A,B) TEM images of the MoS2–PANI composite; (C,D) TEM images of AuNPs.
Chemosensors 09 00049 g003
Figure 4. Schematic representation of the proposed electrochemical biosensor for E. coli.
Chemosensors 09 00049 g004
Figure 5. (A,B) The CV and DPV spectra of the immunosensor in 5 mM of [Fe(CN)6]3−/4−, 0.1 M of KCl, and 100 mM PBS buffer (pH = 7.4).
Chemosensors 09 00049 g005
Figure 6. Impedance spectra of the immunosensor in 5 mM of [Fe(CN)6]3−/4−, 0.1 M of KCl, and 100 mM PBS buffer (pH = 7.4).
Chemosensors 09 00049 g006
Figure 7. (A) Change in the DPV spectra of biosensor in the presence of E. coli in 5 mM of [Fe(CN)6]3−/4−, 0.1 M of KCl, and 100 mM PBS buffer (pH = 7.4). (B) Calibration plot between changes in current to concentration of E. coli; (C) Nyquist plot of the biosensor in the presence of E. coli in 5 mM of [Fe(CN)6]3−/4−, 0.1 M of KCl, and 100 mM PBS buffer (pH = 7.4). (D) Percentage change in charge transfer resistance (Rct) in the presence of E. coli.
Chemosensors 09 00049 g007
Table 1. Spike sample of E. coli in urine samples with recovery value (%).
Urine SampleAdded
(CFU/mL)
Found
(CFU/mL)
Recovery (%)
11011110
210390090
3105102,000102
Publisher’s Note: MDPI stays neutral with regard to jurisdictional claims in published maps and institutional affiliations.

