Abstract
Pharmaceuticals wastes have been recognized as emerging pollutants to the environment. Among those, antibiotics in the aquatic environment are one of the major sources of concern, as chronic, low-dose exposure can lead to antibiotic resistance. Herein, we report on molecularly imprinted polymers (MIP) to recognize penicillin V potassium salt (PenV-K), penicillin G potassium salt (PenG-K), and amoxicillin sodium salt (Amo-Na), which belong to the most widespread group of antibiotics worldwide. Characterization and optimization led to two MIPs comprising methacrylic acid as the monomer and roughly 55% ethylene glycol dimethacrylate as the crosslinker. The obtained layers led to sensitive, selective, repeatable, and reusable sensor responses on quartz crystal microbalances (QCM). The LoD for PenV-K, PenG-K, and Amo-Na sensors are 0.25 mM, 0.30 mM, and 0.28 mM, respectively; imprinting factors reach at least around three. Furthermore, the sensors displayed relative selectivity factors of up to 50% among the three penicillins, which is appreciable given their structural similarity.
1. Introduction
Antibiotics have revolutionized medicine during the last decades and thus changed the pattern of modern life [1,2]. Among all groups of antibiotics, penicillins belong to the most widely used ones, since they are highly effective against microbes and hardly toxic to mammals [3,4].
Penicillins are also known as β-lactam antibiotics and capable to treat the most common bacterial infections in humans and animals [3,5]. Generally, penicillin V (PenV) and penicillin G (PenG) are classified as natural penicillins, which are highly active against gram-positive bacteria. Usually, they are produced directly from fermentation of Penicillium chrysogenum [6,7]. The desire to enhance the efficiency of penicillins against gram-negative pathogens led to the aminopenicillin group of drugs through adding an amino group as a side chain to the penicillin core structure. Amoxicillin (Amo) is a common aminopenicillin. Usually, one can obtain it semi-synthetically from natural penicillin [8]. To date, it is the most prescribed antibiotic for children [9,10]. On the other side, misuse and abuse of antibiotics are becoming an increasing concern. For instance, industrial production, laboratory research, high drug consumption, and health care facilities are sources of water pollution with antibiotics. Among them, hospital sewage plays a special role regarding antibiotic contamination, because it contains various pharmaceuticals and diagnostic agents [11]. This increases both the probability that they inadvertently enter aquatic environments and thus the risk of antibiotic resistance in microbes, which result in destructive effects in a variety of ecosystems and pose a substantial threat to human health [12,13]. In addition to these health effects—affecting not only humans, but also animals—antibiotic resistance also represents a substantial economic threat since it results in extra health care costs and productivity losses, for instance, at least around €1.5 billion each year in the EU [14].
Therefore, the World Health Organization (WHO) has declared antibiotic resistance a “major threat to public health” and demands strengthening global surveillance of this issue [15]. This includes monitoring the effectiveness of public health interventions and detecting new trends to minimize the sources of antibiotics in the environment [15,16].
A range of analytical methods has been used to detect penicillins, including mass spectrometry, chromatography, or their combination [17,18]. However, they suffer from some limitations mainly relating to sample preparation and overall complexity [19]. Hence, the need for straightforward screening measurements makes it interesting to design sensors.
Molecularly imprinted polymers (MIPs) constitute a possible strategy to obtain the artificial receptors needed for that purpose [20,21]. MIPs rely on—usually—highly cross-linked polymers that are able to bind their target species based on a key–lock mechanism [22,23]. MIPs are synthesized to contain artificial binding sites that mimic the 3D structure of a given template within the polymer bulk or on its surface [24,25]. Generally, preparing imprints in bulk polymers comprises three steps. During the first step, a functional monomer forms an adduct with the template molecule(s) in a suitable solvent through non-covalent interactions. Then, polymerization proceeds in the presence of a cross-linker and an initiator to form the polymeric matrix. Finally, the template is removed by an adequate solvent to create binding sites with selective recognition properties [26,27]. MIPs have several advantages over natural receptors such as antibodies: They combine selectivity, stability, ruggedness, and sensitivity with comparably low cost [27]. Among others, MIPs can be used as receptors on quartz-crystal microbalances (QCMs) [28]. In fact, binding of the target molecule to a binding site on the MIP increases the mass of the coating on the QCM electrode and results in decreasing resonance frequency [29].
Herein, we report a MIP thin film sensor system for the detection of Penicillin V potassium (PenV-K), Penicillin G potassium (PenG-K), and Amoxicillin sodium (Amo-Na) in aqueous media, which are the standard forms to administer these drugs to ensure solubility in body fluids; the free acids are hardly water soluble (see Figure 1 for the respective chemical structures).
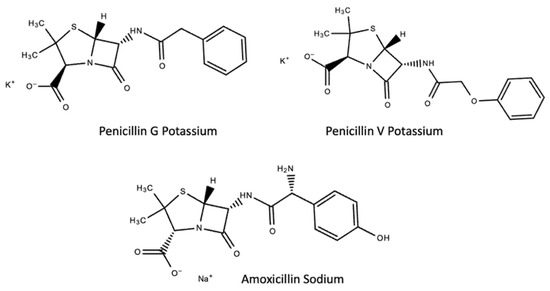
Figure 1.
Chemical structures of target penicillin compounds.
2. Materials and Methods
2.1. Reagents
Methacrylic acid (MAA), Ethylene glycol di-methacrylate (EGDMA), and 2, 2″-azobisisobutyronitrile (AIBN) were obtained from Sigma-Aldrich, Germany. Dimethyl sulphoxide (DMSO), Ethanol (EtOH), Methanol (MeOH), Tetrahydrofuran (THF), and Potassium chloride (KCl) were purchased from Merck, Germany. In all cases, we used analytical purity or the highest available purity for synthesis. Penicillin V potassium (PenV-K), Penicillin G potassium (PenG-K), and Amoxicillin sodium (Amo-Na) were provided by Sandoz, Austria, which we gratefully acknowledge.
2.2. Synthesis of MIPs’ Thin Films
Synthesis of polymer thin films relied on free radical polymerization. Our syntheses comprised six different imprinted and non-imprinted polymers (NIPs) utilizing different functional monomer-to-cross-linker ratios. For this purpose, we applied MAA as a functional monomer and EGDMA as cross-linker, as well as PenV-K, PenG-K, and Amo-Na as the templates. Table 1 summarizes the corresponding polymer compositions.

Table 1.
Monomer compositions of polymers used in this study to synthesize acrylic-based MIPs for detection of PenV-K, PenG-K, and Amo-Na. Constant amount of template = 0.028 mmol.
To synthesize MIP thin films, we first dissolved the functional monomer and 8 mg (0.028 mmol) of the respective template in 800 µL DMSO as the porogenic solvent in an Eppendorf vial and sonicated for about 15 min. In the next step, we added 4 mg (0.024 mmol) AIBN as the initiator and the respective amount of cross-linker according to Table 1. Thereupon, the monomer solution was kept in an ice bath while flushing Argon through the vial for about 20 min to remove oxygen. Subsequently, this mixture was thermally polymerized while stirring with a magnetic stirrer at 60 °C for around 30 min just before reaching the gel point. This oligomer solution then served for coating the respective QCM electrode. The corresponding non-imprinted (NIP) sample was prepared in the same manner but without adding the template.
2.3. Preparing the Sensors
Figure 2 shows the dual-electrode geometry of QCMs with a fundamental resonance frequency of 10 MHz manufactured by screen printing onto commercially available AT-cut quartz plates (168 μm thick, 13.8 mm diameter; purchased from Roditi Inc., London, UK) as described before [30]. Briefly, the first step comprised of preparing the necessary stencils from artificial silk, which we strained and glued onto a metal frame. Next, the textile was covered with photoresist lacquer (Azocol Poly-Plus S, KIWO, Wiesloch, Germany) and dried in the dark for around 1 hour. Last, the stencil was hardened under UV light (UV-Belichtungsgeraet, 220 Volt, isel, Eichenzell, Germany) while exposing it through a mask that shadowed off the further electrode design. After illuminating for around 1 minute and washing with water to remove the non-hardened photoresist, the mask was ready to use for screen printing. Two different sieves were prepared for the air side and sample side (fully metalized side) of QCMs, respectively. During the final step, the quartz was fixed on a disc-shaped Teflon socket by using a vacuum pump. Then, the sieve, comprising the respective pattern, was placed over the QCMs followed by screen printing commercially available brilliant gold paste (Heraeus GmbH, Hanau, Germany) through the stencil. Finally, we heated QCMs in the oven at 400 °C for 4 h to remove organic residues and, thus, to generate the final gold electrodes. Consecutively, the same procedure was repeated to deposit the gold electrode patterns on the second face of the corresponding quartzes.
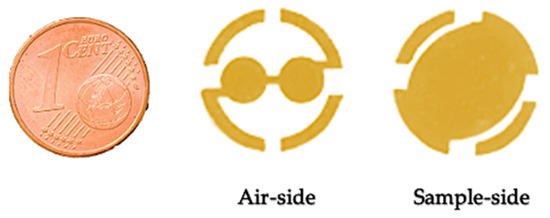
Figure 2.
Self-made, dual-electrode design of QCMs (both air side and sample side).
2.4. Coating Process of Thin Films on QCM
For spin-coating, we used a PI-KEM LTD G3P-8 spin coater. To generate thin films, we dropped 5 μL of oligomer solution containing the template and without adding it, respectively, on one electrode of a dual-electrode QCM by a piston-pipet at a spin speed of 2000 rpm and kept the QCM at this speed for about 15 s to establish a homogeneous sensor layer. One of the electrodes served as a working electrode to be coated with the respective MIP; the other one was the reference electrode coated with NIP. In all cases, we first coated one electrode, hardened the polymer, and then coated the other electrode. Afterwards, the sensor was incubated at 80 °C overnight to evaporate the DMSO and harden the polymer. Finally, to remove the template molecules from the polymer matrix, the QCMs were rinsed with distilled water in a stirred beaker overnight at room temperature.
To determine the layer thickness of the polymer films on the QCM, we utilized an Agilent ENA series network analyzer (model no. E5062A). The change of frequencies and damping values before/after coating and after washing the polymer was recorded and allowed us to estimate the respective layers’ heights based on the experience of the group [31]. In addition, removal of the template molecules from the MIP film was also monitored by the network analyzer: Successful removal resulted in an increase of the resonance frequency of QCM after washing.
2.5. AFM Analysis
The surface morphologies of imprinted and non-imprinted polymer thin films after washing and template removal, respectively, were examined by atomic force microscopy (AFM) at ambient temperature. These measurements took place on a Bruker Instruments NanoScope VIII with a TESPA-V2 tip in tapping mode (TM) at a scan rate of 1 Hz and a scan size of 5 μm, using the AFM operating and evaluation software provided by the producer.
2.6. QCM Measurement Setup
Figure 3 shows the schematic of the used QCM measuring setup. To ensure actual mass-sensitive sensor measurements, it utilizes dual-electrode QCMs to compensate for unspecific frequency effects (such as temperature changes and nonspecific binding) through the non-imprinted film on the reference electrode. The electrode showing lower resonant frequency was used for MIP deposition to prevent crosstalk of the two channels, since frequency decreases on the MIP channel were expected to be larger than those on the NIP channel.
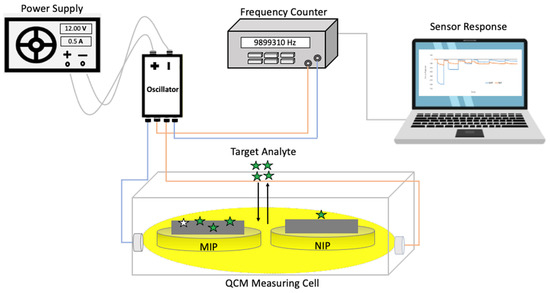
Figure 3.
Schematic of the mass-sensitive measurement setup.
Briefly, the measurement setup comprised a custom-made polymethylmethacrylate (PMMA) measuring cell with a polydimethylsiloxane (PDMS) cap to fix the QCM sensor inside the cell. The overall sample volume of this cell was around 130 µL. The PDMS contained inlet and outlet tubes to expose the sensor to sample solutions. Furthermore, due to its comparably low thermal conductance, it usually does not influence the temperature in the measuring cell within the time of sample exposure. The cell connects to a custom-made oscillator via SMA sockets and coaxial cables. The oscillator uses the QCM as the frequency-determining element. To read out the respective resonance frequencies of the two channels as a function of time and transfer the output data to the PC, we used a LabVIEW routine prepared in house.
Every measurement started with injecting 150 µL of 50 mM KCl solution into the measuring cell using a piston-pipette and waiting until the frequency showed stable baseline at room temperature. Then, we recorded the frequency changes resulting from injecting analyte solutions in stopped flow (during each injection the read-out was paused for around 30–60 s to avoid spikes resulting from sample changes). After the frequency reached a stable value or established equilibrium, we flushed the cell three times with 150 µL of 50 mM KCl solution to remove analyte molecules from the sensor layer. Herein, the QCM measurements served to characterize PenV-K, PenG-K, and Amo-Na MIP thin films according to their sensitivity and selectivity of sensor performance. Using KCl solution as the background rather than water helped us to exclude/compensate for any effects caused by changing ion concentrations in the solution.
3. Results and Discussion
3.1. Optimization of MIP Thin Film
The first step in designing MIP sensors is to optimize polymerization conditions: Figure 4 summarizes the sensor effects of the six polymers mentioned in Table 1 when exposing them to aqueous solutions containing 2.50 mM of PenV-K and PenG-K, respectively. “Sensor response” in this case refers to the signal difference between MIP channel and NIP channel. It is worth mentioning that all sensor responses were normalized to the respective layer heights because the sensitivity of sensors coated with bulk-imprinted materials varies with thickness.
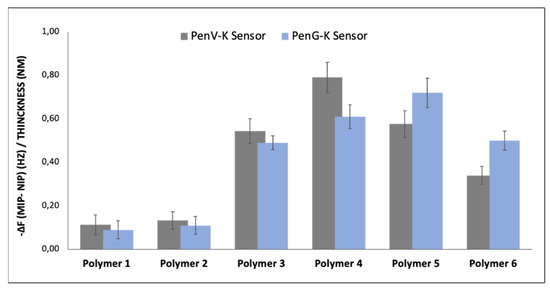
Figure 4.
QCM sensor responses (difference between MIP and NIP electrode normalized to polymer layer thickness) for six synthesized polymers at the concentration of 2.50 mM of PenV-K and PenG-K.
Clearly, polymer 1 and polymer 2 show only low affinity to the respective template molecule due to the low monomer-to-template ratio. There is almost no difference in sensor signal between the MIP and the NIP sensors, respectively, which indicates only nonspecific binding of the penicillin molecules to the sensor layers. Polymer 3, polymer 4, and polymer 5 exhibit larger imprinting effects against the templates by factors of five to eight, respectively. Polymer 6 containing a higher amount of cross-linker again exhibits lower sensor responses: When increasing the amount of cross-linker above the optimum, the number of available binding sites obviously decreases and, thus, also the respective sensor responses. Obviously, both binding capacity and selectivity of MIPs have been optimized by finding the ideal ratio between the functional monomer(s), crosslinker, and template in a suitable solvent [32]. Overall, polymer 4 turned out optimal for binding PenV-K molecules and polymer 5 for PenG-K, even though the differences between them are within the error margins.
Obviously, hydrophilic (hydrogen bond and polar) interactions play a key role in sensor recognition: While the PenV-K molecule provides 1 hydrogen donor and 6 hydrogen acceptors [33], PenG molecules comprises 1 hydrogen donor and 5 hydrogen acceptors [34], which may be the reason that the slightly more cross-linked polymer yields somewhat higher sensor responses for PenG-K. Therefore, further experiments relied on those two polymers. Additionally, polymer 4 was also selected to establish Amo-Na MIP and NIP layers. It is worth noting the amoxicillin molecule also offers three hydrogen donors and seven hydrogen acceptors [35], which allowed us to use the lower cross-linked polymer recipe.
Figure 5 shows the estimated polymer film thicknesses of NIPs and MIPs layer based on the Sauerbrey equation for QCMs (Equation (1)) [36] after coating polymer and after washing/template removal. To calculate those layer heights from frequency shifts, one needs to use the well-known Sauerbrey equation:
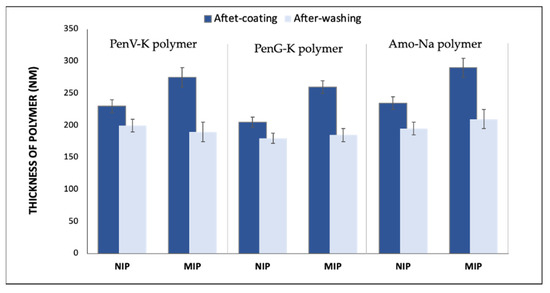
Figure 5.
Approximate layer thicknesses of both NIP and MIP films of PenV-K, PenG-K, and Amo-Na, respectively, resulting from network analyzer measurements.
Here, Δf is the measured frequency change (Hz), f0 the fundamental frequency of QCM (10 × 106 Hz), Δm is the mass change (g), A is the electrode area (0.125 cm2), ρ is the density of quartz (2.643 g/cm3), and µ is the shear module of quartz (2.947 × 10¹¹ g cm−1 s−2). Inserting the respective values into Equation (1) and assuming a rigid polymer layer with density ρ = 1 g/cm3 leads to the conclusion that a frequency shift of Δf = −1 kHz corresponds to a 40-nm polymer layer height.
This aspect is important in so far as bulk-polymerized MIP thin films need to provide sufficient analyte diffusion into the “inner” parts of the polymer matrix [37]. Hence, increasing the layer height usually enhances the sensor response. Nevertheless, a thick polymer film will hinder access to the binding sites in the polymer bulk, leading to increasing damping of the electrodes and, thus, making them useless for sensor measurements. Here, for example, the MIP PenV-K film was approximately 285 nm thick. After rinsing and template removal, it reached 195 nm (which shows that washing also removed part of the matrix), while the NIP PenV-K film after polymer coating was about 230 nm, and, after washing, the polymer film revealed a thickness of 210 nm.
3.2. Polymer Surface Analysis
Figure 6 shows tapping mode AMF images of the surface topographies of washed PenV-K imprinted and non-imprinted coated thin films on QCM electrodes, respectively. It can be seen clearly that both polymers have homogenous surfaces, but with different textures. The NIP surface in Figure 6a is comparably smooth and flat. The z-axis, in this case, was 135 nm, which indicates that the wave-like structures are roughly ±65 nm high, but most probably are an artifact in the measurement. The immediate roughness of the polymer is much lower. In contrast, the morphology of PenV-K MIP after rinsing and template removal in Figure 6b shows similar structures with lateral dimensions in the micrometer range. However, the surface is evidently much rougher, than that of the NIP. Obviously, there are cavities on the MIP surface, which are not present in the NIP surface. Of course, these do not represent the imprints as such: This is impossible given the sizes of the template molecules, since the lateral resolution of AFM depends on tip aperture, which was around 5–10 nm for this setup. However, it still evidently demonstrates that PenV-K molecules strongly influence the morphology of the polymer. Removing them from the polymer matrix affects the overall topography of the corresponding polymer.
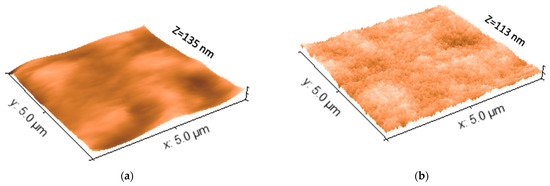
Figure 6.
The three-Dimensional AFM surface topography images of both PenV-K MIP and NIP (the x-axis and y-axis scales are at 5µm × 5µm for both). (a) AFM image of NIP surface after washing, (b) AFM image of PenV-K MIP surface after washing and template removal.
3.3. Sensor Characteristics
Figure 7 shows the QCM sensor characteristics of PenV-K MIP and NIP obtained from responses at six different PenV-K concentrations (c = 2.50 mM, 2.00 mM, 1.25 mM, 0.60 mM, 0.50 mM, and 0.30 mM; measured in 50 mM KCl background solution). Both layers consisted of polymer 4 in Table 1. First, the data reveals concentration-dependent sensor signals. Second, MIP yield substantially higher frequency shifts at all concentrations compared to the corresponding NIP: For instance, injection of PenV-K solution at c = 2.50 mM leads to frequency decreasing by −286 Hz on the MIP side and −132 Hz on the NIP side, respectively. This corresponds to a −154-Hz difference signal and, thus, an imprinting factor of 2.2 (the imprinting factor is calculated by dividing the sensor signal of the MIP through the one of the NIP). Additionally, the signal of NIP shows some inherent affinity of the polymer to PenV-K, which also can be desirable to achieve MIP with high affinity [38]. Furthermore, the PenV-K-MIP leads to linear sensor characteristic within the concentration range of 0.30–2.00 mM PenV-K with a correlation coefficient of R2 = 0.98. Furthermore, the limit of detection (LOD) is calculated based on (3 S/N) (with QCM baseline noise level standing at around −10 Hz). Based on this, the PenV-K MIP sensor offers LOD = 0.25 mM.
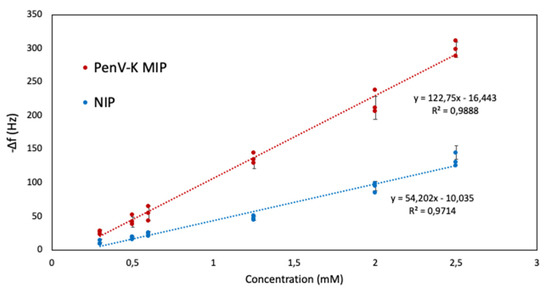
Figure 7.
QCM sensor characteristics of MIP and NIP sensors against PenV-K.
In addition, repeatability is an important parameter for any chemical sensor to ensure analytical quality. Figure 8 gives the QCM responses obtained for three consecutive exposures with the same sample and washing steps in between them. Here, in terms of quantitative detection, the results are promising: All frequency responses are fully reversible after washing the sensors with 50 mM KCl solution. Imprinting factors here are around 4.5. Besides, the coefficients of variation (CV) of the MIP channel are calculated based on Equation (2).
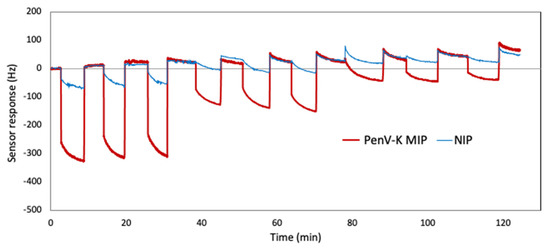
Figure 8.
Reproducibility of PenV-K QCM signals at concentrations of 2.5 mM, 1.25 mM, and 0.60 mM, respectively.
One can see that the sensing results are in a similar range, and CV values are 7%, 12%, and 9% against PenV-K solutions at c = 2.50 mM, 1.25 mM, and 0.60 mM, respectively.
Figure 9 exhibits sensor characteristics results of PenG-K sensor against five different concentrations (2.50 mM, 2.00 mM, 1.25 mM, 0.60 mM, and 0.50 mM). As previously mentioned, the PenG-K MIP composition slightly differs from that of PenV-K (see Table 1: PenV-K: polymer 4; PenG-K: polymer 5). Similar to PenV-K sensors, the frequency responses of the sensors decreases linearly as PenG-K concentration increases both on the MIP and NIP channels. One can expect such a decrease: The more concentrated the solution, the more molecules are available to bind to the imprinted cavities present at the polymer matrix. For instance, at 2.50 mM PenG-K, the MIP exhibits a frequency shift of −235 Hz while the NIP signal reaches only around −55 Hz. Thus, frequency shifts on MIP-coated electrodes against NIP-coated ones reveal more than four times higher sensitivity, strongly indicative of successful imprinting and, thus, the incorporation of PenG-K molecules into recognition sites. Additionally, the outcomes indicate that imprinting turned out to be successful with a linear correlation of sensor responses, with LOD = 0.30 mM based on the signal to the noise level of the system.
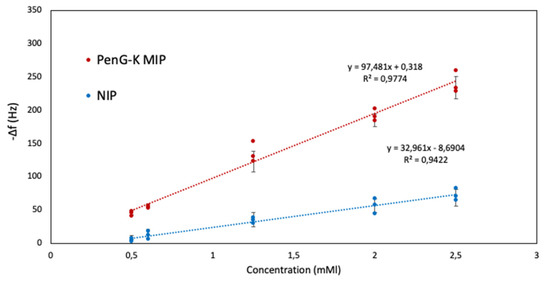
Figure 9.
Sensor characteristics of MIP and NIP sensors against PenG-K.
Figure 10 shows the repeatability evaluation of PenG-K sensor response at the concentrations of 2.50 mM, 2.00 mM, and 1.25 mM, respectively. For that purpose, we injected standards at the same concentration three times before shifting to the next concentration. The data revealed CV values of 9%, 15%, and 11%, respectively.
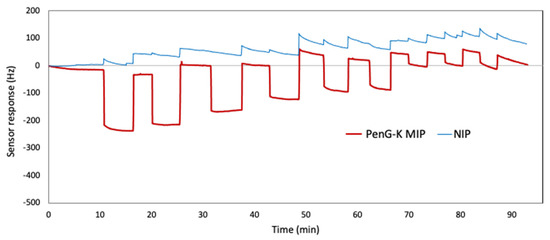
Figure 10.
Sensor responses of PenV-K QCM when exposed to three samples each at concentrations of 2.5 mM, 1.25 mM, and 0.60 mM, respectively.
Table 2 summarizes the average sensor responses on the MIP and NIP electrodes, respectively, of the Amo-Na sensor, derived from three QCM measurements in the concentration range of 0.30–2.50 mM each. Like the MIP sensors targeting the unmodified penicillins, also in this case, the MIP exhibit significant binding affinity against its target. Nonspecific interaction with the NIP layers is lower by a factor of three. For example, the average frequency shift on the MIP channel when exposing Amo-Na sensor to a solution at c = 2.00 mM analyte reaches −265 Hz, while the NIP channel shows a signal around −63 Hz, equal to around −200-Hz signal difference.

Table 2.
Sensor responses and CV values of the Amo-Na sensor on MIP and NIP sides, at listed concentrations.
Likewise, Figure 11 presents the Amo-Na MIP and NIP sensor characteristics for the concentration series of 0.30–2.50 mM. The correlation coefficients were calculated for MIP to R2 = 0.98 and R2 = 0.96 on the NIP side, which indicates the analytical feasibility of the sensor in the concentration range demonstrated. The resulting sensor characteristic shows LOD = 0.28 mM, which is very similar to MIP PenV-K senor. This is even more appreciable since both MIPs rely on the same polymer system, which is rather unusual: Switching between even closely related templates usually makes it necessary to re-optimize the polymer, even if this requires only minor amendments [39].
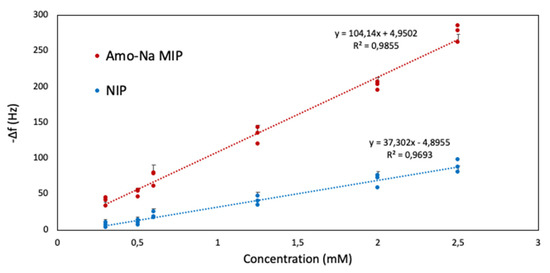
Figure 11.
Sensor characteristics were obtained for MIP and NIP sensors against Amo-Na.
3.4. Sensing Thermodynamics
Equation (3) shows the feasible recognition reaction of the target analyte (PenV-K, PenG-K, and Amo-Na) interaction within synthesized MIP binding sites.
Hence, in such a system at equilibrium, Equation (4) expresses the association constant (Ka).
here, CComplex is the concentration of occupied MIP binding sites within the film volume, CMIP is the concentration of unoccupied MIP binding sites after binding, and CAnalyte is the analyte concentration in solution.
By applying the equation for the Langmuir adsorption isotherm and setting the fractional occupancy (θ) as a function of frequency changes for such sensing approaches on QCM (based on the Sauerbrey equation), one obtains Equation (5) [40].
Equation (5) can be rearranged to Equation (6) [41]. Thus, plotting the frequency shifts obtained for the respective penicillin standards against ΔfAnalyte/CAnalyte revealed Ka and the frequency shift corresponding to the maximum number of binding sites in the MIP (): the slope of the curve corresponded to 1/Ka and the y-intercept to ΔfMIP (Max).
Table 3 summarizes the estimated Ka values and the corresponding Gibbs energies of binding for the three penicillin MIPs.

Table 3.
Estimated association constants (Ka) and Gibbs free energies (ΔGa) for each penicillin MIP sensor.
All three MIPs show negative Gibbs energies for binding that is in the same range, namely, around −13.5 kJ/mol. This is well within the range that is expected for reversible sensor signals. As a rule of thumb, ΔG ≥ −25 kJ/mol means reversible signals. The respective equilibrium constant is K = 104.
The values obtained, presented in Table 3, are in line with the literature: Previous research on acrylic-based MIPs binding molecules in roughly similar size range led to ΔG = −11.70 kJ/mol for carbofuran and ΔGa = −5.05 kJ/mol for profenofos, respectively [30]. In polypyrroles, caffeine and theophylline yielded Gibbs energies of ΔG = −10.81 kJ/mol and ΔG = −6.6 kJ/mol, respectively [42]. The energy values indicate that analyte binding resulted from hydrogen bonds or electrostatic interactions.
3.5. Selectivity
Of course, selectivity is a key issue for any sensor and preferably each MIP should specifically bind its own analyte. Figure 12 shows the QCM response curves of the selectivity test of Amo-Na sensor against PenG-K and PenV-K at c = 2.50 Mm (50 mM KCl used as background) for both MIP and NIP channels. Firstly, it reveals the higher binding affinity of the sensor to bind its templated analyte (Amo-Na) towards analogous penicillins. Next, the frequency signals on MIP channel decreased by −290 Hz, −175 Hz, and –160 Hz for Amo-Na, PenG-K, and PenV-K, respectively. In addition, the NIP channel showed the same sensor response of around −90 Hz for all injected penicillin (at c = 2.50 Mm). The latter demonstrates that the inherent affinity of the polymer is the same for all three penicillins. This is very noticeable also in terms of proving the imprinted approach: Templating the material indeed leads to substantially different signals for different target molecules.
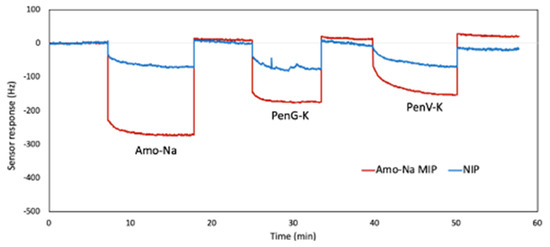
Figure 12.
Selectivity measurement of Amo-Na Sensor against PenG-K and PenV-K at c = 2.50 mM, respectively.
Furthermore, Figure 13 summarizes the selectivity pattern of PenV-K, PenG-K, and Amo-Na sensors as the relative sensor effect towards each other at c = 2.50 mM. To better interpret the selectivity results, Figure 13 uses the relative selectivity factor (%β) defined by Equation (7), which is the quotient of the net sensor responses (i.e., the differences in frequency shifts between MIP and NIP channels for the two competing species).
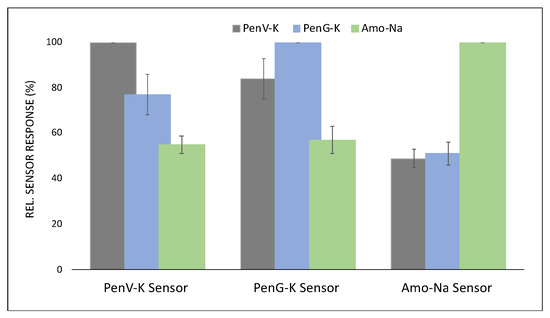
Figure 13.
Relative sensor responses for PenV-K, PenG-K, and Amo-Na sensors, respectively, toward the target penicillins at c = 2.50 mM.
Accordingly, the results reveal that MIPs for PenV-K and PenG-K are selective to their respective compounds, but not very strongly. Therefore, the relative selectivity factors were recorded at 77% and 83% for the two chemicals against each other. However, even these small selectivity numbers are remarkable, given how similar the molecular structures of these compounds are: The two natural penicillins differ by an oxygen atom, which only leads to a slight increase of the side chain length of PenV-K against PenG-K molecules while the core structure is identical, as shown in Figure 1.
In contrast, amoxicillin show higher selectivity, both as a template and as an analyte (see Figure 12). This amino-penicillin contains an additional amino group and an extra hydroxyl-group in its structure, which leads to substantial differences in selectivity factors versus PenV-K and PenG-K. Therefore, Amo-Na sensor demonstrate the highest selectivity factors in comparison with sensors targeting the natural penicillins by achieving β values of around 52% and 49% against PenV-K and PenG-K, respectively. Again, it is worth mentioning that the core of the respective structures remained constant.
3.6. Comparison of Data with Previous Studies
Though the analytical literature on detecting penicillins is, of course, extensive, only a limited number of papers has been published so far on designing chemical sensors for such compounds. Table 4 summarizes biomimetic/polymer-based approaches for this purpose, including three examples of non-penicillin antibiotics in the last three lines. To the best of our knowledge, there is no literature on Penicillin V yet.

Table 4.
Summary of published MIP sensors to detect antibiotics.
Obviously, the detection limits reported are both in the range of this work and also much below that. These, in part, originates from the transducer technology utilized: For instance, SPR reaches the ppb range by using gold nanoparticles that amplify the SPR signal. Similarly, it is known that electrochemical techniques achieve very good sensitivity at low concentrations. On the other hand, vancomycin and doxycycline are much larger molecules than the penicillins and, thus, lead to larger measuring effects per binding step. The main difference of this work to all of them is the fact that it offers a platform technology that is useful to not only detect PenV, PenG, and Amo salts, but also differentiate them among each other.
4. Conclusions
This work has demonstrated successful design of QCM sensors comprising MIP thin films’ sensor based on acrylates for the detection of PenV-K, PenG-K, and Amo- Na penicillins. AFM imaging of MIP and NIP surfaces clearly reveal observable differences in the textures and roughness of MIP surfaces compared to NIP surfaces, which clearly demonstrates the influence of penicillin on the polymer morphology after template removal, even though it does not show the imprinted cavities per se. Interestingly, the same polymer leads to optimal results for penicillin V and amoxicillin, whereas it turned out necessary to amend the recipe slightly for obtaining the highest possible sensor responses for penicillin G.
QCM results clearly demonstrate that sensors using these MIPs offer both appreciable sensitivity and selectivity. Especially the latter is worth mentioning given the rather minor differences in the respective molecular structures: The beta-lactam core is, of course, the same for all three molecules. However, PenV and PenG differ only by a single oxygen atom. Nonetheless, each MIP preferably incorporates its respective template. Amoxicillin shows lagers selectivity factors towards both other compounds, respectively. Overall, the synthesized sensor materials offer rapid response and concentration-dependent sensing. Together with the fact that the MIPs rely on very similar polymers, this opens up the way for low-cost sensing arrays to detect different components in mixtures.
Author Contributions
Conceptualization, L.S. and P.A.L.; writing—original draft, S.H.; methodology and investigation, S.H. and U.A.; validation and visualization, S.H.; supervision, A.M. and P.A.L.; project administration, P.A.L. and L.S. All authors have read and agreed to the published version of the manuscript.
Funding
The Austrian Research Promotion Agency (FFG) funded this research through grant agreement no. 864893 (AquaNOSE).
Institutional Review Board Statement
Not applicable.
Informed Consent Statement
Not applicable.
Data Availability Statement
Not applicable.
Acknowledgments
Open Access Funding by the University of Vienna.
Conflicts of Interest
The authors declare no conflict of interest.
References
- Gothwal, R.; Shashidhar, T. Antibiotic Pollution in the Environment: A Review; Antibiotic Pollution in the Environment: A Review. Clean–Soil Air Water 2015, 43, 479–489. [Google Scholar] [CrossRef]
- Yao, L.; Wang, Y.; Tong, L.; Li, Y.; Deng, Y.; Guo, W.; Gan, Y. Seasonal variation of antibiotics concentration in the aquatic environment: A case study at Jianghan Plain, central China. Sci. Total Environ. 2015, 527, 56–64. [Google Scholar] [CrossRef]
- Beta-lactam antibiotics. In Meyler’s Side Effects of Drugs, 6th ed.; Elsevier: Oxford, UK, 2016; pp. 928–956.
- Landers, T.F.; Cohen, B.; Wittum, T.E.; Larson, E.L. A review of antibiotic use in food animals: Perspective, policy, and potential. Public Health Rep. 2012, 127, 4–22. [Google Scholar] [CrossRef] [PubMed] [Green Version]
- Padmanabhan, S. (Ed.) Handbook of Pharmacogenomics and Stratified Medicine; Academic Press: San Diego, CA, USA, 2014; pp. 405–435. [Google Scholar]
- Finch, R.; Greenwood, D.; Norrby, R.; Whitley, R. Preface. In Antibiotic and Chemotherapy, 9th ed.; Finch, R.G., Greenwood, D., Norrby, S.R., Whitley, R.J., Eds.; W.B. Saunders: London, UK, 2010; pp. 200–226. [Google Scholar]
- Zhang, J.; Wang, H.; Liu, W.; Bai, L.; Ma, N.; Lu, J. Synthesis of Molecularly Imprinted Polymer for Sensitive Penicillin Determination in Milk. Anal. Lett. 2008, 41, 3411–3419. [Google Scholar] [CrossRef]
- Tian, Y.; Wang, Y.; Wu, S.; Sun, Z.; Gong, B. Preparation of Ampicillin Surface Molecularly Imprinted Polymers for Its Selective Recognition of Ampicillin in Eggs Samples. Int. J. Anal. Chem. 2018, 2018, 73–81. [Google Scholar] [CrossRef]
- Pottegård, A.; Broe, A.; Aabenhus, R.; Bjerrum, L.; Hallas, J.; Damkier, P. Use of antibiotics in children: A Danish nationwide drug utilization study. Pediatric Infect. Dis. J. 2015, 34, e16–e22. [Google Scholar] [CrossRef] [PubMed] [Green Version]
- Jackson, C.; Hsia, Y.; Bielicki, J.A.; Ellis, S.; Stephens, P.; Wong, I.C.K.; Sharland, M. Estimating global trends in total and childhood antibiotic consumption, 2011-2015. BMJ Glob. Health 2019, 4, e0012–e0041. [Google Scholar] [CrossRef] [Green Version]
- Mackuľak, T.; Cverenkárová, K.; Vojs Staňová, A.; Fehér, M.; Tamáš, M.; Škulcová, A.B.; Gál, M.; Naumowicz, M.; Špalková, V.; Bírošová, L. Hospital Wastewater—Source of Specific Micropollutants, Antibiotic-Resistant Microorganisms, Viruses, and Their Elimination. Antibiotics 2021, 10, 1017. [Google Scholar] [CrossRef]
- Tasho, R.P.; Cho, J.Y. Veterinary antibiotics in animal waste, its distribution in soil and uptake by plants: A review. Sci. Total Environ. 2016, 563, 366–376. [Google Scholar] [CrossRef]
- Fair, R.J.; Tor, Y. Antibiotics and bacterial resistance in the 21st century. Perspect. Med. Chem. 2014, 6, 25–64. [Google Scholar] [CrossRef] [PubMed] [Green Version]
- Dadgostar, P. Antimicrobial Resistance: Implications and Costs. Infect Drug Resist 2019, 12, 3903–3910. [Google Scholar] [CrossRef] [PubMed] [Green Version]
- Roberts, S.C.; Zembower, T.R. Global increases in antibiotic consumption: A concerning trend for WHO targets. Lancet Infect. Dis. 2021, 21, 10–11. [Google Scholar] [CrossRef]
- Klein, E.Y.; Milkowska-Shibata, M.; Tseng, K.K.; Sharland, M.; Gandra, S.; Pulcini, C.; Laxminarayan, R. Assessment of WHO antibiotic consumption and access targets in 76 countries, 2000–2015: An analysis of pharmaceutical sales data. Lancet Infect. Dis. 2021, 21, 107–115. [Google Scholar] [CrossRef]
- Tong, L.; Li, P.; Wang, Y.; Zhu, K. Analysis of veterinary antibiotic residues in swine wastewater and environmental water samples using optimized SPE-LC/MS/MS. Chemosphere 2009, 74, 1090–1097. [Google Scholar] [CrossRef]
- Mirzaei, R.; Yunesian, M.; Nasseri, S.; Gholami, M.; Jalilzadeh, E.; Shoeibi, S.; Bidshahi, H.S.; Mesdaghinia, A. An optimized SPE-LC-MS/MS method for antibiotics residue analysis in ground, surface and treated water samples by response surface methodology- central composite design. J. Environ. Health Sci. Eng. 2017, 15, 21. [Google Scholar] [CrossRef]
- Çe Unutkan, T.; Bakırdere, S.; Keyf, S. Development of an Analytical Method for the Determination of Amoxicillin in Commercial Drugs and Wastewater Samples, and Assessing its Stability in Simulated Gastric Digestion. J. Chromatogr. Sci. 2018, 56, 36–40. [Google Scholar] [CrossRef] [PubMed]
- Unger, C.; Lieberzeit, P.A. Molecularly imprinted thin film surfaces in sensing: Chances and challenges. React. Funct. Polym. 2021, 161, 104855. [Google Scholar] [CrossRef]
- Haupt, K.; Linares, A.V.; Bompart, M.; Bui, B.T. Molecularly imprinted polymers. Top Curr. Chem. 2012, 325, 1–28. [Google Scholar] [CrossRef] [PubMed]
- Kadhem, A.J.; Xiang, S.; Nagel, S.; Lin, C.-H.; Fidalgo de Cortalezzi, M. Photonic Molecularly Imprinted Polymer Film for the Detection of Testosterone in Aqueous Samples. Polymers 2018, 10, 349. [Google Scholar] [CrossRef] [PubMed] [Green Version]
- Hasanah, A.N.; Safitri, N.; Zulfa, A.; Neli, N.; Rahayu, D. Factors Affecting Preparation of Molecularly Imprinted Polymer and Methods on Finding Template-Monomer Interaction as the Key of Selective Properties of the Materials. Molecules 2021, 26, 5612. [Google Scholar] [CrossRef]
- Hussain, M.; Wackerlig, J.; Lieberzeit, P.A. Biomimetic strategies for sensing biological species. Biosensors 2013, 3, 89–107. [Google Scholar] [CrossRef] [PubMed]
- Buntkowsky, G.; Vogel, M. Small Molecules, Non-Covalent Interactions, and Confinement. Molecules 2020, 25, 3311. [Google Scholar] [CrossRef] [PubMed]
- Lieberzeit, P.A.; Jungmann, C.; Schranzhofer, L. Molecular Imprinting on the Nanoscale–Rapid Detection of Ag Nanoparticles by QCM Sensors. Procedia Eng. 2014, 87, 236–239. [Google Scholar] [CrossRef] [Green Version]
- Leibl, N.; Haupt, K.; Gonzato, C.; Duma, L. Molecularly Imprinted Polymers for Chemical Sensing: A Tutorial Review. Chemosensors 2021, 9, 123. [Google Scholar] [CrossRef]
- Afzal, A.; Mujahid, A.; Schirhagl, R.; Bajwa, S.Z.; Latif, U.; Feroz, S. Gravimetric Viral Diagnostics: QCM Based Biosensors for Early Detection of Viruses. Chemosensors 2017, 5, 7. [Google Scholar] [CrossRef]
- Alenus, J.; Ethirajan, A.; Horemans, F.; Weustenraed, A.; Csipai, P.; Gruber, J.; Peeters, M.; Cleij, T.J.; Wagner, P. Molecularly imprinted polymers as synthetic receptors for the QCM-D-based detection of L-nicotine in diluted saliva and urine samples. Anal. Bioanal. Chem. 2013, 405, 6479–6487. [Google Scholar] [CrossRef] [PubMed]
- Sroysee, W.; Chunta, S.; Amatatongchai, M.; Lieberzeit, P.A. Molecularly imprinted polymers to detect profenofos and carbofuran selectively with QCM sensors. Phys. Med. 2019, 7, 100016. [Google Scholar] [CrossRef]
- Arshad, U.; Mujahid, A.; Lieberzeit, P.; Afzal, A.; Bajwa, S.Z.; Iqbal, N.; Roshan, S. Molecularly imprinted polymeric coatings for sensitive and selective gravimetric detection of artemether. RSC Adv. 2020, 10, 34355–34363. [Google Scholar] [CrossRef]
- Subrahmanyam, S.; Guerreiro, A.; Poma, A.; Moczko, E.; Piletska, E.; Piletsky, S. Optimisation of experimental conditions for synthesis of high affinity MIP nanoparticles. Eur. Polym. J. 2013, 49, 100–105. [Google Scholar] [CrossRef]
- PubChem. Penicillin V Potassium. 2004. Available online: https://pubchem.ncbi.nlm.nih.gov/compound/Penicillin-V-potassium (accessed on 10 September 2021).
- PubChem. Penicillin G Potassium. 2004. Available online: https://pubchem.ncbi.nlm.nih.gov/compound/Penicillin-G-potassium (accessed on 10 September 2021).
- PubChem. Amoxicillin Sodium. 2004. Available online: https://pubchem.ncbi.nlm.nih.gov/compound/Amoxicillin-sodium (accessed on 10 September 2021).
- Cho, N.-J.; Kanazawa, K.K.; Glenn, J.S.; Frank, C.W. Employing Two Different Quartz Crystal Microbalance Models To Study Changes in Viscoelastic Behavior upon Transformation of Lipid Vesicles to a Bilayer on a Gold Surface. Anal. Chem. 2007, 79, 7027–7035. [Google Scholar] [CrossRef] [PubMed]
- Gao, N.; Dong, J.; Liu, M.; Ning, B.; Cheng, C.; Guo, C.; Zhou, C.; Peng, Y.; Bai, J.; Gao, Z. Development of molecularly imprinted polymer films used for detection of profenofos based on a quartz crystal microbalance sensor. Analyst 2012, 137, 1252–1258. [Google Scholar] [CrossRef]
- Tanese, M.C.; Farinola, G.M.; Pignataro, B.; Valli, L.; Giotta, L.; Conoci, S.; Lang, P.; Colangiuli, D.; Babudri, F.; Naso, F.; et al. Poly(alkoxyphenylene−thienylene) Langmuir−Schäfer Thin Films for Advanced Performance Transistors. Chem. Mater. 2006, 18, 778–784. [Google Scholar] [CrossRef]
- Chunta, S.; Suedee, R.; Lieberzeit, P.A. High-density lipoprotein sensor based on molecularly imprinted polymer. Anal. Bioanal. Chem. 2018, 410, 875–883. [Google Scholar] [CrossRef] [PubMed]
- Plausinaitis, D.; Sinkevicius, L.; Samukaite-Bubniene, U.; Ratautaite, V.; Ramanavicius, A. Evaluation of electrochemical quartz crystal microbalance based sensor modified by uric acid-imprinted polypyrrole. Talanta 2020, 220, 121414. [Google Scholar] [CrossRef]
- Pan, M.; Gu, Y.; Zhang, M.; Wang, J.; Yun, Y.; Wang, S. Reproducible Molecularly Imprinted QCM Sensor for Accurate, Stable, and Sensitive Detection of Enrofloxacin Residue in Animal-Derived Foods. Food Anal. Methods 2018, 11, 495–503. [Google Scholar] [CrossRef]
- Ratautaite, V.; Plausinaitis, D.; Baleviciute, I.; Mikoliunaite, L.; Ramanaviciene, A.; Ramanavicius, A. Characterization of caffeine-imprinted polypyrrole by a quartz crystal microbalance and electrochemical impedance spectroscopy. Sens. Actuators B Chem. 2015, 212, 63–71. [Google Scholar] [CrossRef]
- Weber, P.; Riegger, B.R.; Niedergall, K.; Tovar, G.E.M.; Bach, M.; Gauglitz, G. Nano-MIP based sensor for penicillin G: Sensitive layer and analytical validation. Sens. Actuators B Chem. 2018, 267, 26–33. [Google Scholar] [CrossRef]
- Safran, V.; Göktürk, I.; Bakhshpour, M.; Yılmaz, F.; Denizli, A. Development of Molecularly Imprinted Polymer-Based Optical Sensor for the Sensitive Penicillin G Detection in Milk. ChemistrySelect 2021, 6, 11865–11875. [Google Scholar] [CrossRef]
- Ayankojo, A.G.; Reut, J.; Boroznjak, R.; Öpik, A.; Syritski, V. Molecularly imprinted poly(meta-phenylenediamine) based QCM sensor for detecting Amoxicillin. Sens. Actuators B Chem. 2018, 258, 766–774. [Google Scholar] [CrossRef]
- Jamieson, O.; Soares, T.C.C.; de Faria, B.A.; Hudson, A.; Mecozzi, F.; Rowley-Neale, S.J.; Banks, C.E.; Gruber, J.; Novakovic, K.; Peeters, M.; et al. Screen Printed Electrode Based Detection Systems for the Antibiotic Amoxicillin in Aqueous Samples Utilising Molecularly Imprinted Polymers as Synthetic Receptors. Chemosensors 2020, 8, 5. [Google Scholar] [CrossRef] [Green Version]
- Lowdon, J.W.; Diliën, H.; van Grinsven, B.; Eersels, K.; Cleij, T.J. Colorimetric Sensing of Amoxicillin Facilitated by Molecularly Imprinted Polymers. Polymers 2021, 13, 2221. [Google Scholar] [CrossRef] [PubMed]
- López, R.; Khan, S.; Wong, A.; Sotomayor, M.d.P.T.; Picasso, G. Development of a New Electrochemical Sensor Based on Mag-MIP Selective Toward Amoxicillin in Different Samples. Front. Chem. 2021, 9, 146. [Google Scholar] [CrossRef] [PubMed]
- Mazzotta, E.; Turco, A.; Chianella, I.; Guerreiro, A.; Piletsky, S.A.; Malitesta, C. Solid-phase synthesis of electroactive nanoparticles of molecularly imprinted polymers. A novel platform for indirect electrochemical sensing applications. Sens. Actuators B Chem. 2016, 229, 174–180. [Google Scholar] [CrossRef] [Green Version]
- Munawar, A.; Tahir, M.A.; Shaheen, A.; Lieberzeit, P.A.; Khan, W.S.; Bajwa, S.Z. Investigating nanohybrid material based on 3D CNTs@Cu nanoparticle composite and imprinted polymer for highly selective detection of chloramphenicol. J. Hazard. Mater. 2018, 342, 96–106. [Google Scholar] [CrossRef] [PubMed]
- Gürler, B.; Özkorucuklu, S.P.; Kır, E. Voltammetric behavior and determination of doxycycline in pharmaceuticals at molecularly imprinted and non-imprinted overoxidized polypyrrole electrodes. J. Pharm. Biomed. Anal. 2013, 84, 263–268. [Google Scholar] [CrossRef] [PubMed]
Publisher’s Note: MDPI stays neutral with regard to jurisdictional claims in published maps and institutional affiliations. |
© 2021 by the authors. Licensee MDPI, Basel, Switzerland. This article is an open access article distributed under the terms and conditions of the Creative Commons Attribution (CC BY) license (https://creativecommons.org/licenses/by/4.0/).