Abstract
In this paper, an algal identification and concentration determination method based on discrete excitation fluorescence spectra is proposed for online algae identification and concentration prediction. The discrete excitation fluorescence spectra of eight species of harmful algae from four algal categories were assessed. After determining typical excitation wavelengths according to the distribution of photosynthetic pigments and eliminating strongly correlated wavelengths by applying the hierarchical clustering, seven characteristic excitation wavelengths (405, 435, 470, 490, 535, 555, and 590 nm) were selected. By adding the ratios between feature points (435 and 470 nm, 470 and 490 nm, as well as 535 and 555 nm), standard feature spectra were established for classification. The classification accuracy in pure samples exceeded 95%, and that of dominant algae species in a mixed sample was 77.4%. Prediction of algae concentration was achieved by establishing linear regression models between fluorescence intensity at seven characteristic excitation wavelengths and concentrations. All models performed better at low concentrations, not exceeding the threshold concentration of red tide algae outbreak, which provides a proximate cell density of dominant algal species.
1. Introduction
In recent decades, occurrences of harmful algae blooms (HABs) have increased dramatically, causing serious ecological damage and economic loss. The monitoring of HABs has become an environmental concern worldwide []. More than 300 species have been reported to cause HABs, approximately 80 of which are toxic []. Certain blooms, i.e., Phaeocystis sp. in China [] and Chattonella sp. in Japan [], have caused massive fish mortality within a few hours. Therefore, the rapid and accurate identification of causative species, particularly toxic species, is of great importance for better management and controlling HABs.
Today, many techniques are in use for monitoring HABs, simply classified as image-based [], fluorescence-based [,,] and molecular-based technologies []. Image recognition technology is the most commonly used technology since the invention of the first microscope. Combined with flow cytometry, microalgae could be clearly imaged since 2006 []. However, it remains difficult to identify algae smaller than 10 μm []. Molecular methods, i.e., DNA barcoding and real time polymerase chain reaction (PCR), have become well developed recent years [], enabling a new prospective view on HABs. In situ molecular tools have been very limited and expensive [] and require an environmental sampler processor []. Chlorophyll was first used as an indicator of production of phytoplankton production [] and a fluorometer is one of the most popular tools for monitoring HABs. Then, in situ fluorometers with multiple excitation wavelengths were used to not only identify the content of Chl a, but also the content of other photosynthetic pigments, resulting in further characterization of HAB species. Pigment-based approaches using fluorometric measurements have proven to be a promising tool for in situ explorations of bloom compositions [,]. Three-dimensional (3D) fluorescence spectra are often referred to as the fingerprint of target species because of their unique excitation and emission wavelengths. Three dimensional fluorescence was successfully utilized for identifying microalgae at the phyla level under variable circumstances []. Chlorophyta, Cyanobacteria, Heterokontophyta, Haptophyta, Dinophyta, and Cryptophyta were identified by the first submersible fluorometer, using multiple linear regression as calculation and calibration method []. Later, the genera Alexandriu, Catenatum, and Chlorella could be recognized via 3D fluorimeter [,]. Data processing for the identification of phytoplankton pigmentation was also improved. Principal component analysis (PCA) [] and Fisher’s linear discriminant analysis (LDA) [] are typically used to reduce the dimensionality, and are commonly applied for analyzing data of 3D fluorescence spectra. Further processes were developed to improve accuracy, i.e., Support vector machines (SVM) [] and artificial neural networks []. However, the achieved level of accuracy is still far from that required to identify the HABs at the species level.
Therefore, considering the currently available techniques and statistical methods, to better identify toxic HAB species (e.g., Alexandrium tamarense, Amphidinium carterae, Phaeocystis globosa, Prymnesium parvum, Chattonella marina, and Heterosigma akashiwo) among the non-toxic and common species Prorocentrum donghaiense and Skeletonema costatum, the present study developed a new identification model based on excitation fluorescence spectra measured in the laboratory. The proposed method not only achieves the rapid identification of dominant HAB species, but also predicts their concentration in mono- and mixed-culture.
2. Materials and Methods
2.1. Phytoplankton Cultivation and Spectral Data Measurement
Eight marine HAB species, Alexandrium tamarense (AT), Amphidinium carterae (AC), Phaeocystis globosa (PG), Prymnesium parvum (PP), Chattonella marina (CM), Heterosigma akashiwo (HA), Prorocentrum donghaiense (PD), and Skeletonema costatum (SC), were selected as target species. Algae were monoculture, single cell isolated from the East China Coast and maintained in f/2 medium at 20 °C, 30‰ and 100 µmol m−2 s−1 of light intensity, with a 12:12 light: dark cycle. All species were identified morphologically and AT, AC, PG, CM, HA, and PP were identified with molecular methods. Subsamples for fluorescence detection and enumeration were collected at the exponential growth stage under the above- mentioned experimental conditions. Monoculture of each species was used first to establish feature spectra, then, every two species of all eight algae were mixed according to concentration ratios of 1:1, 1:3, 1:6, 3:1 and 6:1 (10,000 cells/mL represent a proportion of 1). Cell concentrations were determined in a Sedgewick–Rafter chamber using a microscope at 100X.
Initial fluorescence excitation spectra were determined under an F-4600 fluorescence spectrophotometer (Hitachi, Naka, Japan). The composition of photosynthetic pigments was typical for each family or genus of phytoplankton (Table 1). Excitation wavelengths were selected based on the absorption peak of those pigments, ranging from 40–600 nm at interval of 1 nm (slit width 10 nm and photomultiplier tube voltage 400 V). The emission wavelength was fixed at 680 nm because of the maximum absorption peaks and excitation/emission matrix of those algal species (Figure 1). To suppress noise interference, each sample was measured five times in parallel and the average was used as the final excitation fluorescence spectral data.

Table 1.
Composition of pigments in different species of algae.
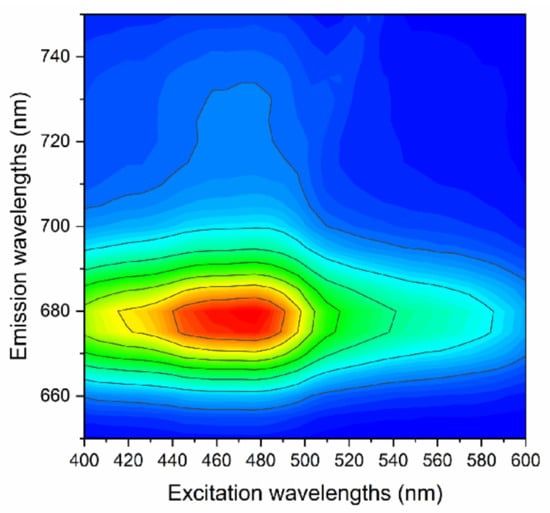
Figure 1.
Demonstration of excitation/emission matrix of Amphidinium carterae.
2.2. Data Preprocessing
Spectral data were first analyzed through noise removal and standardization. Discrete wavelet transformation (DWT) analysis was used to remove spectral noise, mainly based on the time-frequency localization characteristics of the wavelet. This method decomposes the signal into high- and low-frequency components and then removes part of the high-frequency information.
The key step for DWT is to select the threshold for quantization []. There are two types of thresholds: hard and soft thresholds. A signal processed by a hard threshold can be rougher than that processed by a soft threshold but may lose important information. Hence, soft threshold processing is used more often for denoising.
In DWT analysis, the suitable wavelet also plays a key role. The energy-to-Shannon entropy ratio [] was used to select the most suitable wavelet function and level of decomposition. A wavelet function with an appropriate level of decomposition maximizes the value of energy-to-Shannon entropy ratio.
The energy-to-Shannon entropy was calculated for each sample using 22 wavelets, i.e., haar, db2–db10, sym2–sym8, and coif1–coif5 at the third to fifth levels. For most samples, the db10 wavelet at the third level of decomposition maximizes the values of energy-to-Shannon entropy. Therefore, db10 with a third decomposition level was chosen as the mother wavelet. In the first step, the db10 wavelet decomposes the spectrum into A1 (approximation) and D1 (detail) coefficients. In the second step, db10 decomposes A1 into A2 and D2 coefficients. In the final step, A2 is decomposed into A3 and D3. For high-frequency coefficients at each decomposition scale, an appropriate threshold T is selected for soft threshold quantization, for which the following formula is used:
where is the standard deviation of noise, estimated according to the decomposed detail D1 and is the length of the spectrum. For each sample, D1 was obtained first by decomposing the original spectrum to estimate ; then, the threshold T could be determined according to Formula (1). Two common noise-removal methods were compared here, i.e., Savitzky–Golay and empirical mode decomposition (EMD).
Finally, standardization was performed to eliminate the difference in spectral intensity caused by different concentrations when identifying algal species. The mean variance method was adopted, and the relative mean value of the normalized fluorescence intensity ranged between 0 and 1. The shape of spectra remained unchanged.
2.3. Data Processing for Algal Identification
Feature extraction followed these three steps: First, the excitation fluorescence spectra were recorded to acquire an idea of spectral similarities and differences among the assessed eight species of algae. Second, typical excitation wavelengths of marker pigments were selected based on the photosynthesis principle of algae and the characteristic peaks of absorption spectra of each pigment []. Third, the positions of peaks and troughs of excitation spectra were determined in different algae. After combining all selected wavelength positions, a new discrete excitation fluorescence spectrum with less typical excitation wavelengths was established for each algal sample to further identification and quantification.
Softmax classifier [] was used for statistical analysis of data. For a training set , the hypothesis function was applied to estimate the probability value for each label y. The probability was judged for each label y. If there is a total of k labels, the hypothesis function would output a k-dimensional vector representing estimated probability values. The hypothesis function is expressed in the following:
where is the unknown parameter of this model. Based on the hypothesis function, the following cost function is established:
To minimize the cost function and calculate the parameter , a gradient descent algorithm was used. The gradient of the cost function to the parameter weight was optimized by calculating the partial derivative of the cost function. Finally, according to the final probability value of k labels, the highest probability value was selected as the result of discrimination.
2.4. Data Processing of Concentration Measurement
Because of the detection limit of the utilized fluorometer and the cell size of HAB species assessed in this study, the concentrations of algae were specifically designed, with small cells (smaller than 20 µm) at 10,000 cells/mL, middle cells (20–100 µm) at 1000 cells/mL, and large cells (larger than 100 µm) at 100 cells/mL.
To evaluate cell concentration, mono or mixed cultures were prepared at specific concentrations and scanned by fluorometer at corresponding excitation wavelengths. The relationship between fluorescence intensity and cell density at different excitation wavelengths was also studied. Excitation wavelengths with good linear fit to cell density were preserved. Based on the selected excitation wavelengths, norm spectra with fluorescence intensity information for each species at certain concentration were established. The concentration was calculated according to the established linear model as follows:
where is the random error and c represents the cell density. The measured spectra and the norm spectra are presented in their vector forms in the following:
where is the excitation fluorescence spectrum measured at wavelength i and is the kth norm spectrum measured at wavelength i. c is calculated using the non-negative least squares method, which minimizes the norm of the residual between measured spectra and reconstructed spectra. The formula is presented in the following:
The restraint set is based on the fact that the concentration is non-negative.
3. Results
3.1. Denoising Results
Taking AC as example, the denoised spectra based on three different methods are shown in Figure 2. The estimated signal-to-noise ratio (SNR) and root mean square error (RMSE) were used for comprehensively evaluating the denoising effect. The SNR and RMSE, calculated based on these three methods, are shown in Table 2. Although EMD presents a smoother result in Figure 2c than the other two methods, SNR is the lowest and RMSE is the largest, which means that useful information may be lost after denoising. The denoising effect of wavelet analysis and the Savitzky–Golay method seem to be similar, but wavelet analysis method performs better considering SNR and RMSE. Therefore, DWT was used in the following.
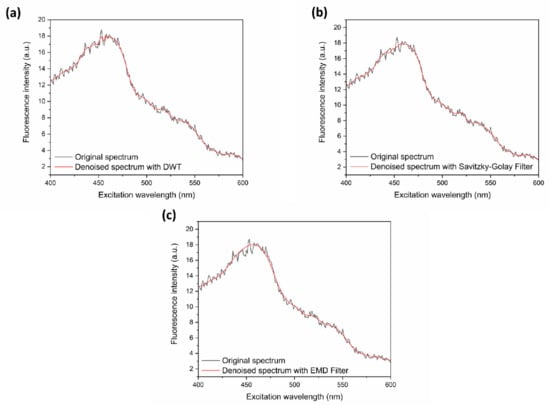
Figure 2.
Excitation fluorescence spectra before and after noise removal based on three different denoising methods: (a) with soft threshold quantization under db10 wavelet at the third level (discrete wavelet transformation (DWT)), (b) with the Savitzky–Golay Filter, and (c) with the empirical mode decomposition (EMD) filter.

Table 2.
Comparison of denoising effects based on three different methods.
For all eight species of algae, the RMSE and SNR values are shown in Table 3, indicating a relatively low RMSE and high SNR, which indicates a good denoising effect.

Table 3.
Denoising effect of selected algae based on a discrete wavelet transformation (DWT) filter.
3.2. Algal Identidication
Of all eight target HAB species, four of each phyla, CM (from Raphidophyta), PG (from Haptophyta), AC (from Dinophyta), and SC (from Bacillariophyta) were first selected and their initial spectra are shown in Figure 3 with unique pigmentation composition (Table 1). In these spectra, excitation wavelengths of 435 nm (Chl a), 460 nm (Chl c1-c3), 470 nm (Peridinin), 490 nm (Fucoxanthin), 495 nm (Diadinoxanthin, Zeaxanthin and β,β-carotene) and 520 nm (19′Butanoyloxyfucoxanthin and 19′ Hexanoyloxyfucoxanthin) are included. Moreover, a range of ±5 nm was considered for each wavelength (Figure 3a–d).
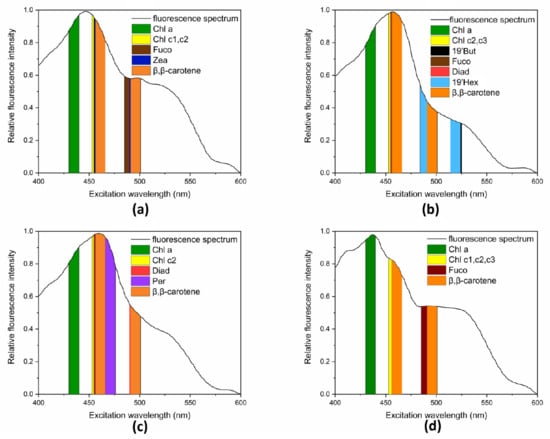
Figure 3.
Excitation fluorescence spectra measured at the exponential growth phase under the condition at 20 °C, 30‰ and 100 µmol m−2 s−1 of light intensity with a 12:12 light:dark cycle, and the location of peaks of pigments of algae: (a) CM (from Raphidophyta), (b) PG (from Haptophyta), (c) AC (from Dinophyta), and (d) SC (from Bacillariophyta).
Chl a plays a fundamental role in peripheral antennas of PS II [], which exists in all these algae. In prior research, the level of Chl a was widely used to measure the degree of eutrophication [,]. Additionally, its position is distinguishable in the spectra. Therefore, 435 nm, corresponding with Chl a, was chosen first.
Peridinin (470nm) is the marker pigment of Dinophyta and its position is separate from other phyla; therefore, 470 nm was selected. Zeaxanthin (460 nm and 495 nm) was used as marker pigment for Raphidophyta, and 19’ Hex and 19′ But. However, (490 nm and 520 nm) were used as marker pigments of Haptophyta. The positions of characteristic peaks of multiple pigments were very close and even overlapped, e.g., in Diadinoxanthin (460 nm and 495 nm) and Zeaxanthin (460 nm and 495 nm), Fucoxanthin (490 nm), and 19’ Hex (490 nm). Therefore, it was difficult to match all positions of marker pigments with the excitation wavelengths one-to-one, making it difficult to select typical wavelengths merely based on the position of marker pigments.
Fortunately, the proportions of these pigments are different, which is reflected in the changing trend of the excitation fluorescence spectra, e.g., the position shifts of peaks and troughs of excitation fluorescence spectra. These features can also be utilized to determine typical excitation wavelengths. Here, a peak-finding algorithm based on the difference function was used to search and determine peaks and troughs of the excitation fluorescence spectra of these eight species. The two toxic algae, AC and AT, from the same phylum are compared, and the peaks and troughs are marked with a positive triangle and inverted triangle, respectively, in Figure 4a,b. Although these two species of algae share a similar composition, the fluctuating trends of the curves, as well as the position of peaks and troughs, may differ.
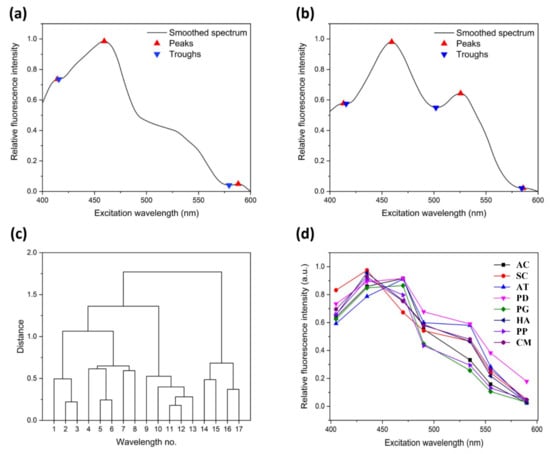
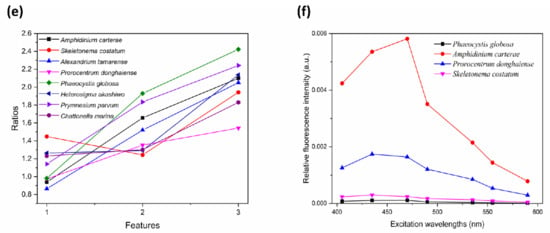
Figure 4.
Process of feature extraction. (a,b) Peaks and troughs of smoothed excitation fluorescence spectra of AC and AT; (c) Hierarchical clustering graph of 17 wavelengths; (d) Feature spectra of eight species of algae at seven wavelengths; (e) Three ratios of relative fluorescence intensity between 435 and 470 nm, 470 and 490 nm, as well as 535 and 555 nm; (f) Norm spectra of AC, PG, SC, and PD.
After combining all peak and trough positions with the wavelengths of Chl a and Peridinin (435 nm and 470 nm), the following 17 different excitation wavelengths were initially selected: 405, 415, 420, 435, 445, 450, 465, 470, 490, 505, 525, 530, 535, 555, 560, 570, and 590 nm. To further reduce the number of excitation wavelengths, the shortest distance hierarchical clustering method [] was used to reflect the correlation of these 17 different wavelengths. Wavelengths with strong correlation with others were removed. As shown in the hierarchical clustering graph (Figure 4c), the 11th and 12th wavelengths (525 nm and 530 nm, respectively) were categorized into one category first, which means that they had the strongest correlation. Furthermore, the 12th wavelength also had a strong correlation with the 13th wavelength (535 nm). Therefore, 530 nm was deleted first. At each step, one wavelength was deleted, and new discrete characteristic excitation spectra were established with the remaining excitation wavelengths only.
The new discrete characteristic excitation spectra were set as feature spectra for training the Softmax Classifier model. To train and test the model, 80 monocultures of each species were cultured in the same environmental conditions and were randomly classified into training sets and validation sets according to a ratio of 7:1. Another eight pure samples of each were used as testing sets. In total, there were 560 training samples, 80 validation samples and 64 testing samples. The number of excitation wavelengths was reduced each time. When the number of wavelengths had been reduced to seven, the identification accuracy of the validation sets of monocultures exceeded 90%, and the accuracy of the test sets of monocultures reached 88.2%. This represents a comparatively improved recognition result. Therefore, discrete excitation wavelengths of 405, 435, 470, 490, 535, 555, and 590 nm were selected for establishing feature spectra (Figure 4d).
The overall accuracy of identifying dominant HAB species from the mixed culture was 67.7%. To increase the accuracy of dominant algae identification in mixtures, further features were obtained based on other methods. The ratios of the relative fluorescence intensity between 435 and 470 nm, 470 and 490 nm, as well as 535 and 555 nm in discrete excitation fluorescence spectra were selected (Figure 4e). To evaluate the quality of the added features, the discriminative probability values were compared. These were the output of the Softmax classifier and could reflect the probability that test samples would be discriminated as each species of algae. In this study, each test sample was assigned eight discriminative probabilities corresponding to eight species of algae. The largest probability would be accepted as the corresponding label. With the seven-wavelength discrete excitation fluorescence spectra as standard spectra for training, the average discriminative probabilities were 54.3–88.9%. After adding new features, the average probability increased to 75.8–98.1% (Table 4).

Table 4.
Comparison of discriminant probabilities of different algae by adding features.
For all eight species of algae, the probability increased by different degrees, except for PP. Therefore, by adding new features, 10 new features of eight species of algae were set as standard feature spectra for the training and testing of the classification model. The identification accuracy for the pure test set exceeded 95%. The identification accuracy indicates the proportion of the number of predicted samples in the total number of testing samples. Moreover, for each species of pure testing algae, the precision, recall, and f1−score were calculated to evaluate the model. The details of these evaluation indexes are expressed in the following:
where TP is the number of positive samples that were correctly predicted, FP is the number of samples belonging to negative samples that were predicted to be positive, and FN is the number of samples belonging to positive samples that were predicted to be negative. In general, precision represents how exactly the respective species are predicted and recall implies whether all species have been identified. For example, there is a total of eight samples of AC among the testing samples, seven samples are accurately predicted as AC, but one sample is misidentified as a different species; then, the precision would be “7/(7 + 0)” and the recall would be “7/(7 + 1)”. A higher precision is always accompanied by a lower recall. Sometimes the f1−score that combines precision and recall with the harmonic mean can produce a balanced result to better evaluate the classifier.
In Table 5, the precision and recalls of SC, PD, PG, and PP reached 1.00, indicating that their features could be easily distinguished from others. Regarding the other four species of algae, the precision of AC was 1.00, but the recall was 0.88, and recall of AT was 1.00, but the precision was 0.89. This implies that wrong classification existed between AC and AT.

Table 5.
Precision, recall, and f1−score of test samples of eight species of algae.
Specifically, the confusion matrix was used to compare classification results with actual values (Figure 5). One sample of AC was erroneously classified as AT, leading to a decrease in the precision of AT and the recall of AC. Although Figure 4a,b show that their feature points are different, sometimes, because of changes in the cell densities, there may be a shift in position of feature areas, especially in the range of 470–535nm. Moreover, AT and AC belong to the same phylum and share a similar pigment composition. Because of these factors, their feature spectra are quite similar, and can thus be easily confused. Similarly, one sample of CM was erroneously identified as Ha for similar reason. Generally, 100% accuracy was achieved among different phyla.
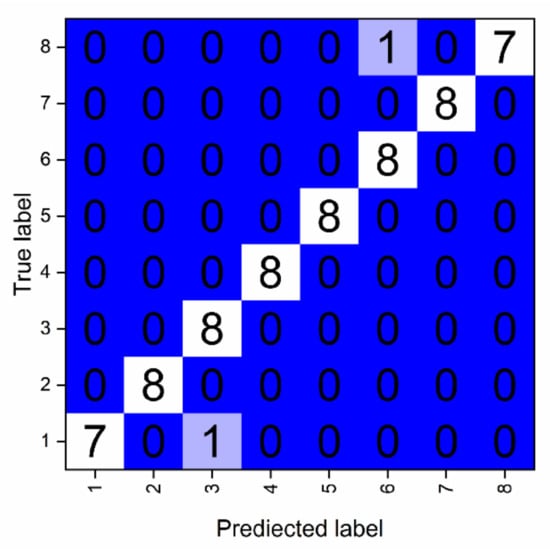
Figure 5.
Confusion matrix of eight species of tested algal samples.
After adding features, the overall identification accuracy rate of the dominant species in mixed test samples increased from 67.7–77.4%. The specific identifying results of each species of algae are shown in Table 6. The identification accuracy rates vary in different species of algae, and the results were greatly affected by the size of algae. For example, Chattonella is the largest among all the algae, and even if its ratio only accounts for 1/3, a good identification can still be obtained. However, smaller algae, such as PG, PP, and SC, can only be identified when the ratio well exceeds 50%. This can be explained because in a mixture, smaller algae are easily obstructed by the larger algae. Furthermore, the disparity of pigment content inside each cell also plays a key role. In summary, this model performed well for all these eight species of algae if the relative content of the dominant algal species exceeded 50%.

Table 6.
Results of identification in mixed samples according to new features.
Generally, identification based on pigment contents enables relatively high accuracy. However, this method may be limited to changes of external factors. Sometimes, because of changes in the environment (e.g., temperature and salinity), the content of certain pigments may also change, which may make discrimination more difficult. Fortunately, such variety in environmental factors is limited. Especially for AC and PD, the total pigment ratio remains almost unchanged [,].
3.3. Concentration Prediction
The concentration model based on non-negative least squares was used to calculate the corresponding cell density. Two toxic algae and two non-toxic algae were used for the experiment: Amphidinium carterae and Phaeocystis globose, and VS Skeletonema costatum and Prorocentrum donghaiensis. Their outbreaks are frequent and their biomass is difficult to calculate. Different concentrations of algae were prepared by diluting the pure culture with artificial sea water. Because this research focuses on the period before algal bloom, the species involved were only collected at the exponential growth phase.
The linear relationship between fluorescence intensity and cell density at each excitation wavelength (405, 435, 470, 490, 535, 555, and 590 nm) was assessed first (Figure 6). The result shows that the R2 value in all linear models for these four species of algae exceeded 0.99 (p < 0.05), indicating good linearity at all seven wavelengths. Therefore, norm spectra were constructed based on the seven-wavelength discrete excitation fluorescence spectra for four species of algae (Figure 4f).
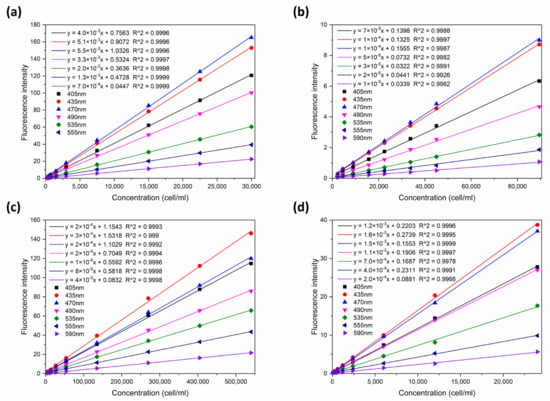
Figure 6.
Linear function between fluorescence intensity and concentration at seven characteristic excitation wavelengths for four species of algae: (a) Amphidinium carterae (toxic algae); (b) Phaeocystis globose (toxic algae); (c) Skeletonema costatum (non-toxic algae); and (d) Prorocentrum donghaiensis (non-toxic algae).
After confirming species, the norm spectrum was used to calculate the cell density by the model. With all designed concentration ratios, only the dominant species were targeted (Figure 7). The black line was fitted by standard concentration and the red circles indicate measured concentrations. In general, the red circles are quite close to the standard, especially at the initial part of the axis where the cell densities are below 5.35 × 10⁴ cells/mL. More details of the results are shown in Table 7.
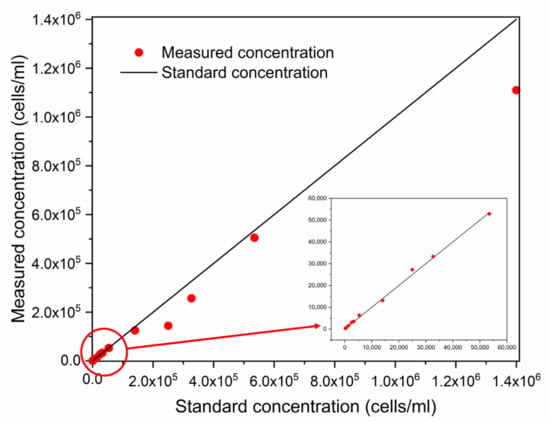
Figure 7.
Concentration test results for monocultures of four species of algae.

Table 7.
Comparison of results for pure samples and mixed samples.
Relative error (RE) and average and absolute relative error (ARE) were used to evaluate the accuracy of the concentration predictions. The ARE of the monocultures of AC, PG, PD, and SC was 22.4%, 13.3%, 10.3% and 11.0%, respectively. Large errors were found when cell concentrations were high, except for Sc. Moreover, the recovery rates of most samples were around 100%, especially at low concentrations. In mixed samples, the measured cell density tended to be larger than the standard cell density. This can be explained because all fluorescence received was considered to be emitted by the dominant algae when using the corresponding model to calculate the cell density. Because the entered fluorescence intensity value was larger than the real value, the calculated density was also higher than the standard value.
4. Discussion
Fluorometers are commonly used in many fields of detection, and photosynthetic pigments are one of the major molecules that can be found in the ocean. Because of the advantage of higher sensitivity, better selectivity, and wider linear analysis range, photosynthetic pigments were selected as the tool for the rapid identification and evaluation of the HAB species. Marine phytoplankton have a unique composition of photosynthetic pigments, consisting of chlorophyll-a, chlorophyll-b, chlorophyll-c, phycocyanin, phycoerythrin, and carotenoids. Peridinin is the featured pigment of dinoflagellates, and zeaxanthin is that of flagellates. These pigments have different fluorescence efficiencies when excited by light of different wavelengths, which is indirectly reflected in the fluctuations in excitation fluorescence spectra. Regarding the emission fluorescence spectrum, the excited light is always fixed at a certain wavelength, and emitted fluorescence signals are received at various wavelengths. It is difficult to distinguish algae merely based on emission fluorescence spectra, as all spectra show a similar peak at 680nm. Therefore, excitation fluorescence spectra are more frequently applied in identification compared with emission fluorescence spectra.
Here, an approach for identifying HAB species is proposed by characterizing the feature excitation spectra by pigment composition and statistical methodology. Excitation wavelengths are selected through the pigment characteristics of each phylum of phytoplankton. Then, the original spectrum is simplified into a discrete excitation fluorescence spectrum composed of seven excitation wavelengths (405, 435, 470, 490, 535, 555, and 590 nm). Bidigare et al. [] showed that algal pigments have maximum absorption wavelengths. Poryvkina et al. [] found that these absorption wavelengths are close to their excitation wavelengths and the feature spectra can be determined by the excitation spectra and maximum absorption wavelengths. Beutler et al. [] used five excitation wavelengths (450, 525, 570, 590, and 610 nm) to differentiate Chlorophyta, Cyanophyta, Cryptophyta and Dinophyta/Bacillariophyta. Yoshida et al. [] proposed a study based on nine excitation wavelengths (375, 400, 420, 435, 470, 505, 525, 570, and 590 nm) to distinguish between Dinophyta and Bacillariophyta. Zieger et al. [] selected eight wavelengths (375, 405, 430, 450, 475, 525, 590, and 640 nm). A discrimination of Cyanobacteria and Dinophytes as well-known toxin-producing phyla was realized. In most work, high accuracy of identification among different phyla can be obtained, but a lack of methods still exists, obstructing the identification and quantification of specific algal species.
In this study, the Softmax classifier was applied for the data processing. The discriminative probabilities of distinguishing all eight HAB species via Softmax Classifier exceeded 80%, except in Chattonella. The identification accuracy rate of pure samples exceeded 95%, and that of dominant algal species in mixed samples reached 77.4%. The Softmax classifier has advantages of fast calculation speeds as well as intuitiveness compared with other classifications [].
In addition, a concentration prediction model was established, mainly based on the linear model between fluorescence intensity at seven wavelengths and corresponding cell densities. Non-negative weighted least square linear regression analysis was used to calculate the concentration of dominant HAB species.
In most studies, multiple linear regression was applied directly to calculate the composition as well as the concentration of each phylum. However, it was not used extensively to evaluate the cell concentration of species. Here, the developed model combined the Softmax classifier with linear concentration prediction model served as a potential tool for improving the identification of algae as well as the prediction of their concentration. The result of the comparation of the developed method with the multiple linear regression based on the same samples in Section 3.3 are shown in Table 8.

Table 8.
Comparison of our method with multiple linear regression.
The developed method achieves a higher accuracy of identification. All dominant algae could be identified, expect for one sample of AC. Identification with multiple linear regression performed worse, especially in PD due to its higher cell density. Errors in multiple linear regression are mainly caused by the participation of algae that do not exist in the composition. Because all norm spectra are involved in the calculation each time, the amount of calculation required increased and the accuracy of the result decreased. In the developed method, after identification, only the norm spectra of the dominant species are involved in the further calculation.
As this study was carried out in a laboratory environment, environmental factors were not considered. More relevant work should be undertaken to improve the algorithm for practical application and to further increase the accuracy of the concentration predictions.
Author Contributions
Conceptualization, S.S. and X.W.; methodology, S.S. and X.W.; software, S.S.; validation, S.S. and Z.X.; formal analysis, S.S. and Z.X.; resources, M.T.; data curation, S.S.; writing—original draft preparation, S.S.; writing—review and editing, S.S., M.T. and X.W.; visualization, S.S.; supervision, X.W.; project administration, X.W.; funding acquisition, M.T. and X.W. All authors have read and agreed to the published version of the manuscript.
Funding
National Natural Science Foundation of China (61775191).
Institutional Review Board Statement
Not applicable.
Informed Consent Statement
Not applicable.
Data Availability Statement
Not applicable.
Acknowledgments
We sincerely thank Tong Meng-Meng and her students for cultivating and providing all the red-tide algae we used in this paper. We also thank Cai Haoyuan for providing relevant technical supports for us.
Conflicts of Interest
The authors declare that they have no known competing financial interests or personal relationships that could have appeared to influence the work reported in this paper.
References
- Hallegraeff, G.M. A review of harmful algal blooms and their apparent global increase. Phycologia 1993, 32, 79–99. [Google Scholar] [CrossRef] [Green Version]
- Yang, Z.B.; Hodgkiss, I.J. Hong Kong’s worst “red tide”—Causative factors reflected in a phytoplankton study at Port Shelter station in 1998. Harmful Algae 2004, 3, 149–161. [Google Scholar] [CrossRef]
- Wang, X.; Song, H.; Wang, Y.; Chen, N. Research on the biology and ecology of the harmful algal bloom species Phaeocystis globosa in China: Progresses in the last 20 years. Harmful Algae 2021, 107, 102057. [Google Scholar] [CrossRef] [PubMed]
- Onitsuka, G.; Yamaguchi, M.; Sakamoto, S.; Shikata, T.; Nakayama, N.; Kitatsuji, S.; Itakura, S.; Sakurada, K.; Ando, H.; Yoshimura, N.; et al. Interannual variations in abundance and distribution of Chattonella cysts, and the relationship to population dynamics of vegetative cells in the Yatsushiro Sea, Japan. Harmful Algae 2020, 96, 101833. [Google Scholar] [CrossRef] [PubMed]
- Deglint, J.L.; Jin, C.; Chao, A.; Wong, A. The Feasibility of Automated Identification of Six Algae Types Using Feed-Forward Neural Networks and Fluorescence-Based Spectral-Morphological Features. IEEE Access 2019, 7, 7041–7053. [Google Scholar] [CrossRef]
- Yentsch, C.S.; Phinney, D.A. Spectral fluorescence: An ataxonomic tool for studying the structure of phytoplankton populations. J. Plankton Res. 1985, 7, 617–632. [Google Scholar] [CrossRef]
- Zhang, Q.Q.; Lei, S.H.; Wang, X.L.; Wang, L.; Zhu, C.J. Discrimination of phytoplankton classes using characteristic spectra of 3D fluorescence spectra. Spectrochim. Acta Part A Mol. Biomol. Spectrosc. 2006, 63, 361–369. [Google Scholar] [CrossRef]
- Zhao, N.; Zhang, X.; Yin, G.; Yang, R.; Hu, L.; Chen, S.; Liu, J.; Liu, W. On-line analysis of algae in water by discrete three-dimensional fluorescence spectroscopy. Opt. Express 2018, 26, A251. [Google Scholar] [CrossRef]
- Medlin, L.K.; Orozco, J. Molecular Techniques for the Detection of Organisms in Aquatic Environments, with Emphasis on Harmful Algal Bloom Species. Sensors 2017, 17, 1184. [Google Scholar] [CrossRef]
- Buskey, E.J.; Hyatt, C.J. Use of the FlowCAM for semi-automated recognition and enumeration of red tide cells (Karenia brevis) in natural plankton samples. Harmful Algae 2006, 5, 685–692. [Google Scholar] [CrossRef]
- Wei, L.; Su, K.; Zhu, S.; Yin, H.; Li, Z.; Chen, Z.; Li, M. Identification of microalgae by hyperspectral microscopic imaging system. Spectrosc. Lett. 2017, 50, 59–63. [Google Scholar] [CrossRef]
- Chikkaswamy, B.K.; Paramanik, R.C. Molecular Distinction of Algae using Molecular Marker. Int. J. Curr. Microbiol. Appl. Sci. 2016, 5, 489–495. [Google Scholar] [CrossRef]
- Loukas, C.M. Lab-On-A-Chip Technology for in Situ Molecular Analysis of Marine Microorganisms. Ph.D. Thesis, University of Southampton, Southampton, UK, 12 December 2016. [Google Scholar]
- Alshehri, M.A. Identification of Algae Species Using Advanced Molecular Techniques. Int. J. Pharm. Res. Allied Sci. 2020, 9, 142–159. [Google Scholar]
- Yentsch, C.S.; Menzel, D.W. A method for the determination of phytoplankton chlorophyll and phaeophytin by fluorescence. Deep. Sea Res. Oceanogr. Abstr. 1963, 10, 221–231. [Google Scholar] [CrossRef]
- Zhang, S.; Su, R.; Duan, Y.; Zhang, C.; Song, Z.; Wang, X. Fluorometric discrimination technique of phytoplankton population based on wavelet analysis. J. Ocean. Univ. China 2012, 11, 339–346. [Google Scholar] [CrossRef]
- Beutler, M.; Wiltshire, K.H.; Meyer, B.; Moldaenke, C.; Lüring, C.; Meyerhöfer, M.; Hansen, U.P.; Dau, H. A fluorometric method for the differentiation of algal populations in vivo and in situ. Photosynth. Res. 2002, 72, 39–53. [Google Scholar] [CrossRef] [PubMed]
- Syw, A.; Xyl, A.; Yu, L.A.; Syg, B.; Whb, A.; Tjj, B. Identification of paralytic shellfish poison producing algae based on three-dimensional fluorescence spectra and quaternion principal component analysis. Spectrochim. Acta Part A Mol. Biomol. Spectrosc. 2021, 261, 120040. [Google Scholar]
- Liang, M.; Huang, F.R.; He, X.J.; Chen, X.D. Algae Identification Research Based on Fluorescence Spectral Imaging Technology Combined with Cluster Analysis and Principal Component Analysis. Spectrosc. Spectr. Anal. 2014, 34, 2132–2136. [Google Scholar]
- Zieger, S.E.; Seoane, S.; Laza-Martinez, A.; Knaus, A.; Mistlberger, G.; Klimant, I. Spectral Characterization of Eight Marine Phytoplankton Phyla and Assessing a Pigment-Based Taxonomic Discriminant Analysis for the in Situ Classification of Phytoplankton Blooms. Environ. Sci. Technol. 2018, 52, 14266–14274. [Google Scholar] [CrossRef]
- Xiao-Li, Q.I.; Zhen-Zhen, W.U.; Chuan-Song, Z.; Rong-Guo, S.U.; Xiao-Yong, S. A Fluorescence Technology for Discriminating Toxic Algae by Support Sector Machine Regression. Period. Ocean. Univ. China 2016, 46, 73–80. [Google Scholar]
- Liu, J.; Zeng, L.H.; Ren, Z.H.; Du, T.M.; Liu, X. Rapid in situ measurements of algal cell concentrations using an artificial neural network and single-excitation fluorescence spectrometry. Algal Res. 2020, 45, 101739. [Google Scholar] [CrossRef]
- Chen, Y. Realization of Wavelet Soft Threshold De-noising Technology Based on Visual Instrument. In Proceedings of the International Joint Conference on Artificial Intelligence, Hainan, China, 25–26 April 2009; pp. 849–852. [Google Scholar]
- Kumar, K. Discrete Wavelet Transform (DWT) Assisted Partial Least Square (PLS) Analysis of Excitation-Emission Matrix Fluorescence (EEMF) Spectroscopic Data Sets: Improving the Quantification Accuracy of EEMF Technique. J. Fluoresc. 2019, 29, 185–193. [Google Scholar] [CrossRef] [PubMed]
- Qiaohua, Z.; Boqiang, Q. Spectral absorption characteristics of algae and discrimination of the absorption spectrum of mixed algae. Acta Sci. Circumstantiae 2008, 28, 313–318. [Google Scholar]
- Duan, K.; Keerthi, S.S.; Chu, W.; Shevade, S.K.; Poo, A.N. Multi-category classification by soft-max combination of binary classifiers. In Proceedings of the Multiple Classifier Systems, 4th International Workshop, MCS 2003, Surrey, UK, 11–13 June 2003. [Google Scholar]
- Proctor, C.W.; Roesler, C.S. New insights on obtaining phytoplankton concentration and composition from in situ multispectral Chlorophyll fluorescence. Limnol. Oceanogr. Methods 2010, 8, 695–708. [Google Scholar]
- Chen, H.; Zhou, W.; Chen, W.; Xie, W.; Jiang, L.; Liang, Q.; Huang, M.; Wu, Z.; Wang, Q. Simplified, rapid, and inexpensive estimation of water primary productivity based on chlorophyll fluorescence parameter. J. Plant Physiol. 2017, 211, 128. [Google Scholar] [CrossRef] [PubMed]
- Leeuw, T.; Boss, E.; Wright, D. In situ Measurements of Phytoplankton Fluorescence Using Low Cost Electronics. Sensors 2013, 13, 7872–7883. [Google Scholar] [CrossRef] [PubMed] [Green Version]
- Revelle, W. Hierarchical Cluster Analysis And The Internal Structure Of Tests. Multivar. Behav. Res. 1979, 14, 57. [Google Scholar] [CrossRef]
- Valenzuela-Espinoza, E.; Millan-Nunez, R.; Santamaria-Del-Angel, E.; Trees, C.C. Macronutrient uptake and carotenoid/chlorophyll a ratio in the dinoflagellate Amphidinium carteri Hulburt, cultured under different nutrient and light conditions. Hidrobiol. Rev. Dep. Hidrobiol. 2011, 21, 34–48. [Google Scholar]
- Liu, S.X.; Yu, Z.G.; Yao, P.; Zheng, Y.; Li, D. Effects of irradiance on pigment signatures of harmful algae during growth process. Acta Oceanol. Sin. 2011, 30, 46–57. [Google Scholar] [CrossRef]
- Bidigare, R.R.; Ondrusek, M.E.; Morrow, J.H.; Kiefer, D.A. In-vivo absorption properties of algal pigments. Proc. Spie Int. Soc. Opt. Eng. 1990, 1302, 290–302. [Google Scholar]
- Poryvkina, L.; Babichenko, S.; Leeben, A. Analysis of phytoplankton pigments by excitation spectra of fluorescence. In Proceedings of the EARSeL-SIG-Workshop LIDAR, Tallinn, Estonia, 16–17 June 2000; Institute of Ecology/LDI: Tallinn, Estonia, 2000; pp. 224–232. [Google Scholar]
- Yoshida, M.; Horiuchi, T.; Nagasawa, Y. In situ multi-excitation chlorophyll fluorometer for phytoplankton measurements: Technologies and applications beyond conventional fluorometers. In Proceedings of the Oceans, Waikoloa, HI, USA, 19–22 September 2011. [Google Scholar]
- Silvia, Z.; Günter, M.; Lukas, T.; Lang, A.; Fabio, C.; Ingo, K. Compact and low-cost fluorescence based flow-through analyzer for early-stage classification of potentially toxic algae and in situ semi-quantification. Environ. Sci. Technol. 2018, 52, 7399–7408. [Google Scholar]
- Qi, X.; Wang, T.; Liu, J. Comparison of Support Vector Machine and Softmax Classifiers in Computer Vision. In Proceedings of the International Conference on Mechanical, Harbin, China, 8–10 December 2017; pp. 151–155. [Google Scholar]
Publisher’s Note: MDPI stays neutral with regard to jurisdictional claims in published maps and institutional affiliations. |
© 2021 by the authors. Licensee MDPI, Basel, Switzerland. This article is an open access article distributed under the terms and conditions of the Creative Commons Attribution (CC BY) license (https://creativecommons.org/licenses/by/4.0/).