Abstract
TiO2 nanoparticles coating has been proven to be an extremely performing sensing material for relative humidity (RH) measurements. The chemical activity of TiO2 toward water vapor adsorption and the very large surface to volume ratio typical of nanostructures are ideal characteristics for the development of RH fast and sensitive sensors. Different sensor technologies can be used in conjunction with this material to realize devices with satisfactory performance. In this paper, the authors aim to describe and discuss the main different possible choices and highlight the advantages and disadvantages, and linking them both to the underlying mechanism of water adsorption on the TiO2 sensing layer and to the modification of the electrical behavior due to the water adsorption. In particular, the authors start from results obtained by depositing TiO2 nanoparticles on a novel MEMS microbalance operating at low frequency, which allows to sense only the adsorbed water mass, and they exploit the sensor output to obtain a dynamic model of the water adsorption. They also link these results to those obtained with a Quartz Crystal Microbalance (QCM) functionalized with the same material operating at 10 MHz as a part of an oscillator. Finally, they establish a link with the results obtained by an RH impedance sensor, which exploits the same active material and the same deposition technique. With this sensor technology, the conductive and electrical behavior of the sensing and adsorbed films play a role. The whole work tries to unravel the different phenomena that contribute to the response of RH sensors not only based on TiO2 nanoparticles but also, more generally, based on nanostructured metal oxide materials.
1. Introduction
Humidity monitoring has a great impact on many different applications [1,2,3]. Even if many commercial sensors are available and provide satisfactory performance, actually, despite the declared specifications, many of them have some severe limitations in terms of accuracy, response time, linearity, and hysteresis. Particular issues are related to measurements at the two extremes of the RH range, especially for very high RH values. One of the most severe problems arises from performing measurements in water vapor saturated environments, where most sensors experience very slow transients. For these reasons, there is a growing research interest in the development and study of novel RH sensors. In particular, there is a great attention toward nanostructured materials, and metal oxide nanostructures, that can ensure very high sensitivity and fast responses. The role of nanostructured titanium dioxide (TiO2) in this context, as a possible sensing material for water vapor, was proved by many recent researches [4,5].
Among the different oxides, titania (TiO2) is a thermodynamically favored phase, though Ti exhibits Ti3+ and Ti2+ oxidation states. Titania is commonly a native n-type semiconductor, due to favored bulk donor defects or impurities. It is used in many applications, including solar cells, optical waveguides, interference filters, and capacitors. It has also important applications related to its capability of interacting with the chemical environment. The most popular applications exploit its UV-photocatalytic activity [6,7,8], in fact, on TiO2, water dissociates into H+ and active hydroxyl ions, OH−, able to decompose many organic contaminants.
Due to this behavior, TiO2-based self-cleaning coatings have been developed and applied to the protection of transparent surfaces as, for instance, photovoltaic modules [9].
This paper explores the sensing properties of a TiO2 nanoparticle coating, which allows low-cost and facile manufacturing of nanostructured sensing layers characterized by a very large surface to volume ratio. In this paper, the authors model, discuss, and compare the performance of sensors obtained using these sensing films as active layers in mass resonant sensors [10,11] and in resistive sensors [12], both operating at room temperature.
In mass sensors, the active layer is a part of a resonant vibrating mechanical/electromechanical structure. The basic sensing mechanism for these sensors exploits the adsorption of water molecules from the gas phase on the sensing layer. This phenomenon causes a variation of the inertial properties (mass) of the resonator, which in turns causes the variation of its modal frequency. The mechanical vibration is usually converted into an electrical signal by a piezoelectric material embedded in the resonator. Two main categories of this kind of devices are mostly used: high-frequency Quartz Crystal Microbalances, operating typically in the MHz range, and low-frequency micro electro-mechanical system (MEMS) resonators, operating typically from hundreds of Hz to tens of kHz. Theoretically, the frequency shift induced by adsorption is linearly related to the added mass. Nevertheless, both the functionalization of the resonant structure, i.e., the addition of the sensing layer, and the read-out circuit can heavily affect the measurement due to mechanical and electrical loading effects. Therefore, the sensor input–output relationship is often highly nonlinear.
Resistive sensors, even if they need a very simple read-out electronics, rely on a far more complex sensing mechanism. The adsorbed molecules in fact must affect the electronic conduction of the sensing film or provide further paths for carrier transport. In particular, in case of water vapor, and of single layer adsorption there must be also a charge transfer between layer and adsorbates. This is the common operating principle for gas sensors based on metal oxide. Indeed, the charge transfer can have different effects on the conductivity of the layer, and their relevance is a function of the material characteristics, of the presence of superficial or bulk defects, and finally, of the film micro- or nanostructure. Therefore, in this case, a main difference between mass and resistive humidity sensors based on metal oxides is that the first sense both physio- and chemisorption and the latter instead sense only chemisorption. In case of multilayer adsorption of water, a water film is created above the sensing film, and a further path for current conduction is created. Therefore, in this case, physiosorbed molecules contributes heavily to conductivity variations [13]. Both mechanisms of water sensing in resistive sensors contribute to the overall response of the device, and their relevance depends on the humidity level.
The paper is organized as follows. In Section 2, we give a theoretical background discussing the basic sensing mechanisms. First of all, we examine the adsorption/desorption theory and we present some mathematical models for adsorption of water on TiO2 nanostructured films. Then, we discuss the influence of adsorbed water on the conduction and impedance of TiO2 films.
The sensor preparations and the experimental setups used to characterize the different sensing mechanisms are described in Section 3. Section 4 is dedicated to experimental results, which allow for interpreting the presented models, for studying water vapor adsorption on TiO2 nanoparticles and for discussing the different performance that can be obtained by the realized sensors. Finally, the conclusions are drawn in Section 5.
2. Theoretical Background
2.1. Modeling of Water Adsorption on TiO2
TiO2, especially in its anatase phase, was proven to be a very hydrophilic material able to adsorb large quantities of water molecules from the gas phase on its surface. It is accepted that at room temperature (RT), the adsorption of water vapor forms a multilayer coverage of the surface, in which the first layer can be molecular water that can dissociate and form hydroxyl ions. Therefore, even at RT, a large quantity of chemisorbed strongly bound-dissociated water is expected. Over this first layer, subsequent layers of molecular physiosorbed water are formed by means of hydrogen bonds. The different adsorbed species and their arrangement in the first two layers are sketched in Figure 1.
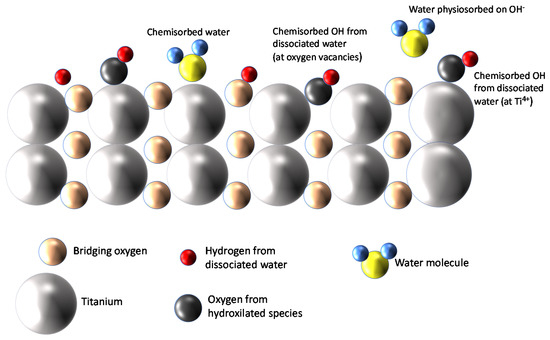
Figure 1.
Water adsorption on TiO2 [14].
Typically, multilayer adsorption can be described by Brunauer–Emmett–Teller (BET) theory [11,15,16,17], which is depicted in Figure 2a, where it can be seen that two reversible adsorption reactions are assumed. The first one, characterized by the reaction rate constants kA (for adsorption) and k−A (for desorption), describes the adsorption of water on the TiO2 surface forming the layer labelled A, where water molecules can dissociate and adsorb at the adsorption sites S. The second one, with reaction rate constants kC (for adsorption) and k−C (for desorption), describes the adsorption of water molecules on the adsorbates (sites S*) and models the formation of the upper layers. The reaction for the first layer can be written as follows:
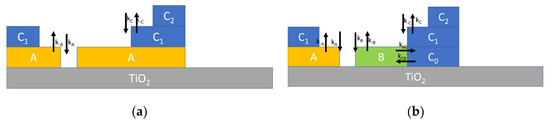
Figure 2.
Schematic representation of multilayer adsorption of water on TiO2 nanoparticles. (a) Multilayer adsorption according to BET theory described by Equation (3). (b) Multilayer adsorption route according to [18] described by Equation (4).
On the other hand, the reaction for the subsequent layers, can be written as:
In Reaction (2), indicates both the water bond to hydroxyl groups and physiosorbed water.
Defining the surface density of adsorbed hydroxyl groups [, and the surface density of the adsorbed water in the upper i-th layer []i = , and assuming first-order reactions, the kinetic of the overall adsorption, forming N + 1 layers, can be represented by the following differential equations:
where [S] indicates the surface density of adsorption sites and i = 1, …, N indicates the layer. In this equation, according to the literature [16], it was considered that only water in the top layer can desorb.
These equations can be used to describe the adsorbed water mass considering that, the mass at the first layer, , is , whereas the water mass adsorbed at the i-th layer, is , where A is the TiO2 surface area, Ai is the effective surface at the i-th layer, and finally, is the mass of a water molecule. The total adsorbed water mass can be obviously found as:
Note that for a planar TiO2 structure, A = Ai for all i.
As a conclusion, the differential Equation (3) can be used to describe the mass adsorption transient behavior, provided that [S] is replaced by S’ = .
The simple model presented in Equation (3), in which only dissociative adsorption at the first layer is considered, can be refined incorporating some new results presented in the recent literature. In fact, according to recent studies concerning the adsorption on TiO2 surface, a more complex adsorption scheme is expected as described in Figure 2b [18]. In synthesis, water can form two types of bonds on the TiO2 surface (labelled A and B) and the absorption of subsequent layers (C = hydrogen bond) changes one of these two bond types (B) into C. This adsorption mechanism can be described, in analogy to the previously derived model, by modified differential equations describing the reaction kinetics as follows:
where XY indicates the surface density of species Y (all the species Y appear in Equation (5)) and the corresponding adsorption/desorption rate constants (kY and k-Y, respectively) are defined in Figure 2b.
Another refinement of the model specifically aimed at describing adsorption on nanoparticles, can be obtained by taking into account some recent studies [16,19], which incorporates also the effect of the increasing radius of the upper adsorbed layers (Figure 3a) and a possible material flux across the layers (Figure 3b), leading to a slightly different model described in the following equations:
where is the nanoparticle radius, whereas is the thickness of a monolayer, taken as the size of a single water molecule (about 275 pm). indicates the surface of the nanoparticle, whereas is the surface of the i-th adsorption layer. In Equation (6), XY indicates the surface density of species Y; the species Y and the corresponding adsorption/desorption rate constants (kY and k−Y) are all defined in Figure 3.
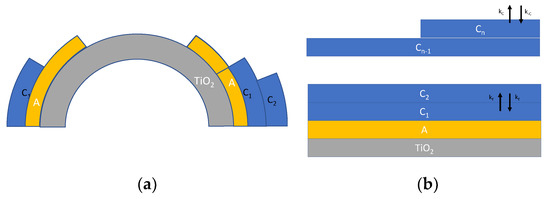
Figure 3.
Schematic representation of multilayer adsorption of water on TiO2 nanoparticles. (a) Multilayer adsorption taking into account the surface increase [19] and (b) multilayer adsorption route according to [19] described by Equation (6).
Summarizing, three models, with different degrees of simplification, can be used to describe the adsorption of water on a multilayer basis, and to predict the adsorbed water mass dynamics, allowing for describing and predicting the behavior of humidity sensors based on added mass measurement.
It must be noticed that sensing films made up of nanoparticles, differently from those based on compact films, show a peculiar behavior at high RH [10,11,13,20]. In particular, the water uptake at high RH values becomes very large, consequently, the sensor response is characterized by a very large sensitivity. This behavior is attributed to the condensation of water in the nanopores. In fact, a nanostructured material, made up of nanoparticles, is characterized by many interstitial empty spaces among different particles, i.e., nanopores, that behave as capillaries. Therefore, at high RH levels, condensation in the pores is very likely. This phenomenon seems to be extremely relevant and it is suggested that it could lead also to the growth of the pores. In this context, for instance, Torun et al. [21] supported this hypothesis showing, by means of Fourier transform Infrared Spectroscopy (FTIR) and QCM, that liquid water is the dominant species on relatively large SiO2 nanoparticles (250 nm) already at 60% RH. Therefore, summarizing the change in the water uptake regime, resulting in a remarkably water uptake at high relative humidity, can be attributed to ongoing condensation of water in the pores, which could finally lead to capillary growth and to the formation of a closed water film due to merging of capillaries. In this regard, it has to be taken into account that, because of the capillaries formation, the layer structures and the adhesion of the TiO2 film with the substrate could slowly change [21].
When this happens, the models reported in this section will not be able to describe the amount of water adsorbed on the film. Therefore, the presented models are expected to describe the uptake of water on the TiO2 nanoparticle film from the gas phase in a limited RH range.
2.2. Influence of Adsorbed Water on the TiO2 Film Impedance
TiO2 nanostructured films have been often proposed as conductometric or impedance RH sensor [13,22,23], because the presence of adsorbed water or liquid water highly affects the conductivity and the electric behavior of the film. This subsection discusses this sensing mechanism with special reference to operations at room temperature, on the basis of the known theory. TiO2 is a semiconductor with a large band gap (Eg = 3.2 eV for anatase), therefore at RT, intrinsic carriers are really few, nevertheless TiO2 common preparation routes are responsible for the spontaneous formation of a large number of oxygen vacancies and of interstitial Ti atoms. Therefore, in normal environmental conditions, TiO2 behaves as an n-type semiconductor. Conduction in nanostructured film of TiO2 particles, as in the most part of grained metal oxide films, is electronic and is dominated by the presence of potential barriers at the grain boundaries and, as such, it is highly sensitive to the presence of charged adsorbate due to chemisorption of gases that causes both carrier density variations and changes of the barrier heights. This behavior is normally exploited for gas sensing. When considering water vapor as the target gas, the dissociative adsorption in the first layer, discussed in the previous subsection, with the formation of OH− and H+, is responsible for electronic conductance variation. Nevertheless, at room temperature, chemisorption of many gases is limited and gives rise to a rather small sensitivity and slow dynamics of conductometric gas sensors. On the other hand, when used to sense water, the response of TiO2-based conductimetric sensors at RT is very large. This is justified partly because even at RT, dissociative adsorption on TiO2 occurs, but above all because other types of conduction mechanisms arise and contribute to the variation of the overall film conductance (or more generally impedance). In particular, proton hopping on the adsorbed hydroxyl groups (i.e., the process of discrete jumps of a charge carrier from site to site over energy barriers) contributes significantly to drift current, adding the contribution of protonic conduction in the adsorbed water layers to the electronic one in the TiO2 film. Moreover, since water adsorption leads to the formation of a multilayer structure, even at low humidity levels, in addition to the effect of the first layer, a further path for charge carrier drift is provided by the upper layers formed by a network of water molecules with hydrogen bonds; there, the proton hopping is extremely favored. In fact, physiosorbed water layers show a liquid-like behavior and H+ ions move quite freely (Grotthuss chain reaction). Beside contributing to conduction and drift current, the upper layers, consisting of water-like networks of singly bonded water molecules, possess a high dielectric constant as molecules are dipoles that can reorient freely under an externally applied electric field originating a large capacitive behavior.
Finally, the occurrence of capillary condensation, which takes place in all the pores with radius smaller than the Kelvin critical radius, further enhances the electrical conductivity of the overall film with the same proton hopping mechanism [13] and contributes to the capacitive behavior. In the liquid phase, ionic conduction can also take place.
Therefore, an overall schematic model for conductance of the water/adsorbed water/TiO2 film is shown in Figure 4. In the absence of condensed water in the pores, the DC conductance of the overall film will be a combination of conductance elements of the type described with the following equation, which uses the symbols described in Figure 4:
where is the Boltzmann’s constant, is the absolute temperature, is the electron charge, and are the proton density in the first adsorption layer or in the upper layers, respectively, and are their mobility. Finally, is the cross-sections of the layer i, while l is the current path length. represents the electronic conduction in the TiO2 layer essentially due to the particle boundaries which is dependent on the chemisorbed water. This contribution was considered a thermally activated conductance with an activation energy which corresponds to the boundary barrier height depending on the water vapor concentration. It appears that this last term must be taken into account at RT only for very low RH values, i.e., in case of monolayer adsorption, otherwise, when multilayer adsorption occurs, the terms related to protonic hopping tend to dominate. It can be noticed that the conductance term, relative to the upper layers, is proportional to the upper layer cross-section area, which in turn is proportional to the mass of water adsorbed in the upper layers.
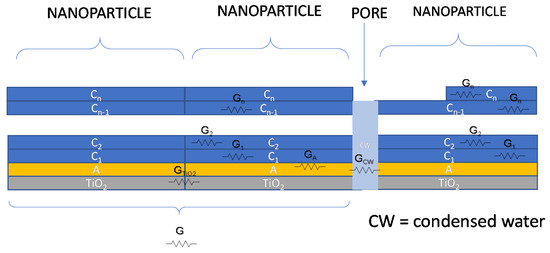
Figure 4.
Contributions to charge transport phenomena for TiO2 in a humid environment.
At high RH values, the condensed water in the pores forms conductive bridges in series with the above-described conductance; these bridges can eventually merge and form a film of condensed water over the surface. When this happens, the conduction in condensed water is expected to become the dominant contribution.
The resulting equivalent electrical model of the film can be derived by its impedance. The model can be typically described by a series of parallel RC groups [24], where the resistances describe the transport of current and are found combining (series and parallel) the contributions discussed above, whereas the capacitances describe the fixed dipole orientation and charge accumulations at interfaces. Usually, for RH sensors based on nanostructured TiO2 films, one or two RC groups are sufficient to model the impedance [13].
Since the TiO2 film is deposited across two metal electrodes, the overall impedance of the sensors must encompass also the contribution of the metal electrode/film interface which is represented by a RC group where, the capacitance can be replaced by constant phase elements as in analogy to the models used for electrochemical cells where electronic/ionic conduction occurs. In Figure 5 is reported an example for the equivalent model of a TiO2 film in humid environment when a dominant conduction mechanism occurs (e.g., proton hopping in adsorbed water): only one RC group (CF and RF) can be used to model the film, the second group (CE and RE) represents the electrode/film interface, whereas Cp accounts for fixed parasitic capacitances. If different species contribute significantly to the conduction in the analyzed frequency range, other RC groups have to be added to the model. The capacitance CE, at high RH levels, is replaced by a constant phase element.
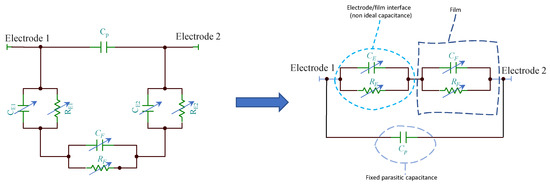
Figure 5.
Equivalent circuits for the TiO2 film in humid environment.
3. Materials and Material Characterization
The TiO2 based sensing film is realized by means of a transparent solution of TiO2 nanoparticles suspended in water provided by Italvernici (ITALVERNICI-FELCE150). It consists of crystalline anatase nanoparticles having a dispersion of the grain diameter from 25 to 55 nm (stated by manufacturer) diluted in water with a concentration of 32 × 10−3 mol/L and having a viscosity of 2.0 cPs.
To characterize the nanoparticles, scanning electron microscopy (SEM) and transmission electron microscopy (TEM) were used. SEM imaging was carried out with Quanta 400 (FEI) emission scanning electron microscope operating a 20.0 kV. Before the image analysis, the TiO2-based solution was deposited on a proper graphite-based sample stub and heated in oven at 400 °C for approximately 2 h in order to remove residual impurities.
A Tecnai G2 Spirit (FEI) TEM operating at 120 kV has been used for TEM analysis.
In Figure 6a, the SEM image of the nanostructured TiO2 layer is shown, whereas Figure 6b reports the resulting Energy Dispersive Spectroscopy analysis (EDS), which reveals the presence of Ti and O as main elements, followed by the presence of carbon (C), which can be due to the nature of the stub substrate. Moreover, traces of silicon (Si) and sodium (Na) were detected at impurity level.
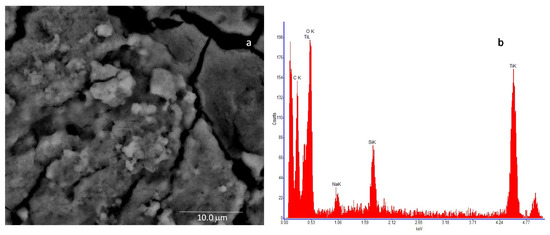
Figure 6.
High-resolution field emission scanning electron microscopy (SEM) image of the TiO2 sample. The microscopic investigation is performed with a Quanta 400 (FEI) emission scanning electron microscope, operated at 20.0 kV: (a)—deposited film (scale bar = 10 mm) and (b)—result of the Energy Dispersive Spectroscopy (EDS) of the analyzed sample.
Figure 7 shows the TEM image of the TiO2 analyzed sample, where it is possible to observe the structure of the TiO2 nanoparticles which, actually, show a smaller dimension with respect to that specified by the manufacturer, revealing a maximum diameter of approximately 20 nm.
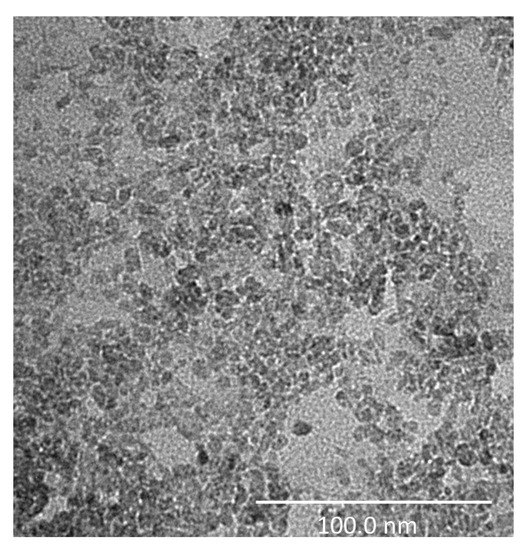
Figure 7.
High-resolution Transmission Electron Microscopy (TEM) image of the TiO2-based sample. The investigation was performed using a Tecnai G2 Spirit (FEI) operated at 120 kV (scale bar = 100 nm).
3.1. Water Adsorption on TiO2: Sensing Devices and Measurement Methods
Water adsorption on TiO2 nanoparticles films was measured by gravimetric method with mass sensors based on electromechanical resonant systems. In particular, a high-frequency QCM sensor [11] and a low-frequency MEMS cantilever [10] have been used. The surfaces of these two resonant systems were functionalized with the deposition of the TiO2 nanoparticle coating described and characterized in the previous section. Moreover, the electrical properties of TiO2 nanoparticle films in humid environments have been characterized by means of impedance measurements exploiting a custom thin film circuit realized on an oxidized silicon substrate [12]. In Figure 8, a schematic representation of the considered sensors and measurement methods is reported. All the sensors used in this paper were thoroughly characterized in some previous papers [10,11,12], their main characteristics are reported in the following subsections for clarity sake.
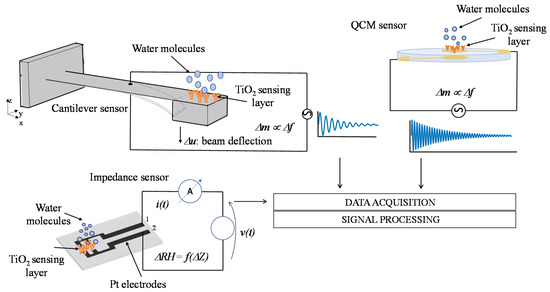
Figure 8.
Schematic representation of the humidity measurement methods based on functionalized high-frequency Quartz Crystal Microbalance (QCM), low-frequency MEMS cantilever sensors, and impedance sensor.
To monitor the water adsorbed on TiO2 nanoparticles, the different sensing devices described above have been placed in ad hoc designed sealed measurement chambers, within which the desired gas flow was delivered by means of a PC controlled flowmeter system. During the measurement, the total flow injected in the chambers was kept constant, whereas its composition was varied. The desired humidity was set by means of a bubbler, kept at a constant and controlled temperature, where a synthetic dry air flow (coming from certified cylinder) is saturated. To obtain different values of RH, a dry air flow from a certified cylinder was mixed with the saturated air flow coming from the bubbler, in proper proportion to obtain the desired RH value.
3.1.1. The QCM Sensor and Sensing System
The QCM sensor is a 10 MHz AT-cut quartz piezoelectric resonator having two Au electrodes on the top and the bottom surfaces of the quartz disk, respectively [11]. Doses of the TiO2-based solution were deposited over one of the quartz electrodes by drop casting method using a micropipette. The sensor response was acquired in real time by means of a tailored front-end based on a Meacham oscillator circuit and a data acquisition board directly connected to a PC for subsequent signal processing. In particular, an accurate digital single tone frequency estimation algorithm was used to monitor the shift of the QCM resonance frequency of the quartz due to the adsorption of the water molecules on the functionalized surface. For low RH values, the water adsorbed mass can be obtained from the measured QCM resonance frequency shift Δf, exploiting the well-known Sauerbrey equation:
where f0 is the quartz-resonance frequency, A is the effective area of the electrodes, and are the quartz shear modulus and density, respectively, whereas Δm is the additional mass due to the water adsorption to be detected. The device was placed in a custom sealed Teflon chamber within which, as described in Section 3.1, the different humidity levels were obtained. The total gas flow was kept constant at 200 mL/min.
3.1.2. The Cantilever-Based Sensor and Sensing System
Adsorbed water mass measurements were also obtained by exploiting the mass sensing performance of a MEMS cantilever structure, which presents a lumped mass at its free end [10,25]. The free end of the beam was functionalized by drop casting an amount of approximately 14 μL of the TiO2 coating described in the previous section, by paying attention to localize the deposition on the lumped mass of the structure (see Figure 8), in order to avoid changing the elastic behavior of the resonant system. This deposition method ensures that in humid environments, the cantilever resonance frequency undergoes a shift, Δf, related to the water adsorbed mass, which is described by the following relationship:
where m is the cantilever effective mass and Δm represents the additional mass due to the H2O adsorption that must be detected, whereas f0 is the resonance frequency in dry environment.
The device was placed in a sealed 3D-printed measurement chamber in ABS material within which, as described in Section 3.1, different humidity levels were obtained. In this case, the gas flow was kept constant at 100 mL/min during measurements. The device resonance frequency shift (and therefore the adsorbed water mass) was monitored exploiting tailored designed front-end electronics, a data acquisition board connected to the PC, and an accurate digital single-tone estimation algorithm.
3.1.3. The Impedance Sensor and Sensing System
Impedance measurements have been performed by means of a thin-film circuit realized on an oxidized silicon substrate fabricated using custom IC production techniques [12]. An amount of 8 μL of the TiO2-based solution was drop casted with a micropipette across two interdigitated electrodes realized in platinum and connected to the terminals (1–2, see Figure 8) used as electrical contacts for measurements. An ad hoc front-end circuit and a complete remotely controlled measurement chain, comprising the flowmeter system for the humidity control described in Section 3.1, were designed in order to measure the resulting sensor impedance variations at different RH levels. During measurements, the sensor was placed in a sealed 3D-printed measurement chamber in ABS material where the humid gas flow (total constant flux of 100 mL/min) was injected. The sensor impedance spectra, Z(f), obtained by applying a sine wave input excitation signal in the frequency range of 50 Hz–80 kHz, have been measured exploiting the following relationship:
where indicates the sinusoidal excitation signal and , the measured current flowing through the TiO2 film.
4. Experimental Results and Discussion
In this section, both experimental results and model predictions will be used to study and discuss the adsorption of water on TiO2 nanoparticles and the related response of the different types of sensors. At first, the calibration of the adsorption models presented in Section 2.1 by means of the measurements obtained with the mass cantilever sensors described in Section 3 will be described. The obtained results will be used to gain further insight in the water adsorption process and in the mass sensor behavior, taking also into account the collected data by means of the QCM based system.
Finally, the behavior of the impedance sensors will be analyzed and related to the different adsorption and conduction mechanisms described in Section 2.2.
Note that the results reported in this section have been obtained with sensors extensively studied by authors in [10,11,12,26] and characterized in terms of sensitivity, time response as well repeatability and reproducibility. The reported experimental results are examples of repeated measurements, each different measurement was repeated at least three times in the same conditions during a long measurements champaign.
4.1. Water Adsorption on TiO2 Nanoparticle Films
In order to calibrate the multilayer water adsorption models presented in Section 2.1 the data collected by using the cantilever mass sensor has been used. Data were acquired under variable RH at RT (approximately 24 °C). The output of the sensor, which is a frequency shift, was converted into a mass using the calibration described in [10,26]. This data can be directly used to calibrate the adsorption models since, as already discussed in Section 2, the adsorbed mass dynamics can be linked to the adsorption kinetics. Accordingly, the mass adsorbed at a given layer z, characterized by the adsorbate density Xz, is and the mass sensed by the cantilever sensor is the sum of the masses adsorbed at all the layers on the TiO2 nanoparticles surface.
The three adsorption models were numerically implemented in MATLAB. The differential equations were numerically solved using the RH value as a function of time, derived from the flowmeter settings, as an input to the model. A nonlinear least square fitting (lsqnonlin) was used to fit the experimental data to the predicted model outputs, allowing for finding the unknown parameters.
In detail, the model described by Equation (3) needs the estimation of a set of 5 parameters (, the one in Equation (5), which is more complex, needs the estimation of 9 parameters (, whereas the one in Equation (6) is based on the assessment of 6 parameters .
Figure 9 shows the results given by the three models, after parameter estimation, obtained by fitting mass transient measurements with RH varying from 0% to 25% and back to 0%. The lower plots in the three reported results (Figure 9a–c) show the total adsorbed mass, whereas the upper plots show the mass related to the individual layers (different colors describe different layers, with blue line being the first layer.).
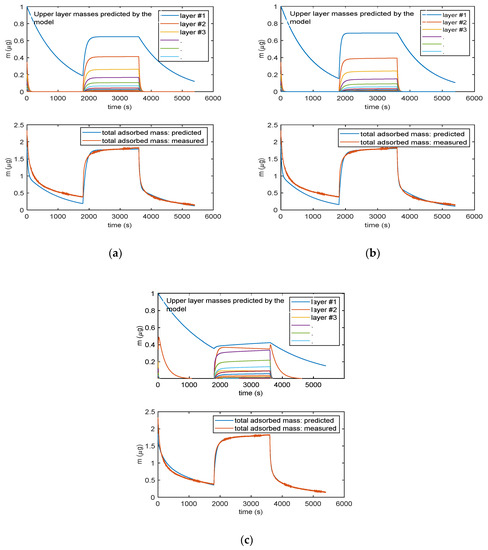
Figure 9.
Analytical model results obtained for the three multilayer adsorption models: (a) Model in Equation (3), (b) model in Equation (5) and (c) model in Equation (6). The lower plots in (a), (b) and (c) report the total adsorbed mass: blue lines—adsorbed mass predicted by the models; red lines—measured adsorbed water mass obtained exploiting the cantilever sensor (deposited TiO2 nanoparticles of approximately of 35 µg). The upper plots in (a), (b) and (c)report the mass adsorbed in each layer predicted by the models: blue lines—first layer; other colors—subsequent upper layers. In the upper plot in (c), the orange line is relative to the adsorbed water species named “Xb” in the Equation (5).
It can be noticed that all the models can satisfactorily fit the measured data and allow for displaying the multilayer adsorption dynamics. Moreover, as expected, even at the used relatively small RH value, the adsorption encompasses many adsorption layers, and it can be seen that the chemisorption of the first layer is slower than the adsorption of the upper layers. Therefore, the response time of the sensor is limited by the kinetics of adsorption of the first layer that at RT appears rather slow. These models were then verified on different measurements and showed a satisfactory agreement with experimental data up to 40–50% RH, as shown in Figure 10 for the model in Equation (3).
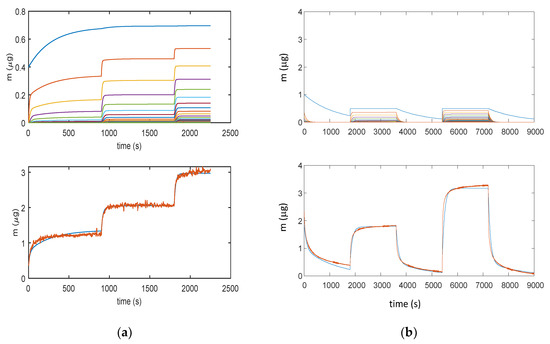
Figure 10.
Results obtained with model in Equation (3): (a) Measurement protocol: starting from dry air, RH is increased with steps of 15% (RH = 15%, 30%, and 45%) each 15 min (900 s); (b) Measurement protocol: RH = 0% (30 min), RH = 25% (30 min), RH = 0% (30 min), RH = 50% (30 min), and RH = 0% (30 min). Lower plots for (a) and (b): total adsorbed mass; blue lines—adsorbed mass predicted by the model; and red lines—measured adsorbed water mass obtained exploiting the cantilever sensor (deposition of 35 μg of TiO2 nanoparticles). Upper plots for (a) and (b): mass adsorbed in the different layers predicted by the models; blue lines—first layer; other colors—upper layers.
The more complex model of Equation (5) (9 parameters) is able to fit more accurately the adsorption dynamics, being the only one able to follow the slight increase of mass during the plateau phase of the response. In this model, the first layer is composed by the two contributions represented in the upper plots by the blue and orange lines: their combination provides a contribution to mass, which is very similar to the mass adsorbed in the first layer (blue lines) predicted by the other two models. The better accuracy obtained by this complex model is counterbalanced by the need of estimating of a very large number of parameters, which may lead to overfitting problems. It can be noticed that even the simplest model of Equation (3) is able to capture the most relevant features of the adsorption dynamics. Therefore, Equation (3) was considered the best modelling tool.
Figure 11 illustrates how the error for RH values larger than 40% becomes very large, clearly indicating that a relevant phenomenon occurring at high RH values is missed by modelling. This was assumed to be water condensation in the pores, as discussed in Section 2. From the analyzed data, it appears that this latter becomes the dominant mechanism at RH values larger than 75%.
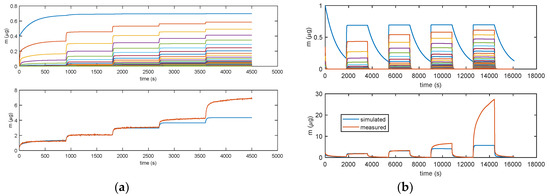
Figure 11.
Results obtained with model in Equation (3). (a) Measurement protocols: starting from dry air, RH is increased with steps of 15% (RH = 15%, 30%, 45%, 60%, and 75%) each 15 min (900 s). (b) Measurement protocol: RH = 0% (30 min), RH = 25% (30 min), RH = 0% (30 min), RH = 50% (30 min), RH = 0% (30 min), RH = 75% (30 min), RH = 0% (30 min), RH = 100% (30 min), and RH = 0% (30 min). Lower plots: total adsorbed mass; blue lines: adsorbed mass predicted by the model; and red lines: measured adsorbed water mass obtained exploiting the cantilever sensor (deposition of 35 μg of TiO2 nanoparticles). Upper plots: mass adsorbed in the different layers predicted by the models. Blue lines—first layer; other colors—upper layers.
As shown in Figure 12, for the model in Equation (3), all the models for multilayer adsorption predicts a quite linear steady sensor response (steady state adsorbed mass) as a function of RH, whereas the experimental results show that, with the used nanoparticles, a linear behavior is observed only up to 40% RH. After this limit, for high humidity values, the deviation from the linear behavior is very large leading to extremely large sensitivities for RH > 60%. The same deviation from linearity of the nanoparticle-based sensor response was observed also by other researchers [27,28] and for SiO2 nanoparticles with 250 nm diameters in [21] starting from RH values larger than 75%.
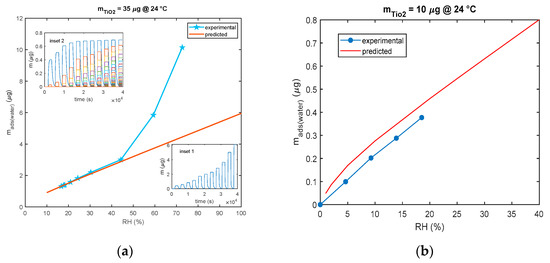
Figure 12.
Comparison of predicted and experimental calibration curve (mass adsorbed after 30 min of exposure to each RH level vs. RH). (a) The predicted calibration curve (red line) is obtained using the model of Equation (3) and pulses of RH of 30 min duration each and values of 10%, 20%, 25%, 30%, 40%, 55%, 80%, and 100%. Each pulse is followed by a recovery phase with dry air (RH = 0%). Measurements (blue line and marker stars) are obtained with the cantilever sensor and the deposition of 35 μg of TiO2. Insets show the outputs of the model: inset 1—total adsorbed mass and inset 2—adsorbed mass in the individual layers. (b) The predicted calibration curve (red line) is obtained using the model of Equation (3) and pulses of RH of 30 min duration each and values of 1%, 2%, 5% 10%, 20%, 25%, 30%, and 40%. Each pulse is followed by a recovery phase with dry air (RH = 0%). Measurements (blue line and marker circles) are obtained with the QCM sensor and 10 μg of TiO2.
To conclude, the adsorbed water mass is linearly related to the mass of the deposited TiO2 as shown in Figure 13, since this latter is proportional to the total available TiO2 surface area.
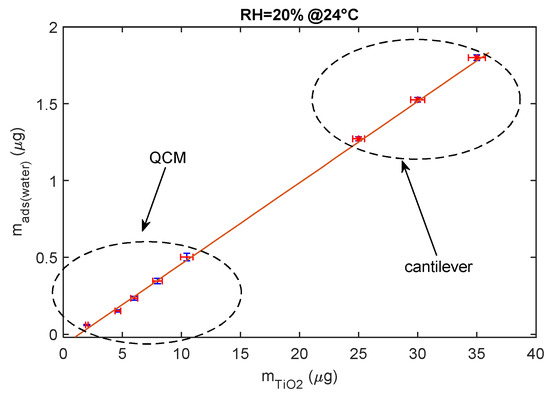
Figure 13.
Relationship between deposited TiO2 nanoparticle mass composing the sensing film and the mass of the adsorbed water (steady state) for RH = 20% at 24 °C.
The data shown in the previous figure were gathered using both mass sensing devices (QCM and cantilever). QCM data concern small masses of deposited TiO2. In fact, since in QCM sensors the deposition of the TiO2 affects both the inertial and elastic properties of the electromechanical resonator [11], there is an upper limit to the TiO2-deposited mass (around 12 μg) and to the mass of the adsorbed water, which ensures acceptable performance. On the other hand, to obtain acceptable resolutions with the cantilever sensor, a larger TiO2-deposited mass is needed (larger than 20 μg).
4.2. Impedance of the TiO2 Nanoparticle Film
In Figure 14 the comparison of the responses obtained by mass measurements and impedance measurements, in the same working conditions and the same measurement protocol is reported, the results confirm that different adsorption layers (first layer and subsequent layers) play a different role in determining the conductance of the TiO2 film. In Figure 15, the predicted adsorbed mass relative to the upper layers, for a transient from dry conditions to 25% RH, is shown together with the measured admittance module (at 100 Hz). With this RH level, a small quantity of condensed water is expected, therefore, the conductance could mainly depend on the presence of adsorbed molecular water in the upper layer and to proton hopping, as supported by the comparison of the admittance transient in the same conditions. Moreover, it is evident (observing the impedance for humidity levels beyond the 50% RH value in Figure 14) how condensed water seems responsible for the more relevant contribution to conduction.
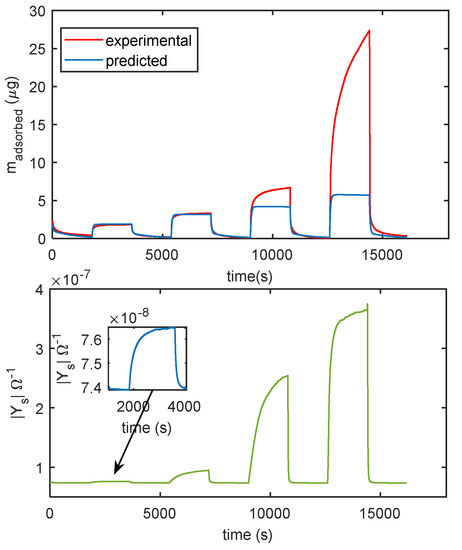
Figure 14.
Comparison of measurements obtained with the cantilever sensor and with the impedance sensor. The measurement protocol is the same described in Figure 11b. Upper plot: measured adsorbed mass (red line), adsorbed mass predicted by the model of Equation (3) (blue line). Lower plot: magnitude of the admittance of the film measured at 100 Hz.
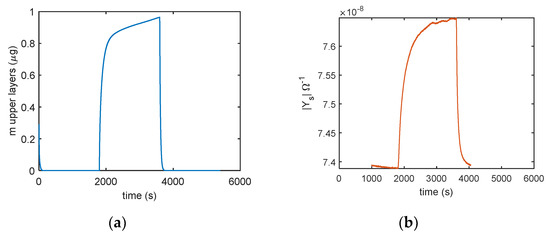
Figure 15.
Comparison of (a) predicted adsorbed mass in the upper layer (model in Equation (5)) and (b) the sensor admittance magnitude measured at 100 Hz using the following protocol: RH = 0% (30 min), RH = 25% (30 min), and RH = 0% (30 min).
The impedance behavior can be better studied by means of electrochemical impedance spectroscopy (EIS), by measuring and analyzing the complex impedance or admittance of the circuit as a function of frequency. In Figure 16, the impedance measurements at different RH levels, performed spanning the frequency range from 50 Hz to 80 kHz, are shown. Observing Figure 16a, which shows the curve produced by the impedance in the complex plan due to the frequency sweep, it is clear that at humidity higher than 50%, the TiO2 film electrical behavior suddenly changes, in accordance to the previous analysis. The figure presents the comparison of the impedance measurements corresponding to different RH values (as per legend) with the impedance of the equivalent circuit with the topology presented in Figure 5, whose parameters were obtained by a fitting procedure. These measurements clearly show the change of the behavior of the film occurring at high RH values, at low RH, the equivalent circuits is build up by two RC groups in series, with the RC group representing the electrode characterized by a time constant 2 order of magnitude smaller than the one characterizing the RC group representing the film. In all cases, a single RC group seems sufficient to represent the overall film behavior, with an acceptable accuracy showing that a single species is responsible for the conduction. Some of the estimated equivalent circuit parameter values, shown in Figure 16b, suggest that there is a dominant conduction mechanism in the RH range (10–60%) that could be proton hopping in physiosorbed water (as pointed out also by the previous analysis) and a different mechanism in the RH range (75–90%) that could be proton hopping in the condensed water. In these ranges, the capacitance CF grows with RH, whereas RF decreases [12]. In the high humidity range, CE was replaced by constant phase element with a small exponent. At RH = 70%, there is a very large growth of CF, and in the equivalent circuit, this capacitance has to be replaced by a phase constant element with a low exponent [24]. The parameter values obtained at RH = 70% show that the impedance spectrum has a peculiar behavior with respect to the other spectra. Around 70%, probably it is a mix of the two conduction mechanisms which play a relevant role. In fact, even if the simple model of Figure 5 is able to acceptably fit the experimental data concerning RH = 70%, the estimated equivalent circuit parameters (see Figure 16b) highlight that this spectrum has a very different behavior and assumes values not consistent with the trend shown by those obtained with the other measurements. Therefore, around RH = 70%, probably a more complex equivalent circuit would be needed.
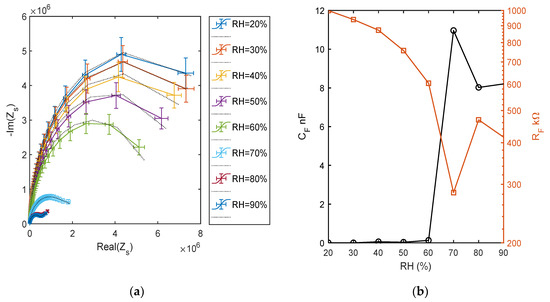
Figure 16.
(a) Impedance spectra in the range of 50 Hz–80 kHz at different and constant RH levels, impedance imaginary part versus real part. Colored lines: measured spectra (as per legend) and dotted black lines: equivalent model fitting. (b) Estimated parameters of the fitted equivalent circuits.
5. Conclusions
In this paper, the performance of different humidity sensors based on TiO2 nanoparticles is analyzed and correlated with the different chemical/physical phenomena contributing to their responses. In particular, it was shown that the sensors based on adsorbed water mass detection respond, due to multilayer adsorption on the nanoparticle surface, up to 40% RH, and in this RH range, their response is approximately linear. Furthermore, it is possible to observe that the resulting response time is mainly determined by the chemisorption of water molecule on the TiO2 surface, whereas the response magnitude in steady state condition is related to the contribution of a large number of physiosorbed layers. In this RH range, the response magnitude is linearly related to the mass of TiO2 nanoparticles used to produce the sensing film, since this latter determines the total TiO2 surface area. Monolayer adsorption is given by very low RH values (<1%). At RH values larger than 40%, the mass adsorbed by the sensors is in large part due to the water condensed in the nanopores between different particles; until at RH larger than 70%, this contribution is the very dominant part of the adsorbed mass. Presumably, the RH thresholds dividing the different regimes depend on the nanoparticle size. The used material has very small nanoparticles with measured maximum diameters of approximately 20 nm. Therefore, extremely small pores are expected, which favor the condensation of water even at relatively low RH value. It is expected that films obtained with larger particles will behave linearly up to higher values of RH.
RH impedance sensors are less linear than mass-detection based sensors due to the different conduction mechanisms occurring in the different adsorbed layers and due to the condensed water. In particular, the response of the sensor is very large at high RH. The different conduction mechanisms are elucidated thanks to impedance spectrum analysis. This analysis allowed for determining that, at RH larger than 70%, the presence of condensed water changes the electric behavior of the sensor leading to small values of the equivalent sensor resistance and large values of the equivalent capacitance of the sensor.
Finally, the possible degradation of both sensor types related to prolonged exposition to high RH must be further studied.
Author Contributions
Conceptualization, A.F. and V.V.; methodology, M.M.; validation, A.F. and E.P.; formal analysis, A.F. and V.V.; investigation, A.F., E.P. and I.C.; data curation, A.F. and A.L.G.; writing—original draft preparation, A.F., E.P.; writing—review and editing, V.V., A.L.G. and I.C.; visualization, M.M. All authors have read and agreed to the published version of the manuscript.
Funding
This research received no external funding.
Conflicts of Interest
The authors declare no conflict of interest.
References
- Cambra, C.; Sendra, S.; Lloret, J.; Garcia, L. An IoT service-oriented system for agriculture monitoring. In Proceedings of the 2017 IEEE International Conference on Communications (ICC), Paris, France, 21–25 May 2017; pp. 1–6. [Google Scholar]
- Zhou, S.; Deng, F.; Yu, L.; Li, B.; Wu, X.; Yin, B. A Novel Passive Wireless Sensor for Concrete Humidity Monitoring. Sensors 2016, 16, 1535. [Google Scholar] [CrossRef]
- Al-Hamry, A.; Panzardi, E.; Mugnaini, M.; Kanoun, O. Health Monitoring of Human Breathing by Graphene Oxide Based Sensors. In Proceedings of the Sensors and Measuring Systems; 19th ITG/GMA-Symposium, Nuremberg, Germany, 26–27 June 2018; pp. 185–188. [Google Scholar]
- Faia, P.M.; Furtado, C.S.; Ferreira, A.J. Humidity sensing properties of a thick-film titania prepared by a slow spinning process. Sens. Actuators B Chem. 2004, 101, 183–190. [Google Scholar]
- Lensch, H.; Doerr, J.; Schutze, A.; Sauerwald, T. Selective high temperature humidity sensing using fast impedance spectroscopy on Titania sensors. Sens. Actuators B Chem. 2020, 321, 128497. [Google Scholar] [CrossRef]
- Ghadiry, M.; Gholami, M.; Kong, L.C.; Yi, C.W.; Ahmad, H.; Alias, Y. Nano-Anatase TiO2 for High Performance Optical Humidity Sensing on Chip. Sensors 2016, 16, 39. [Google Scholar] [CrossRef]
- Pomoni, K.; Vomvas, A.; Trapalis, C. Electrical conductivity and photoconductivity studies of TiO2 sol–gel thin films and the effect of N-doping. J. Non-Cryst. Solids 2008, 354, 4448–4457. [Google Scholar] [CrossRef]
- Cedillo-González, E.I.; Mugoni, C.; Montorsi, M.; Siligardi, C. Evaluation of the correlations between temperature, humidity, incident UV light and the photocatalytic activity of TiO2 films using a rationale approach. Appl. Surf. Sci. 2016, 378, 73–79. [Google Scholar] [CrossRef]
- Ciani, L.; Farina, A.; Catelani, M.; Pacini, L.; Baldi, A.; Calastrini, S.; Carnevale, E.; Bruzzi, M.; Signorini, L. Self-cleaning of Si photovoltaic modules by a nanostructured TiO2 spray-coating. In Proceedings of the 2017 IEEE International Instrumentation and Measurement Technology Conference (I2MTC), Turin, Italy, 22–25 May 2017; pp. 1–5. [Google Scholar]
- Fort, A.; Panzardi, E.; Vignoli, V.; Landi, E.; Trigona, C.; Mugnaini, M. Performance Analysis of a Humidity Sensor based on a micro-resonator functionalized with TiO2 nanoparticles. IEEE Trans. Instrum. Meas. 2020, 69, 7999–8008. [Google Scholar]
- Addabbo, T.; Fort, A.; Mugnaini, M.; Vignoli, V.; Baldi, A.; Bruzzi, M. Quartz-Crystal Microbalance Gas Sensors Based on TiO2 Nanoparticles. IEEE Trans. Instrum. Meas. 2018, 67, 722–730. [Google Scholar] [CrossRef]
- Cappelli, I.; Fort, A.; Mugnaini, M.; Panzardi, E.; Pozzebon, A.; Tani, M.; Vignoli, V. Battery-less HF RFID sensor tag for humidity measurements based on TiO2 nanoparticles. In 2020—International Instrumentation and Measurement Technology Conference (I2MTC); IEEE: Dubrovnik, Croatia, 2020. [Google Scholar]
- Faia, P.M.; Ferreira, A.; Furtado, C. Establishing and interpreting an electrical circuit representing a TiO2–WO3 series of humidity thick film sensors. Sens. Actuators B Chem. 2009, 140, 128–133. [Google Scholar] [CrossRef]
- Benkoula, S.; Sublemontier, O.; Patanen, M.; Nicolas, C.; Sirotti, F.; Naitabdi, A.; Gaie-Levrel, F.; Antonsson, E.; Aureau, D.; Ouf, F.-X.; et al. Water adsorption on TiO2 surfaces probed by soft X-ray spectroscopies: Bulk materials vs. isolated nanoparticles. Sci. Rep. 2015, 5, 15088. [Google Scholar] [CrossRef]
- Maier, K.; Helwig, A.; Müller, J.G.; Hille, P.; Eickhoff, M. Effect of Water Vapor and Surface Morphology on the Low Temperature Response of Metal Oxide Semiconductor Gas Sensors. Materials 2015, 8, 6570–6588. [Google Scholar] [CrossRef] [PubMed]
- Scheufele, F.B.; Módenes, A.N.; Borba, C.E.; Ribeiro, C.; Espinoza-Quiñones, F.R.; Bergamasco, R.; Pereira, N.C. Monolayer–multilayer adsorption phenomenological model: Kinetics, equilibrium and thermodynamics. Chem. Eng. J. 2016, 284, 1328–1341. [Google Scholar] [CrossRef]
- Brunauer, S.; Emmett, P.H.; Teller, E. Adsorption of Gases in Multimolecular Layers. J. Am. Chem. Soc. 1938, 60, 309–319. [Google Scholar] [CrossRef]
- Shirai, K.; Sugimoto, T.; Watanabe, K.; Haruta, M.; Kurata, H.; Matsumoto, Y. Effect of Water Adsorption on Carrier Trapping Dynamics at the Surface of Anatase TiO2 Nanoparticles. Nano Lett. 2016, 16, 1323–1327. [Google Scholar] [CrossRef]
- Shiraiwa, M.; Pfrang, C.; Koop, T.; Pöschl, U. Kinetic multi-layer model of gas-particle interactions in aerosols and clouds (KM-GAP): Linking condensation, evaporation and chemical reactions of organics, oxidants and water. Atmos. Chem. Phys. Discuss. 2012, 12, 2777–2794. [Google Scholar] [CrossRef]
- Tai, W.-P.; Kim, J.-G.; Oh, J.-H. Humidity sensitive properties of nanostructured Al-doped ZnO:TiO2 thin films. Sens. Actuators B Chem. 2003, 96, 477–481. [Google Scholar] [CrossRef]
- Torún, B.; Kunze, C.; Zhang, C.; Kuhne, T.D.; Grundmeier, G. Study of water adsorption and capillary bridge formation for SiO2 nanoparticle layers by means of a combined in situ FT-IR reflection spectroscopy and QCM-D set-up. Phys. Chem. Chem. Phys. 2014, 16, 7377–7384. [Google Scholar] [CrossRef]
- Biju, K.P.; Jain, M.K. Sol–gel derived TiO2:ZrO2 multilayer thin films for humidity sensing application. Sens. Actuators B Chem. 2008, 128, 407–413. [Google Scholar] [CrossRef]
- Zhang, M.; Wei, S.; Ren, W.; Wu, R. Development of High Sensitivity Humidity Sensor Based on Gray TiO₂/SrTiO₃ Composite. Sensors 2017, 17, 1310. [Google Scholar] [CrossRef]
- Geng, W.; Yuan, Q.; Jiang, X.; Tu, J.; Duan, L.; Gu, J.; Zhang, Q. Humidity sensing mechanism of mesoporous MgO/KCl–SiO2 composites analyzed by complex impedance spectra and bode diagrams. Sens. Actuators B Chem. 2012, 174, 513–520. [Google Scholar] [CrossRef]
- Fort, A.; Panzardi, E.; Vignoli, V.; Landi, E.; Mugnaini, M.; Carlo, T. Performance Analysis of an AlN Humidity Sensor based on TiO2 nanoparticles. In Proceedings of the 2019 IEEE International Symposium on Measurements & Networking (M&N), Catania, Italy, 8–10 July 2019; pp. 1–5. [Google Scholar]
- Fort, A.; Trigona, C.; Panzardi, E.; Vignoli, V.; Addabbo, T.; Mugnaini, M. An AlN Micromachined Mass Sensor: Modeling and Characterization. IEEE Trans. Instrum. Meas. 2020, 1. [Google Scholar] [CrossRef]
- Du, B.; König, A.M.; Johannsmann, D. On the role of capillary instabilities in the sandcastle effect. New J. Phys. 2008, 10, 053014. [Google Scholar] [CrossRef]
- Dybwad, G.L. A sensitive new method for the determination of adhesive bonding between a particle and a substrate. J. Appl. Phys. 1985, 58, 2789–2790. [Google Scholar] [CrossRef]


© 2020 by the authors. Licensee MDPI, Basel, Switzerland. This article is an open access article distributed under the terms and conditions of the Creative Commons Attribution (CC BY) license (http://creativecommons.org/licenses/by/4.0/).