Article

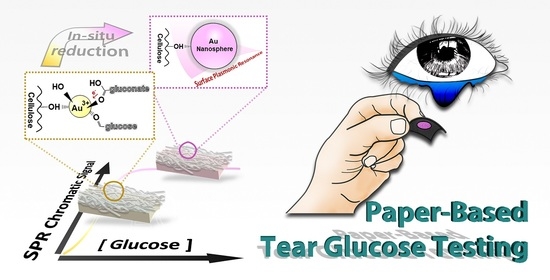
Rationalization of In-Situ Synthesized Plasmonic Paper for Colorimetric Detection of Glucose in Ocular Fluids

1
Department of Optometry, Seoul National University of Science and Technology, 232 Gongneung-ro, Nowon-gu, Seoul 01811, Korea
2
Convergence Institute of Biomaterials and Bioengineering, Seoul National University of Science and Technology, 232 Gongneung-ro, Nowon-gu, Seoul 01811, Korea
*
Author to whom correspondence should be addressed.
Chemosensors 2020, 8(3), 81; https://doi.org/10.3390/chemosensors8030081
Submission received: 15 July 2020 / Revised: 18 August 2020 / Accepted: 27 August 2020 / Published: 1 September 2020
(This article belongs to the Section Optical Chemical Sensors)

Abstract

:
Tear glucose is an intriguing biofluid that includes potential biomarkers. While many sensors have emerged nowadays, there is still demand for advanced sensors with nonenzymatic, simple, cost-effective sensing mechanism. Herein, we present a paper-based colorimetric assay by utilizing a gold nanoparticle formation. Experimental characterization substantiated a mechanism in this in situ reduction. Scanning electron microscopy, UV-visible spectrometry, etc. were involved in the scrutiny. As a result, we reached for the rationale whereas the particle formation can be utilized for a glucose sensing using tears. This paper-based detection was insusceptible to physiological tear matrix, i.e., chloride ion effect, false-positive error and synergistic effect by antioxidants. In addition, we evaluated its analytical performance in an artificial tear assay. Of the obtained a linear regressions, the concentration range corresponded to the physiological or pathologic reference range. In addition, within the low-concentration range, a high correlation was resulted 0.965. Furthermore, we investigated statistical validation by employing the Bland–Altman plot. In the end sections of this paper, we denoted its ready-to-use merits by simplicity—as well as the further application of our plasmonic paper.

Graphical Abstract

1. Introduction

New types of sensors have emerged, each time along with additional biomedical demands and evolving sensor materials, from Clark electrodes [1] to noble-metal nanomaterials.
Paper-based nanocomposite is the latest functional material of unique merits, in brief, low cost, porosity, and disposability are the inherent advantages that this raw material provides [2,3]. Beyond these, more potentials have appeared in diverse applications such as antibacterial sheet [4], energy-harvesting platform [5] and highly efficient catalyst [6]. Meanwhile, the first investigation on cellulose–metal nanocomposite was reported in 1984 [7] for surface-enhanced Raman scattering (SERS) sensing research as we are best known. Almost two decades ago, four species of metal nanoparticles were synthesized on paper celluloses, and their morphologic characteristics and colloidal behaviors between cellulose fibers and the nanoparticles were scrutinized [8]. Since that, this hybrid material has gained notices by scholars in the current days [9].
In nanoplasmonic sensor research, this hybrid material is unique. Since first synthesized by Faraday in 1857 [10], plasmonic nanoparticles (standing for similar or less size of particle than the wavelength of light [11]) and its surface plasmon resonance (SPR) phenomenon had been long studied. As the morphological factors delicately affects the flows of electromagnetic energy, it showed profound potentials in analytical chemistry realm [12]. Majorly, simple colorimetric sensing is founded on its powerful chromatic property. Lateral flow assay strip is the best example of this [13]. In addition, gold nanoparticles altered the role of chromogenic substrates (e.g., 3,3′,5,5′-tetramethylbenzidine) in enzyme-linked immunosorbent assay [14,15]. More than any other topic, the SERS sensor is the most popular in the area of surface plasmonic resonance (SPR) [16]. Among paper-based SERS sensors, the advantages are diverse, including cost-effectivity, disposability, autoflow by capillary force, so on. Investigators have improved the plasmonic paper through a number of ways within the very recent days [17,18,19].
Meanwhile, as a simple method, the reducing power assay shows another applications as of nanoplasmonic sensors. Since most noble metal nanoparticles are distinguishable even at of tiny size, the small amounts of antioxidants can be detected by the SPR colorimetry. Herein, we in-situ synthesized gold nanoparticles on filter paper. Though there is a similar approach to doing this, the reported works either quantified a total reducing power of a sample like tea and juice (dissolving a variety of antioxidants [20,21]) or using an enzyme to specify an analyte (i.e., glucose oxidase [22]).
To rationalize this sensing mechanism, we considered the importance of analyte targeting. We chose tear glucose, that has a high correlation with blood glucose level [23]. Because of its merit—as well as the possibility for invasive diagnosis and colorimetric analysis (due to its transparency)—tear-based glucose sensing has received attention from both academia [24,25,26] and industry (e.g., Google smart contact lens [27]). However, many works relied on enzymatic reactions, thus, perhaps inevitably confronted turning toward the development of non-enzymatic sensors [28]. Back to tear chemistry, this body fluid contains various factors including glucose, some antioxidants, protein and glycolipids, so that the components are released from more than three different ways, e.g., meibomian, lacrimal gland and conjunctival vessel [29]. Among them, so as we projected, tear glucose is the dominant biomarker which can be applied to reducing power assay.
In this study, we describe the in-situ synthesis of gold nanospheres in a paper matrix and its sensing application. Working on its chromatic properties, we characterize its nucleation and growth behavior. Next, we apply this mechanism to glucose detection. An optimization, matrix effect assessment, and artificial tear assay are described. Lastly, our plasmonic colorimetric sensor was validated in a statistical method.

2. Materials and Methods

2.1. Chemicals and Materials

Gold (III) chloride, D-glucose, ascorbic acid, uric acid and bovine serum albumin were provided from Sigma Aldrich, Inc. (St. Louis, MO, USA). Sodium chloride, sodium hydroxide, calcium chloride and potassium chloride were purchased from Dajung Chemical, Inc. (Gyeonggi-do, Korea). Whatman quantitative filter paper No. 595 (GE Healthcare, Inc., Chicago, IL, USA) was used for the paper platform.

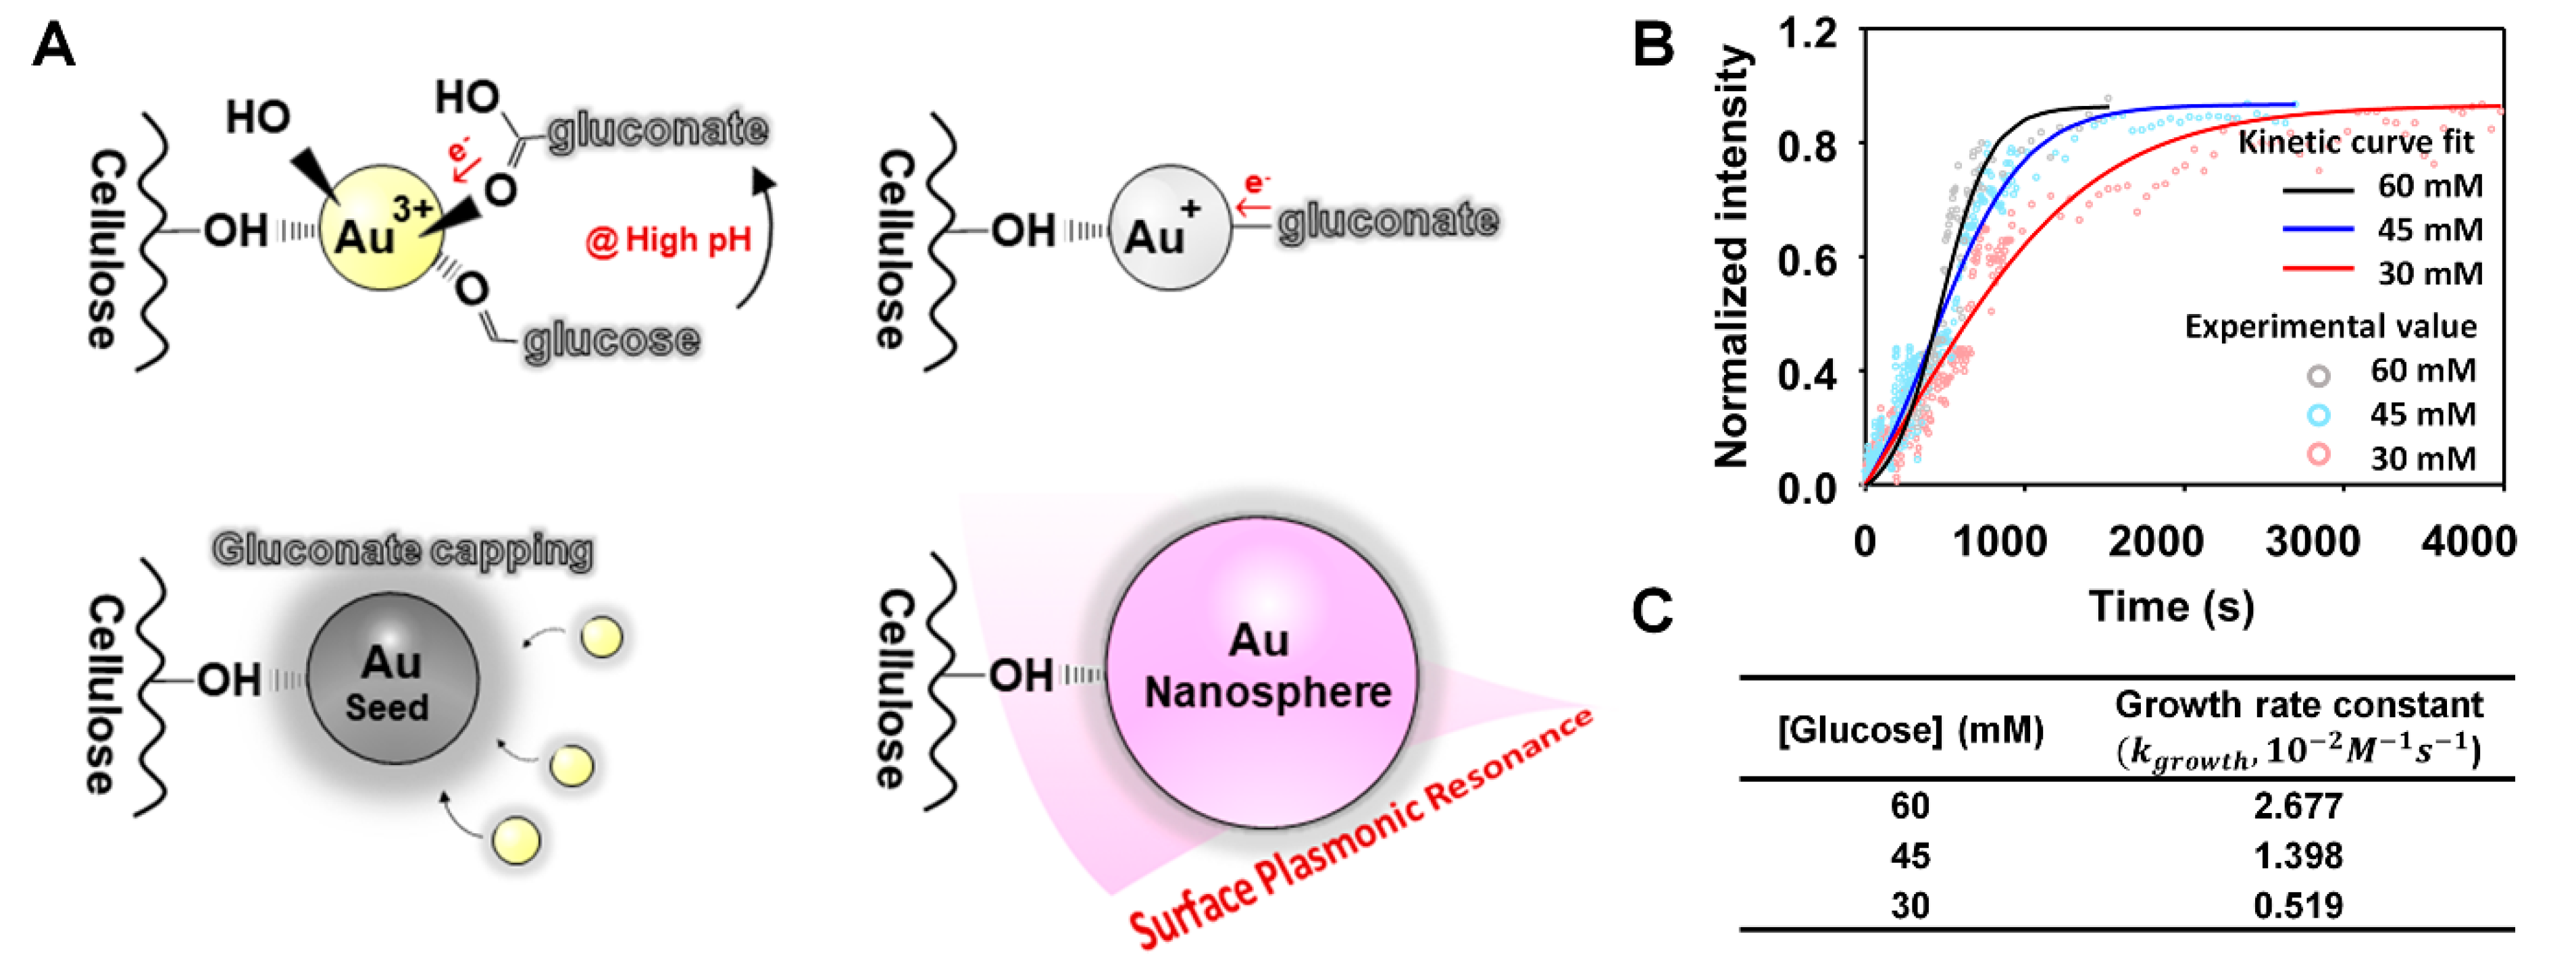
2.2. In-Situ Synthesis of Gold Nanospheres on Paper Platform

To specify an area for the synthesis, we employed a wax-printing technique [30]. Briefly, we designed a 96-well microplate with 2-mm-diameter circles and baked the printed sheet on a hotplate at 120 °C for 30 s. As the paper material was very thin, the hydrophobic microwells were almost completed in such a short time.
This in-situ reduction is the simplest that can be performed with only three drops and drying. The synthesis was done in the following major three steps:
  • 2 mM of gold (III) chloride aqueous solution (5 μL) was dropped on a hydrophilic circle and dried;
  • Glucose-spiked solution or artificial tear sample (5 μL) was taken and likewise dried on the reaction zone;
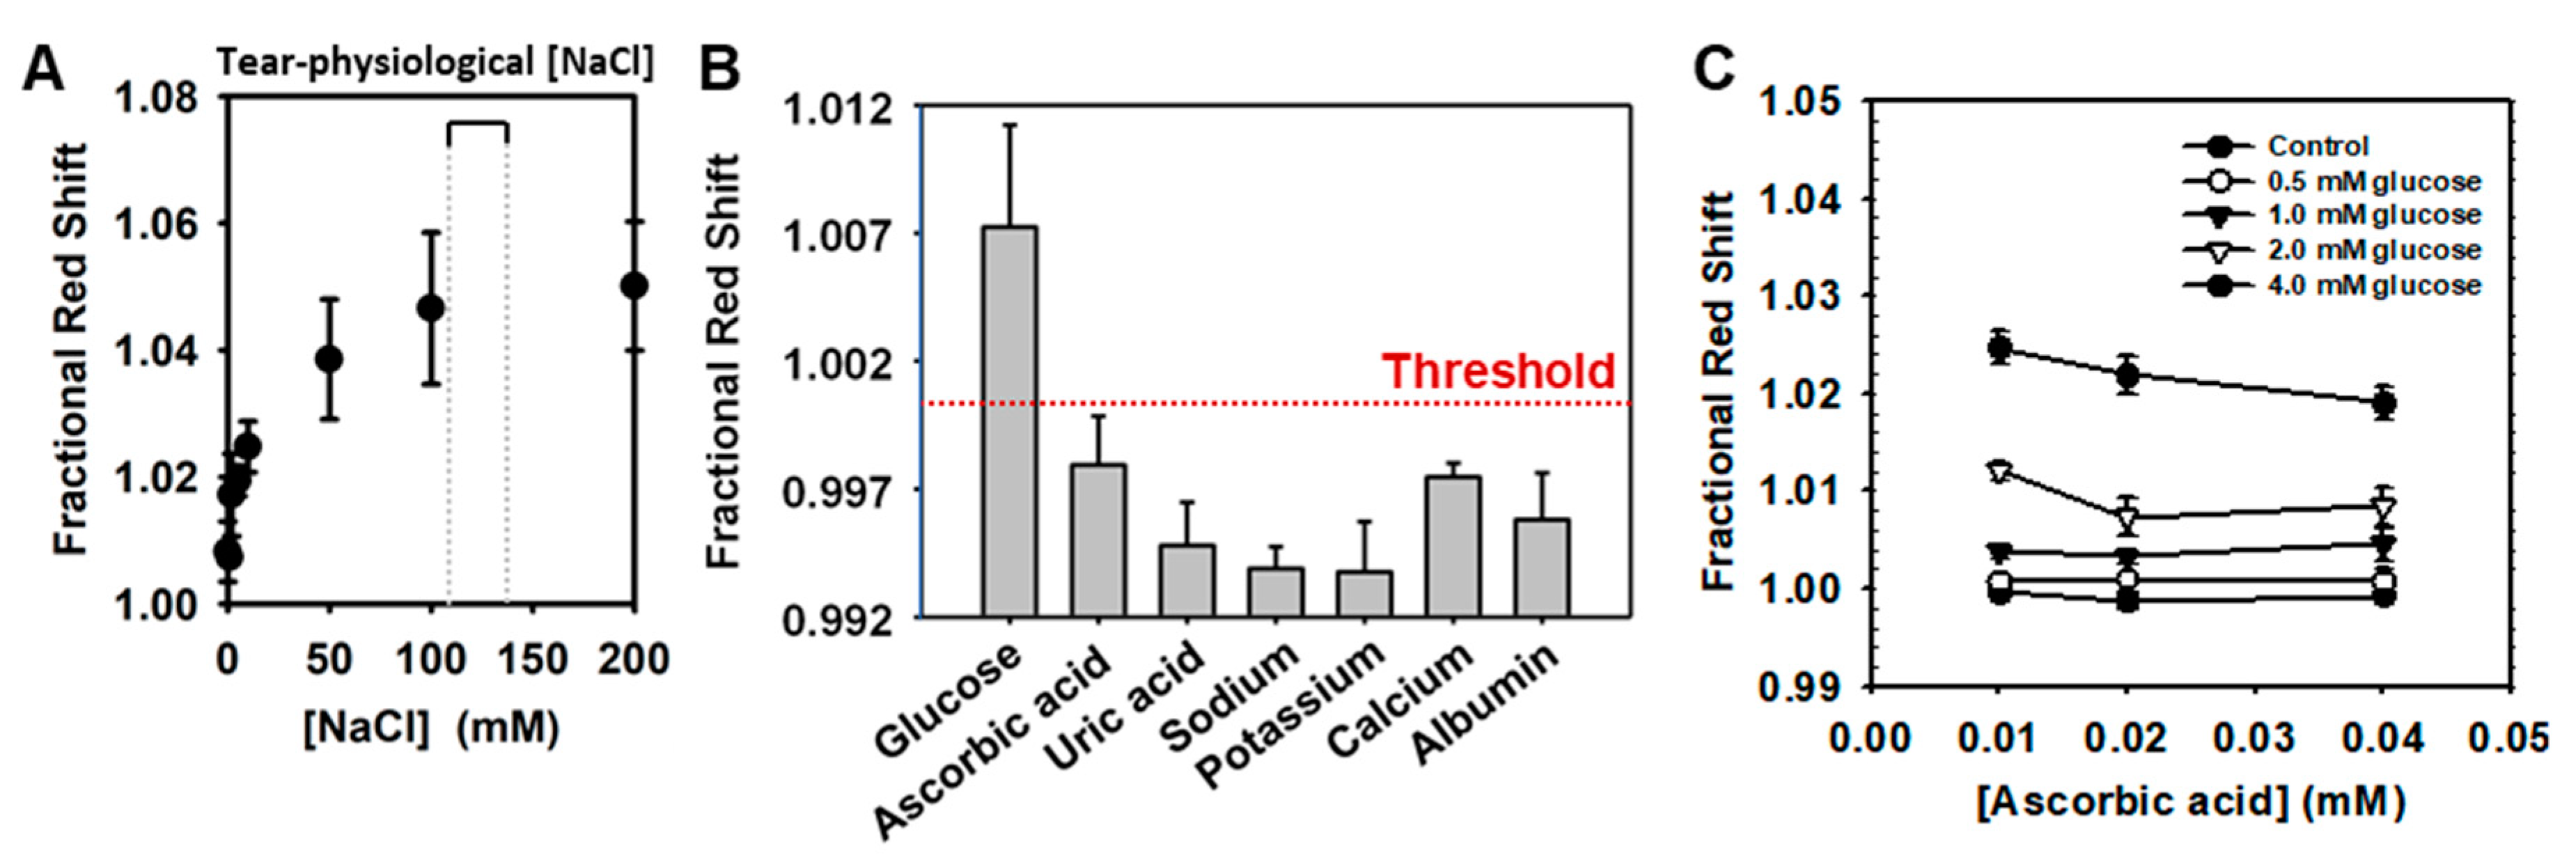
  • An initiator composing of sodium hydroxide (60 mM) and sodium chloride (200 mM and then titrated by 2-folded dilution) was applied to initialize the reaction.
At each step, a reagent droplet was dried around 20 min in the ambient condition. For the artificial tear assay, physiological tear composition was mimicked by dissolving the following major matrix components: 0–14 mM of glucose, 10–40 μM [31] of ascorbic acid and 20 μg/mL of albumin [32].

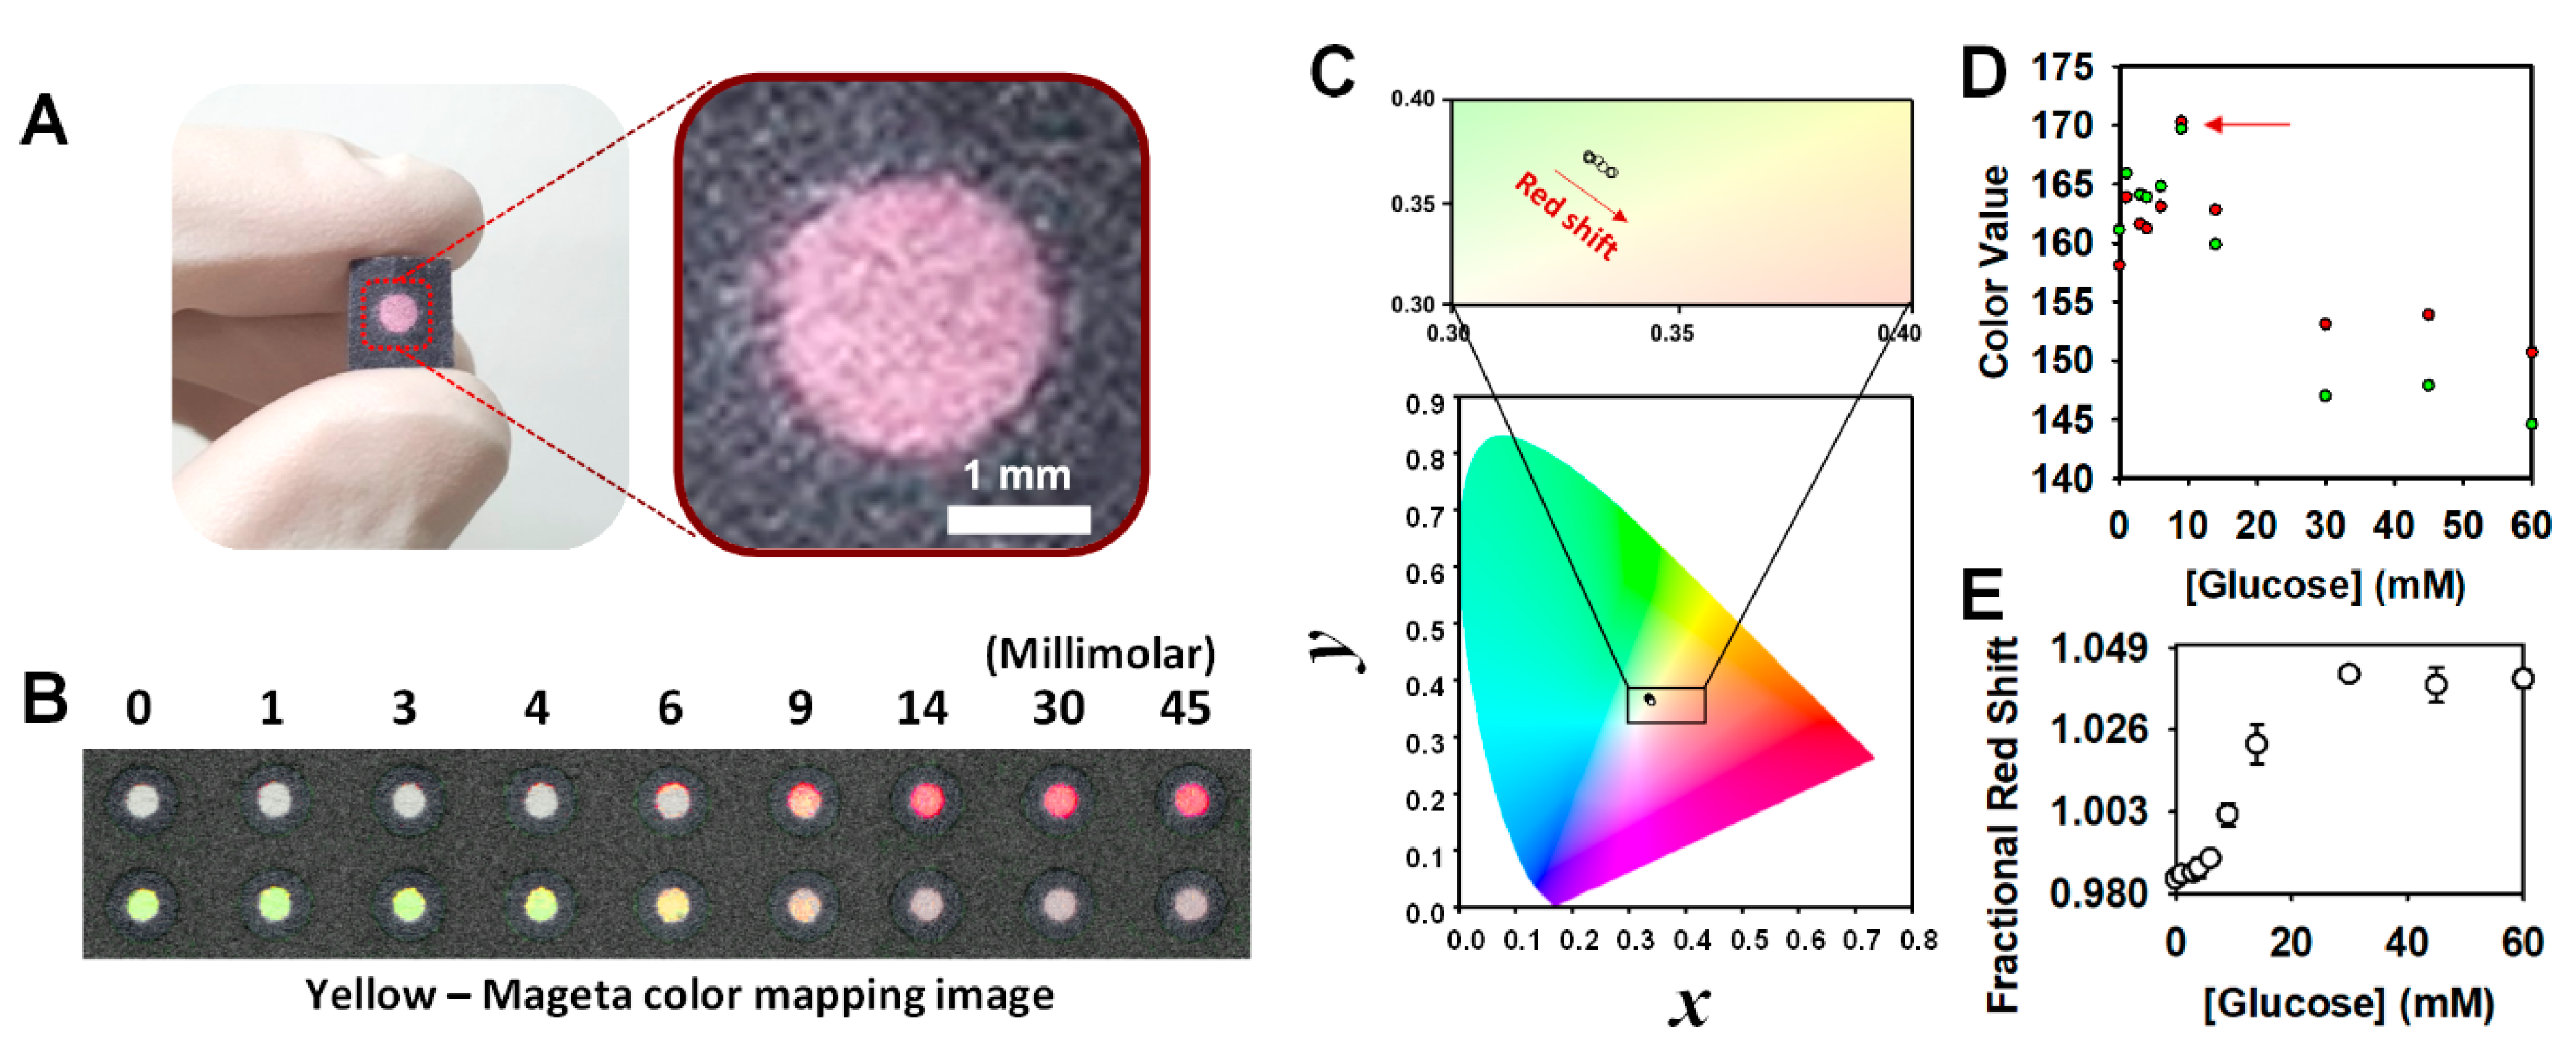
2.3. Chromatic Characterization and Colorimetric Assay

The synthesized nanocomposite was photographed as of a high-resolution image by using a scanner (1200 dpi). The image data were transformed to GIMP 2.8 (The GIMP Team) to perform CMYK mapping and RGB profiling. Among each color channel, magenta and yellow channels were extracted, enhanced and then overlayered on the original image. RGB channels were converted into CIE 1931 space value and our colorimetric index, “fractional red shift” as we called. The colorimetric formula is as the following:
P(i, j) = R(i, j)/G(i, j)
Fractional red shift = {∑ij P(i, j)}/M
where, P(i, j) is a fractional red value to green of a pixel, respectively corresponding to R(i, j) and G(i, j) and M is the number of pixels selected. The CIE conversion was adapted with sRGB and D55, respectively for the RGB model and reference white value. Kinetic study was performed through video recording by a smartphone camera (Pocophone, Xiaomi, 4K 60 FPS) distanced 10 cm from samples with an ambient light. Then we obtained the RGB profiles of each reaction zone at the interval of 5 deciseconds with using Adobe Photoshop CS4 (Adobe, Inc., San Jose, CA, USA) and the same colorimetric formula. Before fitting the image sequential data to the curves, the plots were smoothed by exponential smoothing (α = 0.5). For the chloride ion effect test, 10-mM of glucose-spiked samples were used for obvious color exhibition, so that we could validate the availability of ionic matrices in tears. In the selectivity test, aqueous solutions including glucose (2 mM), ascorbic acid (20 μM), sodium chloride (150 mM), potassium chloride (20 mM), calcium chloride (0.5 mM), uric acid (3 mM) and albumin (20 μg/mL), respectively. We qualified a value above 1.000 into false positive in cases of the glucose-negative samples. In the synergetic effect test, five specimen were prepared whereas the control included ascorbic acids only without glucose and the others with glucose.

2.4. Microscopy and Morphologic Analysis

Scanning electron microscopy (SEM) and optical microscopy (OM) were involved for the surface characterization. Back scattering electron imaging was obtained by using high-resolution SEM (Hitachi-SU800, Hitachi, Inc., Tokyo, Japan). With the images, size distributions of the gold spheres were measured by KLONK (KLONK, Inc., USA). The total counts of the histograms met more than fifty.

2.5. UV-vis Spectrometry

To gain UV-vis spectra, we utilized wipes paper for lenses (ZEISS, Inc., Oberkochen, Germany) as a thin cellulose sheet (9.20 ± 0.72 μm; measure by SaluTron D1; SaluTron, Inc., Frechen, Germany). After performing the same protocol on the thin sheet, we took its spectra in wet state (NEO-S490, NEOGEN, Inc., Seoul, Korea). Size determination of the gold nanosphere followed the literature [33].

2.6. Statistics

All statistical analyses were along with five replicates. SigmaPlot 8.0 (Systat Software, Inc., San Jose, CA, USA) and Excel 2020 (Microsoft, Inc., Redmond, WA, USA) used to fit experimental data to engaged theoretical curves (Boltzmann sigmoid function [34] and Finky and Watzky model [35]) and to calculate correlation coefficient and limit of detection (LoD; 3.3× standard deviation/Slope of the calibration curve of the colorimetric values). A linear phase of the Boltzmann sigmoid curve was approximated by its piece-wise function the inflection point and the maximal plateau line [36]. The linear phase had a high correlation coefficient (R2 > 0.99) with the experimental data in that concentration range. Pearson’s coefficient was calculated by SPSS (IBM, Inc., Armonk, NY, USA).

3. Results and Discussion

3.1. Determination of In Situ Synthesis of Gold Nanospheres on Paper Cellulose

3.1.1. Chromatic Property and Theoretical Assumption

The prepared plasmonic paper appeared pink and insignificant coffee ring effect (Figure 1A). It implies, in our assumption, gold nanospheres were synthesized directly with keeping a bond between cellulose molecules and gold (III) ions. Otherwise, metal nanoparticles capped by organic reagents generally exhibit the coffee ring phenomenon by Marangoni flow [37]. Meanwhile, according to the reductant concentrations, its chromatic intensity had diminished in yellow while shifting to the reddish (Figure 1B). We denoted there was an interval. It indicates the intermediate form in the middle of the reaction. On our hypothesis, it was because of either colorlessness of gold (I) ion [38] or low SPR effect of gold seed [39].
In the glucose assay, we readily observed a red shift by glucose concentrations with naked eyes. To further scrutinize, we profiled the RGB channels from each reaction zone. The results corresponded to the CMYK mapping image (Figure 1B). In addition, analyzed in CIE 1931 color space, the plots moved from green to yellow and reached the red region (Figure 1C). In the RGB colorimetric analysis, the difference between R and G values varied by the glucose concentration (Figure 1D).
We devised a simple fractional colorimetric formula (see Materials and Methods), in which the fractional rate among the channels is increased. As shown in Figure 1E, it appeared of a refined sigmoidal curve, which likewise implies the existence of an intermediate product. Notably, despite the high concentration of the reductant, it was not blue-shifted indicating insignificant growth of the particles.

3.1.2. Characterization of In Situ Synthesized Gold Nanospheres

When we imagine the previous experiment in the nano dimension, we can conclude the following ideas. The reducing sugar transforms gold ions to nanospheres anchored on paper celluloses. When becoming large enough the SPR phenomenon makes the particles look pink without a hue change (pink to blue was not detected). Consequently, the addition of glucoses means of reducing power—as well as a capping effect to the particles—which stabilizes the colloidality and producing an increasing number of the nanospheres (Figure 2A–C).
To characterize size distributions of those small nanoparticles and estimate their morphology, we took SEM images of the samples (Figure 2D–G). Small nanospheres evenly dispersed on the cellulose surface were imaged. In addition, the number of particles increased as the glucose concentration increased. In the mean time, the nanospheres had insignificant shift in diameter which staying around 50 nm as shown in each inset image. Thus, it is entirely sensible that the gold nanosphere has so stable size distribution apart from reductant concentration. This result affirmed the role of glucose as both a reductant and capping agent [40]. Moreover, cellulose molecules also trigger capping effect by preventing an aggregation of the nanoparticles. Additionally, UV-visible spectra supported this thesis (Figure S1), when using higher concentration of glucose (provided with glucose ranging from 15 to 90 mM, there was no significant SPR peak shift).

3.1.3. Projected Mechanism

On the basis of the experiments and the literature, we projected a synthesis mechanism on the plasmonic paper (Figure 3A). First, a gold (III) ion occupies a site of cellulose by displacing its one of four ligands; the ligands can be altered with surrounding factors (hydroxide, glucose and even with water [38]). Likewise, gold (III) ion takes open-chain glucose that transformed from a sugar ring by hydroxide ions [41,42]. Then, when initialized by hydroxide ions of high concentration, the glucose molecule reduces the gold (III) into gold (I) ions. As the rate of gold (III) to gold (I) is high, it can be assumed the initial concentration of gold(I) ions is equal to the initial concentration of gold(III) ions [38,40]. The gold (I) ion is likewise reduced in the same way. While immediately transforming to gluconate, it caps the gold seed. This reaction so far described were as following two parallel chemical reaction [40]:
A u + + C 6 H 12 O 6 k s e e d A u 0 + p r o d u c t s
A u + + C 6 H 12 O 6 + A u 0 k g r o w t h 2 A u 0 + p r o d u c t s
Since the gold seed is anchored on to the polar or ionic groups of the celluloses, it rarely aggregates with another. Rather, the growth was promoted by autocatalytic growth or extra reduction by glucose on the gold surface. Finally, when forming as the gold nanospheres, the plasmonic paper appears pink by SPR effect.
For further characterization, we obtained the previous three sigmoidal curves having upper plateau (at the reductant condition of 30, 45 and 60 mM, as shown in Figure 1E). Herewith, two criteria for the kinetic theory by Finke and Watzky [35]: (1) all metal ions are reduced and (2) aggregation rarely occurs. This model was derived into a kinetic equation, where slow seeding rate and dominantly fast growth rate were determined by time (t) and initial concentration of gold ion (C0) [40]:
C A u = k s e e d / k g r o w t h [ e   ( k s e e d + k g r o w t h C 0 ) t 1 ] 1 + k s e e d / ( k g r o w t h C 0 )   e   ( k s e e d + k g r o w t h C 0 t )
where kseed and kgrowth stand for seeding and growth rate constant, respectively.
As shown in Figure 3B, the kinetic curves fit the experimental data with a high correlation (R2, more than 0.97). Since the excessive glucose concentration can be subtracted by 30 mM, its total growth rate constant was identified to the autocatalytic growth rate of the gold nanosphere. That is, the total growth rate (kgrowth) is the sum of those by gold-mediated autocatalytic activity (kcatalytic) and by excessive reductant (kglucose), thus, the observed rate constant by the excessive reductant (kobs,glucose) can be calculated 0.693 as follows:
kglucose = 0.693 [Cexcessive glucose]

3.2. Tear Glucose Sensing

3.2.1. Matrix Components of Tears

Upon this in situ synthesis mechanics of the gold nanosphere on paper cellulose, we had dived into its sensing application. Within this work, rationalization in targeting analyte was done preliminarily.
Tear has matrix components like other body fluids. Our first investigation dealing with it was the effect of chloride. Gold nanoparticles—like most other metal nanoparticles—have a susceptibility to ion effect [43]. In particular, one species of halogen ions, chloride is contained sufficiently in tears (from 106 to 138 mM [29]). As tear chlorides can act as a kosmotropic ion, we must assess the availability of our sensing mechanism with chloride-spiked samples. As shown in Figure 4A, the plateau was over 100 mM and more, while the concentration of physiological tear chloride ranged in the middle of it.
In addition to the ion effect, there were diverse components that can affect the colorimetry. The most critical one may be antioxidants such as uric acid and ascorbic acid, which have been found in tears in concentrations as high as 23 ± 9.6 and 68 ± 46 μM [31], respectively. Figure 4B demonstrates the result of the false-positive test. Though some factors seemed to make the gold ions reduced, it was not over the threshold exhibiting pink coloration (fractional red shift = 1.000). However, since it can provide a synergistic effect along with tear glucose, we further affirmed by the ascorbic acid assay with spiking glucose. As shown in Figure 4C, the colorimetric values increased according to the glucose concentrations, however, there was an insignificant variation by the increasing concentration of ascorbic acid. Pearson coefficient was calculated −0.104, which implies no synergistic effect on the glucose-mediated reduction. Thus, we were led to the conclusion that our in situ synthesis can be effectively utilized for the tear glucose sensing.

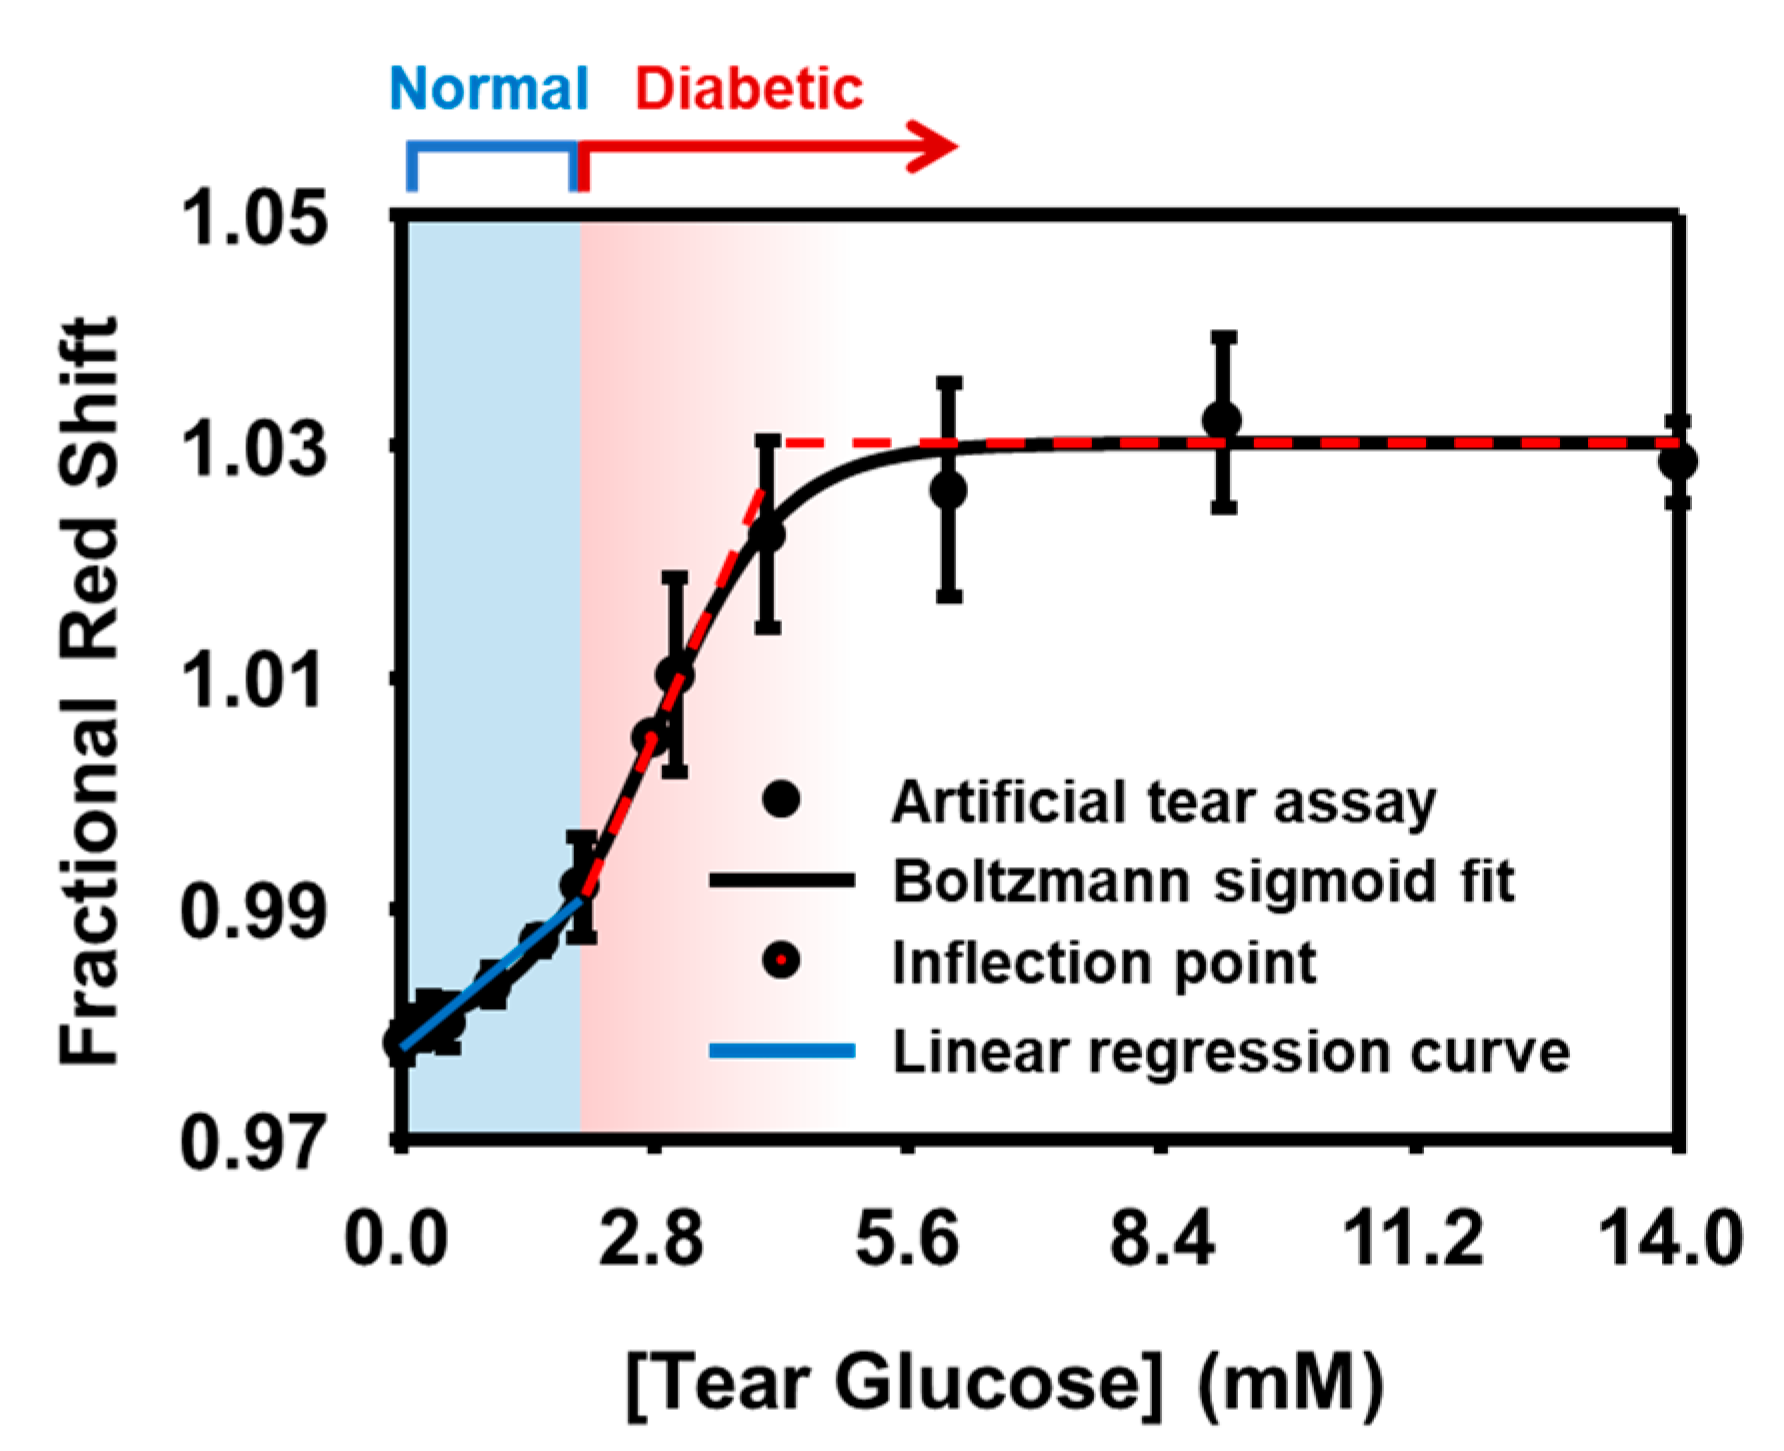
3.2.2. Artificial Tear Assay

Artificial tear fluids were prepared with main candidates (ascorbic acid [31] and albumin) possibly cross-reacting with the synthesis; albumin (20 μg/mL in tears [32]) was reported to reduce metal ions when adjusted at a specific pH [44].
Figure 5 shows three linear stages within the different concentration ranges. Notably, each linear regression corresponded to the physiological and pathologic concentration range of the normal and diabetic patients [24,45]. In particular, the regression within the normal and diabetic range demonstrated a high correlation coefficient (0.97 and 0.99, respectively shown in Table 1). Meanwhile, a lower correlation was obtained at the severe diabetic range, though, it can fully deal with a qualitative diagnosis for severe diabetic patients. As for the suspected or normal, this tear glucose sensor provided LoD of 0.29 mM which meets the criteria for self-monitoring of blood glucose (SMBG) [46]. However, one finding issued needs for calibration or customization. Though this sensor showed a great performance, the maximum colorimetric value was lowered than the glucose-spiked aqueous solution. We regarded this from the capping effect by albumins and confirmed the demand for calibration.

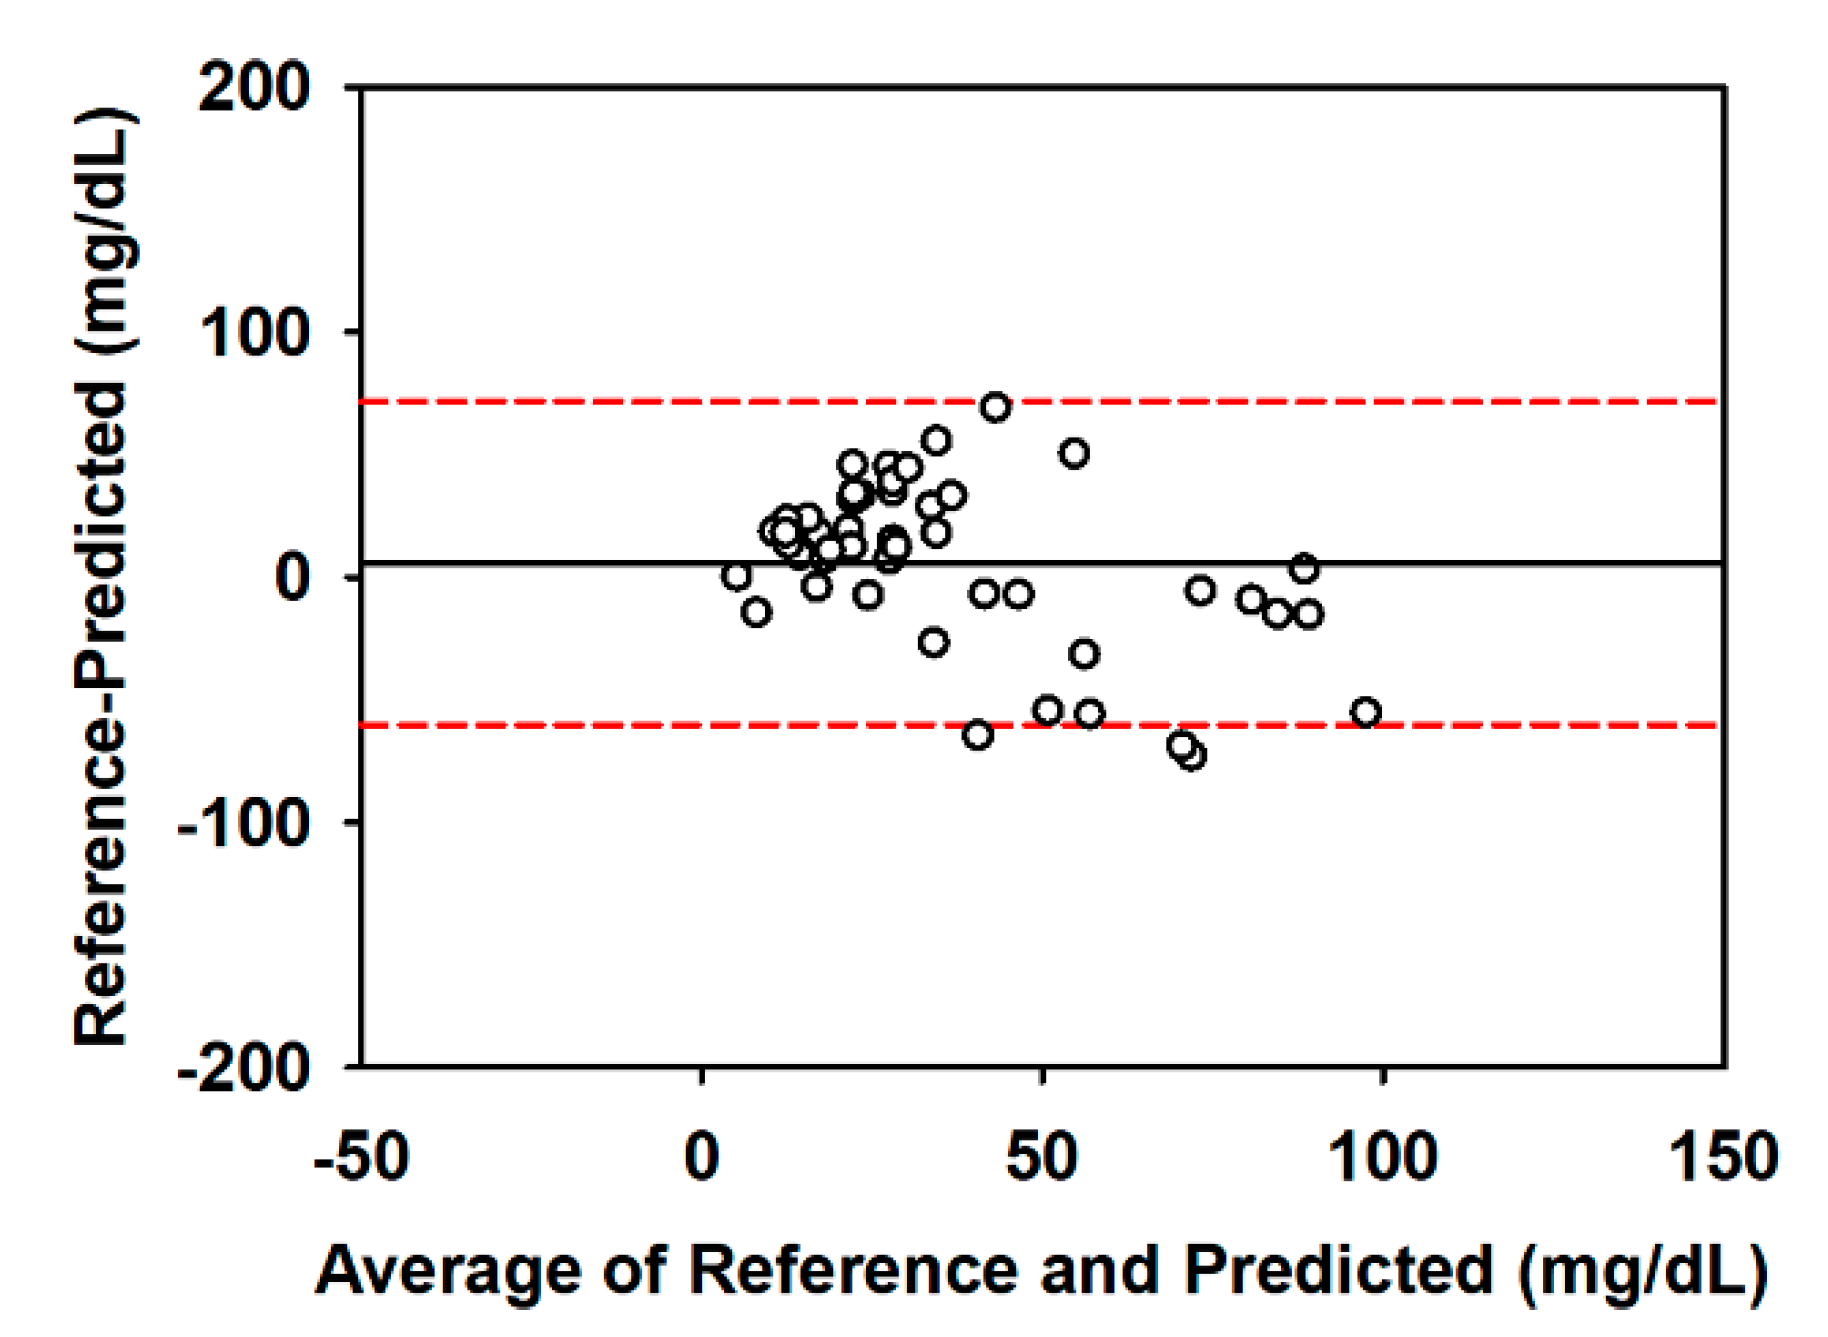
3.2.3. Statistical Validation

Sensor calibration is usually taken for more accurate and trustworthy resulting. A couple of validation methods was studied to assess the correlation and accuracy of two measures before/after a calibration [47]. We employed the Bland–Altman plot. As shown in Figure 6, we compared glucose-spiked solution assay (reference) with artificial tear assay data (predicted). Most plots were located in-between the dashed line (1.96× standard deviations), which indicates a high correlation among two measures or availability of calibration. Additionally, for the plots from high averages were scattered into a larger area, the low-concentrations of tear glucose (possibly of the normal and suspected range) had a superb accuracy than those of severe diabetic range.

4. Summary and Conclusions

In this work, we introduced the fabrication of plasmonic paper and its sensing application. We show both a theoretical approach to the particle formation and the rational selection of a targeted analyte. Chromatic assessment and morphologic characterization also provided a valuable understanding of the particle formation. (1) The particles were synthesized in shape of spheres evenly dispersed over cellulose surfaces; (2) Glucose acted as a reductant and a capping agent; (3) Excessive glucose triggered faster growth of the gold nanoparticles.
In addition to these experimental results, we applied this to a sensing application using tear glucose. The physiological range of tear glucose was successfully quantified. Furthermore, it exhibited robustness despite tear matrice compositions including chloride ions. Concerning sensing performance, it demonstrated a comparable sensitivity and a high linear correlation (R2 = 0.965) within low-concentration of glucose. This sensing strategy may inspire investigators and to be further evolved into a new type of sensor with combining other strategies, e.g., using aptamers or other probes.

Supplementary Materials

The following are available online at https://www.mdpi.com/2227-9040/8/3/81/s1, Figure S1: UV-vis spectra of paper-gold nanocomposites demonstrating no significant SPR peak shift throughout higher concentration of glucose (9, 15, 30, 45, 60, and 90 mM).

Author Contributions

Conceptualization, H.J.K. and H.N.; methodology, H.J.K.; synthesis, H.J.K. and J.H.; colorimetric & video analysis, H.J.K. and J.H.; microscopic analysis, H.J.K.; selectivity assay; J.H.; validation, H.J.K. and H.N.; formal analysis, H.J.K. and H.N.; writing—original draft preparation, H.J.K.; writing—review and editing, H.N.; visualization, H.J.K.; supervision, H.N.; project administration, J.H.; funding acquisition, H.N. All authors have read and agree to the published version of the manuscript.

Funding

This work was supported by the National Research Foundation of Korea (NRF) grant funded by the Korean government (MEST) (No. 2019003588).

Conflicts of Interest

The authors declare no conflict of interest.

References

  1. Heineman, W.R.; Jensen, W.B. Leland C. Clark Jr. (1918–2005). Biosens. Bioelectron. 2006, 21, 1403–1404. [Google Scholar] [CrossRef]
  2. Martinez, A.W.; Phillips, S.T.; Carrilho, E.; Thomas, S.W.; Sindi, H.; Whitesides, G.M. Simple telemedicine for developing regions: Camera phones and paper-based microfluidic devices for real-time, off-site diagnosis. Anal. Chem. 2008, 80, 3699–3707. [Google Scholar] [CrossRef] [PubMed] [Green Version]
  3. Ratajczak, K.; Stobiecka, M. High-performance modified cellulose paper-based biosensors for medical diagnostics and early cancer screening: A concise review. Carbohydr. Polym. 2020, 229, 115463. [Google Scholar] [CrossRef] [PubMed]
  4. Bergamonti, L.; Potenza, M.; Haghighi Poshtiri, A.; Lorenzi, A.; Sanangelantoni, A.M.; Lazzarini, L.; Lottici, P.P.; Graiff, C. Ag-functionalized nanocrystalline cellulose for paper preservation and strengthening. Carbohydr. Polym. 2020, 231, 115773. [Google Scholar] [CrossRef]
  5. Yang, H.; Deng, M.; Tang, Q.; He, W.; Hu, C.; Xi, Y.; Liu, R.; Wang, Z.L. A Nonencapsulative Pendulum-Like Paper–Based Hybrid Nanogenerator for Energy Harvesting. Adv. Energy Mater. 2019, 9. [Google Scholar] [CrossRef]
  6. Jin, Q.; Ma, L.; Zhou, W.; Shen, Y.; Fernandez-Delgado, O.; Li, X.J. Smart paper transformer: New insight for enhanced catalytic efficiency and reusability of noble metal nanocatalysts. Chem. Sci. 2020, 11, 2915–2925. [Google Scholar] [CrossRef] [Green Version]
  7. Tran, C.D. Subnanogram Detection of Dyes on Filter Paper by Surface-Enhanced Raman Scattering Spectrometry. Anal. Chem. 1984, 56, 824–826. [Google Scholar] [CrossRef]
  8. He, J.; Kunitake, T.; Nakao, A. Facile In Situ Synthesis of Noble Metal Nanoparticles in Porous Cellulose Fibers. Chem. Mater. 2003, 15, 4401–4406. [Google Scholar] [CrossRef]
  9. Christodouleas, D.C.; Simeone, F.C.; Tayi, A.; Targ, S.; Weaver, J.C.; Jayaram, K.; Fernández-Abedul, M.T.; Whitesides, G.M. Fabrication of Paper-Templated Structures of Noble Metals. Adv. Mater. Technol. 2017, 2. [Google Scholar] [CrossRef] [Green Version]
  10. Faraday, M. LIX. Experimental relations of gold (and other metals) to light.—The bakerian lecture. Lond. Edinb. Dublin Philos. Mag. J. Sci. 1857, 14, 512–539. [Google Scholar] [CrossRef]
  11. Lu, X.; Rycenga, M.; Skrabalak, S.E.; Wiley, B.; Xia, Y. Chemical synthesis of novel plasmonic nanoparticles. Annu. Rev. Phys. Chem. 2009, 60, 167–192. [Google Scholar] [CrossRef] [PubMed]
  12. Campion, A.; Kambhampati, P. Surface-enhanced Raman scattering. Chem. Soc. Rev. 1998, 27, 241–250. [Google Scholar] [CrossRef]
  13. Quesada-González, D.; Stefani, C.; González, I.; de la Escosura-Muñiz, A.; Domingo, N.; Mutjé, P.; Merkoçi, A. Signal enhancement on gold nanoparticle-based lateral flow tests using cellulose nanofibers. Biosens. Bioelectron. 2019, 141, 111407. [Google Scholar] [CrossRef] [PubMed]
  14. De La Rica, R.; Stevens, M.M. Plasmonic ELISA for the ultrasensitive detection of disease biomarkers with the naked eye. Nat. Nanotechnol. 2012, 7, 821–824. [Google Scholar] [CrossRef]
  15. Stobiecka, M.; Ratajczak, K.; Jakiela, S. Toward early cancer detection: Focus on biosensing systems and biosensors for an anti-apoptotic protein survivin and survivin mRNA. Biosens. Bioelectron. 2019, 137, 58–71. [Google Scholar] [CrossRef]
  16. Keleştemur, S.; Avci, E.; Çulha, M. Raman and Surface-Enhanced Raman Scattering for Biofilm Characterization. Chemosensors 2018, 6, 5. [Google Scholar] [CrossRef] [Green Version]
  17. Liu, H.; Zhao, P.; Wang, Y.; Li, S.; Zhang, L.; Zhang, Y.; Ge, S.; Yu, J. Paper-based sandwich type SERS sensor based on silver nanoparticles and biomimetic recognizer. Sens. Actuators B Chem. 2020, 313, 127989. [Google Scholar] [CrossRef]
  18. Kim, W.; Lee, S.H.; Kim, J.H.; Ahn, Y.J.; Kim, Y.H.; Yu, J.S.; Choi, S. Paper-Based Surface-Enhanced Raman Spectroscopy for Diagnosing Prenatal Diseases in Women. ACS Nano 2018, 12, 7100–7108. [Google Scholar] [CrossRef]
  19. Jeon, J.; Lee, S.H.; Joung, Y.; Kim, K.; Choi, N.; Choo, J. Improvement of reproducibility and thermal stability of surface-enhanced Raman scattering-based lateral flow assay strips using silica-encapsulated gold nanoparticles. Sens. Actuators B Chem. 2020, 321, 128521. [Google Scholar] [CrossRef]
  20. Della Pelle, F.; Scroccarello, A.; Scarano, S.; Compagnone, D. Silver nanoparticles-based plasmonic assay for the determination of sugar content in food matrices. Anal. Chim. Acta 2019, 1051, 129–137. [Google Scholar] [CrossRef] [Green Version]
  21. Andreu-Navarro, A.; Fernández-Romero, J.M.; Gómez-Hens, A. Determination of antioxidant additives in foodstuffs by direct measurement of gold nanoparticle formation using resonance light scattering detection. Anal. Chim. Acta 2011, 695, 11–17. [Google Scholar] [CrossRef] [Green Version]
  22. Palazzo, G.; Facchini, L.; Mallardi, A. Colorimetric detection of sugars based on gold nanoparticle formation. Sens. Actuators B Chem. 2012, 161, 366–371. [Google Scholar] [CrossRef]
  23. Aihara, M.; Kubota, N.; Kadowaki, T. Study of the Correlation between Tear Glucose Concentrations and Blood Glucose Concentrations. Diabetes 2018, 67, 944. [Google Scholar] [CrossRef]
  24. Kim, S.; Jeon, H.J.; Park, S.; Lee, D.Y.; Chung, E. Tear Glucose Measurement by Reflectance Spectrum of a Nanoparticle Embedded Contact Lens. Sci. Rep. 2020, 10, 8254. [Google Scholar] [CrossRef]
  25. Sempionatto, J.R.; Brazaca, L.C.; García-Carmona, L.; Bolat, G.; Campbell, A.S.; Martin, A.; Tang, G.; Shah, R.; Mishra, R.K.; Kim, J.; et al. Eyeglasses-based tear biosensing system: Non-invasive detection of alcohol, vitamins and glucose. Biosens. Bioelectron. 2019, 137, 161–170. [Google Scholar] [CrossRef]
  26. Jang, H.; Noh, H. Chemiluminescent detection of tear glucose on paper microfluidic devices. Macromol. Res. 2015, 23, 493–495. [Google Scholar] [CrossRef]
  27. Google. Official Google Blog: Introducing Our Smart Contact Lens Project. Available online: https://googleblog.blogspot.com/2014/01/introducing-our-smart-contact-lens.html (accessed on 13 July 2020).
  28. Park, S.; Boo, H.; Chung, T.D. Electrochemical non-enzymatic glucose sensors. Anal. Chim. Acta 2006, 556, 46–57. [Google Scholar] [CrossRef]
  29. Van Haeringen, N.J. Clinical biochemistry of tears. Surv. Ophthalmol. 1981, 26, 84–96. [Google Scholar] [CrossRef]
  30. Carrilho, E.; Martinez, A.W.; Whitesides, G.M. Understanding wax printing: A simple micropatterning process for paper-based microfluidics. Anal. Chem. 2009, 81, 7091–7095. [Google Scholar] [CrossRef]
  31. Choy, C.K.M.; Benzie, I.F.F.; Cho, P. Ascorbic acid concentration and total antioxidant activity of human tear fluid measured using the FRASC assay. Investig. Ophthalmol. Vis. Sci. 2000, 41, 3293–3298. [Google Scholar]
  32. Luensmann, D.; Jones, L. Albumin adsorption to contact lens materials: A review. Contact Lens Anterior Eye 2008, 31, 179–187. [Google Scholar] [CrossRef] [PubMed]
  33. Haiss, W.; Thanh, N.T.K.; Aveyard, J.; Fernig, D.G. Determination of size and concentration of gold nanoparticles from UV-Vis spectra. Anal. Chem. 2007, 79, 4215–4221. [Google Scholar] [CrossRef] [PubMed]
  34. Basu Ray, G.; Chakraborty, I.; Moulik, S.P. Pyrene absorption can be a convenient method for probing critical micellar concentration (cmc) and indexing micellar polarity. J. Colloid Interface Sci. 2006, 294, 248–254. [Google Scholar] [CrossRef]
  35. Watzky, M.A.; Finke, R.G. Transition metal nanocluster formation kinetic and mechanistic studies. A new mechanism when hydrogen is the reductant: Slow, continuous nucleation and fast autocatalytic surface growth. J. Am. Chem. Soc. 1997, 119, 10382–10400. [Google Scholar] [CrossRef]
  36. Namin, A.H.; Leboeuf, K.; Muscedere, R.; Wu, H.; Ahmadi, M. Efficient hardware implementation of the hyperbolic tangent sigmoid function. In Proceedings of the 2019 IEEE International Symposium on Circuits and Systems, Taipei, Taiwan, 24–27 May 2009; pp. 2117–2120. [Google Scholar]
  37. Mampallil, D.; Burak Eral, H. Historical perspective A review on suppression and utilization of the coffee-ring effect. Adv. Colloid Interface Sci. 2018, 252, 38–54. [Google Scholar] [CrossRef]
  38. Marsden, J.; House, L. The Chemistry of Gold Extraction, 2nd ed.; SME: Englewood, CO, USA, 2006; ISBN 978-0-87335-240-6. [Google Scholar]
  39. Amendola, V.; Meneghetti, M. Size evaluation of gold nanoparticles by UV-vis spectroscopy. J. Phys. Chem. C 2009, 113, 4277–4285. [Google Scholar] [CrossRef]
  40. Pacławski, K.; Streszewski, B.; Jaworski, W.; Luty-Błocho, M.; Fitzner, K. Gold nanoparticles formation via gold(III) chloride complex ions reduction with glucose in the batch and in the flow microreactor systems. Colloids Surf. A Physicochem. Eng. Asp. 2012, 413, 208–215. [Google Scholar] [CrossRef]
  41. MacLaurin, D.J.; Green, J.W. Carbohydrates in alkaline systems. II. Kinetics of the transformation and degradation reactions of cellobiose, cellobiulose, and 4-O-β-D-glucopyranosyl-D-mannose in 1 M sodium hydroxide at 22 °C. Can. J. Chem. 1969, 47, 3957–3964. [Google Scholar] [CrossRef]
  42. Liu, J.; Qin, G.; Raveendran, P.; Ikushima, Y. Facile “green” synthesis, characterization, and catalytic function of β-D-glucose-stabilized Au nanocrystals. Chem. A Eur. J. 2006, 12, 2131–2138. [Google Scholar] [CrossRef]
  43. Pfeiffer, C.; Rehbock, C.; Hühn, D.; Carrillo-Carrion, C.; De Aberasturi, D.J.; Merk, V.; Barcikowski, S.; Parak, W.J. Interaction of colloidal nanoparticles with their local environment: The (ionic) nanoenvironment around nanoparticles is different from bulk and determines the physico-chemical properties of the nanoparticles. J. R. Soc. Interface 2014, 11, 20130931. [Google Scholar] [CrossRef] [Green Version]
  44. Shang, L.; Wang, Y.; Jiang, J.; Dong, S. PH-dependent protein conformational changes in albumin:Gold nanoparticle bioconjugates: A spectroscopic study. Langmuir 2007, 23, 2714–2721. [Google Scholar] [CrossRef] [PubMed]
  45. Kim, H.J.; Jeong, S.; Noh, H. Quantitative Determination of Tear Glucose Using Paper Based Microfluidic Devices Hyun-Jae. J. Korean Chem. Soc. 2015, 59. [Google Scholar] [CrossRef]
  46. Garg, S.K.; Hirsch, I.B. Self-Monitoring of Blood Glucose. Diabetes Technol. Ther. 2015, 17, S3–S11. [Google Scholar] [CrossRef] [Green Version]
  47. Wentholt, I.M.E.; Hart, A.A.M.; Hoekstra, J.B.L.; DeVries, J.H. How to Assess and Compare the Accuracy of Continuous Glucose Monitors? Diabetes Technol. Ther. 2008, 10, 57–68. [Google Scholar] [CrossRef]
Figure 1. Chromatic characteristics of plasmonic paper. (A) Macroscopic view over the plasmonic paper; (B) color transition in the reaction showing diminishing coloration in both red and yellow around at 9 mM; (C) chromatic diagram indicating a redshift corresponding to naked-eye detection; (D) RGB profile demonstration a loss of coloration in the middle of the concentration range; (E) fractional red shift index, composing with R divided by G, making a sigmoidal curve (conditions: 24 °C, humidity = 60%, N = 5).
Chemosensors 08 00081 g001
Figure 2. Gold nanoparticle formation on cellulose surfaces. (A) Paper cellulose can make bonds with (B) gold nanospheres, when reduced the paper subsequently demonstrates pink coloration, which indicates (C) the increasing number of nanosphere while it keeps staying in the small size; SEM images and the morphologic characteristics of the gold nanospheres synthesized at low glucose concentrations of (D) 0.5 mM, (E) 1 mM, (F) 2 mM and (G) 9 mM, in which histograms gained from SEM analysis showing homogeneousness of the nanospheres.
Chemosensors 08 00081 g002
Figure 3. Project mechanism of in situ gold nanospheres synthesis. (A) Schematics depicting stepwise reactions throughout the glucose transformation triggered by hydroxide, the subsequent reducing reaction, gold seed formation and its growth and gluconate-based capping effect; (B) kinetic curve fit data with 30, 45 and 60-mM glucose samples; (C) calculated total growth rate constants.
Chemosensors 08 00081 g003
Figure 4. (A) Ion effect of chloride ion on gold formation (the marked area stands for the physiological tear chloride concentration; 106–138 mM); (B) false-positive test with candidate factor possibly bringing matrix effect; (C) synergistic effect assessment with ascorbic acid-spiked samples, whereas the control means of a sample spiked only with ascorbic acid.
Chemosensors 08 00081 g004
Figure 5. Quantitative data from tear-glucose assay using artificial samples (black dot), which is fitted to a sigmoid function with high correlation (black line, R2 = 0.997) and linear regression at low-concentrations (blue line, R2 = 0.965). Two red dash lines mean of the maximal plateau and the central piecewise linear approximation by the inflection point (red dot).
Chemosensors 08 00081 g005
Figure 6. Bland–Altman plot by glucose-spiked and artificial tear sample, in which red dash line means of 1.96× standard deviation and black solid line stand for a mean value of the difference between reference (glucose-spiked solution assay) and predicted (artificial tear assay).
Chemosensors 08 00081 g006
Table 1. Analytical performance of paper-based tear-glucose assay.
Glucose Concentration (mM)Progress in Diabetic Patient 1LinearityR2Analytical Function
[tear glucose] < 2normaly = 3.69 × 10 4 x + 0.978 20.965quantitative (LoD = 0.29 mM)
2 ≤ [tear glucose] < 4.2suspected or diabeticy = 1.81 × 10 2 x + 0.978 30.994 4quantitative
4.2 ≤ [tear glucose]diabeticN/AN/Aqualitative
1 reported from literature [24,45], 2 obtained from the linear regression at low concentrations, 3 derived from the piecewise linear approximation of the Boltzmann sigmoid function; by the infection point; [tear glucose] = 2.74 mM, 4 quantify the correlation among the experimental observations in the defined range; 2 ≤ [tear glucose] < 4.2; the correlation coefficient from Boltzmann sigmoid curve is 0.997.

