Article

Evaluation of a Reduced Graphene Oxide-Sb Nanoparticles Electrochemical Sensor for the Detection of Cadmium and Lead in Chamomile Tea

Department of Bioprocesses and Biotechnology, School of Agriculture, São Paulo State University (UNESP), Botucatu-18610-034, Brazil
*
Author to whom correspondence should be addressed.
Chemosensors 2020, 8(3), 53; https://doi.org/10.3390/chemosensors8030053
Submission received: 16 June 2020 / Revised: 30 June 2020 / Accepted: 7 July 2020 / Published: 10 July 2020
(This article belongs to the Section Electrochemical Devices and Sensors)

Abstract

:
The development of electroanalytical sensors for heavy metals detection in complex matrices holds great interest. Herein, a sensor based on a reduced graphene oxide (rGO) modified with antimony nanoparticles (Sb) was developed for the electrochemical detection of divalent cadmium ions (Cd2+) and lead ions (Pb2+). The simultaneous determination of both metals covered a range of 0.1 to 3.0 µmol L−1, with limits of detection (LOD) of 70.03 and 45.50 nmol L−1 for Cd2+ and Pb2+, respectively. For the individual detection, LOD of 20.50 nmol L−1 (Cd2+) and 2.01 nmol L−1 (Pb2+) were found. The analytical performance of this new sensor in detecting both metals in chamomile tea samples was satisfactorily evaluated.

1. Introduction

Heavy metals are well known for their relevance and extensive use in technological advances (or advancements). However, their wide distribution in the industrial, medical, agricultural, and food sectors raises the concern over the possibility of negative effects on the environment and human health [1]. Mainly in the agricultural sector, the irrigation of wastewater, vehicular exhaustion, prolong application of chemical fertilizers, and local industrial activities play a major role as the contamination route of the soil, revealing the direct or indirect influence of anthropogenic activities [2,3,4]. Several studies have already quoted the presence and influence of these contaminants, appointing to bioaccumulation as the major threat. This process is directly associated with the number of trophic levels between the origin of the food contamination and its final consumer, presenting a major problem for the agricultural production, thus affecting both quality and safety in consumption [5,6,7]. On the other side, the chronic intake of contaminated food, even in low doses, may induce neurologic, renal, osteoarticular disorders, besides leading to genetic and epigenetic dysfunctions, and associated as a risk factor for the development of some forms of cancer [8,9,10].
Being the second most consumed beverage worldwide, with its production reaching 5.8 million metric tons in 2018, tea is a possible route of contamination [11,12]. These data show its economic and cultural impact, enhancing the assurance of quality and safety in general tea production. Chamomile is one of the most popular herbal teas, most commonly represented by two varieties, Roman chamomile (Chamaemelum nobile) and German chamomile (Matricaria chamomilla) [13,14]. Its medical use dates back to ancient history, being one of the oldest medicinal herbs in our culture. The well documented medical properties as anti-inflammatory [15], antidiarrheal and antioxidant activities [16], potential management in type 2 diabetes [17], as well as its calming effects contributing for treatment of sleep disorders and anxiety [13,18], are mainly associated to the variety of phenolic compounds (p. Ex. terpenoids) and rich content of essential oil (p. Ex. flavonoids) in its composition [19]. The preparation of commercially standardized tea and herbal extracts proceeds from dried flowers of the Matricaria species, and its main consumption is in the form of herbal tea [13,14]. However, as presented by Karak et al. [20], recent reports showed that the application of organic and inorganic fertilizers may boost the accumulation of heavy metals (HMs) in tea growing soils.
As an example, Vulcano et al. [21] detected the levels of cadmium and lead ions in chamomile and yerba mate tea (industrialized and non-industrialized samples) using atomic absorption spectrometry (AAS). In this report, both tea-infusion and digest plant samples were studied. Despite reporting HMs concentration values in chamomile samples below the safety limit, there was a considerably elevated concentration of Cd2+ in the digested yerba mate plant. Stipulated by the Brazilian Health Regulatory Agency (ANVISA), according to RDC 42/13, maximum limits for inorganic contaminants in stocks, for the categories tea, yerba mate, and other vegetables for infusion purposes, presents the limits for cadmium and lead as 0.4 mg/kg and 0.6 mg/kg, respectively [22].
Therefore, several techniques for possible contaminants monitoring in tea samples have been proposed, having some of the methodologies shown by graphite furnace atomic absorption spectrometry (GF-AAS) [23], inductively coupled plasma mass spectroscopy (ICP-MS) [24] and laser-induced breakdown spectroscopy (LIBS) [25].
However, each technique presented has some disadvantages, such as sample preparation or the need for clean-up procedures prior to the experiment (due to the high content of interferents), the high cost of operation, or the impossibility of in situ analysis. In that way, electroanalytical techniques have been standing out in the last decade for offering an overall solution for those obstacles, in many works for environmental samples analysis, also offering fast and cheap analysis, with good selectivity [26].
One of the main aspects of developing a sensor on the electroanalytical field is choosing the material for the electrode’s surface modification, which needs to provide good characteristics involving stability, electronic conductivity, surface area, and high sensibility [27]. Thus, since its discovery, graphene has shown itself as one of the most promising materials for several areas, such as electrochemistry, for presenting extraordinary electronic features [28,29]. Electrodes based on reduced graphene oxide (rGO) with the addition of metallic nanoparticles has shown as one of the most promising composites in the electroanalytical area due to the synergistic effect added to the excellent properties of rGO in the detection of environmental pollutants [30].
Cesarino et al. [31] developed a nanocomposite based on the synergistic combination of rGO with antimony nanoparticles (SbNPs) to perform detection of estriol hormones in environmental water samples; Zhang et al. [32] analyzed a nanocomposite of platinum nanoparticles combined with graphene oxide (PtNPs/GO) to be used as a signal transducer to develop an assay for the direct detection of cancer cells, showing a wide range of potential applications in biotechnology and medicine; and Silva et al. studied the stripping analysis of Cd2+, Pb2+, Cu2+, and Hg2+ in drinking water samples, using the nanocomposite based on the combination of rGO with SbNPs [33], demonstrating the benefits and potential of the synergistic effect gain with the addition of metallic nanoparticles.
In this way, this work presents the development of an electrochemical device based on rGO and SbNPs for the determination of lead (Pb2+) and cadmium (Cd2+) ions in chamomile tea-infusion samples.

2. Materials and Methods

2.1. Reagents and Apparatus

All reagents used in this study were of analytical grade and without prior purification. The graphene oxide (4 mg mL−1) and antimony chloride salt (SbCl3) were purchased from Sigma-Aldrich (Darmstadt, Germany), as well as the standards solutions of Cd2+ and Pb2+ (standard AAS). Solutions and buffers were prepared using purified water in a PURELAB Option-Q-ELGA–VEOLIA (resistivity ≥18 MΩcm).
Cyclic voltammetry (CV) and square wave anodic stripping voltammetry (SWASV) experiments were performed using an electrochemical system model Autolab 128N (Eco Chemie, Utrecht, The Netherlands) equipped with NOVA 2.1 software (Eco Chemie, Utrecht, The Netherlands). All electrochemical tests were conducted in a conventional three-electrode system with a bare glassy carbon electrode (GC), GC/GO, GC/rGO, or GC/rGO-SbNPs as the working electrode, Ag/AgCl/KCl (3.0 mol L−1) as the reference electrode, and a platinum plate as the auxiliary electrode.

2.2. Synthesis of the Nanocomposites

Initially, for the chemical reduction step, a suspension of GO and sodium dodecyl sulfate (SDS) was prepared in a 10:4 ratio in an ethanol medium, followed by a sonication step for 20 min. Excess of sodium borohydride (NaBH4) was then added (16 mg) and a 20 min sonication was carried out. The solution was then centrifuged and cleaned several times with ethanol. The resulting rGO was dried at 60 °C and dispersed in ultrapure water at a concentration of 1.0 mg mL−1. For optimization, the synthesis of the nanocomposite rGO-SbNPs was performed with four different antimony chloride (SbCl3)/GO ratios as follows: 20%, 30%, 40%, and 50% of SbCl3.
The solution containing SbCl3 was added dropwise (≈1 drop per second) to the rGO suspension under constant stirring. The product was then centrifuged for 10 min (3000 rpm) and washed four times with ethanol pure grade (the supernatant became colorless). The dried material was dispersed in ultrapure water (0.3 mg mL−1) and kept under refrigeration for further use. The rGO composite was synthesized as described above without the addition of the metallic salt. The materials were sonicated daily in order to prevent precipitation and to keep homogeneity of the film.

2.3. Procedures

The surface morphology was characterized by scanning electron microscopy (SEM) coupled to an electron gun (FEG-SEM), JEOL MODELO JSM7500F, at the Advanced Microscopy Laboratory (LMA) of the Institute of Chemistry—UNESP Araraquara. SEM micrographs were also obtained by Quanta 200 (FEI Company, Hillsboro, OR, USA) at the Electron Microscope Center of the Institute of Biosciences of Botucatu, UNESP.
For the electrochemical characterization of the composite, a CV experiment was conducted by comparing the GC/rGO and GC/rGO/SbNPs electrode’s voltammetric profiles in HCl 0.5 mol L−1 solution, with a scan rate of 50 mV s−1 within the potential range of −0.6 to +0.2 V.
SWASV measurements were recorded in a 0.1 mol L−1 PBS solution (pH 3.0), within a potential range of −1.0 to −0.1 V, with an accumulation potential of −1.0 V for 120 s, pulse amplitude of 90 mV and 80 Hz frequency, containing 10.0 μmol L−1 of Cd2+ and Pb2+. These measurements were carried out at room temperature.

2.4. Electrodes Preparation

The glassy carbon electrodes (GC) were polished using 0.5 μm alumina slurry. Then, the electrodes were sonicated for 5 min in ethanol and 5 min in ultrapure water and dried at room temperature. Finally, 10 μL of the composites were dropped on the surfaces of the cleaned electrodes and dried at room temperature.

2.5. Real Tea Samples

A commercial tea bag of chamomile (acquired at a local market) containing 1 g of the sample was boiled within 50 mL ultrapure water and left to soak for 20 min. The solution was transferred to a volumetric flask and nitric acid was added to achieve a 0.6% (v/v) solution [34]. The solution was kept under refrigeration prior to analysis.

3. Results and Discussion

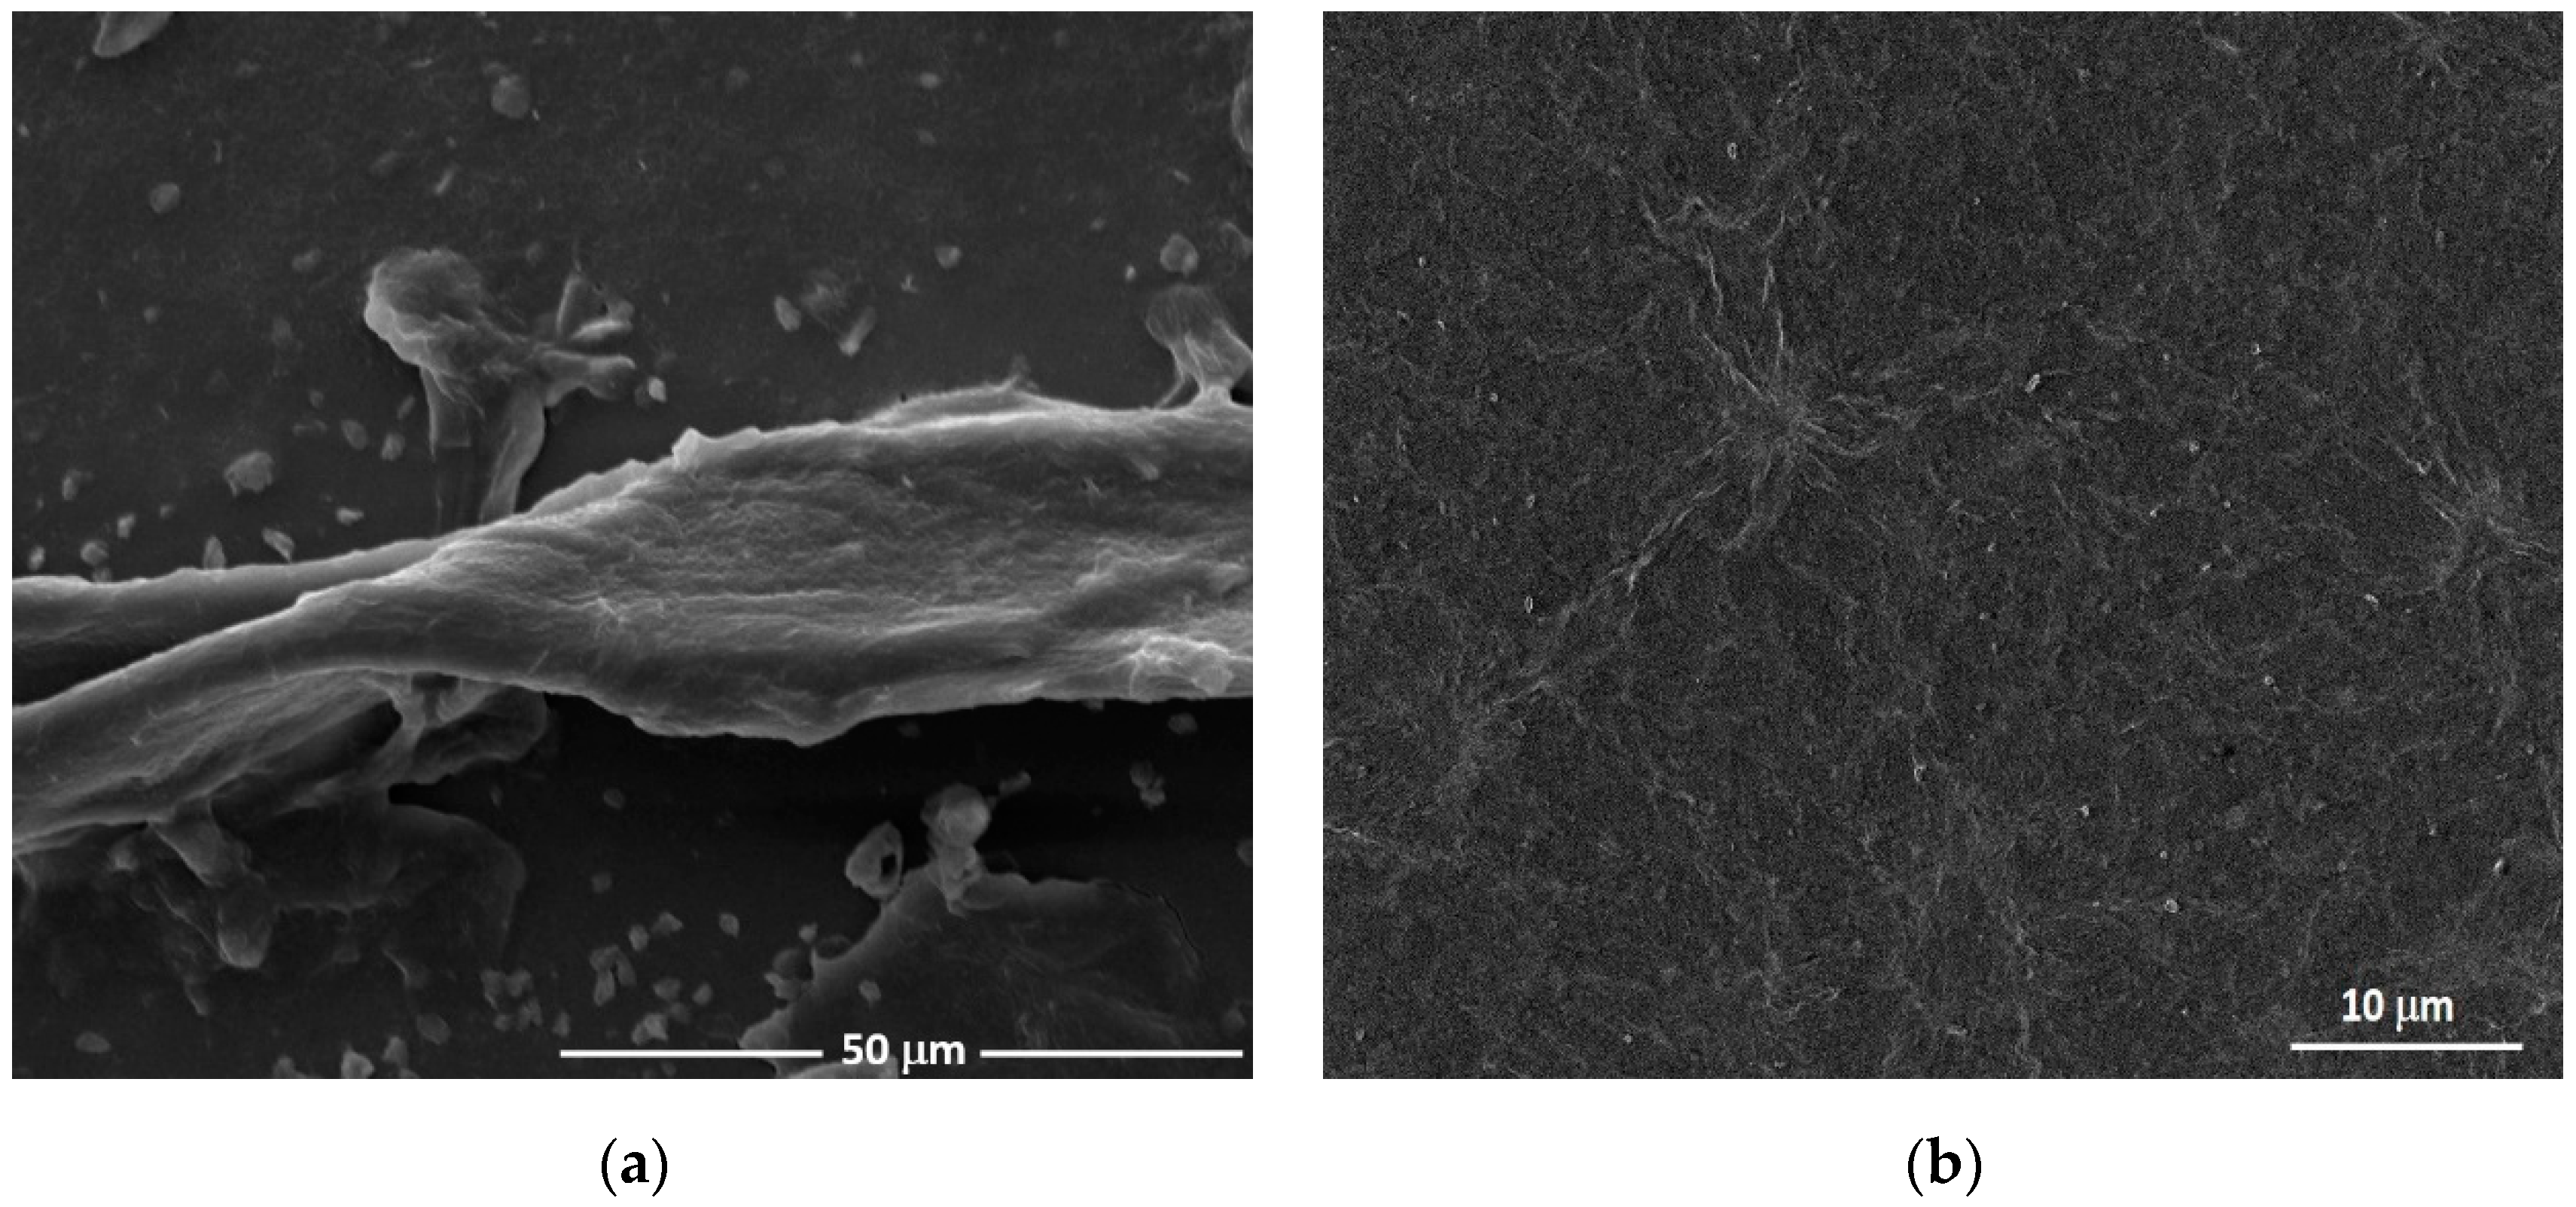
3.1. Morphologic Characterization of Nanocomposites

The surface morphology of rGO and rGO-SbNPs nanocomposites was characterized by scanning electron microscopy (FEG-SEM), as shown in Figure 1. The characteristic morphological structure of rGO is observed in Figure 1a. Its precursor, GO tends to form a mixture of single and multiple layers (sheets) as 2D material, the stacking of single sheets via electrons π–π is commonly expected for this material. After the chemical reduction step, the rGO structure presents a distorted and wrinkled sheet of graphene due to unstacking. This process aims to decrease functional groups containing oxygen (mainly carbonyl and hydroxy), thus, making the material exhibit a typical twisted and wrinkled structure, which boosts its electronic properties for a more similar behavior of unmodified graphene.
Figure 1b shows the integration of Sb nanoparticles on the rGO nanosheet surface. The morphologic analysis of this nanocomposite revealed nanoparticles with their size ranging from 50 to 150 nm.

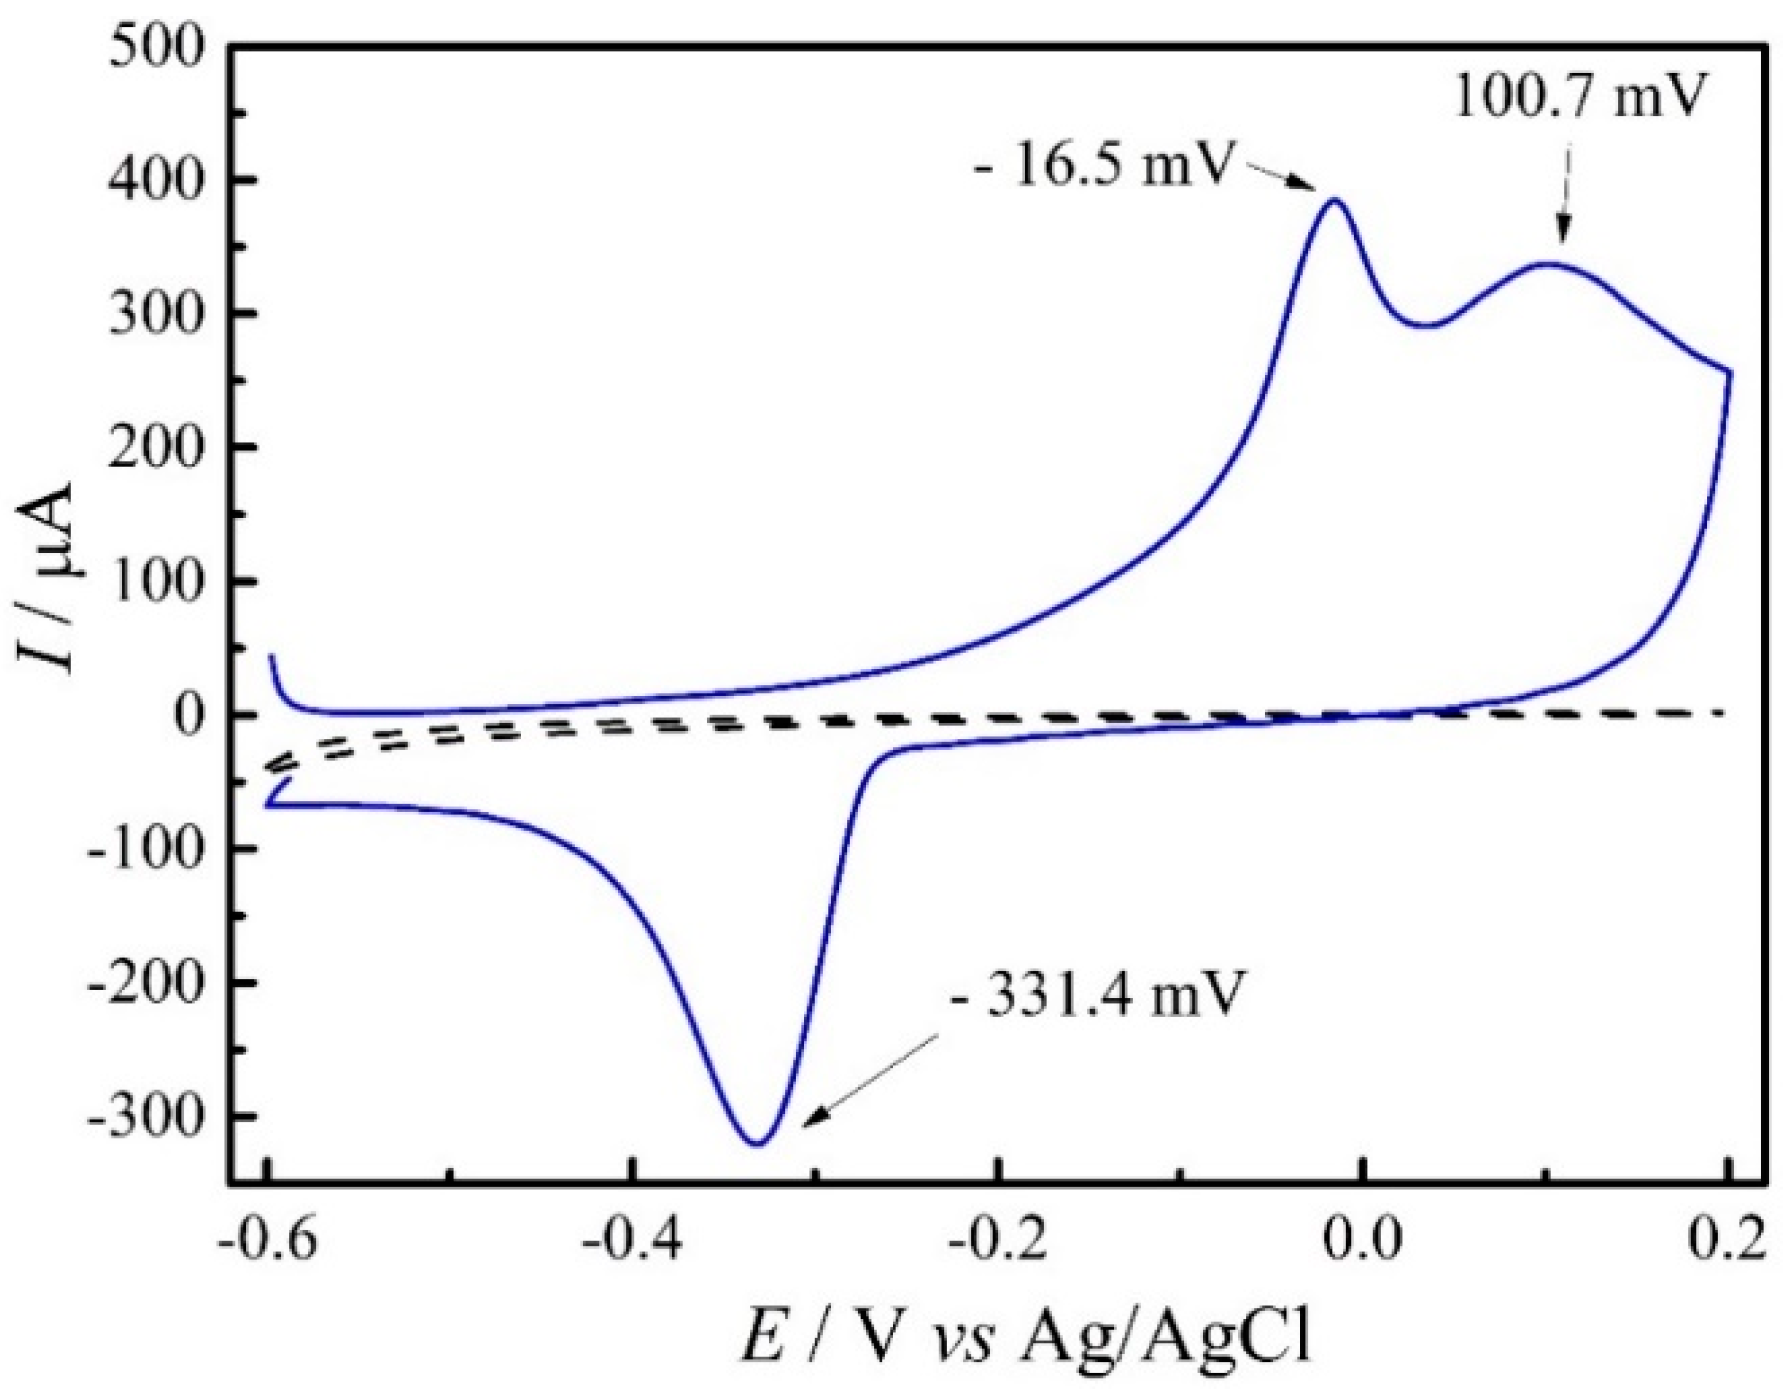
3.2. Electrochemical Characterization

The electrochemical characterization of the GC/rGO-SbNPs electrode was evaluated using a CV experiment in a 0.5 mol L−1 HCl solution. The voltammograms, shown in Figure 2, indicate the presence of Sb nanoparticles on the rGO surface (solid line). Two oxidation processes regarding SbNPs were observed at −16.5 and 100.7 mV. In the reverse scan, the GC/rGO-SbNPs electrode showed a reduction peak at −331.4 mV. Both oxidation and reduction processes for Sb were already extensively observed in the literature [35,36]. In contrast, the GC/rGO electrode (dashed line) did not present any visible oxidation processes in the voltammetric profile.

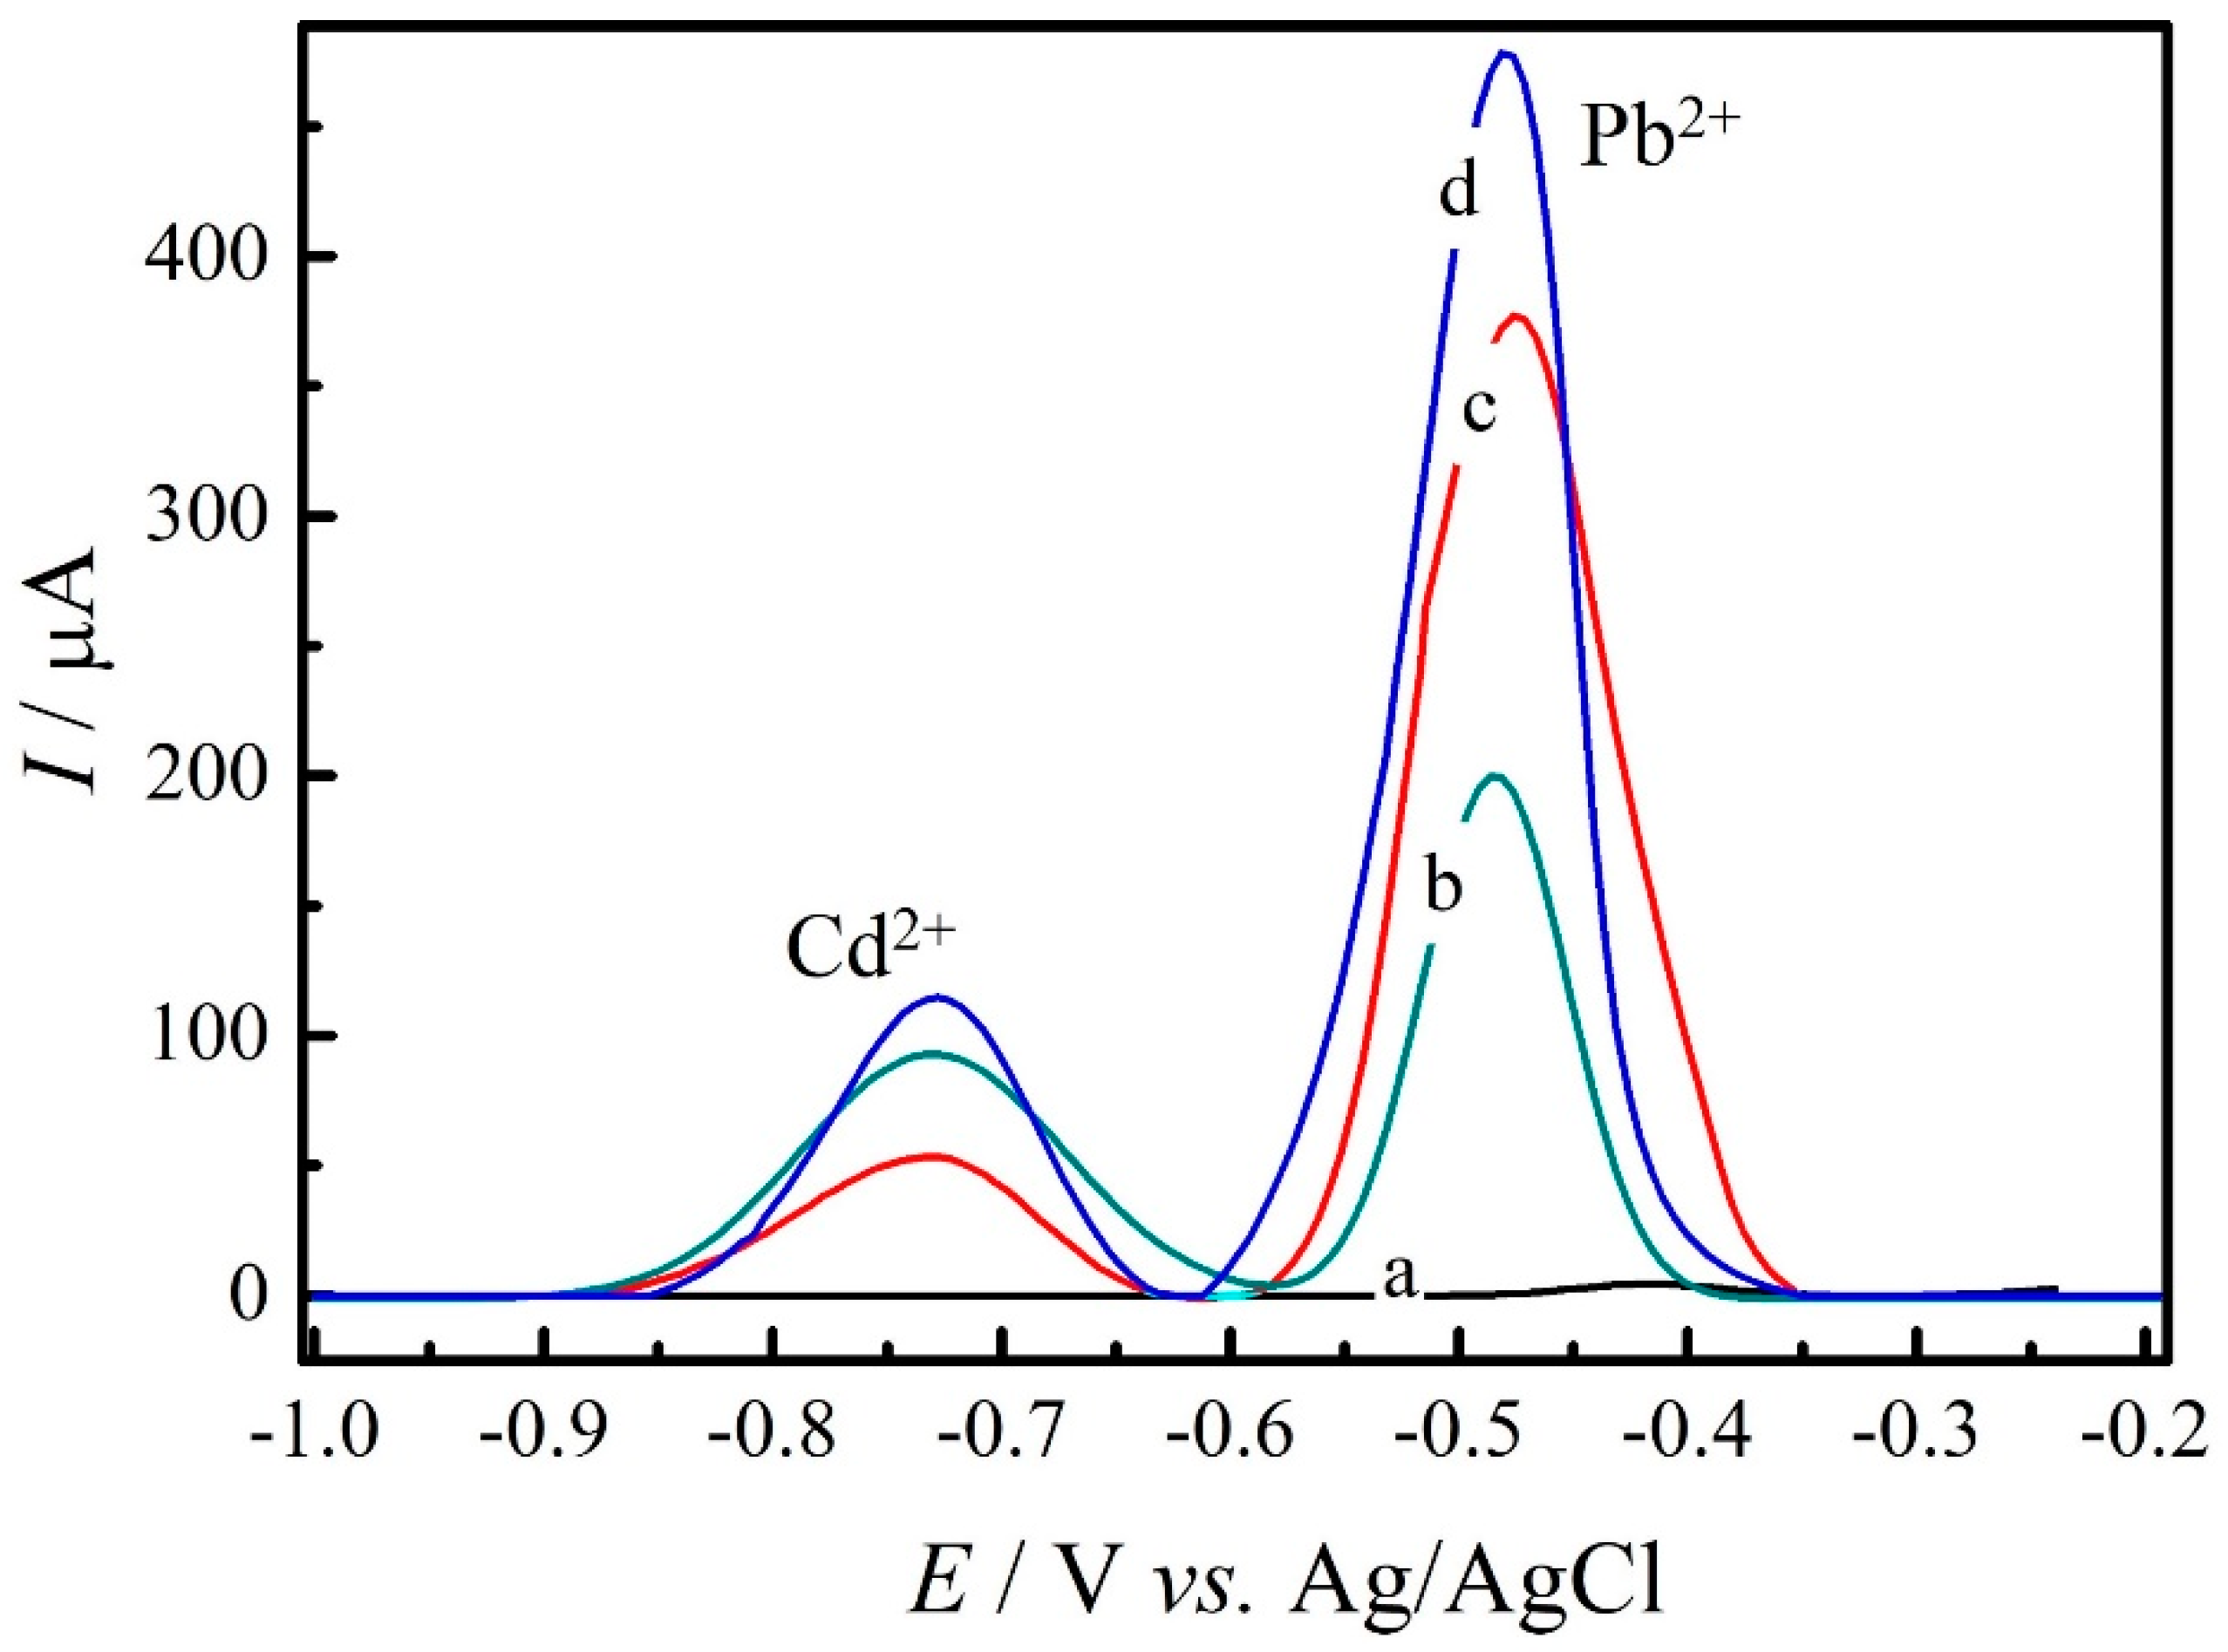
3.3. Performance of GC/rGO-SbNPs Sensor for the Analysis of Cd2+ and Pb2+

The stripping analysis for 10.0 μmol L−1 of Cd2+ and Pb2+ was conducted in a 0.1 mol L−1 PBS solution at pH 3.0, for the electrochemical comparison of the electrodes GC, GC/GO, GC/rGO, and GC/rGO-SbNPs.
As shown in Figure 3, the oxidation peaks for cadmium and lead ions are located near peak P1 at Epa1 = −0.728 V (Cd2+) and peak P2 at Epa2 = −0.481 V (Pb2+) vs. Ag/AgCl/KCl (3.0 mol L−1) for the four studied electrodes. The proposed electrode, GC/rGO-SbNPs (curve d), presented the highest anodic peak currents for both metals when compared to the other studied electrodes, with an increase of approximately 2.4 times for the cadmium and 1.3 times for the lead ions response when compared to GC/rGO electrode anodic peak current. This increase in the response signal for both metals is associated with the synergistic effect of rGO with SbNPs, appointing itself as a new material for the determination of Cd2+ and Pb2+ ions on tea samples.

3.4. Optimization of Experimental Parameters

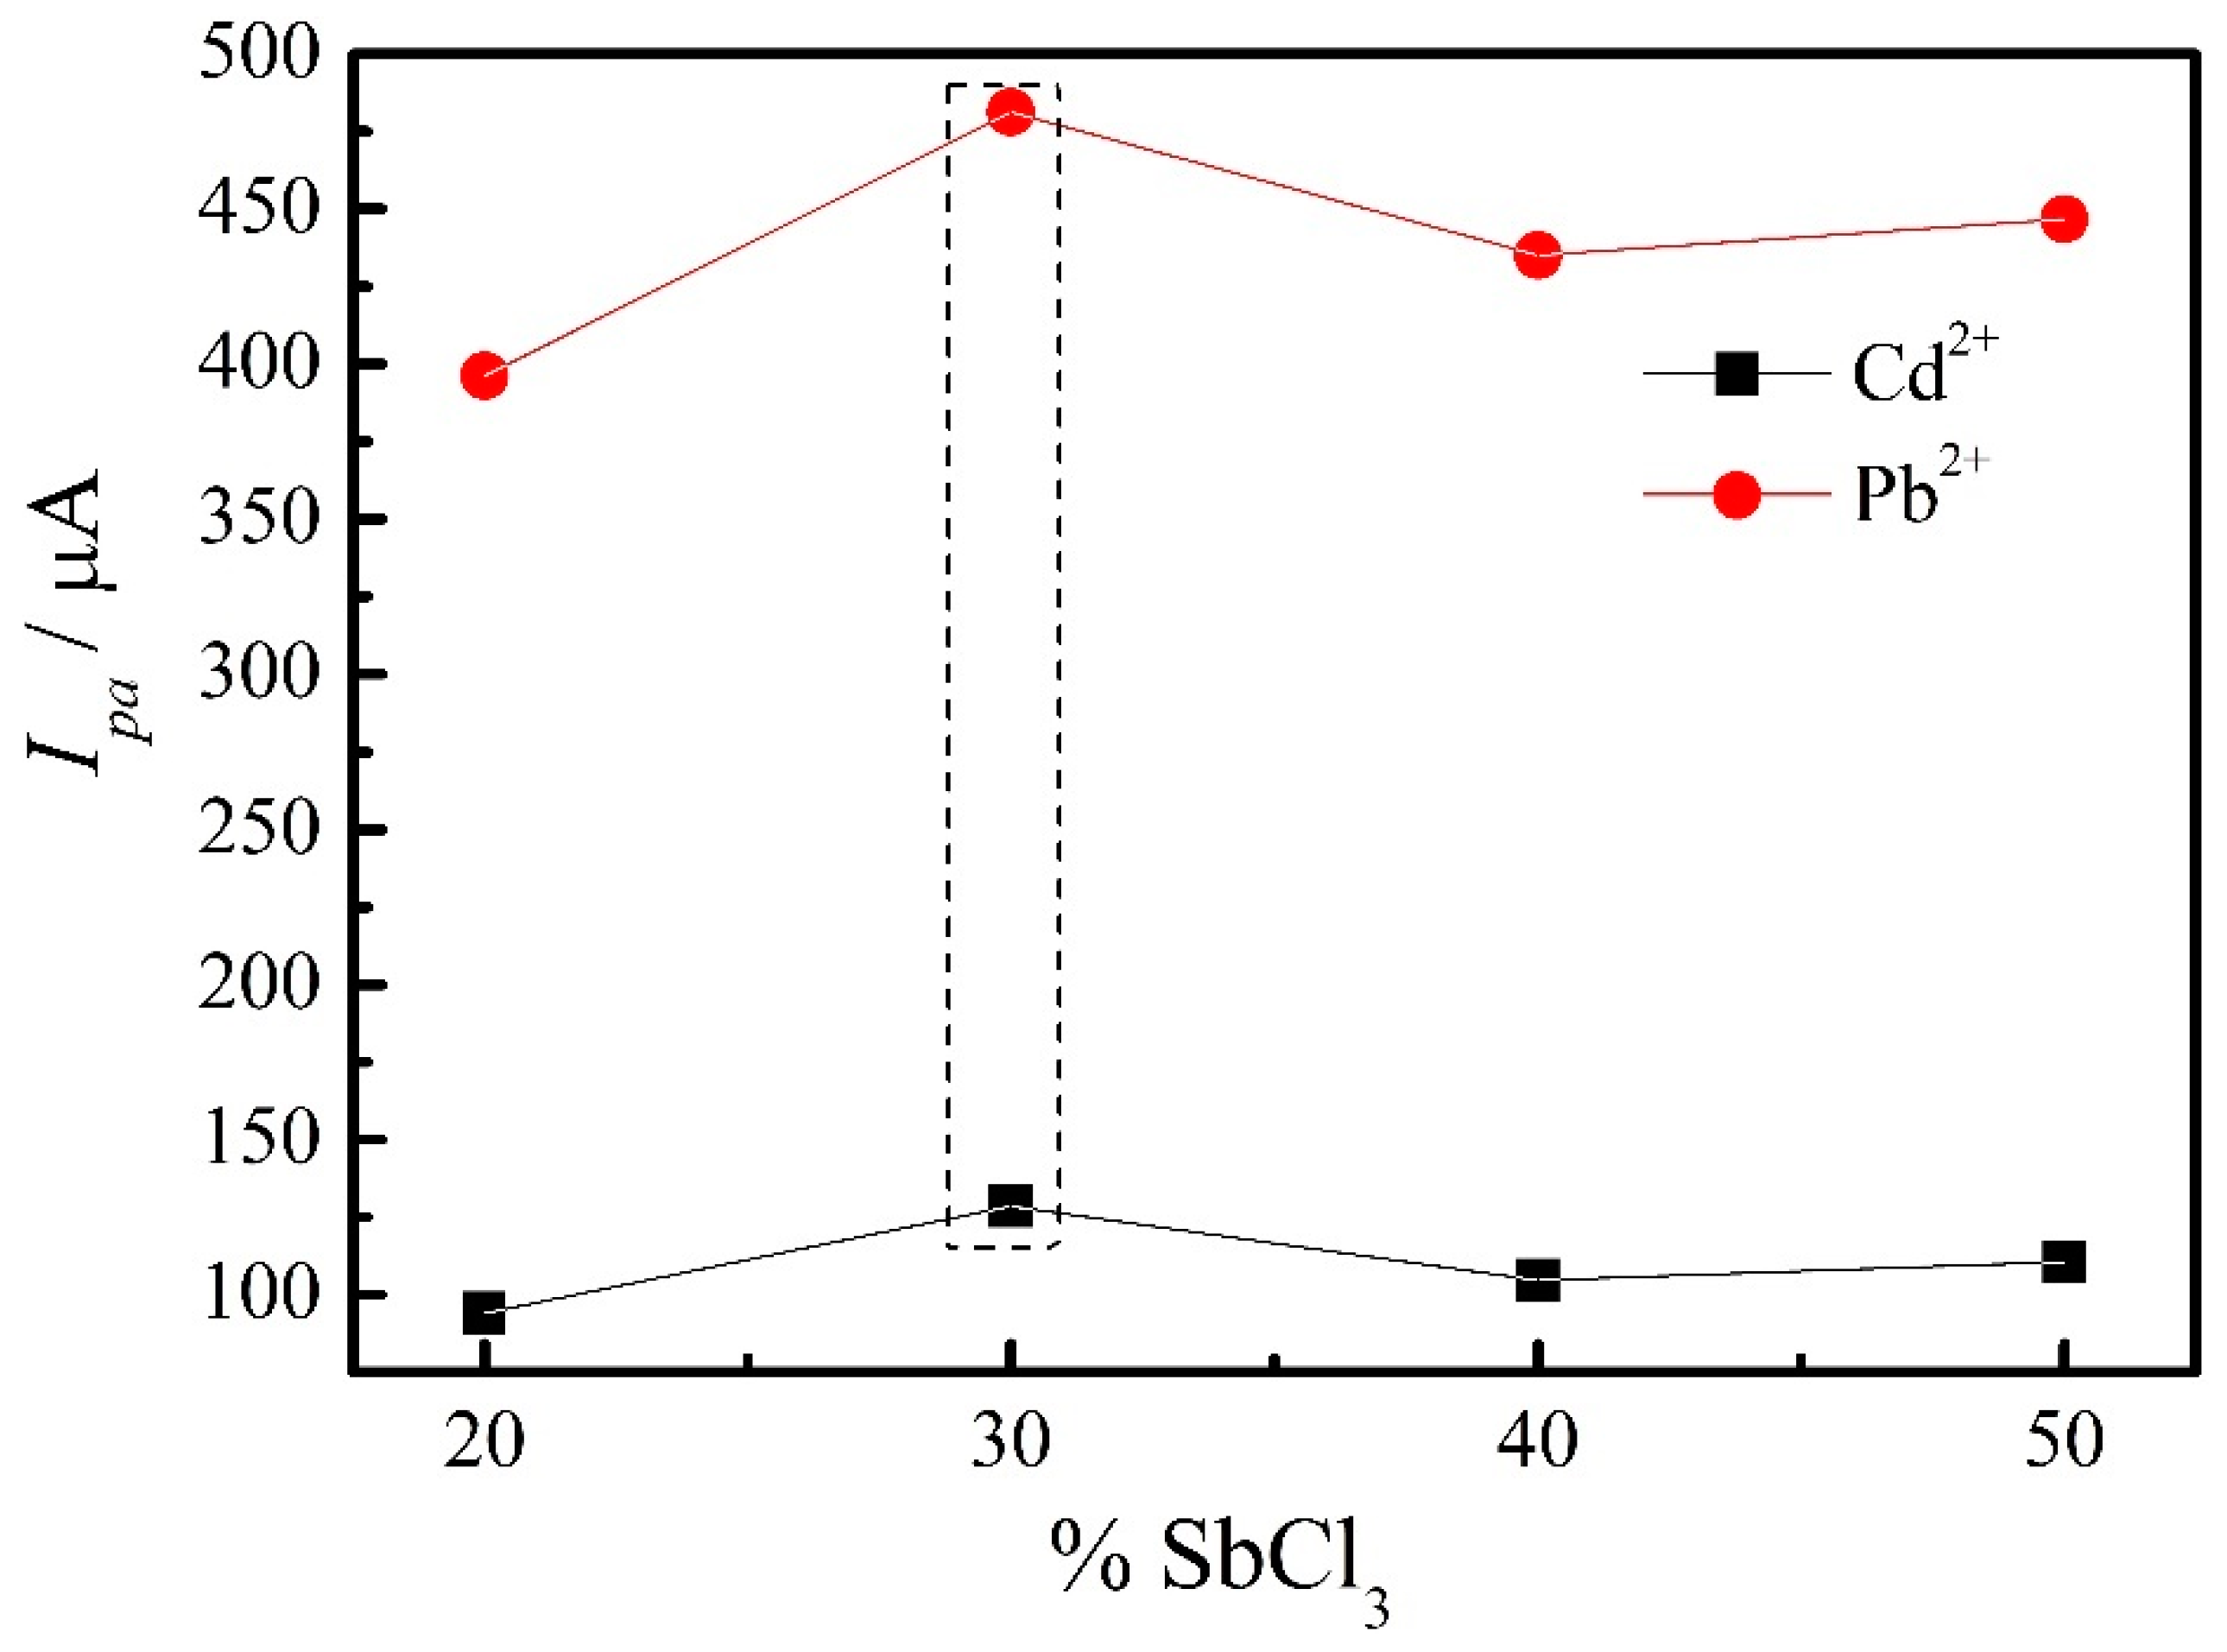
3.4.1. Electrode Film Optimization

In order to maximize the SWASV response, the parameters involving the nanocomposite synthesis were optimized. Thus, the influence of the SbCl3/GO ratio during synthesis was analyzed by varying the proportion for 20, 30, 40, and 50% (m/m) compared to a fixed 20 mg of GO. Thus, Figure 4 presents the highest anodic peak current (Ipa), for both metals, at a 30% nanocomposite ratio.
The film concentration of the modified electrode was also evaluated by SWASV experiments (figure not shown). The concentrations evaluated were 12.5, 25.0, 50.0, and 75.0 µg mL−1. The increase of the stripping peak current for both metals (Cd2+ and Pb2+) was observed at 12.5 µg mL−1 of the film concentration, followed by a decrease in the electrode response when the composite concentration was raised. High concentrations of the nanocomposite may block the electron-transfer process through the electrode/electrolyte interface [37]. Therefore, the rGO-SbNPs (30%) at 12.5 µg mL−1 was used in further experiments.

3.4.2. SWASV and Supporting Electrolyte Optimization

A satisfactory performance of stripping analysis is directly linked with the parameters of the SWASV technique. As having a sensitive and linear response when detecting trace levels of heavy metals (as any possible contaminants), the optimization of SWASV parameters is required. The optimized SWASV parameters were frequency, pulse amplitude, accumulation time, and deposition potential at a fixed 10.0 µmol L−1 of Cd2+ and Pb2+ concentration in 0.1 mol L−1 PBS pH 3.0. Table 1 summarizes the range of the evaluated and optimized values found for each parameter.
Regarding the square wave voltammetry (SWV) detection, the frequency was optimized in the range of 10 to 90 Hz, the pulse amplitude from 15 to 100 mV. The deposition potential was the first optimized anodic stripping parameter, ranging from −1.3 to −0.8 V, reaching the maximum response for both metals at −1.2 V. The second optimized anodic stripping parameter was the accumulation time, ranging from 45 to 150 s, reaching the maximum response at 150 s. The accumulation time increases the signal for heavy metals detection, due to a rise in the accumulation of metal ions on the electrode surface over time. However, it can be a time-consuming approach. As Wang et al. (2018) reported [38], after a 120-s accumulation time, the increase of the response was not so significant, due to the saturation of the enriched ions on the electrode surface. In this way, for the subsequent experiments, the accumulation time of 120 s at −1.2 V was employed.
The pH variation during stripping analysis plays an important role in the detection of heavy metals [23], as high pH values may cause the precipitation of metals in its oxide form [39]. Therefore, the pH of the PBS buffer was investigated for both metals in the range of 2.0 to 6.0, with its maximum response at pH 3.0.

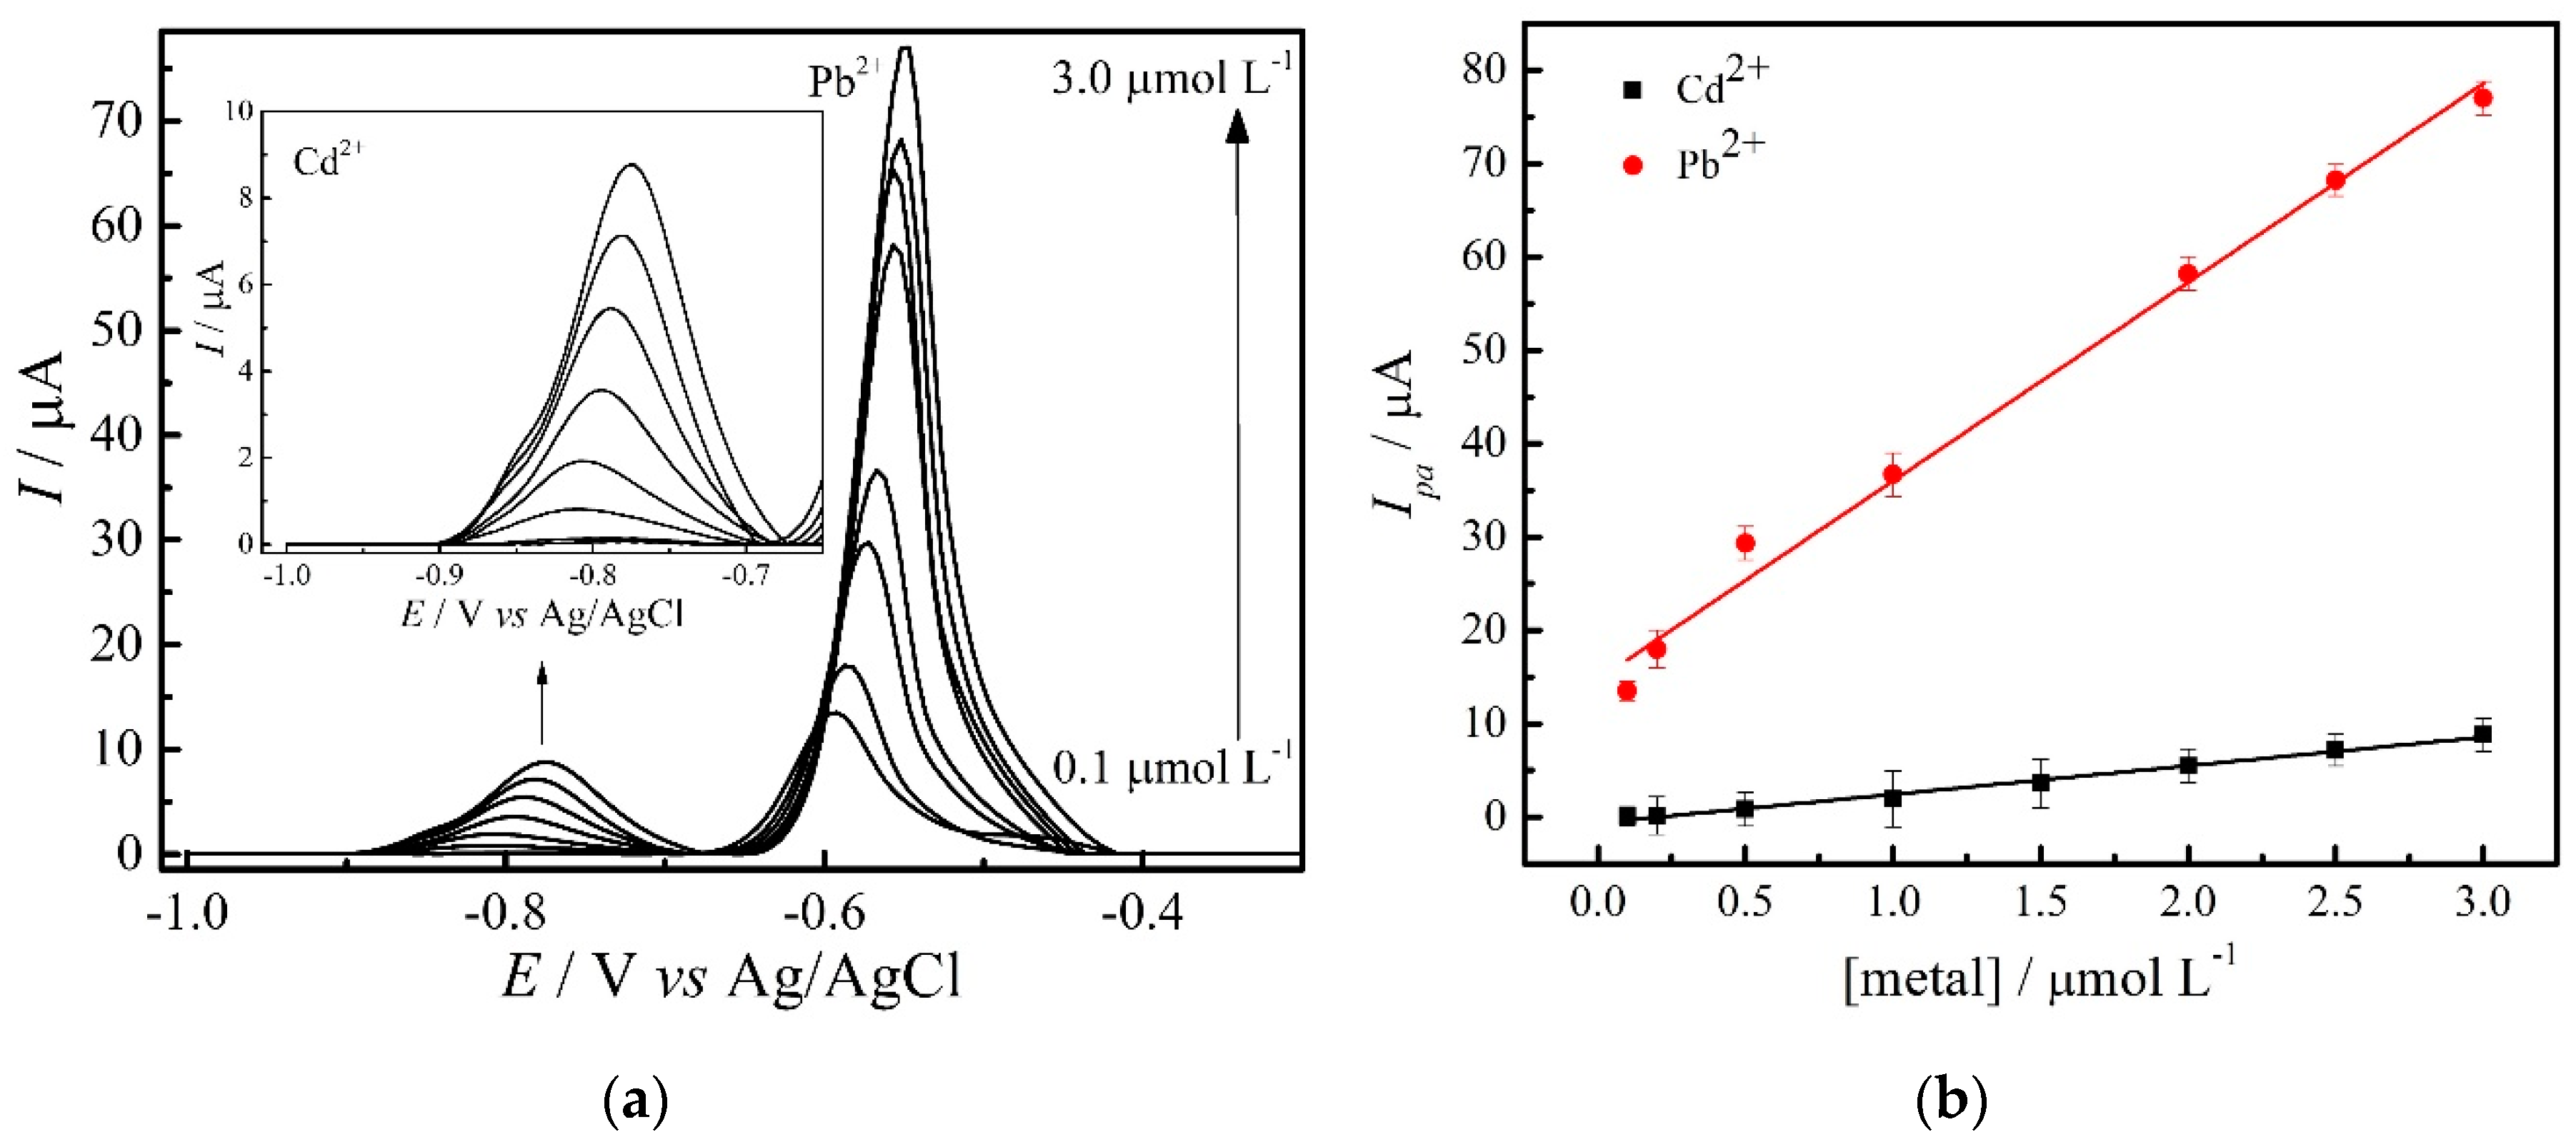
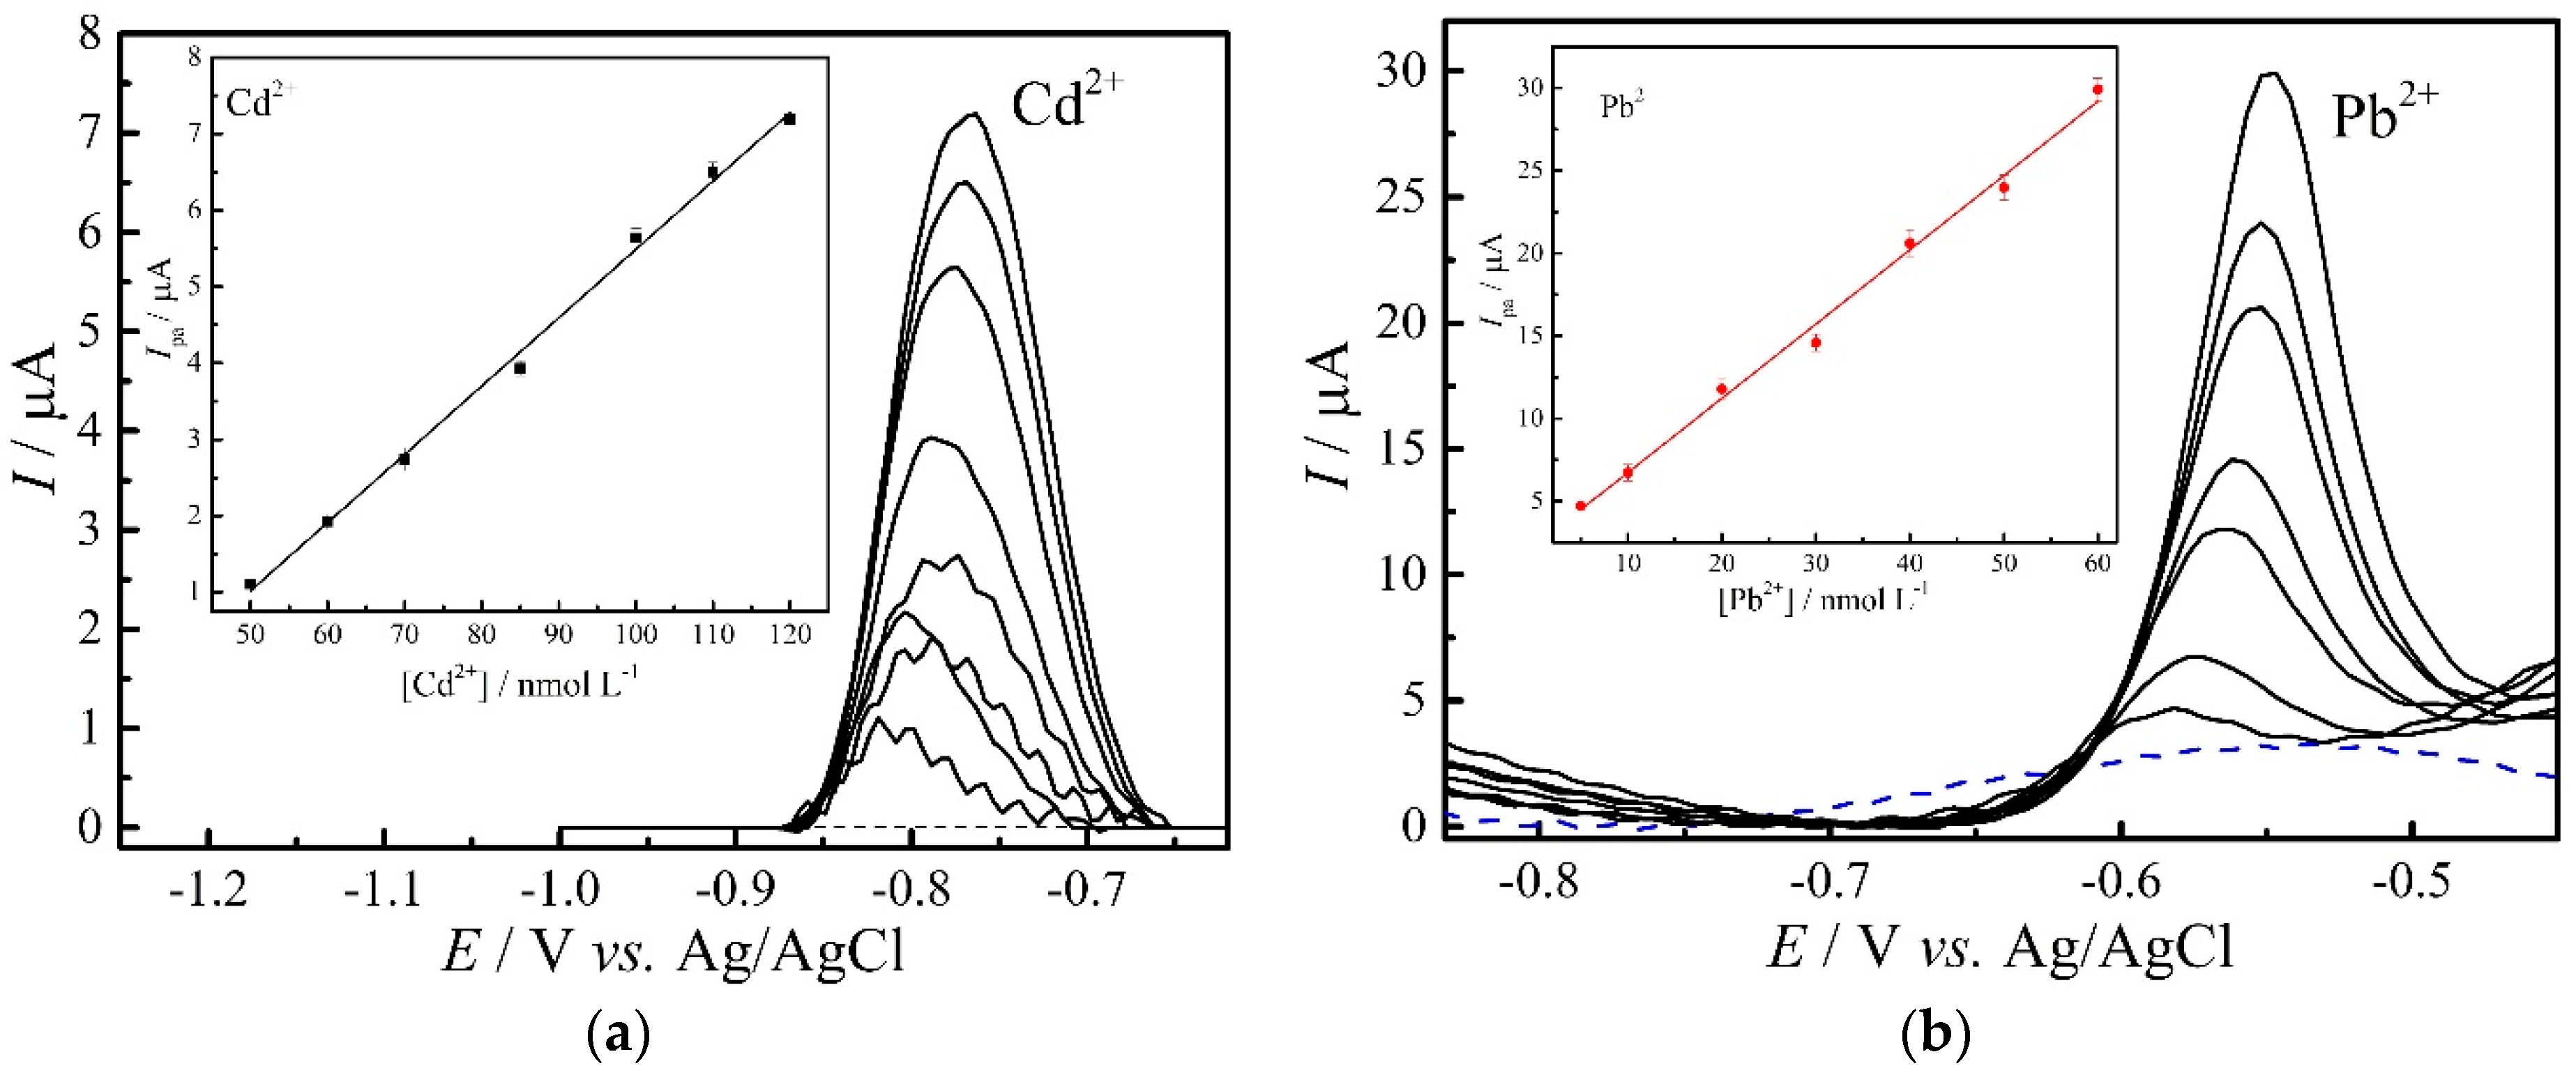
3.5. Calibration Curves

The calibration curves for Cd2+ and Pb2+ were built in two different experiments under optimized conditions as described earlier. In the first one, both metals were detected simultaneously in the range of 0.1 to 3.0 µmol L−1, as shown in Figure 5a. Despite the higher response for Pb2+, both metals presented a linear response of the anodic peak current vs. metal concentration, as shown in Figure 5b.
The second experiment consisted of building both calibration curves individually, as shown in Figure 6. The response Cd2+ ions were obtained in the range of 50 to 120 nmol L−1 (Figure 6a) and Pb2+ within the range of 5 to 60 nmol L−1 (Figure 6b).
Table 2 summarizes the method of detection (simultaneous/individual), equation of calibration curve, linear range, linearity (R2), and obtained LOD in nmol L−1 of the experiments described above.
The development of electrochemical sensors based on rGO and metallic nanoparticles for selective detection of Cd2+ and Pb2+ have been widely investigated. Wu et al. [40] developed an aluminum-silicon carbide-rGO nanocomposite electrode with LODs down to 19.13 nmol L−1 for Cd2+ and 6.27 nmol L−1 for Pb2+.
Lee et al. [41] developed a similar model compared to the presented study. A rGO modified with Sn nanoparticles-based electrode achieved LODs of 0.63 nmol L−1 for Cd2+ and 0.60 nmol L−1 for Pb2+.
Sang et al. [42] tested the sensor based on rGO modified with AgNPs. Through SWASV experiments, the developed sensor exhibited excellent electrochemical activity and sensitivity towards the detection of several heavy metal ions, as Cd2+ and Pb2+ LODs of 254.0 and 141.0 nmol L−1, respectively.
Liu et al. [43] modified the GC electrode with liquid phase exfoliated graphene nanosheets, prepared through a one-step exfoliation. The developed sensors showed increased response for the electrochemical signals for Cd2+ and Pb2+, with noteworthy signal amplification effects. The LODs determined by this sensor were 11.60 nmol L−1 for Cd2+ and 8.93 nmol L−1 for Pb2+.
The GC/rGO-SbNPs sensor developed in this work has similar LODs for Cd2+ and Pb2+ as reported in the literature. Although there are many important types of research in the development of new electroanalytical sensors towards heavy metal detection, the practical application of such sensors is required. In that way, this study evaluated the selective determination of the metals in question in infused chamomile tea samples.
The reproducibility of the GC/rGO-SbNPs electrode was also investigated. For this study, five experiments were measured, in which each experiment consisted of ten sequential SWASV voltammograms. These experiments were performed on different days, in which the electrodes were prepared day-to-day, in other words, using different films. The SWASV voltammograms were performed under the optimized conditions containing 0.5 μmol L−1 of Cd2+ and Pb2+. The calculated standard deviations were 2.8% and 1.9% for Cd2+ and Pb2+, respectively.

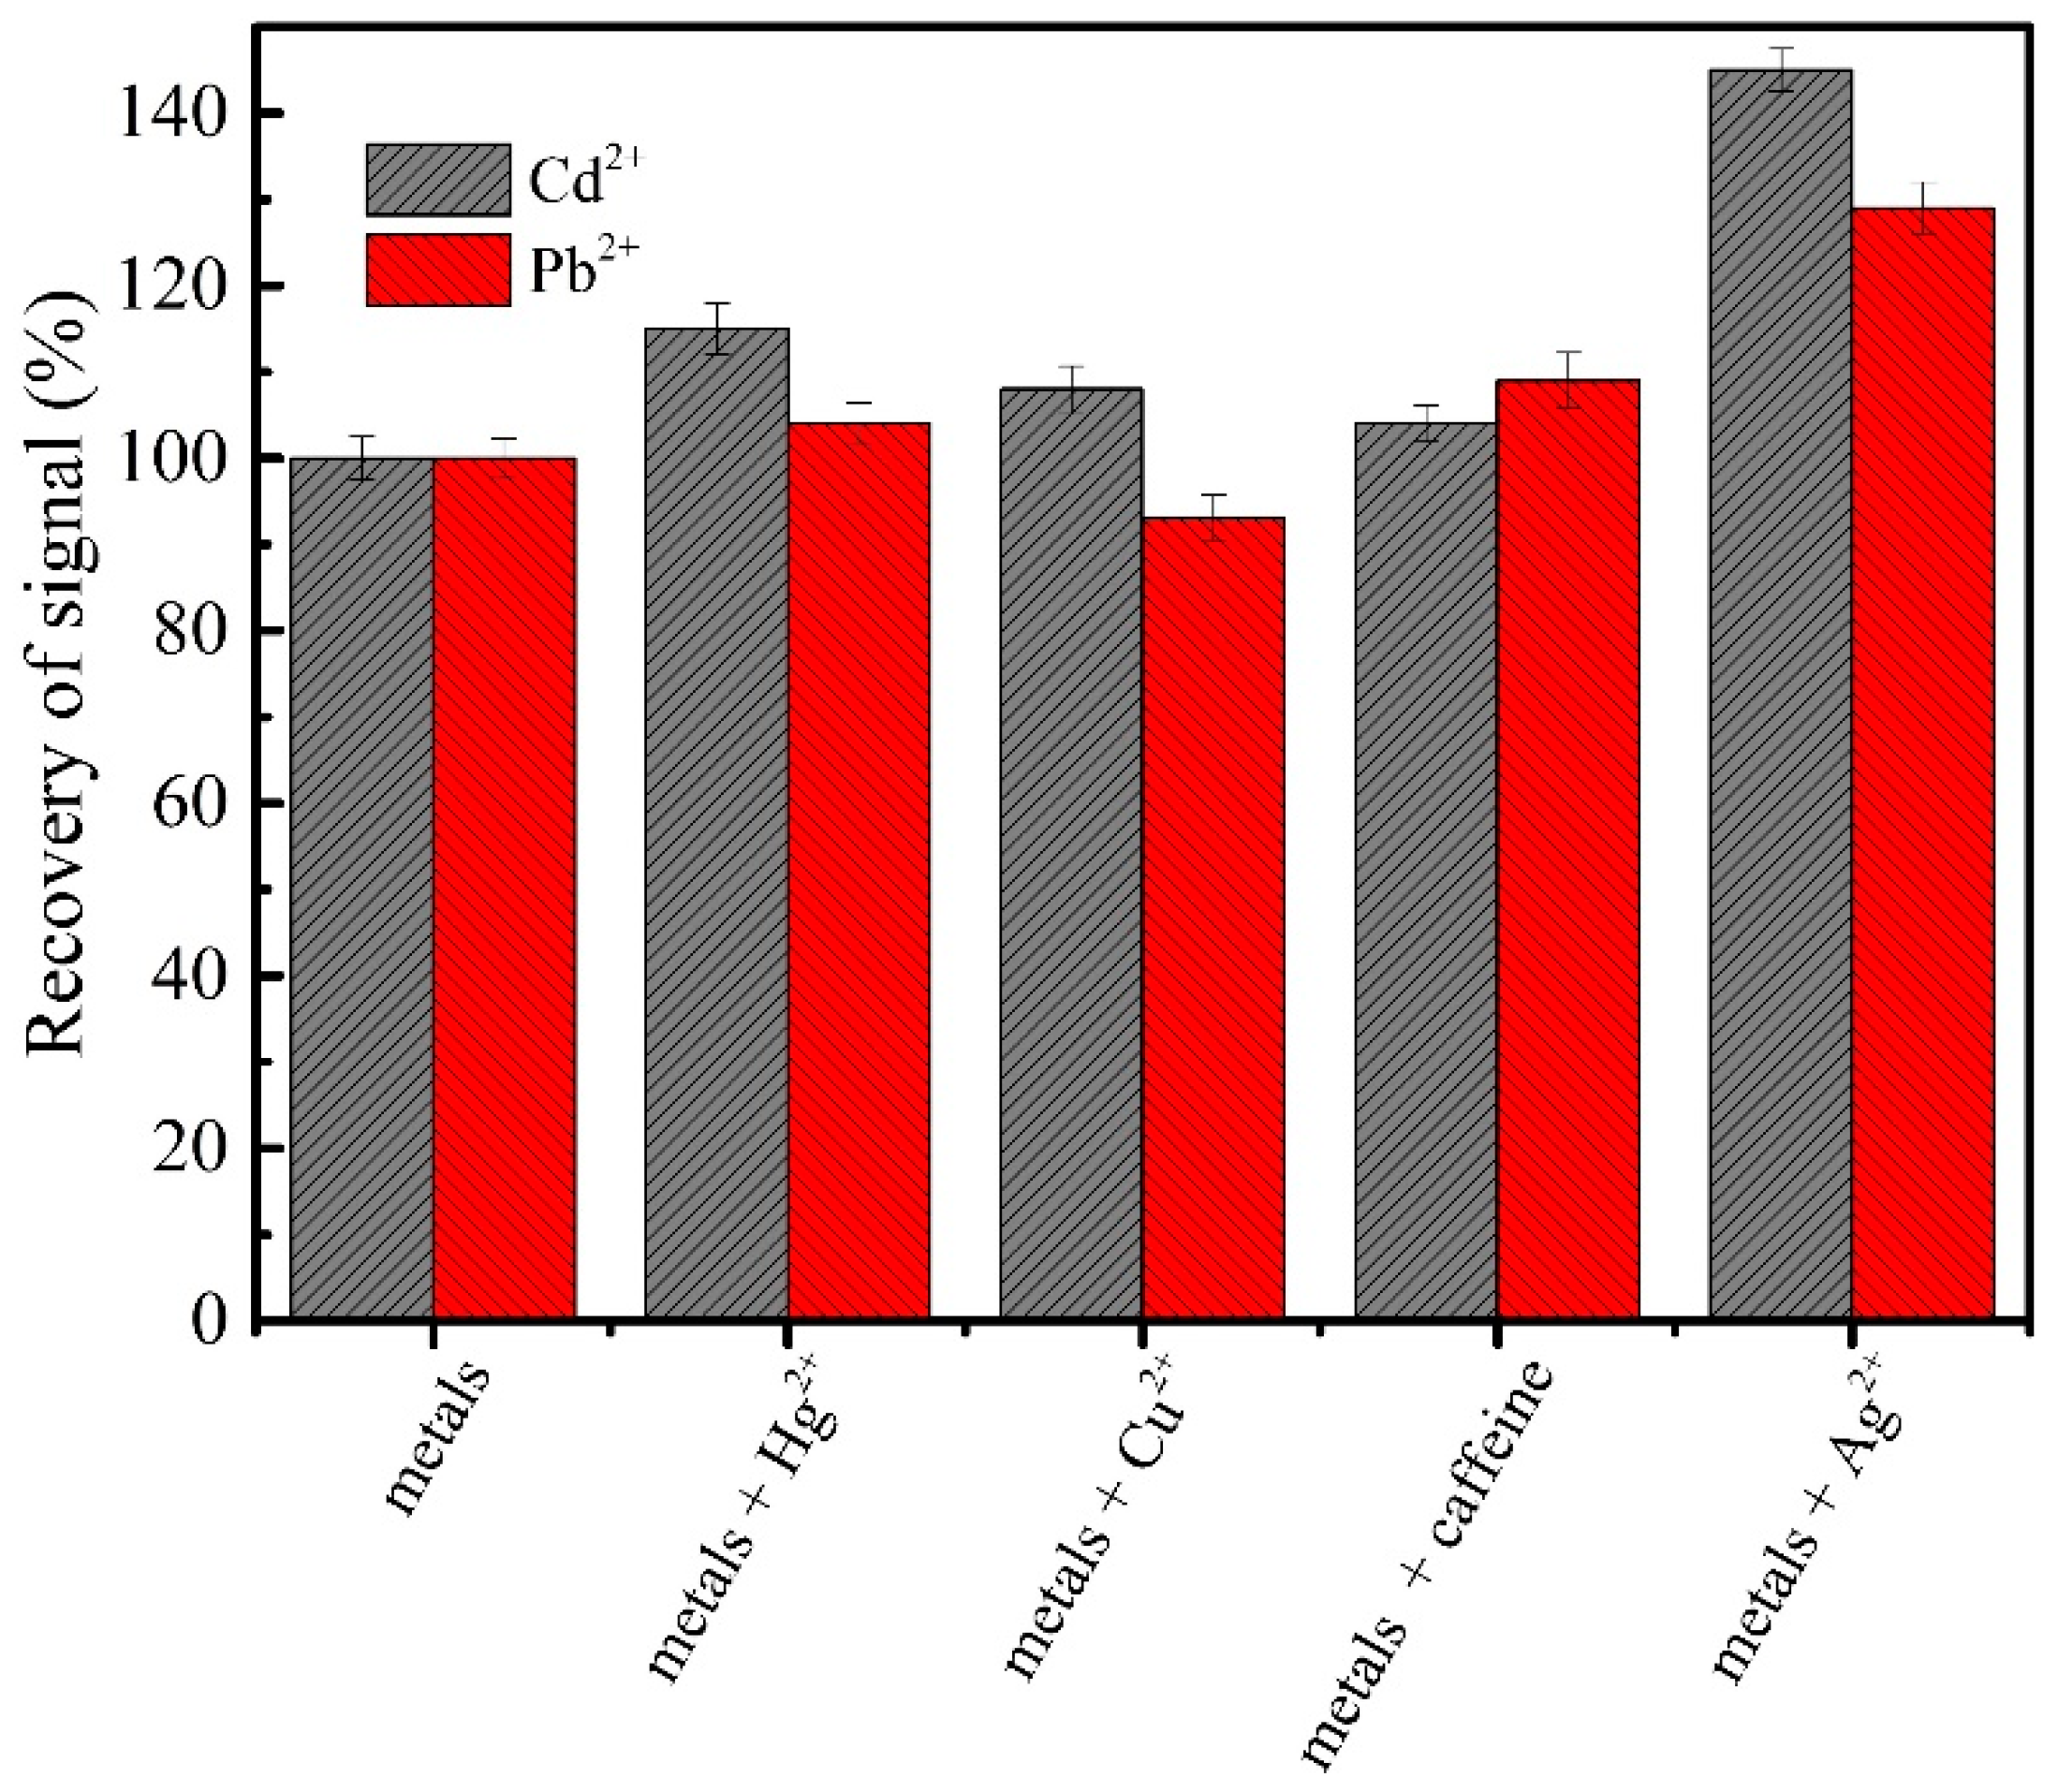
3.6. Interference Study

In aromatic beverages, such as chamomile tea, some common interferents may be present. Thus, the recovery signal of the voltammetric response for Cd2+ and Pb2+ was tested in the absence and the presence of 1.0 µmol L−1 of some common interferents.
Caffeine, an alkaloid, is one of the most common components in tea [44]; as the proposed analytical method does not incinerate/destroy the organic molecules in the matrix, its effect on the metal signal was evaluated. The interfering caffeine did not shift drastically and influence the response for both metals, holding a deviation of ±10% from the original signal.
The matrix evaluated was prepared using drinking water, which may contain Hg2+ and Cu2+ ions [45]. When tested, however, both ions had similar behavior as caffeine and did not influence significantly the signal of Cd2+ and Pb2+.
Although Ag2+ ions are not a common inorganic contaminant in tea samples, it has an incisive influence on the oxidation processes for both metals, exceeding ±20% from the original signal. The results are presented in Figure 7.

3.7. Real Samples Analysis

Table 3 summarizes the results for the detection of Cd2+ and Pb2+ in the chamomile tea sample (infusion). For the detection of both metals, 5 mL of the previously prepared tea was diluted in 15 mL of PBS (pH 3.0), this solution was enriched with 0.5 µmol L−1 of both metals. The determination was conducted using the standard addition method by spiking the sample with metal standards.
According to the results, there was not a significant difference between the added and found concentrations of Cd2+ and Pb2+, the relative errors within ±10% range. Based on these results, the proposed GC/rGO-SbNPs could be used for the selective detection of the metals in tea samples.

4. Conclusions

In this study, an rGO-SbNPs nanocomposite was designed and tested in the selective detection of Cd2+ and Pb2+. Both individual and simultaneous determination of heavy metal ions were investigated. The proposed sensor showed good limits of detection compared to similar methodologies reported in the literature. Furthermore, the GC/rGO-SbNPs electrode presented a practical application on the detection of heavy metal ions in a complex matrix, such as chamomile tea. The SWASV experiments did not reveal significant influence on the signals of Cd2+ and Pb2+, for a range of organic and inorganic interferents. Therefore, the developed work fills a gap in the development of electroanalytical devices towards metals detection in complex matrices.

Author Contributions

Conceptualization, I.C.; Data curation, M.K.L.S.; Formal analysis, E.W.N. and M.K.L.S.; Funding acquisition, I.C.; Investigation, E.W.N. and M.K.L.S.; Methodology, M.K.L.S.; Project administration, I.C.; Resources, I.C.; Supervision, I.C.; Writing—original draft, E.W.N. and M.K.L.S.; Writing—review & editing, I.C. All authors have read and agreed to the published version of the manuscript.

Funding

This research received funding from Fapesp process (2018/09053-3) and the APC was funded by Fapesp process (2017/24274-3).

Conflicts of Interest

The authors declare no conflicts of interests.

References

  1. Tchounwou, P.B.; Yedjou, C.G.; Patlolla, A.K.; Sutton, D.J. Heavy metal toxicity and the environment. Exp. Suppl. 2012, 101, 133–164. [Google Scholar]
  2. Chen, Y.; Wang, C.; Wang, Z. Residues and source identification of persistent organic pollutants in farmland soils irrigated by effluents from biological treatment plants. Environ. Int. 2005, 31, 778–783. [Google Scholar] [CrossRef] [PubMed]
  3. Kachenko, A.G.; Singh, B. Heavy metals contamination in vegetables grown in urban and metal smelter contaminated sites in Australia. Water Air Soil Pollut. 2006, 169, 101–123. [Google Scholar] [CrossRef]
  4. Alloway, B.J. Sources of Heavy Metals and Metalloids in Soils. In Heavy Metals in Soils; Springer: Amsterdam, The Netherlands, 2013; pp. 11–50. [Google Scholar]
  5. Rattan, R.K.; Datta, S.P.; Chhonkar, P.K.; Suribabu, K.; Singh, A.K. Long-term impact of irrigation with sewage effluents on heavy metal content in soils, crops and groundwater—A case study. Agric. Ecosyst. Environ. 2005, 109, 310–322. [Google Scholar] [CrossRef]
  6. Morel, F.M.M.; Kraepiel, A.M.L.; Amyot, M. The chemical cycle and bioaccumulation of mercury. Annu. Rev. Ecol. Syst. 1998, 29, 543–566. [Google Scholar] [CrossRef] [Green Version]
  7. Volesky, B.; Holan, Z.R. Biosorption of Heavy Metals. Biotechnol. Prog. 1995, 11, 235–250. [Google Scholar] [CrossRef] [PubMed]
  8. Bower, J.J.; Leonard, S.S.; Shi, X. Conference overview: Molecular mechanisms of metal toxicity and carcinogenesis. Mol. Cell. Biochem. 2005, 279, 3–15. [Google Scholar] [CrossRef]
  9. Järup, L. Hazards of heavy metal contamination. Br. Med. Bull. 2003, 68, 167–182. [Google Scholar] [CrossRef] [Green Version]
  10. Zhou, S.; Luoma, S.E.; St. Armour, G.E.; Thakkar, E.; Mackay, T.F.C.; Anholt, R.R.H. A drosophila model for toxicogenomics: Genetic variation in susceptibility to heavy metal exposure. PLoS Genet. 2017, 13, e1006907. [Google Scholar] [CrossRef] [Green Version]
  11. Shahbandeh, M. Tea Production and Exports Worldwide, 2018|Statista. Available online: https://www.statista.com/statistics/264183/global-production-and-exports-of-tea-since-2004/ (accessed on 26 June 2020).
  12. Bennetzen, J. Culturing better tea research. Nature 2019, 566, S5. [Google Scholar] [CrossRef] [Green Version]
  13. Srivastava, J.K.; Shankar, E.; Gupta, S. Chamomile: A herbal medicine of the past with a bright future (review). Mol. Med. Rep. 2010, 3, 895–901. [Google Scholar] [PubMed]
  14. McKay, D.L.; Blumberg, J.B. A review of the bioactivity and potential health benefits of chamomile tea (Matricaria recutita L.). Phyther. Res. 2006, 20, 519–530. [Google Scholar] [CrossRef] [PubMed]
  15. Kim, H.J.; Lee, W.; Yun, J.M. Luteolin Inhibits hyperglycemia-induced proinflammatory cytokine production and its epigenetic mechanism in human monocytes. Phyther. Res. 2014, 28, 1383–1391. [Google Scholar] [CrossRef] [PubMed]
  16. Sebai, H.; Jabri, M.A.; Souli, A.; Rtibi, K.; Selmi, S.; Tebourbi, O.; El-Benna, J.; Sakly, M. Antidiarrheal and antioxidant activities of chamomile (Matricaria recutita L.) decoction extract in rats. J. Ethnopharmacol. 2014, 152, 327–332. [Google Scholar] [CrossRef] [PubMed]
  17. Saeed Khan, S.; Najam, R.; Anser, H.; Riaz, B.; Alam, N. Chamomile tea: Herbal hypoglycemic alternative for conventional medicine. Pak. J. Pharm. Sci. 2014, 27, 1509–1514. [Google Scholar]
  18. Chaves, P.F.P.; Iacomini, M.; Cordeiro, L.M.C. Chemical characterization of fructooligosaccharides, inulin and structurally diverse polysaccharides from chamomile tea. Carbohydr. Polym. 2019, 214, 269–275. [Google Scholar] [CrossRef]
  19. Nováková, L.; Vildová, A.; Mateus, J.P.; Gonalves, T.; Solich, P. Development and application of UHPLC-MS/MS method for the determination of phenolic compounds in Chamomile flowers and Chamomile tea extracts. Talanta 2010, 82, 1271–1280. [Google Scholar] [CrossRef]
  20. Karak, T.; Bora, K.; Paul, R.K.K.; Das, S.; Khare, P.; Dutta, A.K.K.; Boruah, R.K.K. Paradigm shift of contamination risk of six heavy metals in tea (Camellia sinensis L.) growing soil: A new approach influenced by inorganic and organic amendments. J. Hazard. Mater. 2017, 338, 250–264. [Google Scholar] [CrossRef]
  21. Vulcano, I.R.C.; Silveira, J.N.; Alvarez-Leite, E.M. Teores de chumbo e cádmio em chás comercializados na região metropolitana de Belo Horizonte. Rev. Bras. Ciências Farm. 2008, 44, 425–431. [Google Scholar] [CrossRef] [Green Version]
  22. Brasil Ministério da Saúde Agência Nacional de Vigilância Sanitária; RDC 42/2013. Available online: http://bvsms.saude.gov.br/bvs/saudelegis/anvisa/2013/rdc0042_29_08_2013.html (accessed on 9 July 2020).
  23. Rashid, M.H.; Fardous, Z.; Chowdhury, M.A.Z.; Alam, M.K.; Bari, M.L.; Moniruzzaman, M.; Gan, S.H. Determination of heavy metals in the soils of tea plantations and in fresh and processed tea leaves: An evaluation of six digestion methods. Chem. Cent. J. 2016, 10, 7. [Google Scholar] [CrossRef] [Green Version]
  24. Li, L.; Fu, Q.L.; Achal, V.; Liu, Y. A comparison of the potential health risk of aluminum and heavy metals in tea leaves and tea infusion of commercially available green tea in Jiangxi, China. Environ. Monit. Assess. 2015, 187, 228. [Google Scholar] [CrossRef] [PubMed]
  25. Wang, J.; Shi, M.; Zheng, P.; Xue, S. Quantitative Analysis of Lead in Tea Samples by Laser-Induced Breakdown Spectroscopy. J. Appl. Spectrosc. 2017, 84, 188–193. [Google Scholar] [CrossRef]
  26. Lu, Y.; Liang, X.; Niyungeko, C.; Zhou, J.; Xu, J.; Tian, G.; Yuanyuan, L.; Xinqiang, L.; Niyungeko, C.; Junjie, Z.; et al. A review of the identification and detection of heavy metal ions in the environment by voltammetry. Talanta 2017, 178, 324–338. [Google Scholar] [CrossRef] [PubMed]
  27. Wang, J. Analytical Electrochemistry; John Wiley & Sons Inc.: Hoboken, NJ, USA, 2000; p. 232. ISBN 0471282723. [Google Scholar]
  28. Wallace, P.R. The band theory of graphite. Phys. Rev. 1947, 71, 622–634. [Google Scholar] [CrossRef]
  29. Dreyer, D.R.; Ruoff, R.S.; Bielawski, C.W. From conception to realization: An historial account of graphene and some perspectives for its future. Angew. Chem. Int. Ed. 2010, 49, 9336–9344. [Google Scholar] [CrossRef]
  30. Huang, K.J.; Niu, D.J.; Liu, X.; Wu, Z.W.; Fan, Y.; Chang, Y.F.; Wu, Y.Y. Direct electrochemistry of catalase at amine-functionalized graphene/gold nanoparticles composite film for hydrogen peroxide sensor. Electrochim. Acta 2011, 56, 2947–2953. [Google Scholar] [CrossRef]
  31. Cesarino, I.; Cincotto, F.H.; Machado, S.A.S. A synergistic combination of reduced graphene oxide and antimony nanoparticles for estriol hormone detection. Sens. Actuators B Chem. 2015, 210, 453–459. [Google Scholar] [CrossRef]
  32. Zhang, L.N.; Deng, H.H.; Lin, F.L.; Xu, X.W.; Weng, S.H.; Liu, A.L.; Lin, X.H.; Xia, X.H.; Chen, W. In situ growth of porous platinum nanoparticles on graphene oxide for colorimetric detection of cancer cells. Anal. Chem. 2014, 86, 2711–2718. [Google Scholar] [CrossRef]
  33. Silva, M.K.L.; Cesarino, I. Electrochemical sensor based on Sb nanoparticles/reduced graphene oxide for heavy metal determination. Int. J. Environ. Anal. Chem. 2020, 1–15. [Google Scholar] [CrossRef]
  34. Anderson, K. Analytical Techniques for Inorganic Contaminants; AOAC International: Rockville, MD, USA; Gaithersburg, MD, USA, 1999; p. 193. ISBN 9780935584653. [Google Scholar]
  35. Hocevar, S.B.; Švancara, I.; Ogorevc, B.; Vytřas, K. Antimony film electrode for electrochemical stripping analysis. Anal. Chem. 2007, 79, 8639–8643. [Google Scholar] [CrossRef]
  36. Moraes, F.C.; Cesarino, I.; Cesarino, V.; Mascaro, L.H.; MacHado, S.A.S. Carbon nanotubes modified with antimony nanoparticles: A novel material for electrochemical sensing. Electrochim. Acta 2012, 85, 560–565. [Google Scholar] [CrossRef]
  37. da Silva, M.K.L.; Vanzela, H.C.; Defavari, L.M.; Cesarino, I. Determination of carbamate pesticide in food using a biosensor based on reduced graphene oxide and acetylcholinesterase enzyme. Sens. Actuators B Chem. 2018, 277, 555–561. [Google Scholar] [CrossRef] [Green Version]
  38. Wang, X.; Sun, J.; Tong, J.; Guan, X.; Bian, C.; Xia, S. Paper-based sensor chip for heavy metal ion detection by SWSV. Micromachines 2018, 9, 150. [Google Scholar] [CrossRef] [PubMed] [Green Version]
  39. Cesarino, I.; Cavalheiro, É.T.G.; Brett, C.M.A. Simultaneous determination of cadmium, lead, copper and mercury ions using organofunctionalized SBA-15 nanostructured silica modified graphite -polyurethane composite electrode. Electroanalysis 2010, 22, 61–68. [Google Scholar] [CrossRef]
  40. Wu, Y.; Yang, T.; Chou, K.C.; Chen, J.; Su, L.; Hou, X. The effective determination of Cd(II) and Pb(II) simultaneously based on an aluminum silicon carbide-reduced graphene oxide nanocomposite electrode. Analyst 2017, 142, 2741–2747. [Google Scholar] [CrossRef] [PubMed]
  41. Lee, P.M.; Chen, Z.; Li, L.; Liu, E. Reduced graphene oxide decorated with tin nanoparticles through electrodeposition for simultaneous determination of trace heavy metals. Electrochim. Acta 2015, 174, 207–214. [Google Scholar] [CrossRef]
  42. Sang, S.; Li, D.; Zhang, H.; Sun, Y.; Jian, A.; Zhang, Q.; Zhang, W. Facile synthesis of AgNPs on reduced graphene oxide for highly sensitive simultaneous detection of heavy metal ions. RSC Adv. 2017, 7, 21618–21624. [Google Scholar] [CrossRef] [Green Version]
  43. Liu, G.; Chen, J.; Hou, X.; Huang, W. A highly-sensitive electrochemical sensor for the simultaneous detection of Cd2+ and Pb2+ using liquid phase-exfoliated graphene. Anal. Methods 2014, 6, 5760–5765. [Google Scholar] [CrossRef]
  44. Wickremasinghe, R.L. Tea. In Advances in Food Research; Academic Press: Cambridge, MA, USA, 1978; pp. 229–286. [Google Scholar]
  45. Bansod, B.K.; Kumar, T.; Thakur, R.; Rana, S.; Singh, I. A review on various electrochemical techniques for heavy metal ions detection with different sensing platforms. Biosens. Bioelectron. 2017, 94, 443–455. [Google Scholar] [CrossRef]
Figure 1. Scanning electron microscopy coupled to an electron gun (FEG-SEM) micrographs obtained for the nanocomposites (a) reduced graphene oxide (rGO) and (b) rGO with antimony nanoparticles (rGO-SbNPs).
Chemosensors 08 00053 g001
Figure 2. Cyclic voltammetry experiment of rGO (dashed line) and rGO-SbNPs (solid line) in a 0.5 mol L−1 HCl solution.
Chemosensors 08 00053 g002
Figure 3. Square wave anodic stripping voltammetry (SWASV) data recorded in a PBS solution (0.1 mol L−1, pH 3.0) in the presence of 10.0 μmol L −1 of Cd2+ and Pb2+ for the electrodes: (a) GC, (b) GC/GO, (c) GC/rGO, and d) GC/rGO-SbNPs. Accumulation potential −1.0 V; accumulation time 120 s; frequency of 80 Hz and pulse amplitude of 90 mV.
Chemosensors 08 00053 g003
Figure 4. Effect of SbCl3 amount in the nanocomposite on the oxidation peak current of the Cd2+ (■) and Pb2+ (●).
Chemosensors 08 00053 g004
Figure 5. Simultaneous determination of both metals. (a) SWASV profiles recorded in a 0.1 mol L−1 PBS (pH 3.0) solution; (b) linear regression for Cd2+ (■) and Pb2+ (●) from 0.1 to 3.0 µmol L−1.
Chemosensors 08 00053 g005
Figure 6. Individual determination by SWASV for (a) Cd2+ in the range of 50 to 120 nmol L−1; (b) Pb2+ in the range of 5 to 60 nmol L−1. SWASV parameters were the same used for the simultaneous curves.
Chemosensors 08 00053 g006
Figure 7. Recovery of Cd2+ and Pb2+ (0.5 µmol L−1) signals in the absence and the presence of 1.0 µmol L−1 of common interferents.
Chemosensors 08 00053 g007
Table 1. Optimized SWASV parameters for the simultaneous determination of cadmium and lead ions using the GC/rGO/SbNPs electrode.
ParameterEvaluated RangeOptimized Value
Frequency10 to 90 Hz40 Hz
Pulse amplitude15 to 100 mV100 mV
Accumulation time45 to 150 s150 s
Deposition potential−1.3 to −0.8 V−1.2 V
pH of supporting electrolyte2.0 to 6.03.0
Table 2. Method of determination, equation of calibration curve, linear range, linearity and determined limits of detection (LOD) for the SWASV experiments.
MetalsMethodCalibration CurveLinear RangeR2LOD (nmol L−1)
Cd2+SimultaneousIpa = 0.64 + 3.06 CCd2+0.1–3.0 µmol L−10.990170.03
IndividualIpa = 3.45 + 0.09 CCd2+50–120 nmol L−10.996320.50
Pb2+SimultaneousIpa = 14.70 + 21.30 CPb2+0.1–3.0 µmol L−10.989845.50
IndividualIpa = 2.24 + 0.45 CPb2+5–60 nmol L−10.99322.01
Table 3. Results for the determination of Cd2+ and Pb2+ unfused sample of chamomile tea by SWASV proposed.
MetalsAdded (µmol L−1)Recovery (µmol L−1)Error (%) 1
Cd2+0.50.4874−2.6
0.53767.0
0.51523.0
Mean ± SD0.5134 ± 0.0250
Pb2+0.50.51593.1
0.4976−0.5
0.50851.7
Mean ± SD0.5073 ± 0.0090
1 Error: SWASV vs. added (SWASV-added/added) × 100%.

