Chemical and Temperature Sensors Based on Functionalized Reduced Graphene Oxide


Abstract

1. Introduction
2. Experimental
2.1. Materials
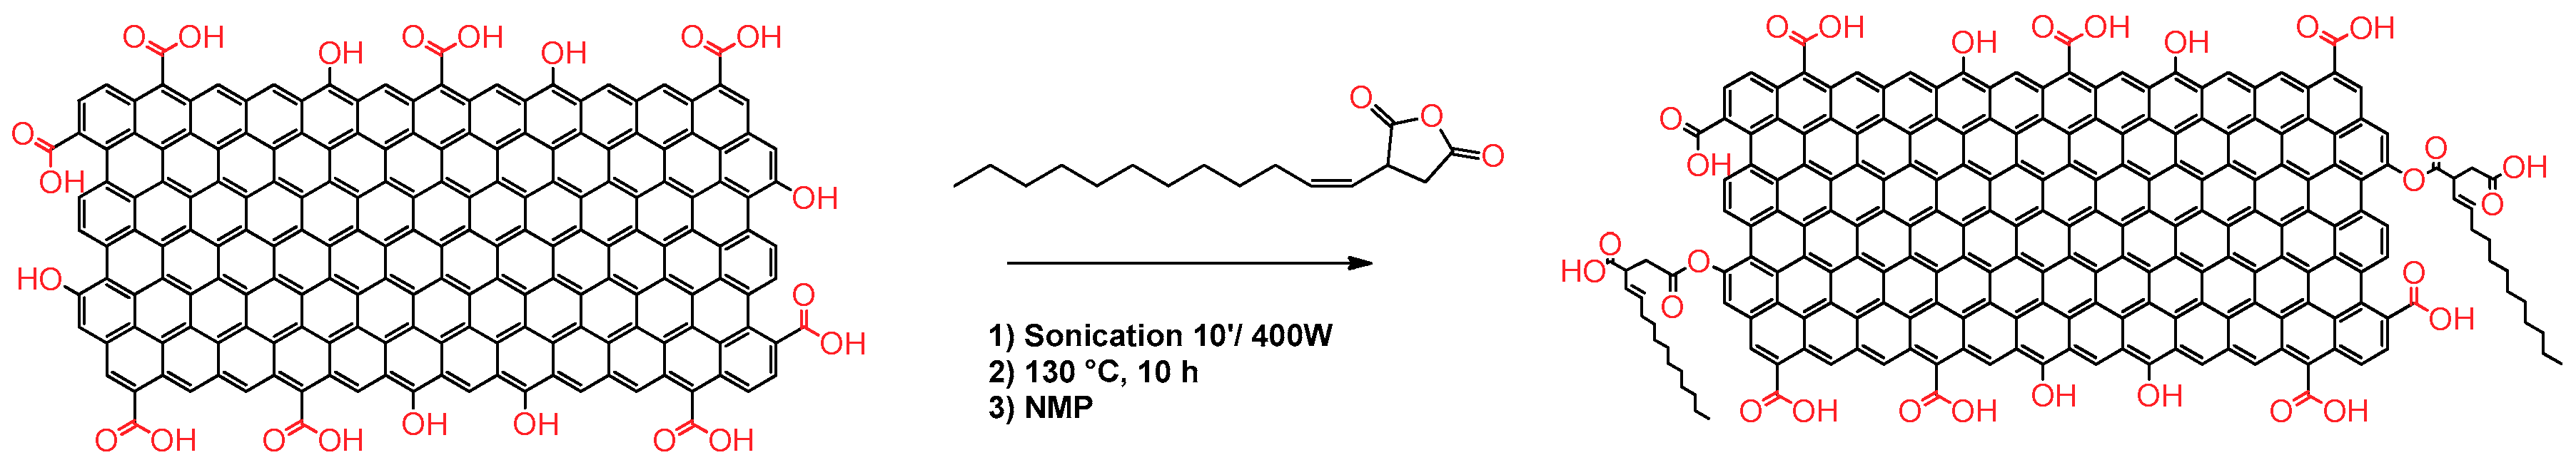
2.2. rGO Chemical Functionalization
2.3. Preparation of the rGO Dispersions and Setup Preparation for the Resistive Measurements
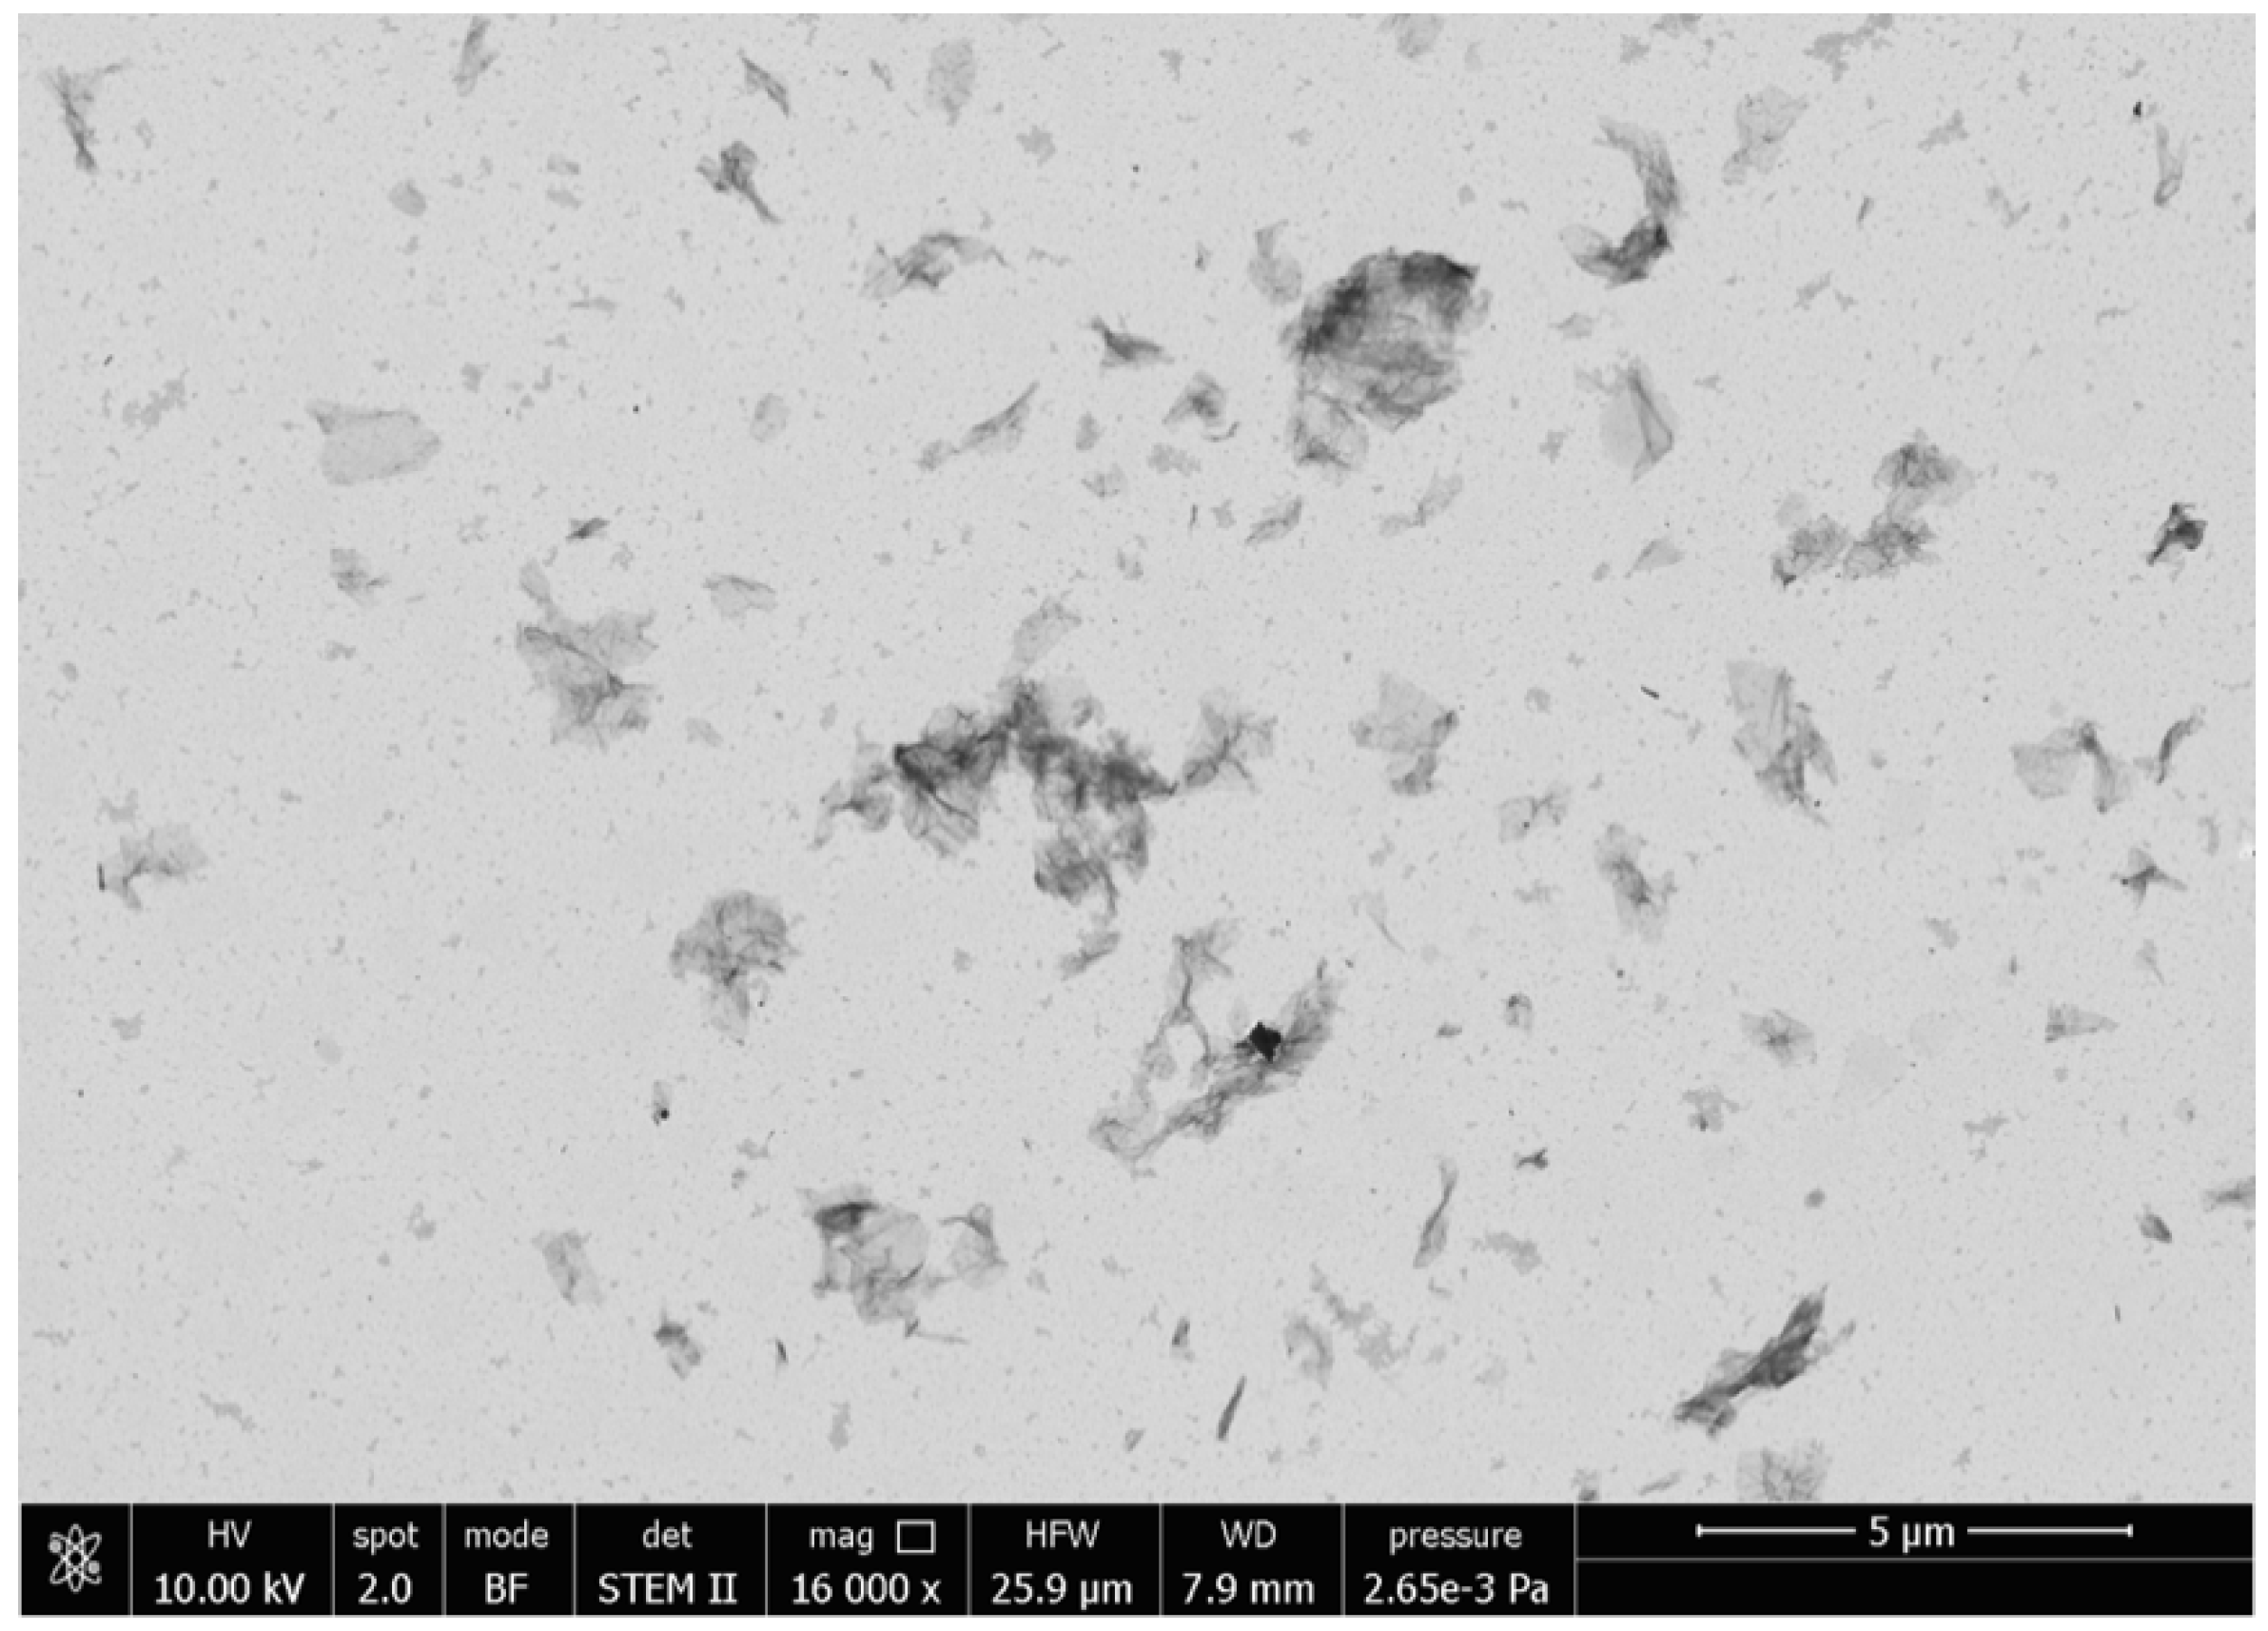
2.4. Characterization
3. Result and Discussion
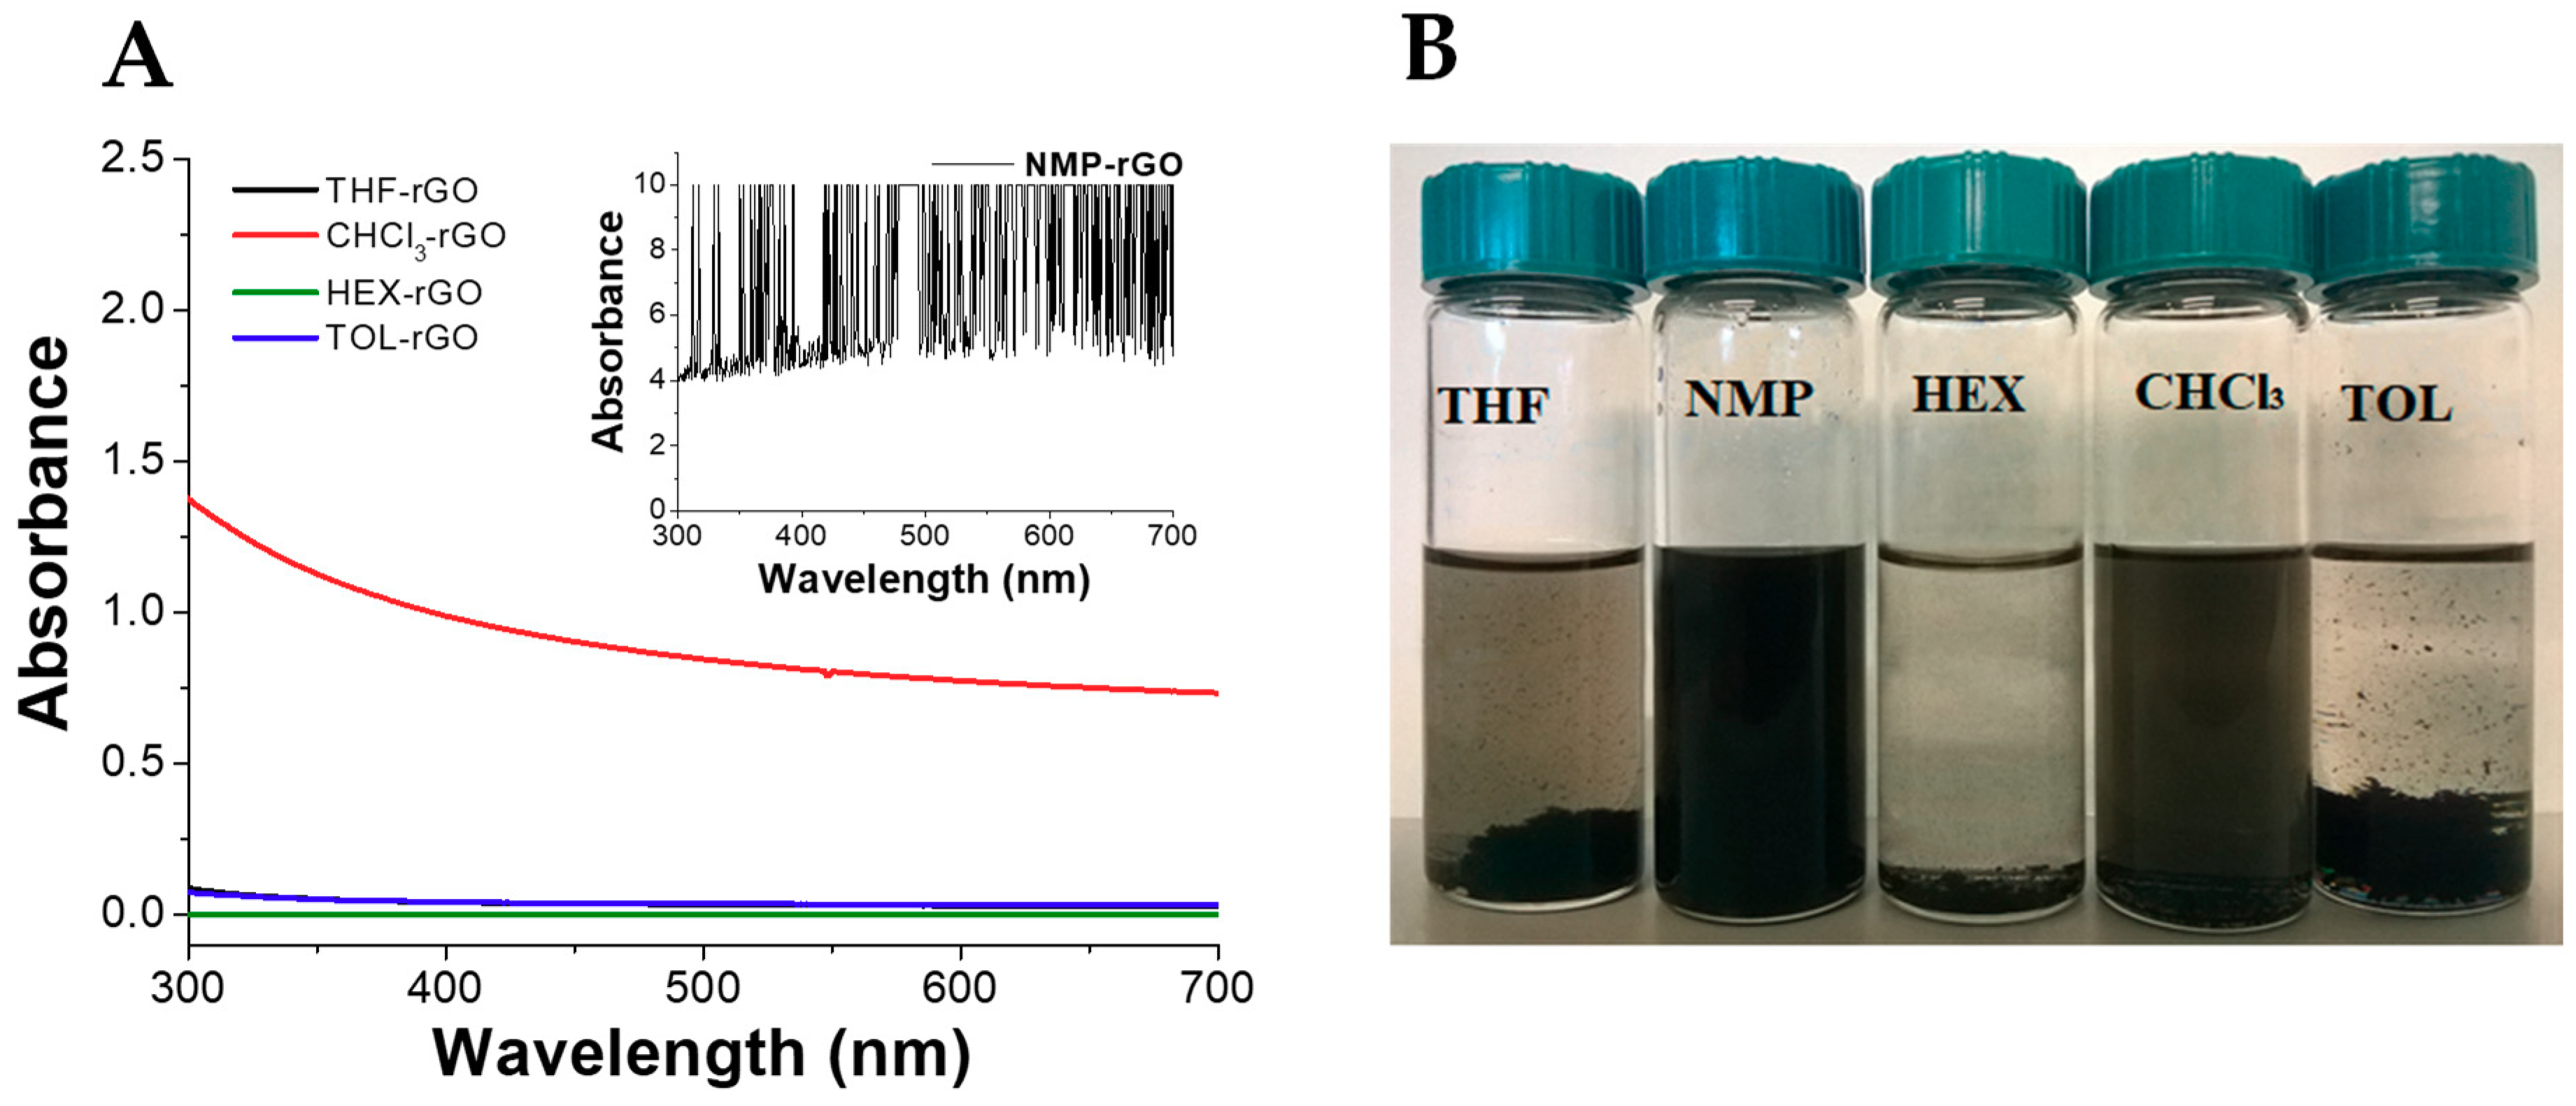
3.1. Dispersion of Reduced Graphene Oxide (rGO) in Organic Solvents
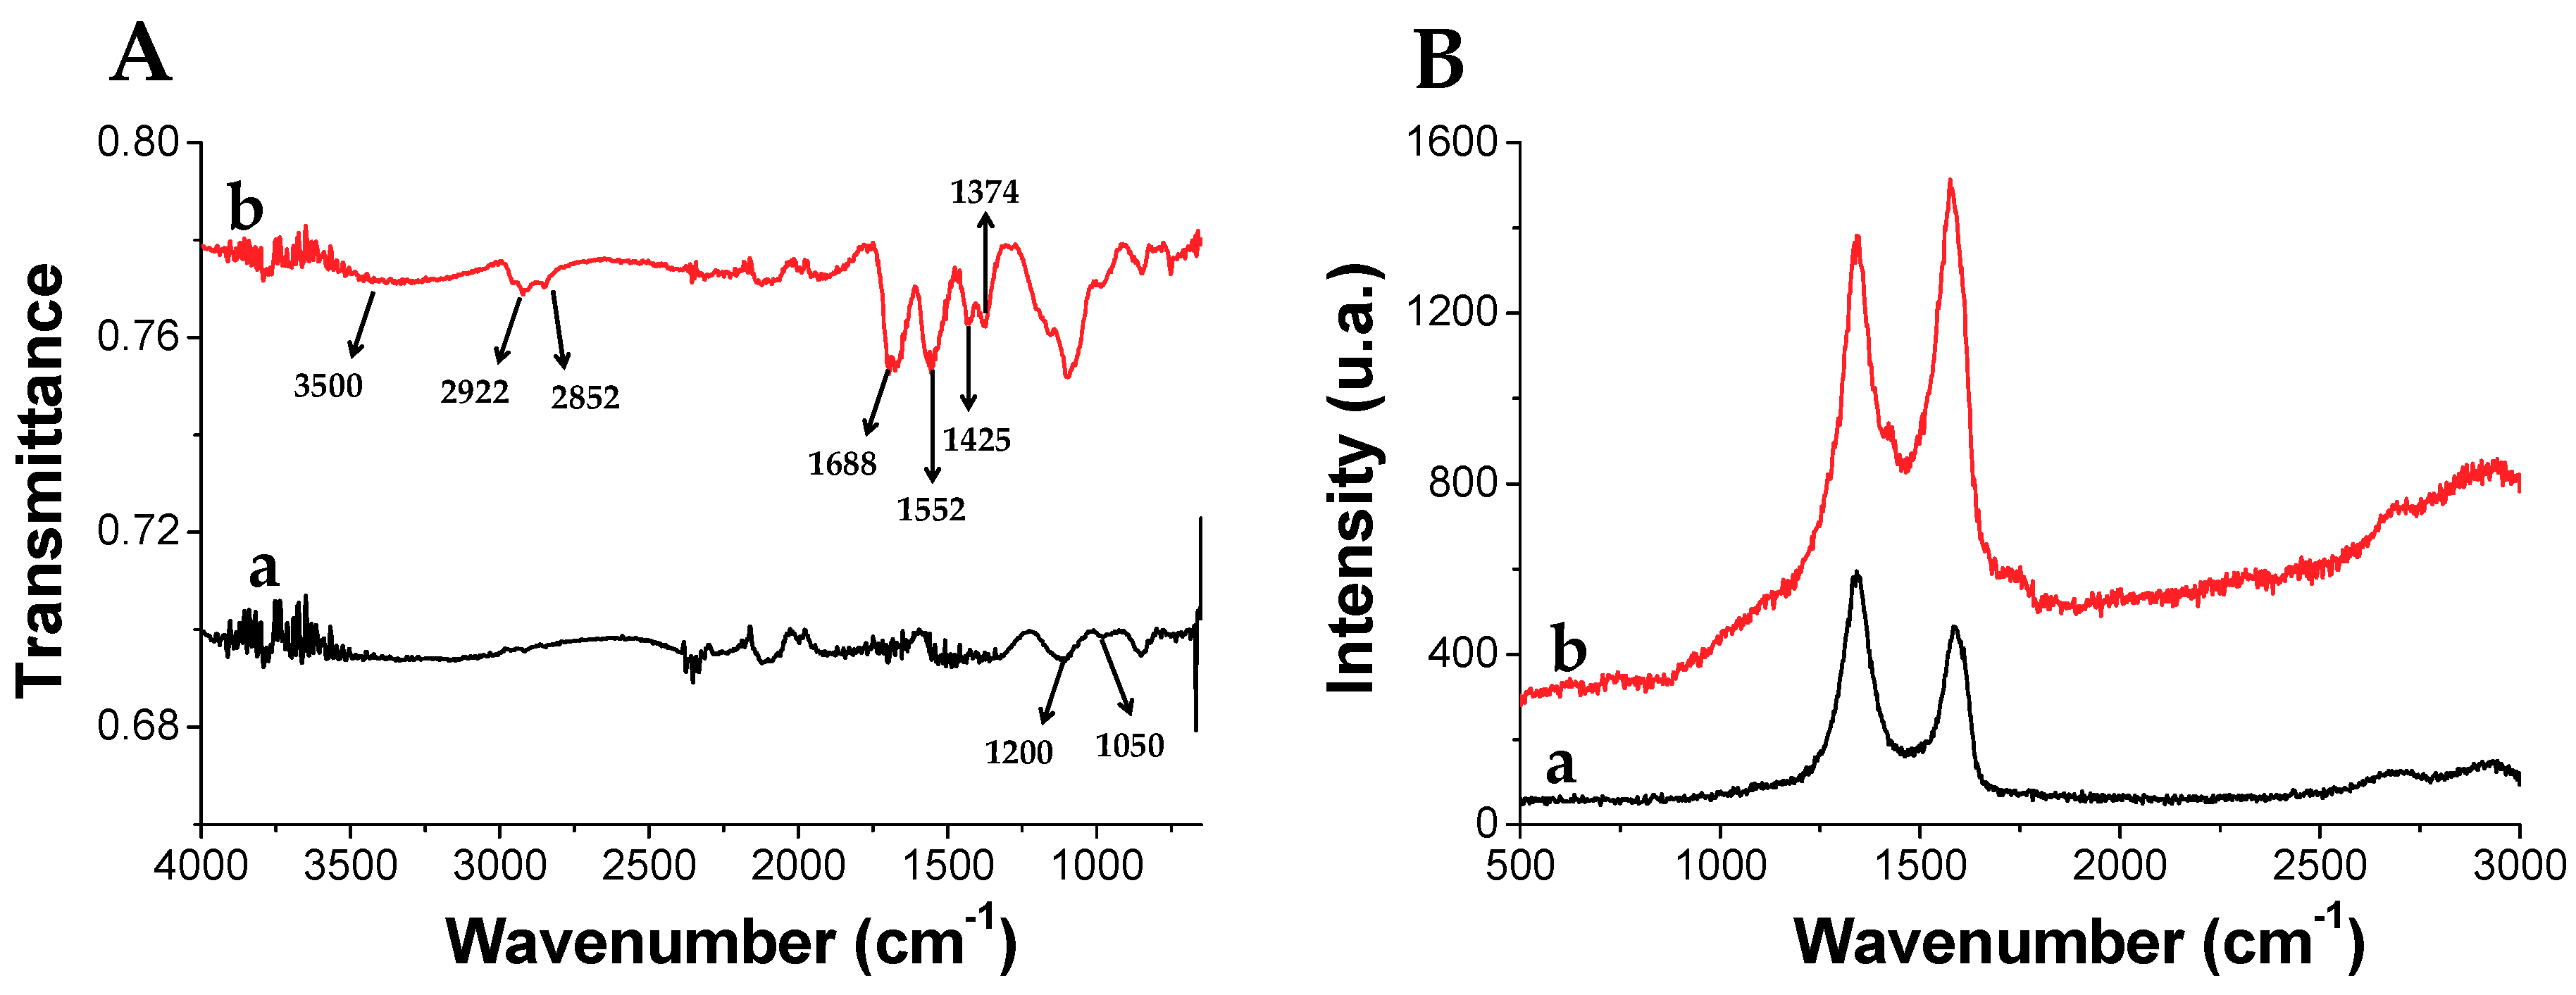
3.2. rGO Functionalization with 3-(Dodecen-1-yl) Succinic Anhydride (TPSA) and Dispersion in Organic Solvents
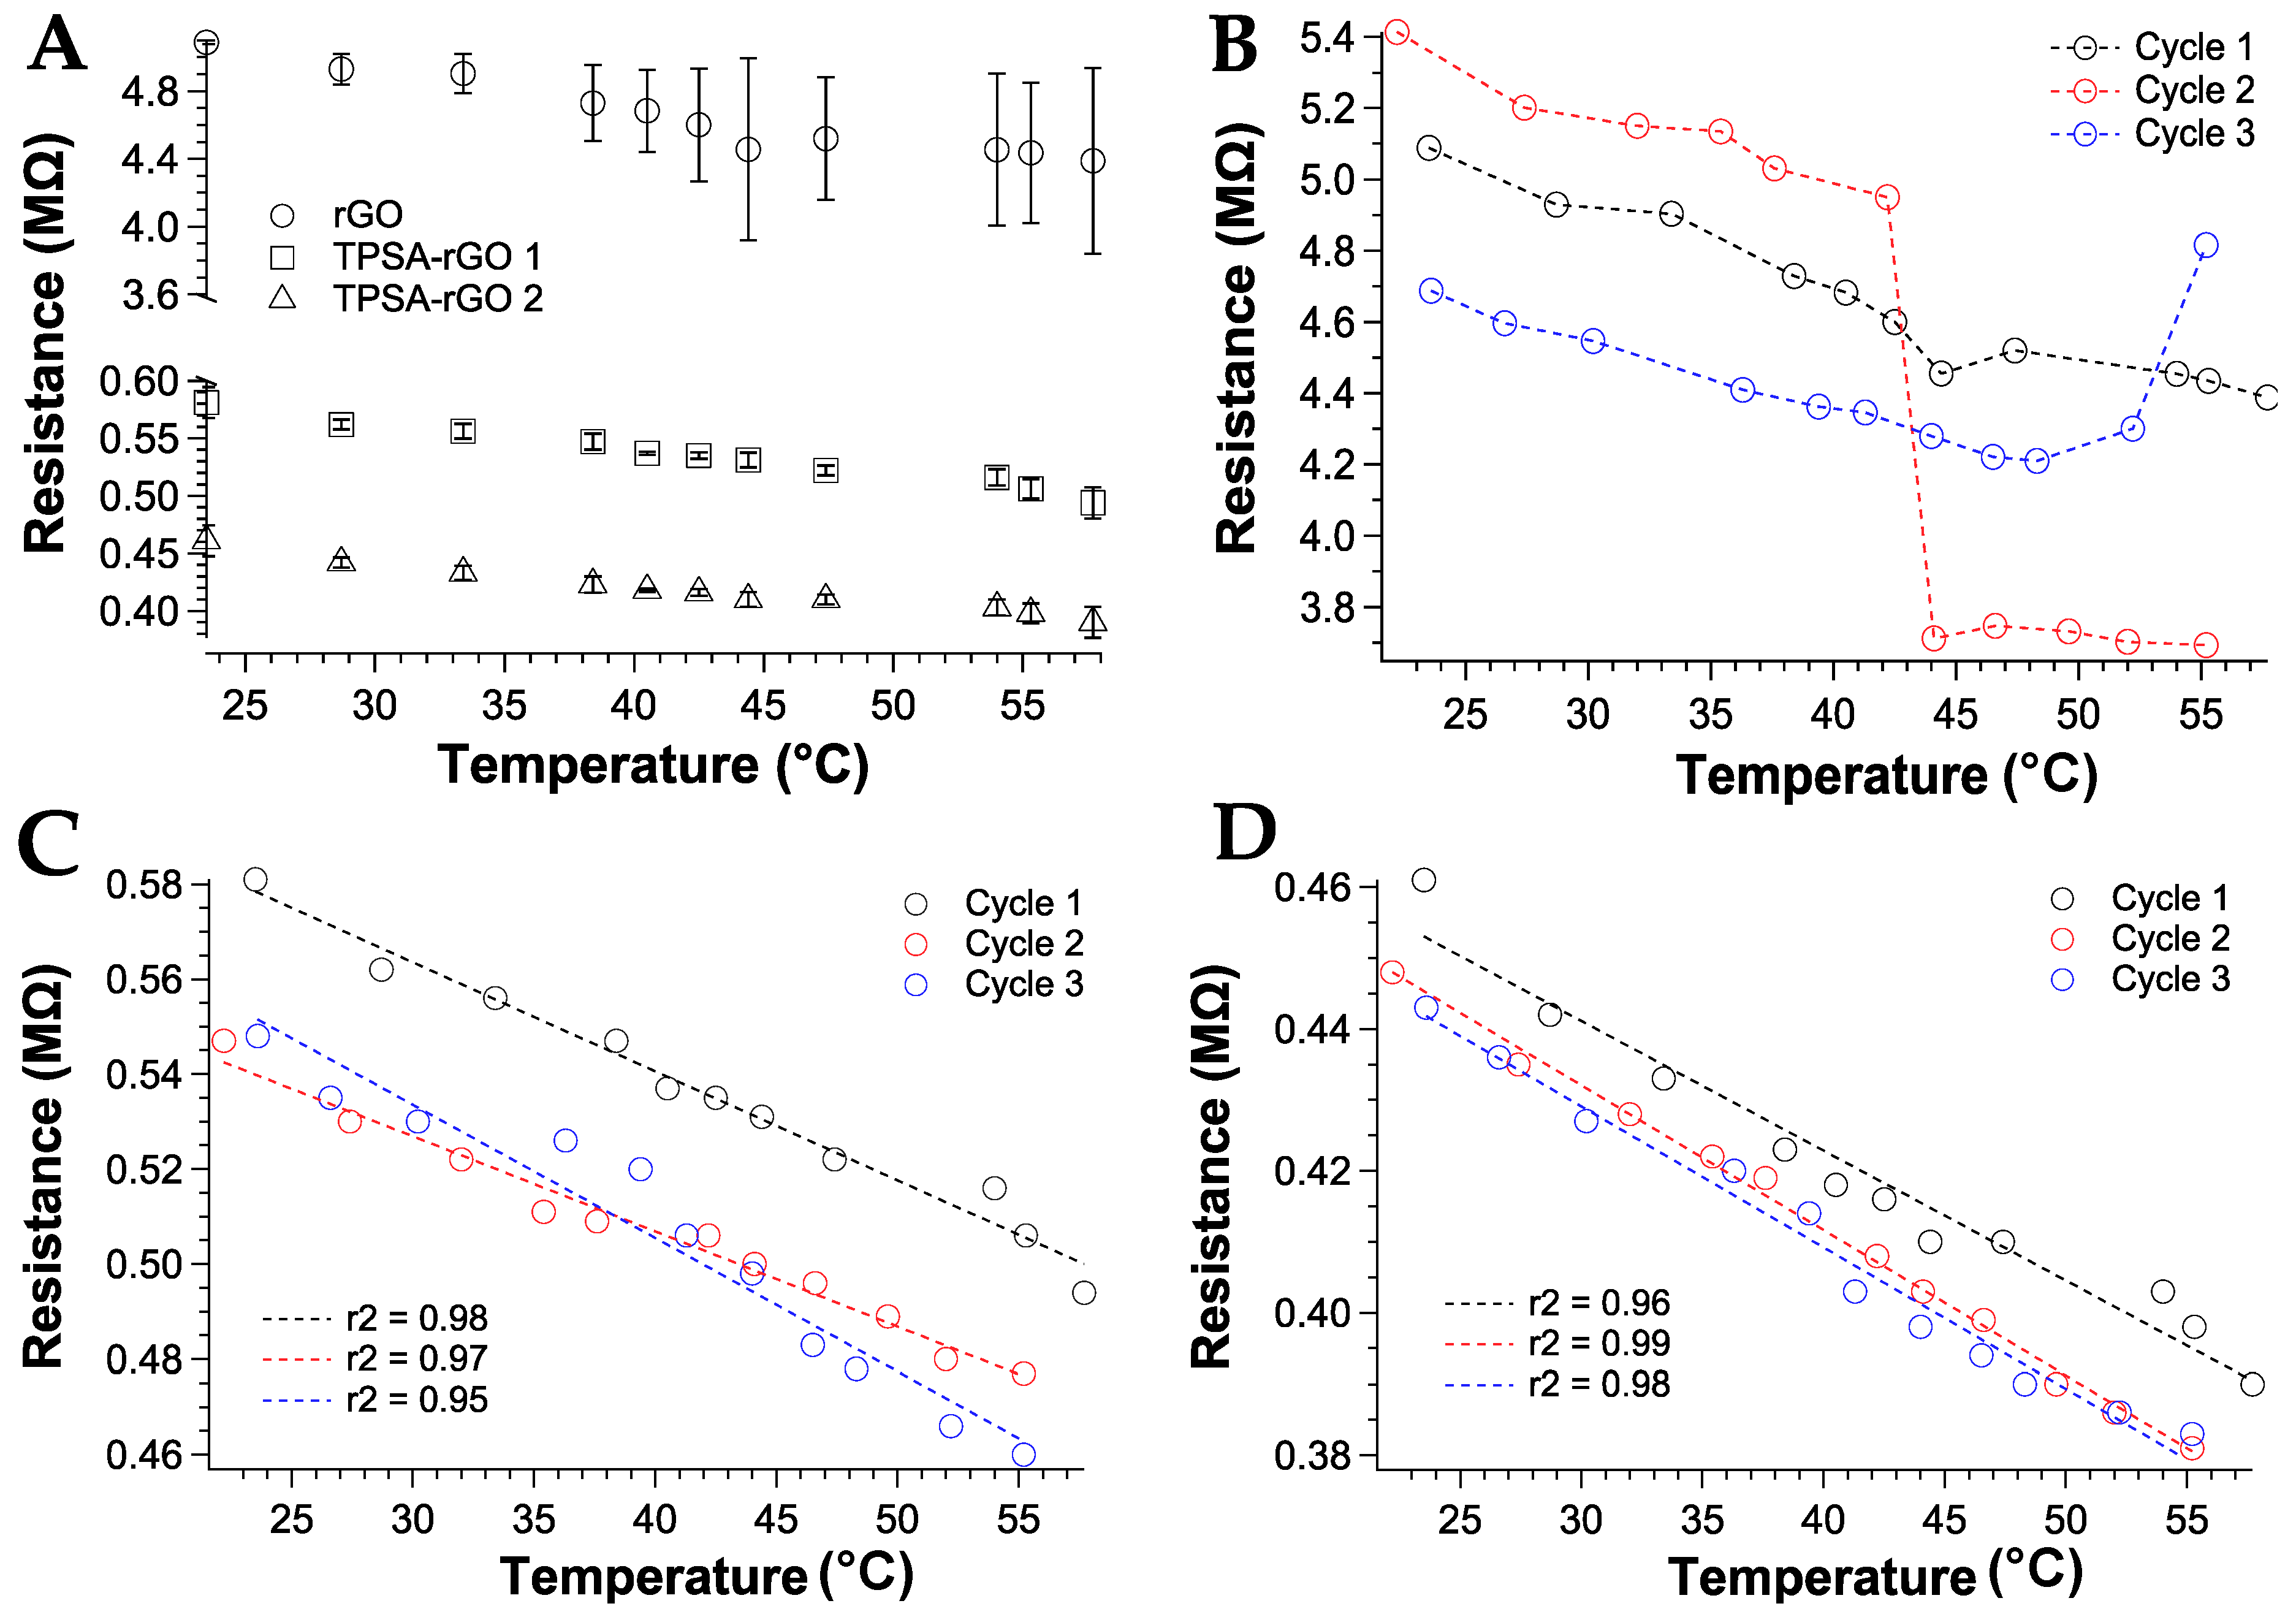
3.3. Resistive Properties of TPSA-rGO and rGO as a Function of Temperature
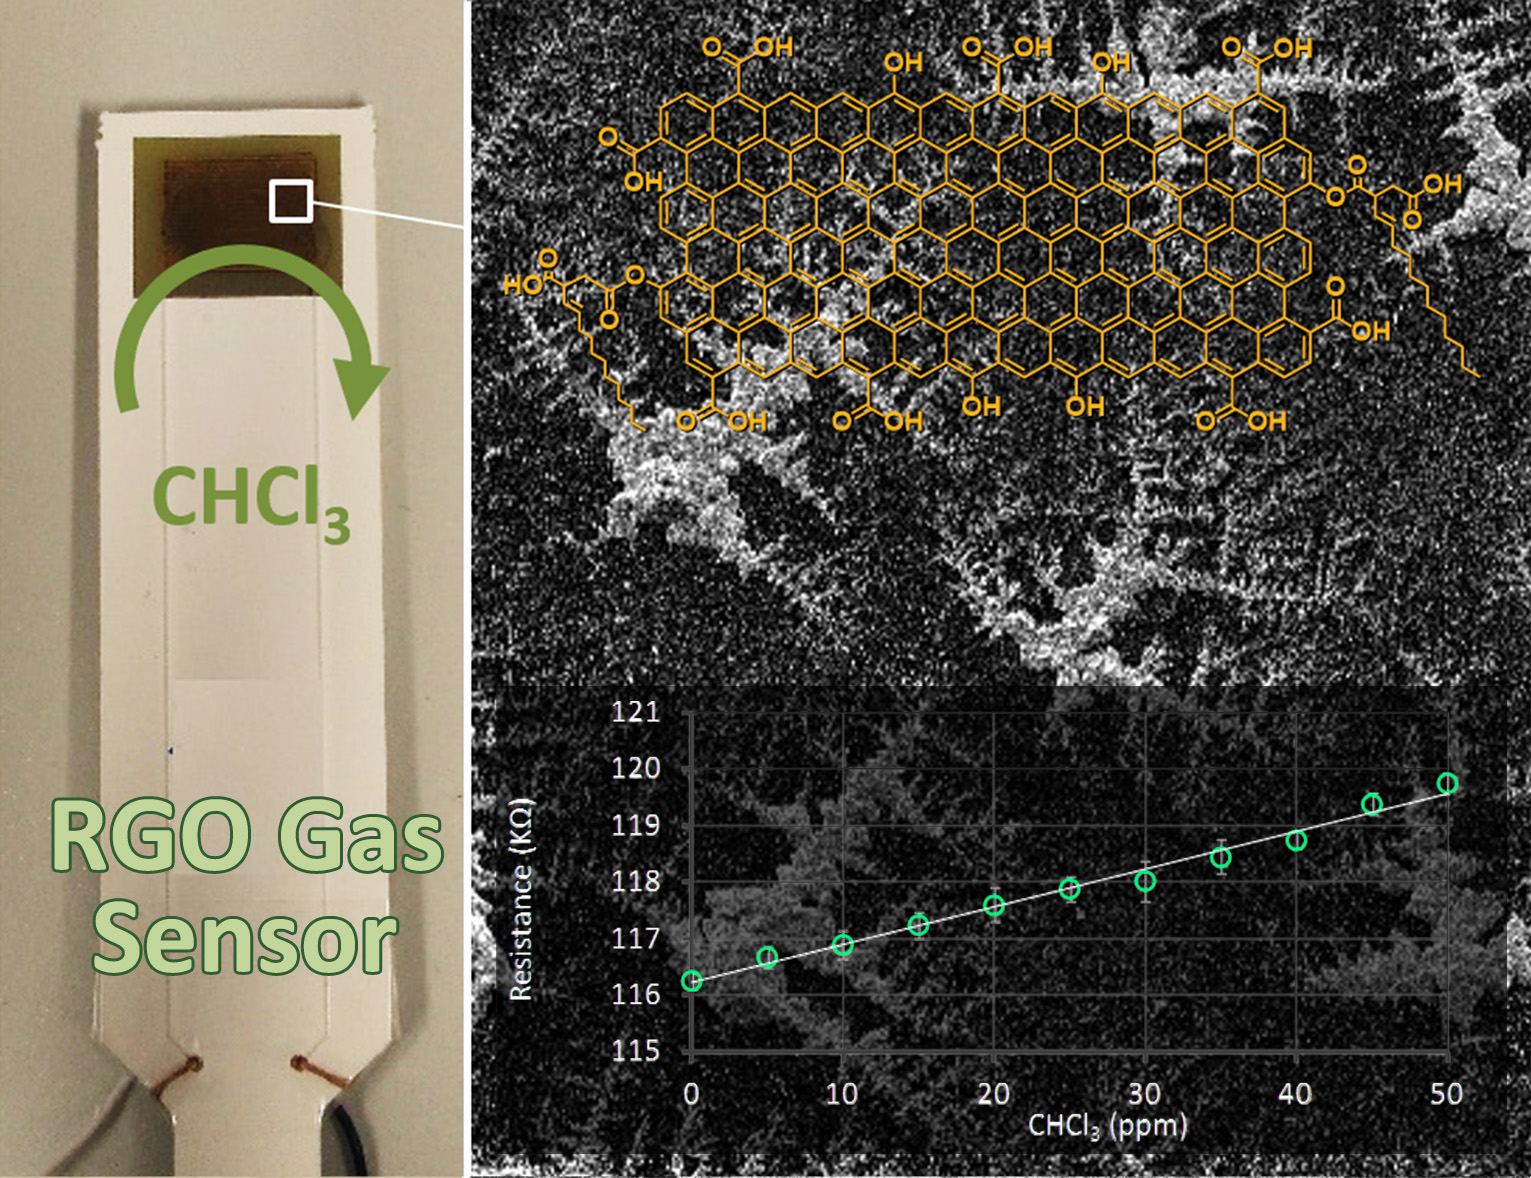
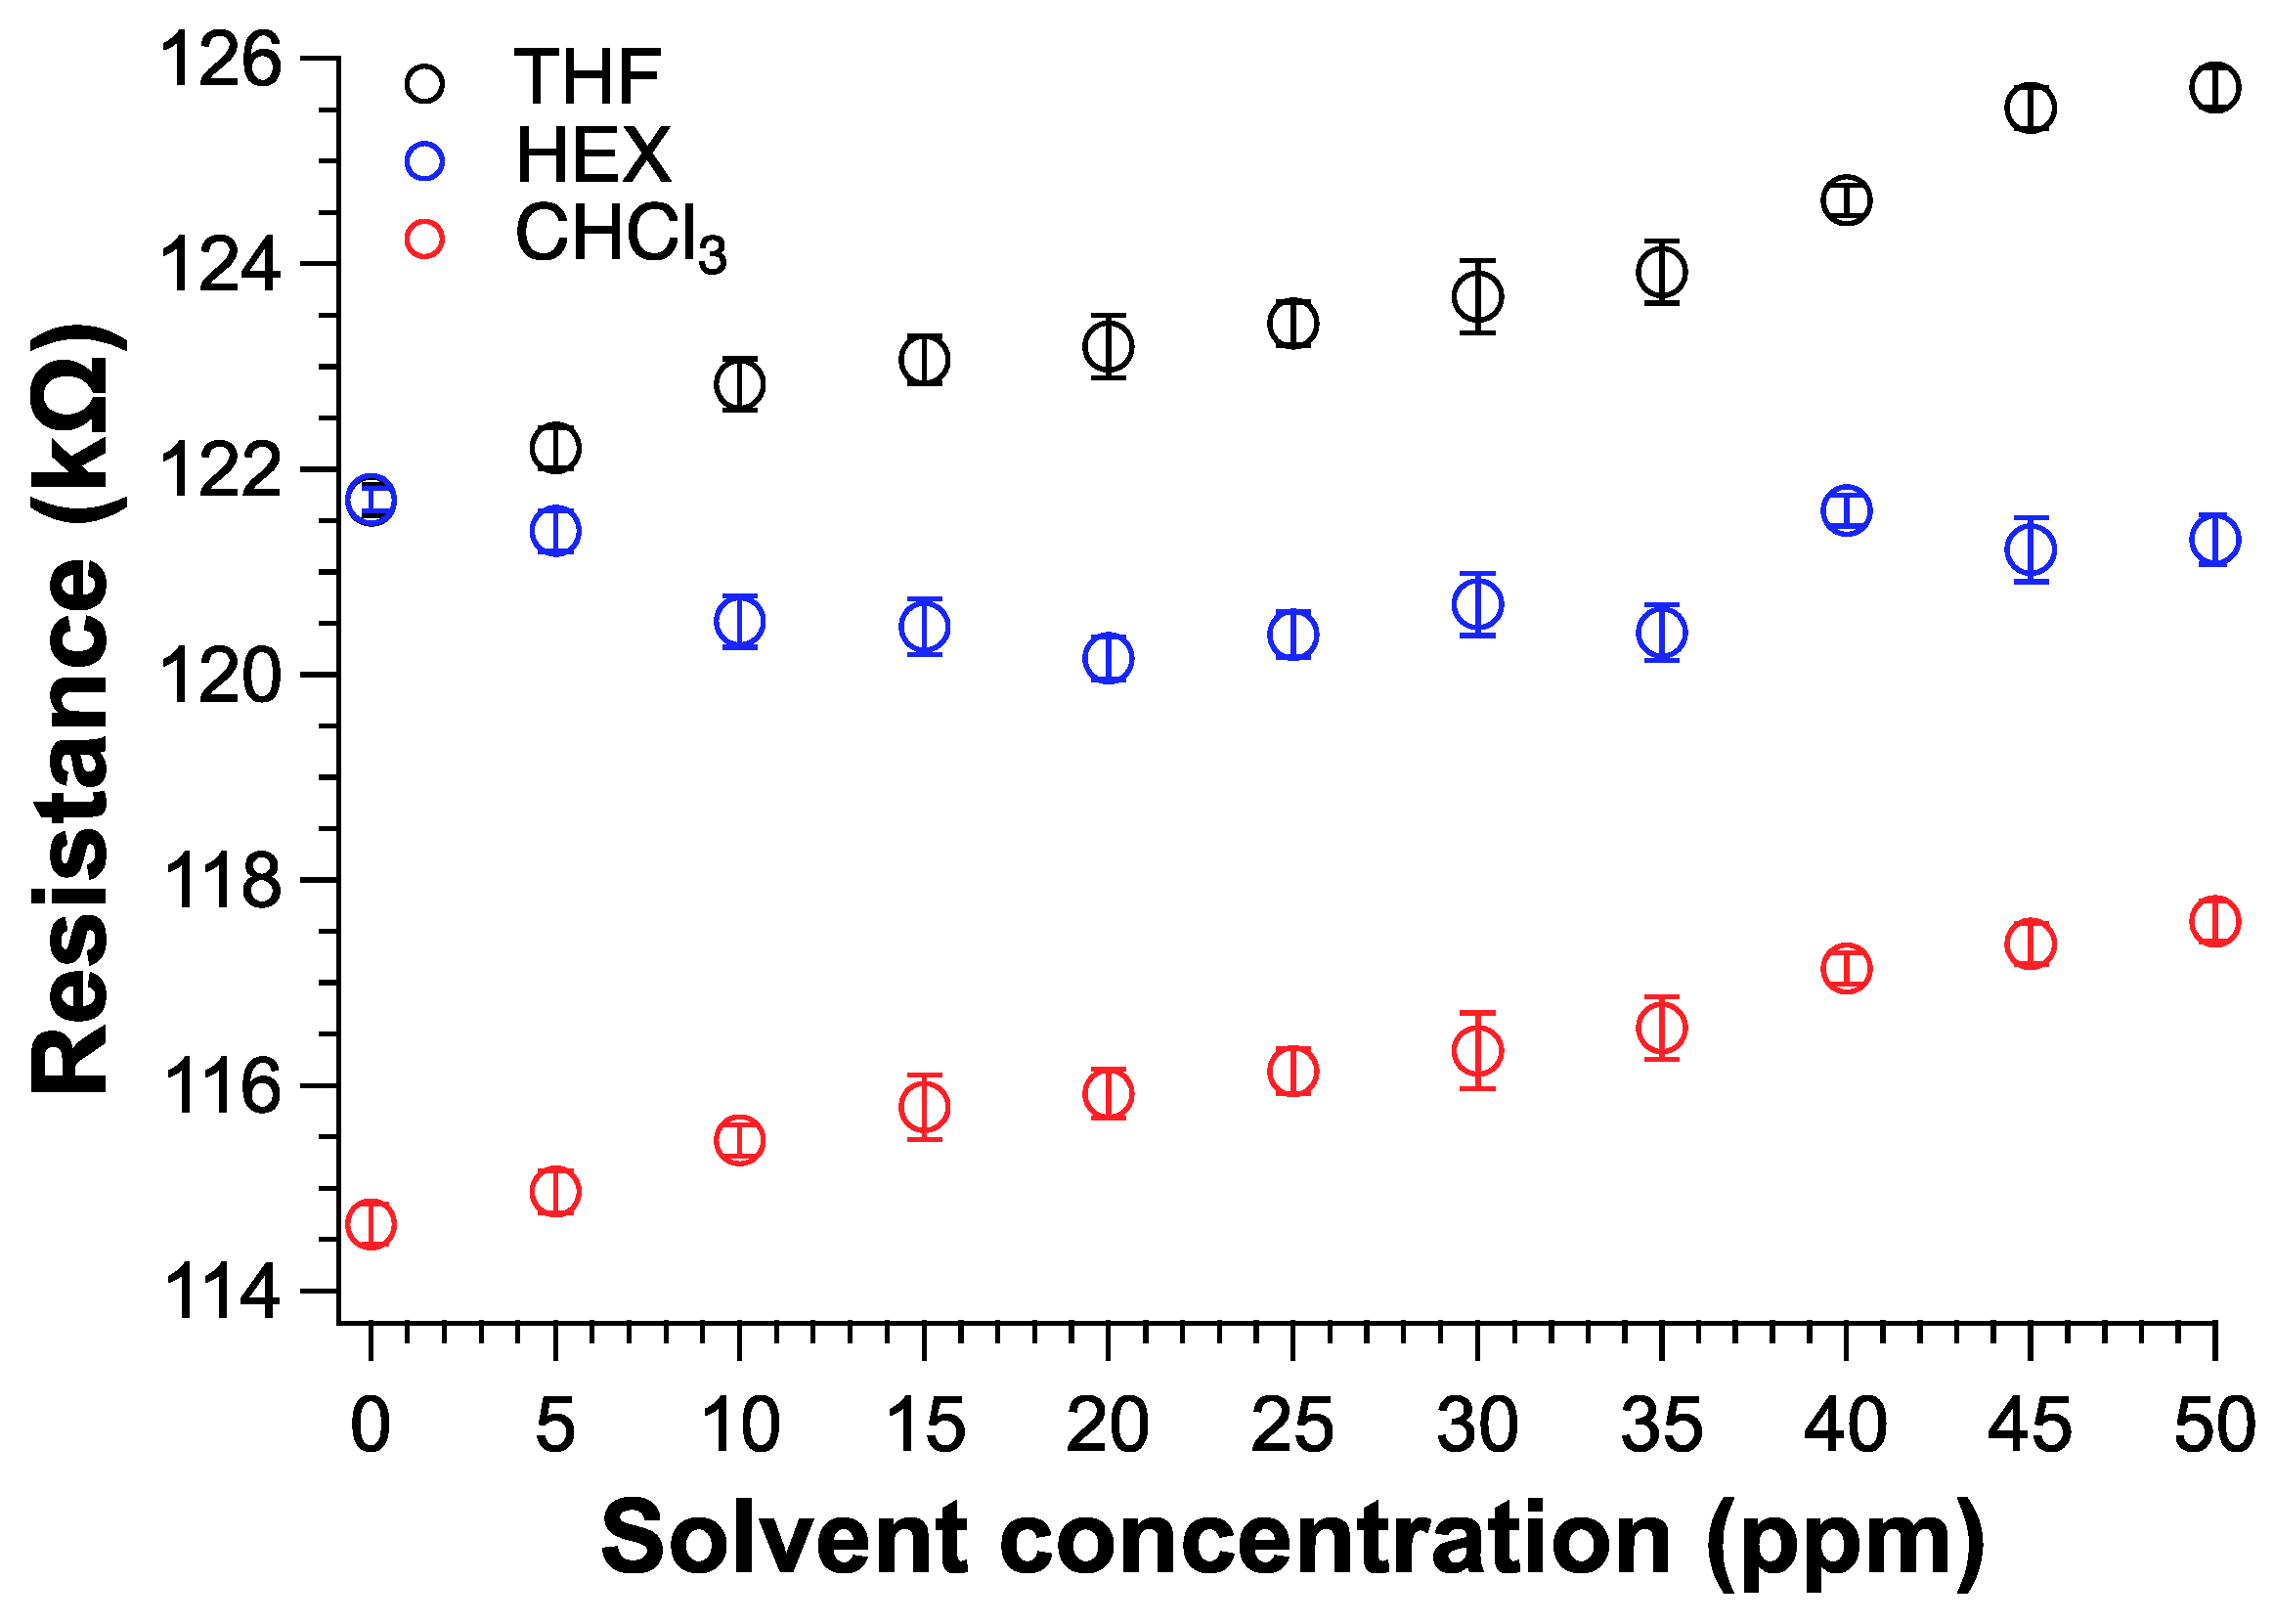
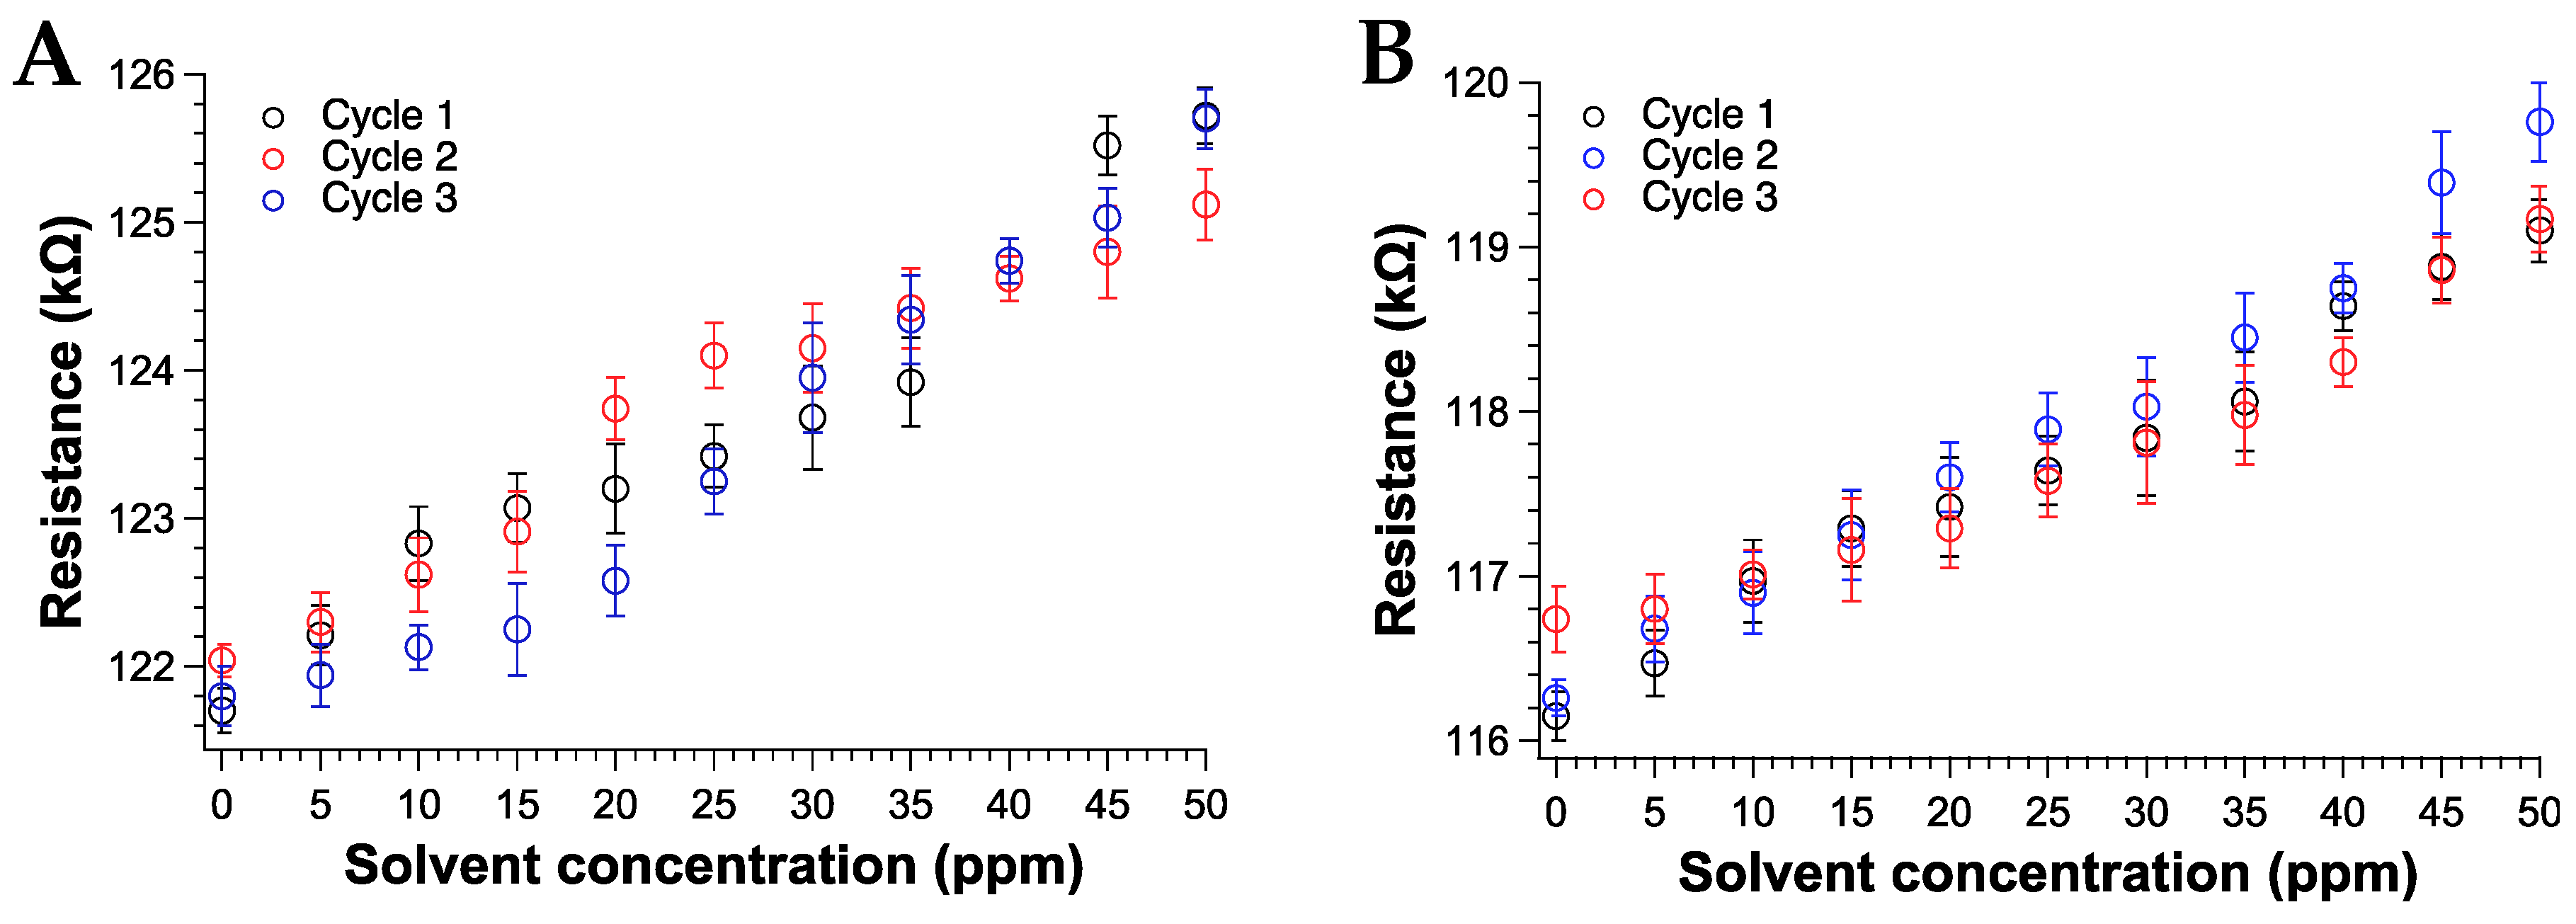
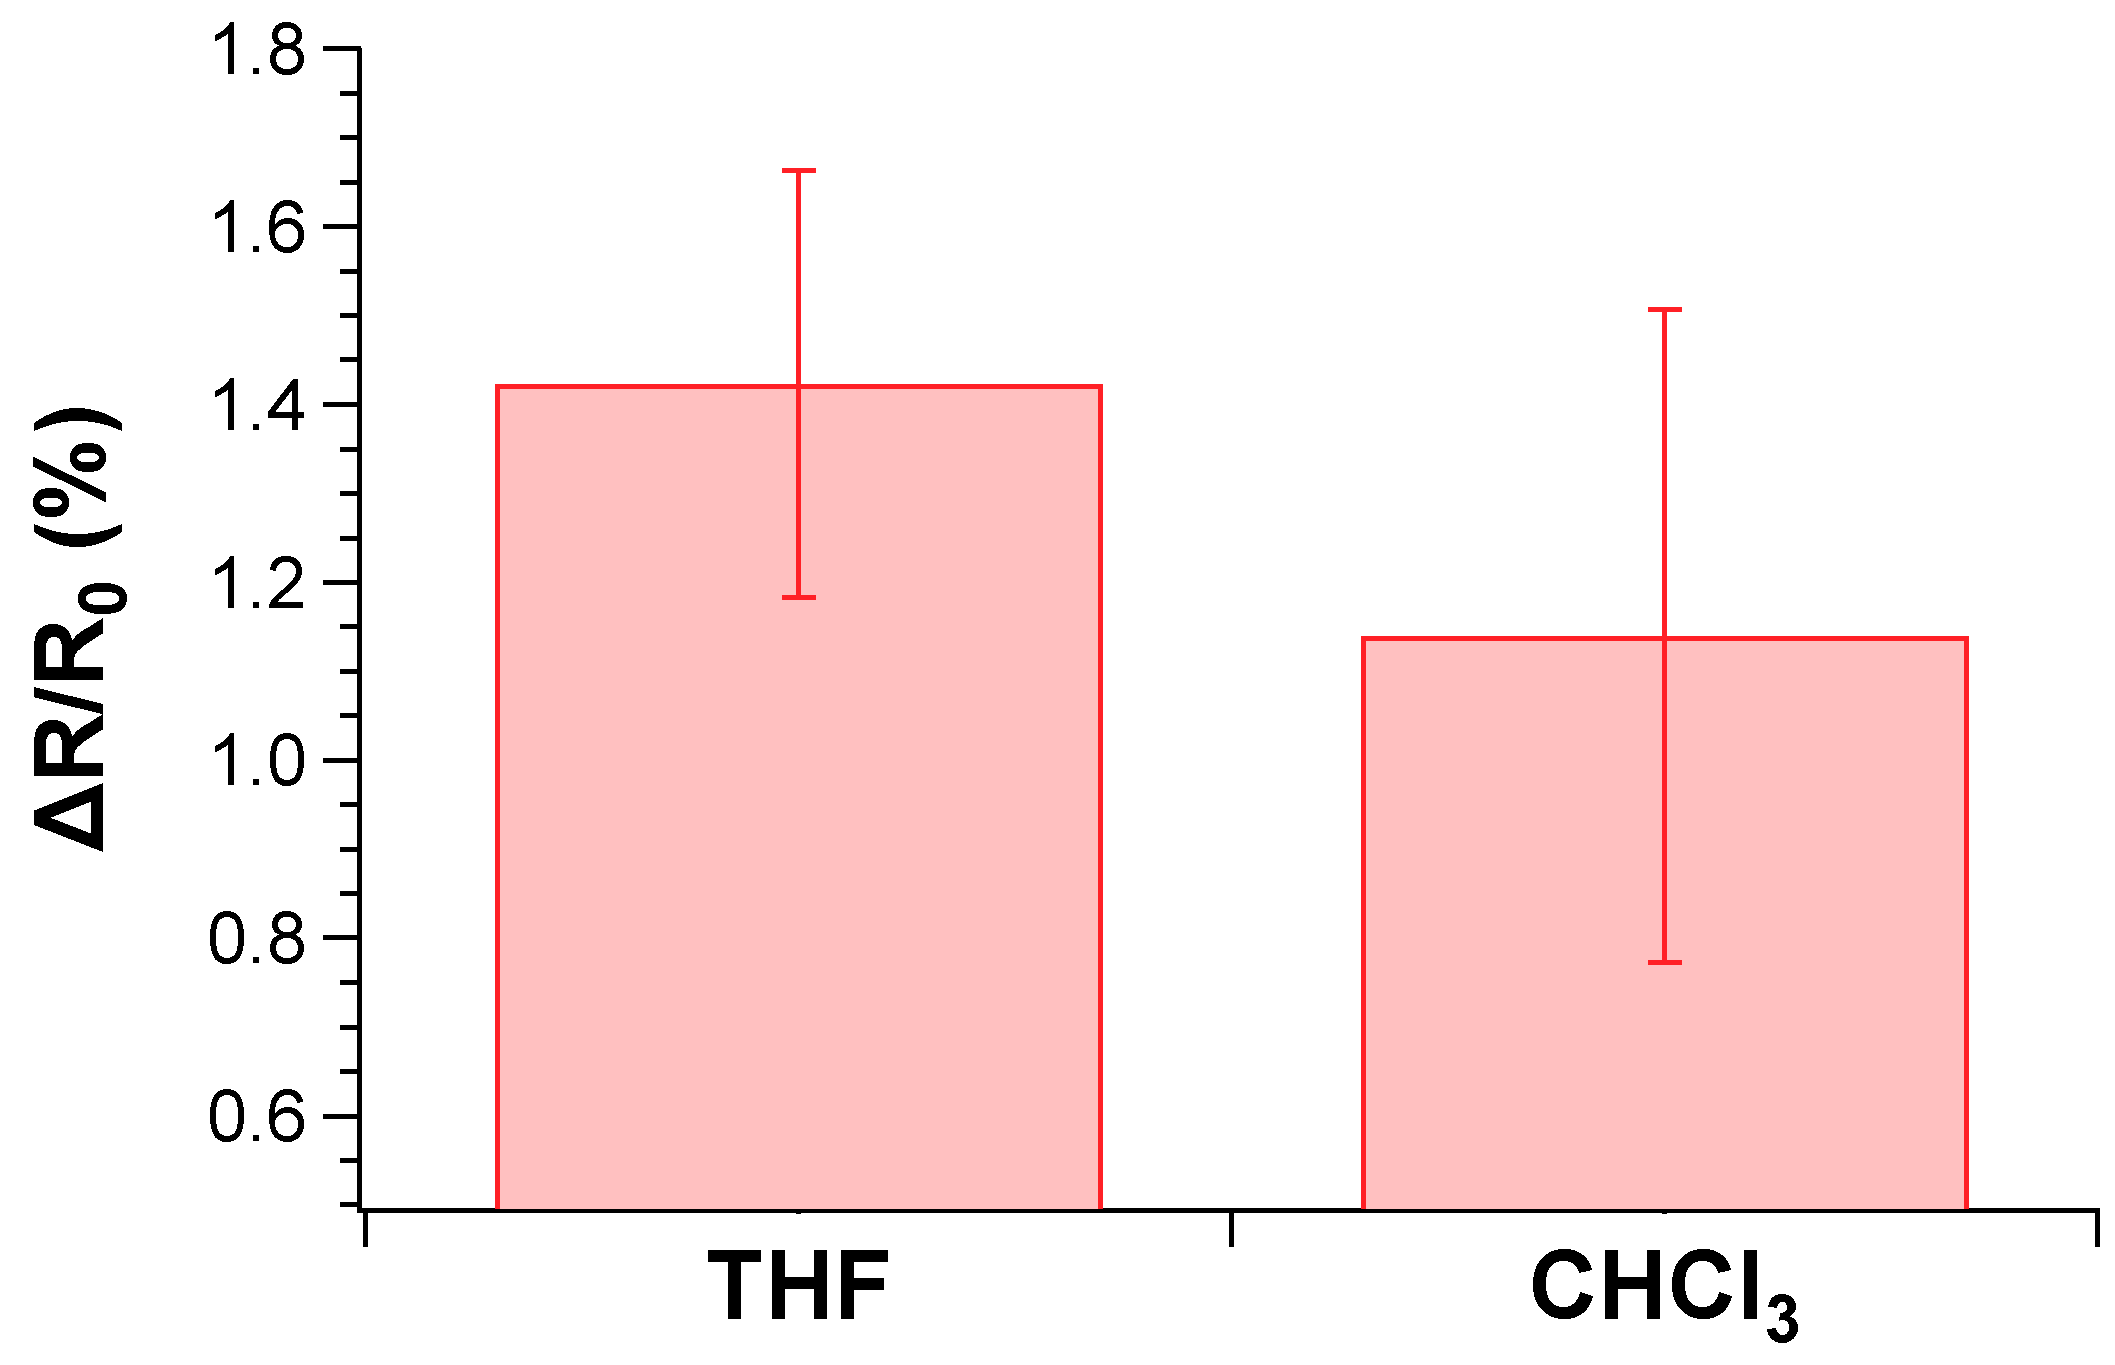
3.4. Resistive Properties of TPSA-rGO and rGO Exposed to Volatile Organic Solvents (VOCs)
4. Conclusions
Supplementary Materials
Author Contributions
Funding
Acknowledgments
Conflicts of Interest
References
- Novoselov, K.S.; Geim, A.K.; Morozov, S.V.; Jiang, D.; Zhang, Y.; Dubonos, S.V.; Grigorieva, I.V.; Firsov, A.A. Electric field effect in atomically thin carbon films. Science 2004, 306, 666. [Google Scholar] [CrossRef]
- Meyer, J.C.; Geim, A.K.; Katsnelson, M.I.; Novoselov, K.S.; Booth, T.J.; Roth, S. The structure of suspended graphene sheets. Nature 2007, 446, 60–63. [Google Scholar] [CrossRef] [PubMed]
- Ferrari, A.C.; Bonaccorso, F.; Fal’ko, V.; Novoselov, K.S.; Roche, S.; Bøggild, P.; Borini, S.; Koppens, F.H.L.; Palermo, V.; Pugno, N.; et al. Science and technology roadmap for graphene, related two-dimensional crystals, and hybrid systems. Nanoscale 2015, 7, 4598–4810. [Google Scholar] [CrossRef] [PubMed]
- Peres, N.M.R. Graphene, new physics in two dimensions. Europhys. News 2009, 40, 17–20. [Google Scholar] [CrossRef]
- Hone, J.; Whitney, M.; Piskoti, C.; Zettl, A. Thermal conductivity of single-walled carbon nanotubes. Phys. Rev. B 1999, 59, R2514–R2516. [Google Scholar] [CrossRef]
- Lee, C.; Wei, X.; Kysar, J.W.; Hone, J. Measurement of the elastic properties and intrinsic strength of monolayer graphene. Science 2008, 321, 385. [Google Scholar] [CrossRef] [PubMed]
- Bao, W.; Miao, F.; Chen, Z.; Zhang, H.; Jang, W.; Dames, C.; Lau, C.N. Controlled ripple texturing of suspended graphene and ultrathin graphite membranes. Nat. Nanotechnol. 2009, 4, 562–566. [Google Scholar] [CrossRef]
- Nair, R.R.; Blake, P.; Grigorenko, A.N.; Novoselov, K.S.; Booth, T.J.; Stauber, T.; Peres, N.M.R.; Geim, A.K. Fine structure constant defines visual transparency of graphene. Science 2008, 320, 1308. [Google Scholar] [CrossRef]
- Zhang, K.; Zhang, L.L.; Zhao, X.S.; Wu, J. Graphene/polyaniline nanofiber composites as supercapacitor electrodes. Chem. Mater. 2010, 22, 1392–1401. [Google Scholar] [CrossRef]
- Stoller, M.D.; Park, S.; Zhu, Y.; An, J.; Ruoff, R.S. Graphene-based ultracapacitors. Nano Lett. 2008, 8, 3498–3502. [Google Scholar] [CrossRef]
- Pal, N.; Dubey, P.; Gopinath, P.; Pal, K. Combined effect of cellulose nanocrystal and reduced graphene oxide into poly-lactic acid matrix nanocomposite as a scaffold and its anti-bacterial activity. Int. J. Biol. Macromol. 2017, 95, 94–105. [Google Scholar] [CrossRef] [PubMed]
- Kymakis, E.; Savva, K.; Stylianakis, M.M.; Fotakis, C.; Stratakis, E. Flexible organic photovoltaic cells with in situ nonthermal photoreduction of spin-coated graphene oxide electrodes. Adv. Funct. Mater. 2013, 23, 2742–2749. [Google Scholar] [CrossRef]
- Lu, C.-H.; Yang, H.-H.; Zhu, C.-L.; Chen, X.; Chen, G.-N. A graphene platform for sensing biomolecules. Angew. Chem. Int. Ed. 2009, 48, 4785–4787. [Google Scholar] [CrossRef] [PubMed]
- Bae, S.; Kim, H.; Lee, Y.; Xu, X.; Park, J.-S.; Zheng, Y.; Balakrishnan, J.; Lei, T.; Ri Kim, H.; Song, Y.I.; et al. Roll-to-roll production of 30-inch graphene films for transparent electrodes. Nat. Nanotechnol. 2010, 5, 574–578. [Google Scholar] [CrossRef] [PubMed]
- Yoonessi, M.; Shi, Y.; Scheiman, D.A.; Lebron-Colon, M.; Tigelaar, D.M.; Weiss, R.A.; Meador, M.A. Graphene polyimide nanocomposites; Thermal, mechanical, and high-temperature shape memory effects. ACS Nano 2012, 6, 7644–7655. [Google Scholar] [CrossRef] [PubMed]
- Mendes, G.R.; Wróbel, S.P.; Bachmatiuk, A.; Sun, J.; Gemming, T.; Liu, Z.; Rümmeli, H.M. Carbon nanostructures as a multi-functional platform for sensing applications. Chemosensors 2018, 6, 60. [Google Scholar] [CrossRef]
- Dong, X.M.; Fu, R.W.; Zhang, M.Q.; Zhang, B.; Rong, M.Z. Electrical resistance response of carbon black filled amorphous polymer composite sensors to organic vapors at low vapor concentrations. Carbon 2004, 42, 2551–2559. [Google Scholar] [CrossRef]
- Yoon, H.J.; Jun, D.H.; Yang, J.H.; Zhou, Z.; Yang, S.S.; Cheng, M.M.-C. Carbon dioxide gas sensor using a graphene sheet. Sens. Actuators B Chem. 2011, 157, 310–313. [Google Scholar] [CrossRef]
- Lu, G.; Ocola, L.E.; Chen, J. Gas detection using low-temperature reduced graphene oxide sheets. Appl. Phys. Lett. 2009, 94, 083111. [Google Scholar] [CrossRef]
- Pearce, R.; Iakimov, T.; Andersson, M.; Hultman, L.; Spetz, A.L.; Yakimova, R. Epitaxially grown graphene based gas sensors for ultra sensitive NO2 detection. Sens. Actuators B Chem. 2011, 155, 451–455. [Google Scholar] [CrossRef]
- Yavari, F.; Castillo, E.; Gullapalli, H.; Ajayan, P.M.; Koratkar, N. High sensitivity detection of NO2 and NH3 in air using chemical vapor deposition grown graphene. Appl. Phys. Lett. 2012, 100, 203120. [Google Scholar] [CrossRef]
- Schedin, F.; Geim, A.K.; Morozov, S.V.; Hill, E.W.; Blake, P.; Katsnelson, M.I.; Novoselov, K.S. Detection of individual gas molecules adsorbed on graphene. Nat. Mater. 2007, 6, 652–655. [Google Scholar] [CrossRef] [PubMed]
- Liu, H.; Huang, W.; Yang, X.; Dai, K.; Zheng, G.; Liu, C.; Shen, C.; Yan, X.; Guo, J.; Guo, Z. Organic vapor sensing behaviors of conductive thermoplastic polyurethane–graphene nanocomposites. J. Mater. Chem. C 2016, 4, 4459–4469. [Google Scholar] [CrossRef]
- Ko, G.; Kim, H.Y.; Ahn, J.; Park, Y.M.; Lee, K.Y.; Kim, J. Graphene-based nitrogen dioxide gas sensors. Curr. Appl. Phys. 2010, 10, 1002–1004. [Google Scholar] [CrossRef]
- Wu, Z.; Chen, X.; Zhu, S.; Zhou, Z.; Yao, Y.; Quan, W.; Liu, B. Enhanced sensitivity of ammonia sensor using graphene/polyaniline nanocomposite. Sens. Actuators B Chem. 2013, 178, 485–493. [Google Scholar] [CrossRef]
- Geim, A.K. Graphene: Status and prospects. Science 2009, 324, 1530. [Google Scholar] [CrossRef]
- Dai, L. Functionalization of graphene for efficient energy conversion and storage. Acc. Chem. Res. 2013, 46, 31–42. [Google Scholar] [CrossRef]
- Li, X.; Zhu, Y.; Cai, W.; Borysiak, M.; Han, B.; Chen, D.; Piner, R.D.; Colombo, L.; Ruoff, R.S. Transfer of large-area graphene films for high-performance transparent conductive electrodes. Nano Lett. 2009, 9, 4359–4363. [Google Scholar] [CrossRef]
- Ratinac, K.R.; Yang, W.; Ringer, S.P.; Braet, F. Toward ubiquitous environmental gas sensors—Capitalizing on the promise of graphene. Environ. Sci. Technol. 2010, 44, 1167–1176. [Google Scholar] [CrossRef]
- Shams, S.S.; Ruoyu, Z.; Jin, Z. Graphene synthesis: A review. Mater. Sci. Pol. 2015, 33, 566–578. [Google Scholar] [CrossRef]
- Eizenberg, M.; Blakely, J.M. Carbon monolayer phase condensation on Ni(111). Surf. Sci. 1979, 82, 228–236. [Google Scholar] [CrossRef]
- Kim, K.S.; Zhao, Y.; Jang, H.; Lee, S.Y.; Kim, J.M.; Kim, K.S.; Ahn, J.-H.; Kim, P.; Choi, J.-Y.; Hong, B.H. Large-scale pattern growth of graphene films for stretchable transparent electrodes. Nature 2009, 457, 706–710. [Google Scholar] [CrossRef] [PubMed]
- Amini, S.; Garay, J.; Liu, G.; Balandin, A.A.; Abbaschian, R. Growth of large-area graphene films from metal-carbon melts. J. Appl. Phys. 2010, 108, 094321. [Google Scholar] [CrossRef]
- Sutter, P. How silicon leaves the scene. Nat. Mater. 2009, 8, 171–172. [Google Scholar] [CrossRef] [PubMed]
- Novoselov, K.S. Nobel lecture: Graphene: Materials in the flatland. Rev. Mod. Phys. 2011, 83, 837–849. [Google Scholar] [CrossRef]
- Zhan, D.; Sun, L.; Ni, Z.H.; Liu, L.; Fan, X.F.; Wang, Y.; Yu, T.; Lam, Y.M.; Huang, W.; Shen, Z.X. FeCl3-based few-layer graphene intercalation compounds: Single linear dispersion electronic band structure and strong charge transfer doping. Adv. Funct. Mater. 2010, 20, 3504–3509. [Google Scholar] [CrossRef]
- Borah, M.; Dahiya, M.; Sharma, S.; Mathur, R.B.; Dhakate, S.R. Few layer graphene derived from wet ball milling of expanded graphite and few layer graphene based polymer composite. Mater. Focus 2014, 3, 300–309. [Google Scholar] [CrossRef]
- Ranjan, P.; Agrawal, S.; Sinha, A.; Rao, T.R.; Balakrishnan, J.; Thakur, A.D. A low-cost non-explosive synthesis of graphene oxide for scalable applications. Sci. Rep. 2018, 8, 12007. [Google Scholar] [CrossRef]
- Paredes, J.I.; Villar-Rodil, S.; Martínez-Alonso, A.; Tascón, J.M.D. Graphene oxide dispersions in organic solvents. Langmuir 2008, 24, 10560–10564. [Google Scholar] [CrossRef]
- Brodie, B.C. XIII. On the atomic weight of graphite. Philos. Trans. R. Soc. Lond. 1859, 149, 249–259. [Google Scholar] [CrossRef]
- Staudenmaier, L. Verfahren zur darstellung der graphitsäure. Ber. Der Dtsch. Chem. Ges. 1898, 31, 1481–1487. [Google Scholar] [CrossRef]
- Hummers, W.S.; Offeman, R.E. Preparation of graphitic oxide. J. Am. Chem. Soc. 1958, 80, 1339. [Google Scholar] [CrossRef]
- Boukhvalov, D.W.; Katsnelson, M.I. Modeling of graphite oxide. J. Am. Chem. Soc. 2008, 130, 10697–10701. [Google Scholar] [CrossRef] [PubMed]
- Li, D.; Kaner, R.B. Graphene-based materials. Science 2008, 320, 1170. [Google Scholar] [CrossRef] [PubMed]
- Stankovich, S.; Piner, R.D.; Chen, X.; Wu, N.; Nguyen, S.T.; Ruoff, R.S. Stable aqueous dispersions of graphitic nanoplatelets via the reduction of exfoliated graphite oxide in the presence of poly(sodium 4-styrenesulfonate). J. Mater. Chem. 2006, 16, 155–158. [Google Scholar] [CrossRef]
- Gudarzi, M.M.; Moghadam, M.H.M.; Sharif, F. Spontaneous exfoliation of graphite oxide in polar aprotic solvents as the route to produce graphene oxide—Organic solvents liquid crystals. Carbon 2013, 64, 403–415. [Google Scholar] [CrossRef]
- Mann, J.A.; Dichtel, W.R. Noncovalent functionalization of graphene by molecular and polymeric adsorbates. J. Phys. Chem. Lett. 2013, 4, 2649–2657. [Google Scholar] [CrossRef]
- Dasari Shareena, T.P.; McShan, D.; Dasmahapatra, A.K.; Tchounwou, P.B. A review on graphene-based nanomaterials in biomedical applications and risks in environment and health. Nano Micro Lett. 2018, 10, 53. [Google Scholar] [CrossRef]
- Stankovich, S.; Dikin, D.A.; Piner, R.D.; Kohlhaas, K.A.; Kleinhammes, A.; Jia, Y.; Wu, Y.; Nguyen, S.T.; Ruoff, R.S. Synthesis of graphene-based nanosheets via chemical reduction of exfoliated graphite oxide. Carbon 2007, 45, 1558–1565. [Google Scholar] [CrossRef]
- Wang, G.; Yang, J.; Park, J.; Gou, X.; Wang, B.; Liu, H.; Yao, J. Facile synthesis and characterization of graphene nanosheets. J. Phys. Chem. C 2008, 112, 8192–8195. [Google Scholar] [CrossRef]
- McAllister, M.J.; Li, J.-L.; Adamson, D.H.; Schniepp, H.C.; Abdala, A.A.; Liu, J.; Herrera-Alonso, M.; Milius, D.L.; Car, R.; Prud’homme, R.K.; et al. single sheet functionalized graphene by oxidation and thermal expansion of graphite. Chem. Mater. 2007, 19, 4396–4404. [Google Scholar] [CrossRef]
- Fan, H.; Wang, L.; Zhao, K.; Li, N.; Shi, Z.; Ge, Z.; Jin, Z. Fabrication, mechanical properties, and biocompatibility of graphene-reinforced chitosan composites. Biomacromolecules 2010, 11, 2345–2351. [Google Scholar] [CrossRef]
- Xu, Y.; Bai, H.; Lu, G.; Li, C.; Shi, G. Flexible Graphene films via the filtration of water-soluble noncovalent functionalized graphene sheets. J. Am. Chem. Soc. 2008, 130, 5856–5857. [Google Scholar] [CrossRef] [PubMed]
- Gilje, S.; Han, S.; Wang, M.; Wang, K.L.; Kaner, R.B. A chemical route to graphene for device applications. Nano Lett. 2007, 7, 3394–3398. [Google Scholar] [CrossRef]
- Dikin, D.A.; Stankovich, S.; Zimney, E.J.; Piner, R.D.; Dommett, G.H.B.; Evmenenko, G.; Nguyen, S.T.; Ruoff, R.S. Preparation and characterization of graphene oxide paper. Nature 2007, 448, 457–460. [Google Scholar] [CrossRef] [PubMed]
- Niyogi, S.; Bekyarova, E.; Itkis, M.E.; McWilliams, J.L.; Hamon, M.A.; Haddon, R.C. Solution properties of graphite and graphene. J. Am. Chem. Soc. 2006, 128, 7720–7721. [Google Scholar] [CrossRef]
- Gómez-Navarro, C.; Weitz, R.T.; Bittner, A.M.; Scolari, M.; Mews, A.; Burghard, M.; Kern, K. Electronic transport properties of individual chemically reduced graphene oxide sheets. Nano Lett. 2007, 7, 3499–3503. [Google Scholar] [CrossRef]
- Eda, G.; Lin, Y.-Y.; Miller, S.; Chen, C.-W.; Su, W.-F.; Chhowalla, M. Transparent and conducting electrodes for organic electronics from reduced graphene oxide. Appl. Phys. Lett. 2008, 92, 233305. [Google Scholar] [CrossRef]
- Wang, X.; Zhi, L.; Müllen, K. Transparent, conductive graphene electrodes for dye-sensitized solar cells. Nano Lett. 2008, 8, 323–327. [Google Scholar] [CrossRef]
- Becerril, H.A.; Mao, J.; Liu, Z.; Stoltenberg, R.M.; Bao, Z.; Chen, Y. Evaluation of solution-processed reduced graphene oxide films as transparent conductors. ACS Nano 2008, 2, 463–470. [Google Scholar] [CrossRef]
- Lipatov, A.; Varezhnikov, A.; Wilson, P.; Sysoev, V.; Kolmakov, A.; Sinitskii, A. Highly selective gas sensor arrays based on thermally reduced graphene oxide. Nanoscale 2013, 5, 5426–5434. [Google Scholar] [CrossRef] [PubMed]
- Dua, V.; Surwade, S.P.; Ammu, S.; Agnihotra, S.R.; Jain, S.; Roberts, K.E.; Park, S.; Ruoff, R.S.; Manohar, S.K. All-organic vapor sensor using inkjet-printed reduced graphene oxide. Angew. Chem. Int. Ed. 2010, 49, 2154–2157. [Google Scholar] [CrossRef] [PubMed]
- Lu, G.; Park, S.; Yu, K.; Ruoff, R.S.; Ocola, L.E.; Rosenmann, D.; Chen, J. Toward practical gas sensing with highly reduced graphene oxide: A new signal processing method to circumvent run-to-run and device-to-device variations. ACS Nano 2011, 5, 1154–1164. [Google Scholar] [CrossRef]
- Hasan, N.; Zhang, W.; Radadia, A.D. Few-flakes reduced graphene oxide sensors for organic vapors with a high signal-to-noise ratio. Nanomaterials 2017, 7, 339. [Google Scholar] [CrossRef] [PubMed]
- Warth, H.; Mülhaupt, R.; Hoffmann, B.; Lawson, S. Polyester networks based upon epoxidized and maleinated natural oils. Die Angew. Makromol. Chem. 1997, 249, 79–92. [Google Scholar] [CrossRef]
- Zhang, W.; Liu, W.; Li, H.; Hubbe, M.A.; Yu, D.; Li, G.; Wang, H. Improving stability and sizing performance of alkenylsuccinic anhydride (ASA) emulsion by using melamine-modified laponite particles as emulsion stabilizer. Ind. Eng. Chem. Res. 2014, 53, 12330–12338. [Google Scholar] [CrossRef]
- Calisi, N.; Giuliani, A.; Alderighi, M.; Schnorr, J.M.; Swager, T.M.; Di Francesco, F.; Pucci, A. Factors affecting the dispersion of MWCNTs in electrically conducting SEBS nanocomposites. Eur. Polym. J. 2013, 49, 1471–1478. [Google Scholar] [CrossRef]
- Biver, T.; Criscitiello, F.; Di Francesco, F.; Minichino, M.; Swager, T.; Pucci, A. MWCNT/perylene bisimide water dispersions for miniaturized temperature sensors. Rsc Adv. 2015, 5, 65023–65029. [Google Scholar] [CrossRef]
- Criscitiello, F.; Scigliano, A.; Bianco, R.; Beccia, M.R.; Biver, T.; Pucci, A. Perylene bisimide metal complexes as new MWCNTs dispersants: Role of the metal ion in stability and temperature sensing. Colloids Surf. A Physicochem. Eng. Asp. 2017, 516, 32–38. [Google Scholar] [CrossRef]
- Di Sacco, F.; Pucci, A.; Raffa, P. Versatile multi-functional block copolymers made by atom transfer radical polymerization and post-synthetic modification: Switching from volatile organic compound sensors to polymeric surfactants for water rheology control via hydrolysis. Nanomaterials 2019, 9, 458. [Google Scholar] [CrossRef]
- den Hoed, F.; Pucci, A.; Picchioni, F.; Raffa, P. Design of a pH-responsive conductive nanocomposite based on MWCNTs stabilized in water by amphiphilic block copolymers. Nanomaterials 2019, 9, 410. [Google Scholar] [CrossRef] [PubMed]
- Araya-Hermosilla, A.E.; Carlotti, M.; Picchioni, F.; Mattoli, V.; Pucci, A. Electrically-conductive polyketone nanocomposites based on reduced graphene oxide. Polymers 2020, 12, 923. [Google Scholar] [CrossRef] [PubMed]
- Matzeu, G.; Pucci, A.; Savi, S.; Romanelli, M.; Di Francesco, F. A temperature sensor based on a MWCNT/SEBS nanocomposite. Sens. Actuators A Phys. 2012, 178, 94–99. [Google Scholar] [CrossRef]
- Giuliani, A.; Placidi, M.; Di Francesco, F.; Pucci, A. A new polystyrene-based ionomer/MWCNT nanocomposite for wearable skin temperature sensors. React. Funct. Polym. 2014, 76, 57–62. [Google Scholar] [CrossRef]
- Paoletti, C.; He, M.; Salvo, P.; Melai, B.; Calisi, N.; Mannini, M.; Cortigiani, B.; Bellagambi, F.G.; Swager, T.M.; Di Francesco, F.; et al. Room temperature amine sensors enabled by sidewall functionalization of single-walled carbon nanotubes. RSC Adv. 2018, 8, 5578–5585. [Google Scholar] [CrossRef] [PubMed]
- Lee, J.H.; Shin, D.W.; Makotchenko, V.G.; Nazarov, A.S.; Fedorov, V.E.; Yoo, J.H.; Yu, S.M.; Choi, J.-Y.; Kim, J.M.; Yoo, J.-B. The superior dispersion of easily soluble graphite. Small 2010, 6, 58–62. [Google Scholar] [CrossRef]
- Wang, S.; Zhang, Y.; Abidi, N.; Cabrales, L. Wettability and surface free energy of graphene films. Langmuir 2009, 25, 11078–11081. [Google Scholar] [CrossRef]
- Konios, D.; Stylianakis, M.M.; Stratakis, E.; Kymakis, E. Dispersion behaviour of graphene oxide and reduced graphene oxide. J. Colloid Interface Sci. 2014, 430, 108–112. [Google Scholar] [CrossRef]
- Wu, J.-B.; Lin, M.-L.; Cong, X.; Liu, H.-N.; Tan, P.-H. Raman spectroscopy of graphene-based materials and its applications in related devices. Chem. Soc. Rev. 2018, 47, 1822–1873. [Google Scholar] [CrossRef]
- Vryonis, O.; Andritsch, T.; Vaughan, A.S.; Lewin, P.L. An alternative synthesis route to graphene oxide: Influence of surface chemistry on charge transport in epoxy-based composites. J. Mater. Sci. 2019, 54, 8302–8318. [Google Scholar] [CrossRef]
- Cançado, L.G.; Jorio, A.; Ferreira, E.H.M.; Stavale, F.; Achete, C.A.; Capaz, R.B.; Moutinho, M.V.O.; Lombardo, A.; Kulmala, T.S.; Ferrari, A.C. Quantifying defects in graphene via raman spectroscopy at different excitation energies. Nano Lett. 2011, 11, 3190–3196. [Google Scholar] [CrossRef] [PubMed]
- Muhammad Hafiz, S.; Ritikos, R.; Whitcher, T.J.; Razib, N.M.; Bien, D.C.S.; Chanlek, N.; Nakajima, H.; Saisopa, T.; Songsiriritthigul, P.; Huang, N.M.; et al. A practical carbon dioxide gas sensor using room-temperature hydrogen plasma reduced graphene oxide. Sens. Actuators B Chem. 2014, 193, 692–700. [Google Scholar] [CrossRef]
- Qi, X.; Pu, K.-Y.; Zhou, X.; Li, H.; Liu, B.; Boey, F.; Huang, W.; Zhang, H. Conjugated-polyelectrolyte-functionalized reduced graphene oxide with excellent solubility and stability in polar solvents. Small 2010, 6, 663–669. [Google Scholar] [CrossRef] [PubMed]
- Yang, D.; Velamakanni, A.; Bozoklu, G.; Park, S.; Stoller, M.; Piner, R.D.; Stankovich, S.; Jung, I.; Field, D.A.; Ventrice, C.A.; et al. Chemical analysis of graphene oxide films after heat and chemical treatments by X-ray photoelectron and Micro-Raman spectroscopy. Carbon 2009, 47, 145–152. [Google Scholar] [CrossRef]
- Santra, S.; Hu, G.; Howe, R.C.T.; De Luca, A.; Ali, S.Z.; Udrea, F.; Gardner, J.W.; Ray, S.K.; Guha, P.K.; Hasan, T. CMOS integration of inkjet-printed graphene for humidity sensing. Sci. Rep. 2015, 5, 17374. [Google Scholar] [CrossRef] [PubMed]
- Nettleton, D. Chapter 6—Selection of variables and factor derivation. In Commercial Data Mining; Nettleton, D., Ed.; Morgan Kaufmann: Boston, MA, USA, 2014; pp. 79–104. [Google Scholar] [CrossRef]
- Midya, A.; Mukherjee, S.; Roy, S.; Santra, S.; Manna, N.; Ray, S.K. Selective chloroform sensor using thiol functionalized reduced graphene oxide at room temperature. Mater. Res. Express 2018, 5, 025604. [Google Scholar] [CrossRef]
- Ponnamma, D.; Goutham, S.; Sadasivuni, K.K.; Rao, K.V.; Cabibihan, J.J.; Al-Maadeed, M.A.A. Controlling the sensing performance of rGO filled PVDF nanocomposite with the addition of secondary nanofillers. Synth. Met. 2018, 243, 34–43. [Google Scholar] [CrossRef]
- Some, S.; Xu, Y.; Kim, Y.; Yoon, Y.; Qin, H.; Kulkarni, A.; Kim, T.; Lee, H. Highly sensitive and selective gas sensor using hydrophilic and hydrophobic graphenes. Sci. Rep. 2013, 3, 1868. [Google Scholar] [CrossRef]
- Currie, L.A. Nomenclature in evaluation of analytical methods including detection and quantification capabilities (IUPAC Recommendations 1995). Pure Appl. Chem. 1995, 67, 1699–1723. [Google Scholar] [CrossRef]


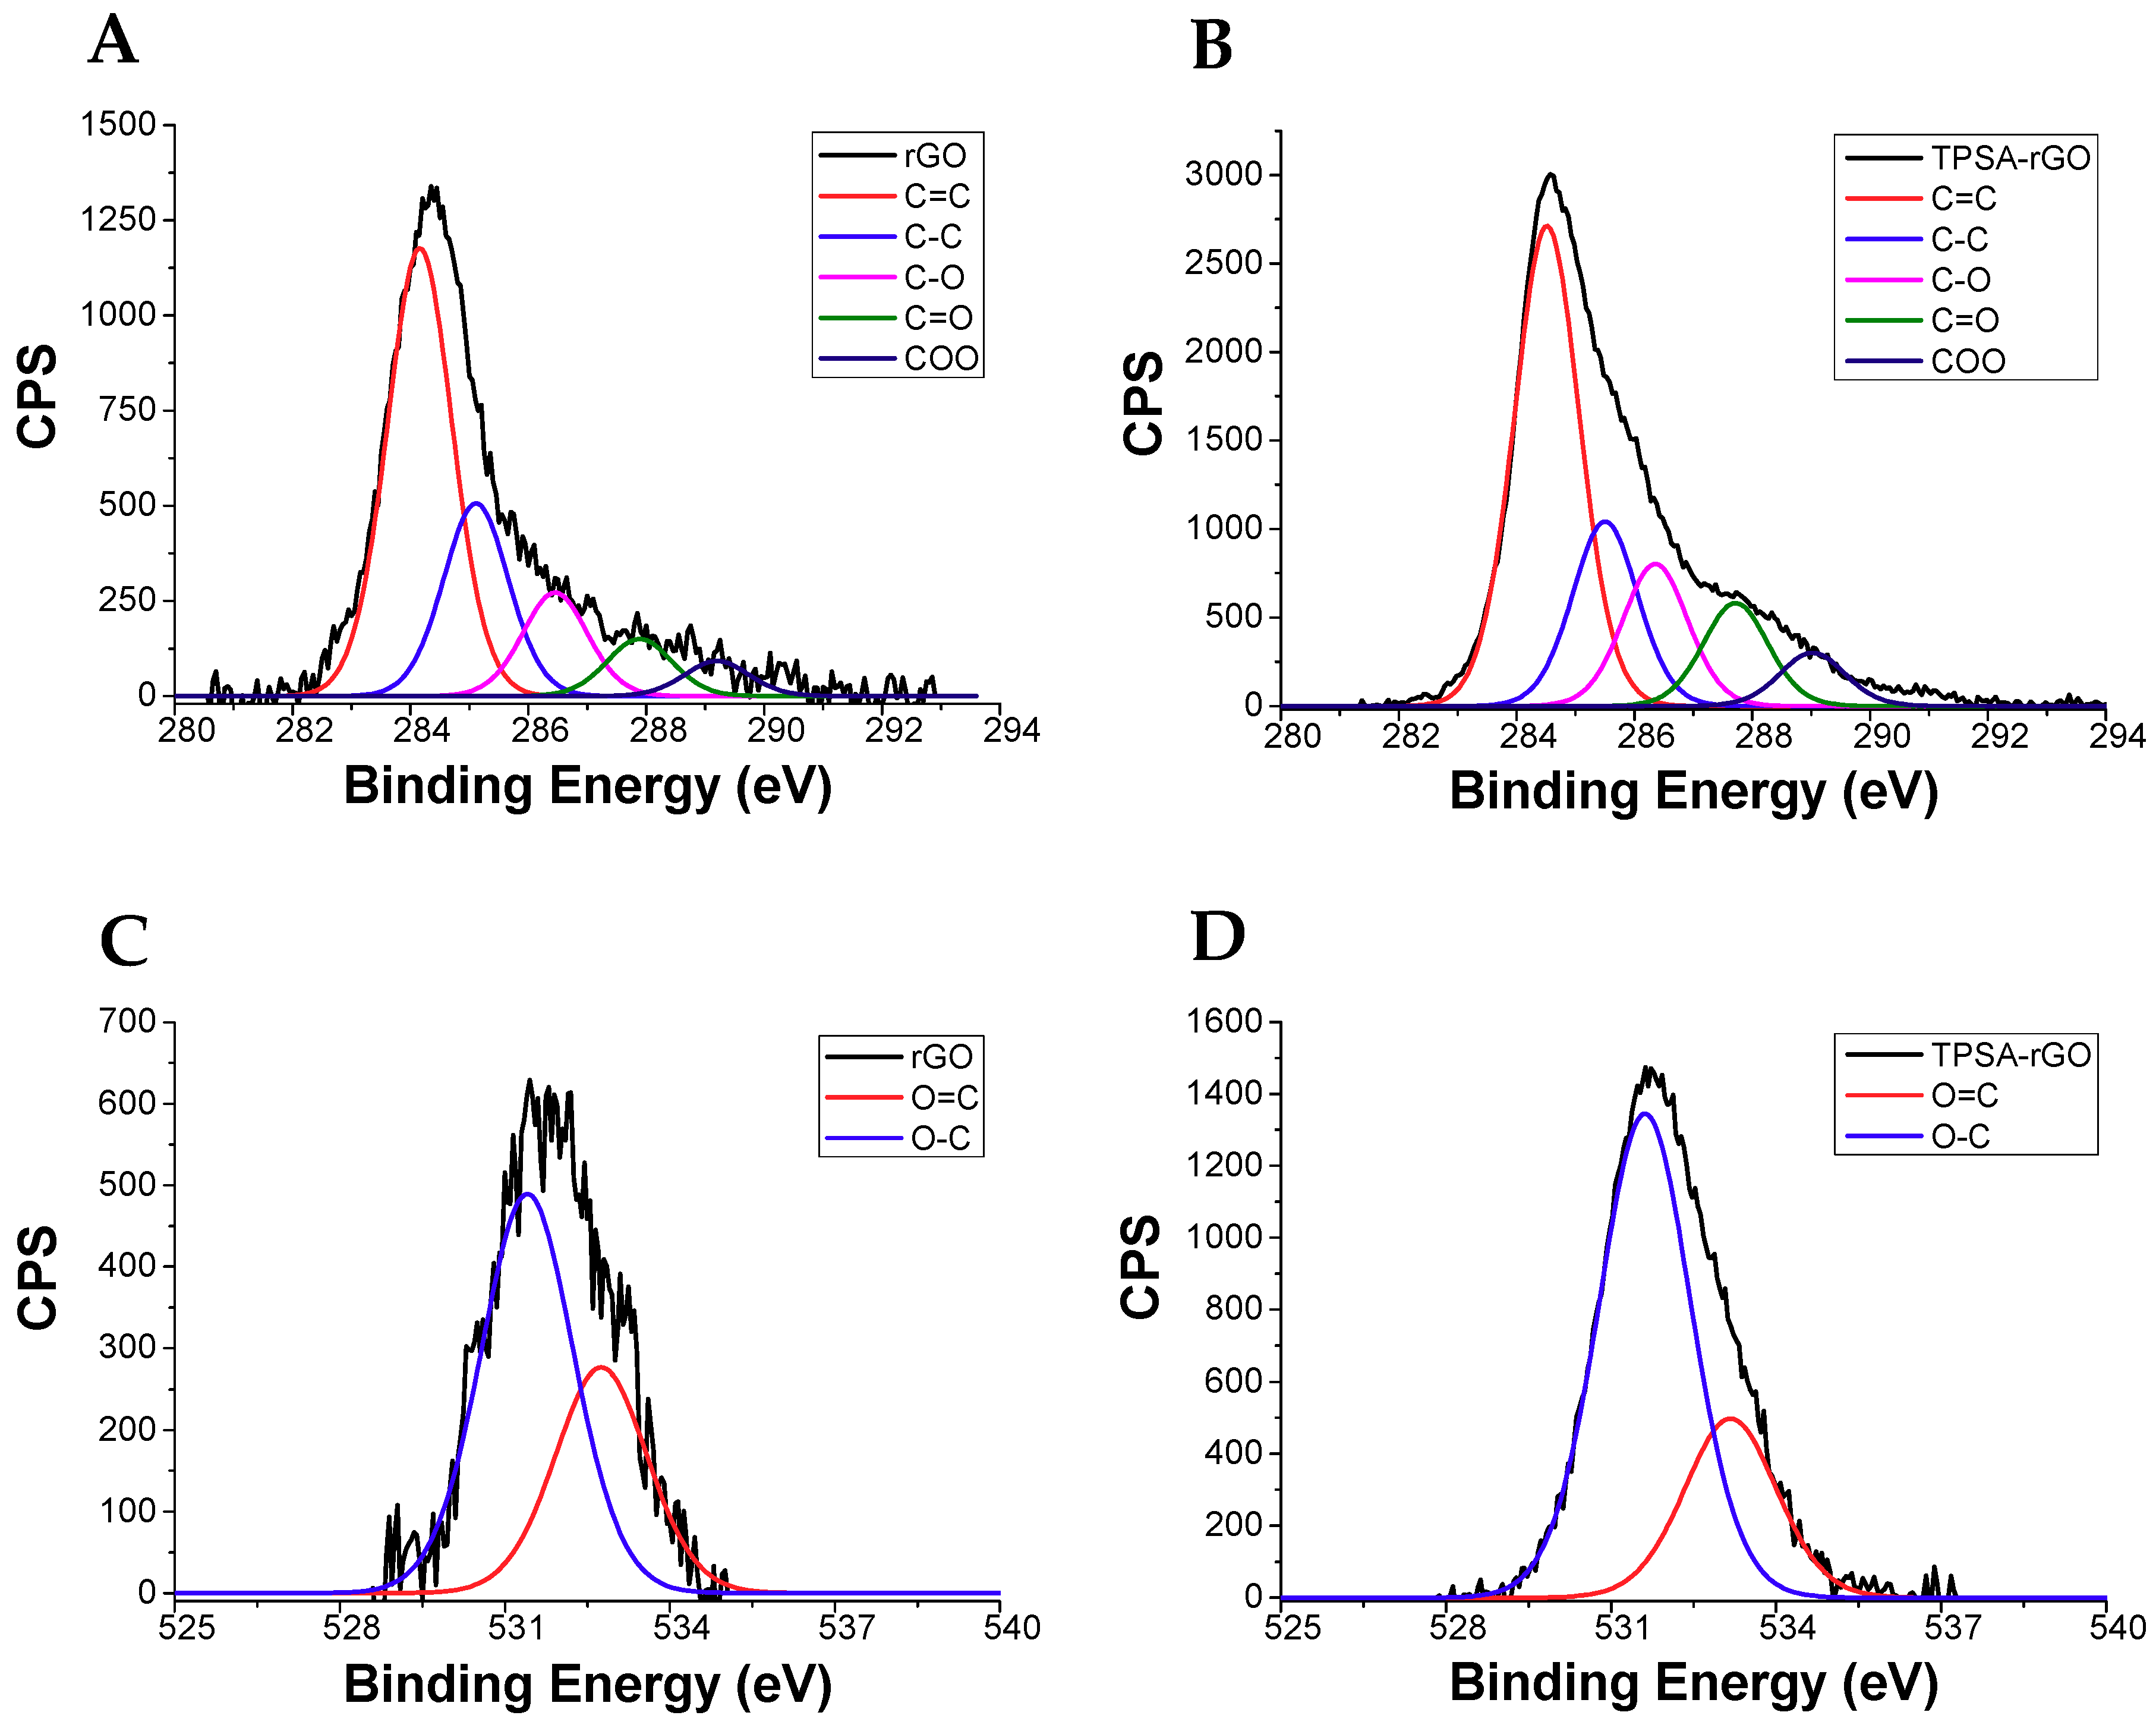
| Component | Position (eV) | rGO | TPSA-RGO |
|---|---|---|---|
| C=C | 284.4 | 43.9% | 38.3% |
| C-C | 285.2 | 18.9% | 15.7% |
| C-O | 286.4 | 10.1% | 11.3% |
| C=O | 287.6 | 5.6% | 8.2% |
| COO | 289.0 | 3.4% | 5.2% |
| C total | 1432.6 | 81.9% | 78.7% |
| O=C | 533.0 | 11.6% | 12.0% |
| O-C | 531.0 | 6.5% | 9.3% |
| O total | 1064.0 | 18.1% | 21.3% |
| Sample | Resistance (MΩ) |
|---|---|
| rGO 1 | 5.1 ± 0.1 |
| rGO 2 | 28 ± 2 |
| TPSA-rGO 1 | 0.58 ± 0.05 |
| TPSA-rGO 2 | 0.46 ± 0.05 |
| Cycle | TPSA-rGO 1 | TPSA-rGO 2 |
|---|---|---|
| 1 | −0.004 | −0.004 |
| 2 | −0.004 | −0.004 |
| 3 | −0.005 | −0.005 |
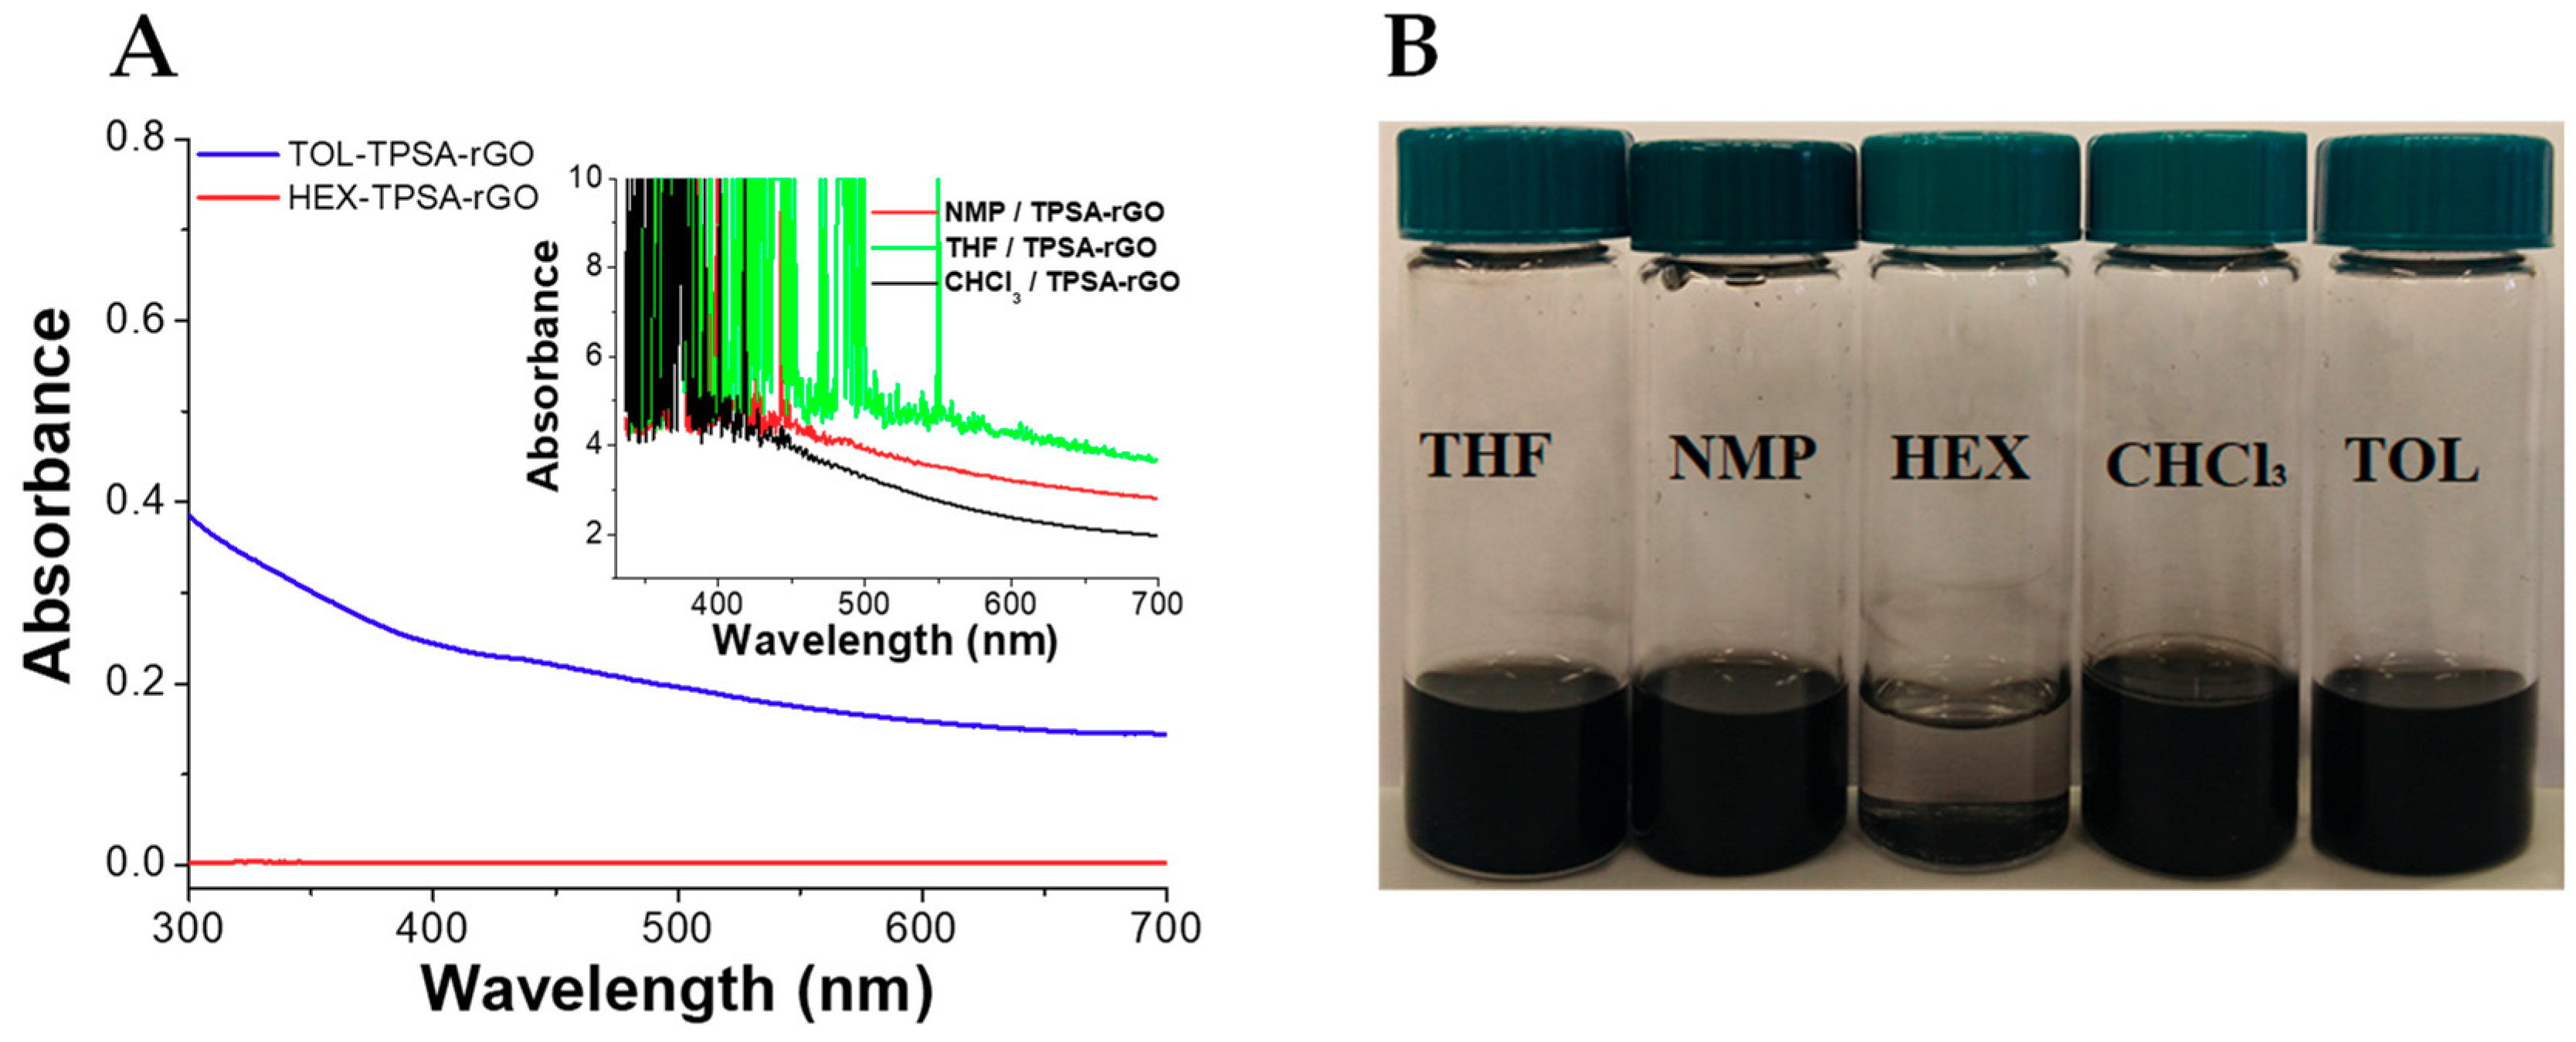
| Solvent | Pearson Correlation Coefficient |
|---|---|
| THF | 0.90 |
| HEX | 0.05 |
| CHCl3 | 0.90 |
| Cycle | Chloroform | Tetrahydrofuran |
|---|---|---|
| 1 | 0.0004 | 0.0006 |
| 2 | 0.0005 | 0.0005 |
| 3 | 0.0004 | 0.0006 |
© 2020 by the authors. Licensee MDPI, Basel, Switzerland. This article is an open access article distributed under the terms and conditions of the Creative Commons Attribution (CC BY) license (http://creativecommons.org/licenses/by/4.0/).
Share and Cite
Araya-Hermosilla, E.; Minichino, M.; Mattoli, V.; Pucci, A. Chemical and Temperature Sensors Based on Functionalized Reduced Graphene Oxide. Chemosensors 2020, 8, 43. https://doi.org/10.3390/chemosensors8020043
Araya-Hermosilla E, Minichino M, Mattoli V, Pucci A. Chemical and Temperature Sensors Based on Functionalized Reduced Graphene Oxide. Chemosensors. 2020; 8(2):43. https://doi.org/10.3390/chemosensors8020043
Chicago/Turabian StyleAraya-Hermosilla, Esteban, Matteo Minichino, Virgilio Mattoli, and Andrea Pucci. 2020. "Chemical and Temperature Sensors Based on Functionalized Reduced Graphene Oxide" Chemosensors 8, no. 2: 43. https://doi.org/10.3390/chemosensors8020043
APA StyleAraya-Hermosilla, E., Minichino, M., Mattoli, V., & Pucci, A. (2020). Chemical and Temperature Sensors Based on Functionalized Reduced Graphene Oxide. Chemosensors, 8(2), 43. https://doi.org/10.3390/chemosensors8020043