Abstract
Off-stoichiometry thiol-ene polymer (OSTE) is an emerging thermoset with interesting properties for the development of lab-on-a-chip (LOAC), such as easy microfabrication process, suitable surface chemistry for modification and UV-transparency. One of the challenges for LOAC development is the integration of all the analytical steps in one microchannel, and particularly, trace level analytes extraction/preconcentration steps. In this study, two strategies for the immobilization of efficient tools for this purpose, thiol-modified (C3-SH) aptamers, on OSTE polymer surfaces were developed and compared. The first approach relies on a direct UV-initiated click chemistry reaction to graft thiol-terminated aptamers on ene-terminated OSTE surfaces. The second strategy consists of the immobilization of thiol-terminated aptamers onto OSTE substrates covered by gold nanoparticles. The presence of an intermediate gold nanoparticle layer on OSTE has shown great interest in the efficient immobilization of aptamers, preserving their interaction with the target, and preventing non-specific adsorption. With this second innovative strategy, we proved, for the first time the concept of creating multiple functional zones for sample treatment in an open OSTE-microchannel thanks to the immobilization of aptamers in consecutive areas by the simple droplet deposition methodology. This methodological development allows further consideration of OSTE material for lab-on-a-chip designs, integrating multiple zones for sample pretreatment, based on molecular recognition by ligands, such as aptamers, in a specific zone of the microchannel and is adaptable to a large range of analytical applications for LOAC industrialization.
1. Introduction
Using microfluidic devices to perform analysis of complex samples is an interesting approach that has gained much attention in the past years [1,2,3]. This increasing interest can be attributed to the fact that microfluidic devices are portable, automated, require small sample and reagent volumes, and can conveniently integrate the necessary steps for rapid analysis. A microfluidic system integrating all conventional analytical steps is called Lab-On-A-Chip (LOAC). A primary goal of this technology is to improve the analytical performances while reducing costs. Thus, great efforts and considerable resources have been focused on the development and evaluation of new substrates, microfabrication techniques, and preparation methods to produce inexpensive, robust, disposable, and portable LOACs [4] for their further commercialization [5]. Silica and glass have been primarily used for microfluidic device fabrication, but their cost is high, and their associated manufacturing processes are complex and expensive [6,7]. Thus, there is a high demand for new microchip materials with easy and cheap microfabrication processes. As a result, several different polymeric materials are proposed as substrates for LOAC systems. Among them, off-stoichiometry thiol-ene polymers (OSTE) possess interesting properties such as rapid prototyping, uncomplicated processing, and optical transparency [8,9]. The OSTE polymer processing is based on thiol-ene click chemistry reaction [8,10,11,12,13,14], i.e., UV-initiated step-growth radical polymerization between thiol (“thiol”) and allyl (“ene”) monomers. The first step consists in the formation of a thiyl radical by hydrogen abstraction from a thiol precursor under UV irradiation. The resulting thiyl radical can then propagate due to the presence of allyl precursors. The second step is a classical propagation chain transfer until thiol-ene polymerization is completed [15,16,17]. This reaction may occur in the presence or not of a photoinitiator [10,13,18]. Due to the presence of allyl and thiol groups on the surface of this substrate, further chemical modifications of the materials can easily be managed.
Previously reported studies [10,14] proposed simple and fast (less than 2 h) surface modifications of OSTE polymeric substrates. For example, Bou and Ellis have immobilized gold nanoparticles (AuNPs) onto the OSTE surface to prepare gold electrodes [14]. AuNPs were immobilized through chemisorption via thiolate bonding by incubating OSTE substrates into a diluted colloidal gold solution. Two years later, Lafleur et al. presented a rapid and simple method for the preparation of emulsion-templated OSTE monoliths in microfluidic channels based on thiol-ene chemistry [11]. They also demonstrated that the prepared OSTE monoliths could be reversibly post-functionalized with enzymes through the formation of disulfide bonds upon incubation during several hours at low temperature. In 2016, Çakmakçi et al. reported the functionalization of the OSTE surface with thiol excess by maleic anhydride through click chemistry reaction initiated by UV light in the presence of a photoinitiator [12]. Thiyl radicals obtained in the first step react with the carbon double bonds of maleic anhydride to form covalent bonds between the polymer and the organic molecule. Similarly, in 2017, Campos et al. immobilized cysteine molecules on OSTE surfaces with allyl excess by the click chemistry reaction [10] for further enzyme immobilization.
The conception of new analytical microfluidic systems often requires microchannel surface modifications to integrate selective ligands towards a target compound for sample purification, preconcentration, and detection purposes [19]. Among others, aptamers are oligonucleotides (DNA or RNA) that interact specifically with their target (like small organic molecules, peptides, nucleic acids, proteins, etc.) by chemical affinity [20]. They are useful for specific extraction/preconcentration of targets present at low levels in complex samples such as biological fluids [21]. Chemical methods for the immobilization of aptamers have been developed over the decade [22]. The functionalization of macroscopic gold surfaces by aptamers is one of the most common approaches [22]. Typically, a clean gold substrate is immersed in an aqueous buffer solution of thiol-terminated aptamers, which then form a self-assembled monolayer-like aptamer on the gold surface [22]. Aptamers have also been immobilized onto surfaces of gold nanoparticles (AuNPs) using similar procedures [23]. In 2013, Girardot et al. proved that aptamers grafted on maghemite/silica core-shell particles preserved their activity as compared to free aptamers in solution [24]. Silicate and silicon substrates have also been used for aptamer immobilization. Recently, the direct grafting of aptamers on monolithic structures has attracted attention too [25]. Monolithic supports have generally been chemically modified to insert chemical groups that can further react with modified aptamers. The grafting of aptamers modified by thiol groups was mainly carried out on ene-monolith by the heat-[26] or UV-[27] induced click chemistry reaction, the latter in the presence of a photoinitiator. For example, the high affinity between thiol and gold was used to cover a thiol-substituted monolithic oligosorbent with gold nanoparticles and then immobilize thiol-terminated aptamers on the top of it [28]. Sol-gel monoliths also proved to retain aptamers without any modification or covalent grafting of the polymeric structure, while preserving their activity towards their target [29].
In this study, we report for the first time the possibility to anchor aptamer selected against sulforhodamine B onto the surface of an OSTE polymeric substrate. For this purpose, two strategies were developed and compared. The first one relies on a direct UV-initiated click chemistry reaction to graft thiol-terminated (C3-SH) aptamers on ene-terminated OSTE surfaces. The second one consists of the immobilization of thiol-terminated aptamers onto OSTE substrates beforehand covered with gold nanoparticles. The presence of an intermediate gold nanoparticle layer on OSTE has shown great interest in the efficient immobilization of aptamers but also prevents their non-specific adsorption. Moreover, we evidenced the preservation of the affinity between the aptamer and its fluorescent target (sulforhodamine B) in this configuration. With the last innovative strategy, the creation of multiple functional zones in an open OSTE-microchannel, thanks to the immobilization of thiolated aptamers in consecutive areas by simple droplet deposition methodology, was studied so as to generate multiple extraction and preconcentration zones.
2. Experimental
2.1. Chemicals and Materials
The aptamer used for proof of concept is an oligonucleotide anti-sulforhodamine B purchased from Integrated DNA Technologies (Coralville, Iowa 52241, USA), which has the following sequence: AlexaFluor® 532-5′-CCG GCC TAG GGT GGG AGG GAG GGG GCC GG-3′-C3-SH. The aptamer sequence was modified at 5′-end with a fluorescent tag: AlexaFluor® 532 and at 3′-end with C3-SH group. Sulforhodamine B, AlexaFluor® 532, AuNP solutions (diameter 30, 40, 50, and 60 nm), triallyl-1,3,5-triazine-2,4,6 (1H,3H,5H)-trione, monosodium phosphate, chloroauric acid, sodium phosphate dibasic were purchased from Sigma-Aldrich (USA). Pentaerythritol tetrakis(2-mercaptoacetate) was purchased from TCl (India). Ethyl phenyl (2,4,6-trimethylbenzoyl)phosphinate (97%) was purchased from Ark Pharm. Inc (Interchim, France). Citrate sodium was purchased from Labsynth, a product by Ltda Laboratory (Diadema, Brazil). Magnesium chloride was purchased from Fluka (France). Poly(methylmethacrylate) and ethanol were purchased from VWR (USA). All solutions were prepared with static ultrapure water (resistivity 18.2 MΩ.cm, Purelab Flex, Elga Veolia, France).
Silicon wafers (4 inches, 500 µm of thick) were purchased from Prolog Semicor (Kiev, Ukraine). SU-8-2050 was purchased from MicroChem (Iselin, USA).
2.2. Aptamer Preparation
Lyophilized aptamer anti-sulforhodamine B was suspended in ultra-pure water and were separated in aliquots to be stored at −20 °C. Before use, aptamers were prepared in a buffer solution and activated at 70 °C for 10 min, then allowed to cool to room temperature. The final compositions of BGEs were phosphate sodium (pH 8, ISx with x = 50, 150, or 300 mM) + 5 mM MgCl2. When the strands of aptamer were tagged with a fluorophore (AlexaFluor® 532) at the 5′-end, the preparations were made in the dark.
2.3. Synthesis of Gold Nanoparticles
Two AuNP solutions (AuNPs-1 and -2) were synthesized using the Turkevic et al. method [30]. Ninety-five mL of ultra-pure water with 36.6 µL chloroauric acid solution were mixed under heating (100 °C) with 1.6 mL or 1.8 mL of 2% (w/w) citrate sodium solution for AuNPs-1 and -2, respectively. During synthesis, the solutions changed from light yellow color to black color and finally to cherry color. The heating was stopped when the colloidal solutions reached the cherry color. AuNP solutions were stored at 4 °C. The solutions were characterized by UV-visible spectrophotometry (Specord 210 plus, Analytic Jena, Jena, Germany), TEM (JEOL JEM-2000EX, Japan) and DLS (Zetasizer Nano ZS, Malvern Panalytical, Orsay, France) to determine the concentration and the size of AuNPs. The concentration of AuNP solutions synthesized was determined using calibration curves obtained by the UV-Vis spectrophotometric characterization (400–800 nm) of AuNP commercial solutions with 30, 40, 50, and 60 nm in diameter using the Beer–Lambert Law to determine the molar extinction coefficient. AuNPs-1 have a dry diameter of 28 nm with a concentration equal to 1.4 ± 0.3 × 10⁻¹⁰ M. AuNPs-2 have a dry diameter of 18 nm with a concentration equal to 1.3 ± 0.3 × 10⁻⁹ M.
The immobilization of AuNPs on OSTE plates was characterized by Scanning Electron Microscopy (MEB, Quanta-FEG-250, ThermoFisher scientific, Hillsboro, Oregon 97124 USA), by Energy Dispersive Spectroscopy (EDS, JSM-6360 L, Austin, USA) and by X-ray Photoelectron Spectroscopy (XPS, Kratos Axis Ultra DLD, Manchester, UK). Before characterizations, plates were washed for 1 min with ultra-pure water using ultrasound to remove all physisorbed AuNPs.
2.4. OSTE Plates and Microchannel Fabrication
First, microchannel patterns were fabricated by photolithography using a chrome photomask. Photoresist (SU-8-2050) was poured onto a 4-inch silicon wafer, heated (65 °C for 3 min and 95 °C for 6 min) and spin-coated at 4000 rpm. Then the silicon wafer was heated (65 °C for 1 min and 95 °C for 6 min) before UV irradiation (UV-KUB Z, Kloé, Montpellier, France) for 7 s at 23.4 mW.cm2 through the chrome mask to create a mold master of 40 µm thick structure. The development was managed with poly(ethylene glycol) methyl ether acrylate) solvent for 5 min. Then OSTE substrate was processed as described below with pentaerythritol tetrakis(2-mercaptoacetate) (thiol) and triallyl-1,3,5-triazine-2,4,6 (1H,3H,5H)-trione (allyl) as monomeric precursors. Thiol and allyl precursors, were mixed to form OSTE plates (1 cm × 3 cm × 0.5 mm) or OSTE open single channels (2 mm × 2.5 cm × 40 µm) in the presence of 0.01% w/w photoinitiator (ethyl phenyl (2,4,6-trimethylbenzoyl)phosphinate)) and UV irradiation (5 × 8 W tubes, 365 nm, 0.025 J, Vilber Lourmat), as described elsewhere [10]. Briefly, the allyl and thiol precursors were mixed with the photoinitiator in the dark. Then, the mixture was put in vacuum desiccators for 15 min to remove air bubbles. Finally, the polymer was poured over a flat PMMA (polymethyl methacrylate) support (for plates) or SU-8 mold (for open microchannel) and exposed to UV radiation for 20 mins. After UV exposure, the substrate was heated to 70 °C for 5 min in the oven to facilitate unmolding. The ratios between thiol and allyl precursors were: 2.5:1 (w/w) and 1:1.3 (w/w), [10] named 2.5 thiol and 1.3 allyl, respectively.
All substrates were washed using ethanol and deionized water under ultrasounds for 5 min and dried using nitrogen before functionalization.
2.5. Procedure of Plates and Open-Microchips Functionalization
Two immobilization strategies of thiolated aptamers have been investigated on OSTE plates: (i) via the click chemistry reaction between the 3′-end C3-SH group of aptamers and the allyl groups on the OSTE surfaces under UV irradiation (40 min, 5 × 8 W tubes, 365 nm, 0.025 J) or (ii) via the immobilization of aptamers on AuNPs deposited beforehand on OSTE surfaces. The aptamer was modified at the 5′-end with a fluorescent tag: AlexaFluor® 532 to permit the characterization of its immobilization on OSTE surfaces with fluorescence microscopy measurements. For the first strategy, a 10 µL drop of 100 µM aptamer solution was deposited on OSTE surfaces. For the second strategy, two AuNPs immobilization procedures were studied: (i) the immersion of plates into an AuNP solution (one day, natural light, room temperature, named “incubation treatment”) or (ii) the deposition of a 10 µL drop of AuNP suspension under UV irradiation (40 min, 5 × 8 W tubes, 365 nm, 0.025 J, named “UV treatment”). To remove the unadsorbed AuNPs, the plates were washed with ultra-pure water in an ultrasonic bath for 1 min. In the same manner, two procedures for aptamer immobilization on gold-coated OSTE surfaces were considered: a 10 µL drop of 100 µM aptamer solution was deposited and (i) let rest for 24 h in the dark, named “incubation treatment”, or (ii) UV-irradiated for 40 min (5 × 8 W tubes, 365 nm, 0.025 J), named “UV treatment”. Ungrafted aptamers were washed out under a continuous flow of ultra-pure water for 3 min. All strategies for aptamer immobilization with detailed procedures are summarized in Figure 1.
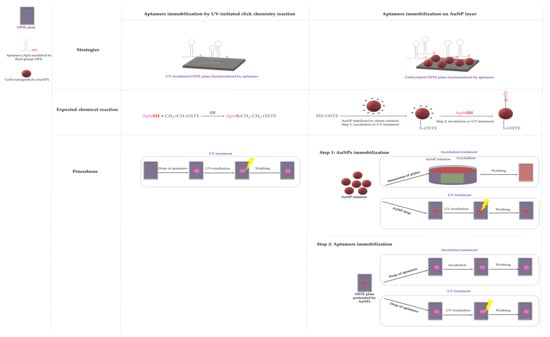
Figure 1.
Strategies and procedures of functionalization.
The procedures were equivalent for open-microchannels: a 3 µL drop of AuNP solution was deposited, and the substrate was irradiated under UV light (Vilber Lourmat, Spain) for 15 min at 365 nm to immobilize AuNPs. To remove the unadsorbed AuNPs, the microchannels were washed with ultra-pure water in an ultrasonic bath for 1 min. Then, a 3 µL drop of 14.5 µM thiolated aptamer solution was then deposited on gold-coated OSTE surfaces and exposed to UV light with the same parameters used for AuNP immobilization. Ungrafted aptamers were washed out under a continuous flow of ultra-pure water for 3 min. Droplet deposition was carried out manually with a micropipette. For each open-microchannel, seven droplets of AuNP and then aptamer solutions were deposited in a row to get consecutive functional zones.
2.6. Affinity Tests
The affinity test was performed in open-microchannel functionalized with an aptamer as described in Section 2.5. All experiments were done with non-fluorescent thiolated aptamers (bearing no fluorescent tag at the 5′-end) so as to only measure the signal contribution of the fluorescent target sulforhodamine B [29]. The open-microchannel was immersed for one night in a 14.5 µM sulforhodamine B (fluorescent target) solution prepared in a sodium phosphate buffer (pH 8 at various ISx (x = 50 or 300 mM) + 5 mM MgCl2). Microchannels were washed by immersion for 3 min in the same buffer solution to remove sulforhodamine B that did not bind to aptamers.
2.7. Fluorescence Characterizations
Fluorescence images were recorded using an inverted fluorescence microscopy system in the reflexion mode (Axio Observer A1, Zeiss, Germany) equipped with a 120 W metal halide lamp (Osram, Germany) for fluorescence excitation and a CCD digital camera (Pike F145B, Allied Vision Technologies Stadtroda, Germany) for image acquisition via Hiris software (RD Vision, Saint-Maur des Fossés, France). Images were reprocessed using Zen software (Carl Zeiss, Jena, Germany). Images were recorded using an objective with 10× (for plates) or 5× (for microchannel) magnification. The acquisition parameters of the CCD camera were kept constant, with a 1 s exposition time, no gain, and no binning for studies on plates and on the localized functionalization of aptamers in open-OSTE microchannels. For affinity study, the CCD camera parameters were kept constant, with 2.5 s exposition time, no gain, and no binning. A 550 nm excitation filter and a 605 nm emission filter (filter set 43 HE, Carl Zeiss, Jena, Germany) were used for fluorescence imaging. The relative fluorescence gain (for plates) was calculated as follows: (I-I0)/I0, with I being the fluorescence intensity measured on the aptamer-functionalized surfaces after rinsing, and I0 the fluorescence intensity measured on raw or gold-coated OSTE surfaces. I and I0 are the mean of one independent measure on three different samples (n = 3) treated under identical experimental conditions in the plate format. The fluorescence intensity value in the microchannels is given after treatment and rinsing. The fluorescence intensity is the mean of one independent measure on seven different areas treated with aptamers in the same microchannel (n = 7). To test the robustness of the overall microfabrication process, including the localized aptamer immobilization step, measurements were carried out in three different microchannels treated under identical experimental conditions.
2.8. Calibration Curves
On OSTE surfaces, AuNP droplets were deposited and exposed to UV light, as described in Section 2.5. To remove non-chemisorbed AuNPs, OSTE substrates were washed with ultra-pure water in an ultrasonic bath for 1 min. Calibration curves relating the intensity of fluorescence to the surface concentration of the aptamer were carried out as follows: a known volume of aptamer solution of a given concentration CApt was deposited on a gold-coated OSTE substrate (see Section 2.5) and after evaporation of the solution and estimation of the area of the zone covered by the dried drop, the concentration CApt was translated into the surface concentration [Apt]. The surface concentration of the immobilized aptamers was then obtained from these calibration curves in both plate and microchannel formats: f((I-I0)/I0) = a × CApt or f(I) = a × CApt + b with I0 being the intensity of the fluorescence of the gold-coated OSTE substrate, CApt the surface concentration of the aptamer (picomoles/mm2) in the deposition zone, and I the intensity of fluorescence of the above-mentioned zone after aptamer deposition. To further estimate the density of bound sulforhodamine B, calibration curves were plotted as follows: f(I) = a × CSB + b with CSB being the known molar concentration of sulforhodamine B (moles/L) solution deposited in the microchannel format and I being the intensity of fluorescence of the target on gold-coated OSTE surface. AuNP droplets were deposited in open OSTE microchannels and exposed to UV light (see Section 2.5). To remove non-chemisorbed AuNPs, OSTE substrates were washed with ultra-pure water in an ultrasonic bath for 1 min. Then, a sulforhodamine solution of known concentration was deposited on gold-coated OSTE microchannels following the process described in Section 2.5. The experimental set-up and parameters to measure fluorescence intensity are the same as those used for the characterization of functionalized OSTE microchannels (See Section 2.7).
3. Results & Discussion
3.1. Methodological Study on Modification Strategies of OSTE Polymer Surface by Aptamer
Two strategies for the immobilization of thiol-modified (C3-SH) aptamers on OSTE polymer surfaces were developed. The first one relies on a direct UV-initiated click chemistry reaction to graft the thiol-terminated aptamers on ene-terminated OSTE surfaces. The second one consists of the immobilization of thiol-terminated aptamers onto OSTE substrates coated beforehand with gold nanoparticles (Figure 1). Fluorescent thiolated aptamer (modified in 3′ by C3-SH and in 5′ by AlexaFluor® 532) immobilization efficiency was evaluated by fluorescence microscopy.
3.1.1. Aptamer Immobilization by the UV-Initiated Click Chemistry Reaction
In the first approach, a direct UV-initiated click chemistry reaction was implemented to graft fluorescent thiol-terminated aptamers on OSTE surfaces (Figure 1). The ratios of thiol and allyl precursors were 2.5:1 (w/w) or 1:1.3 (w/w) [10], named 2.5 thiol and 1.3 allyl, respectively. The fluorescence intensity was measured after plate rinsing to remove aptamers in excess. Experiments were run in triplicates on independent polymeric substrates (2.5 thiol and 1.3 allyl). Non-specific adsorption was evaluated by using the same fluorescent aptamer sequence under identical experimental conditions, but without C3-SH modification at the 3′ end (non-thiolated aptamer). The fluorescence intensity of the OSTE plates treated with buffer was also measured as a control. Fluorescence gain measured on UV-irradiated OSTE plates modified with thiolated aptamers was significant as compared to controls and reached about 160 % and 70 % for 2.5 thiol and 1.3 allyl plates, respectively (Figure 2). This confirms the presence of aptamers on OSTE surfaces. It can be noticed that the increase in fluorescence intensity on 2.5 thiol plates was higher than on the 1.3 allyl plates, probably due to the favored formation of strong disulfide bonds between the thiol groups of the aptamer and the 2.5 thiol plate surface [14]. This would tend to show that the main mechanism controlling the immobilization of the aptamer is the formation of disulfide bonds instead of S-C bonds, as a consequence of the click chemistry reaction. Nevertheless, fluorescence gains of UV-irradiated OSTE plates are similar to thiolated or non-thiolated aptamers. This leads to the conclusion of a prominent contribution of non-specific interactions in the aptamer immobilization mechanism. The non-specific interactions could be due to the reaction between thiol groups on OSTE surfaces and guanine radicals of the synthetic DNA formed during the UV irradiation at 365 nm [31].
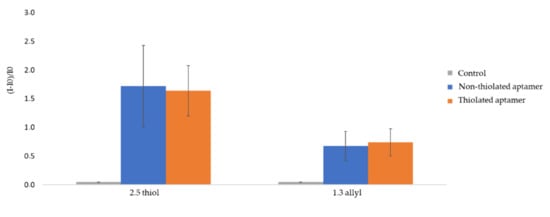
Figure 2.
Relative fluorescence intensity of UV-irradiated OSTE plates (2.5 thiol and 1.3 allyl). I0 is the fluorescence intensity of the raw material and I is the fluorescence intensity of UV-irradiated OSTE plates measured after rinsing (See experimental section for more details on experimental conditions and fluorescence measurement parameters). The error bars represent the standard deviation for three repetitions.
This may induce serious limitations when implementing this functionalization approach in the creation of multiple isolated zones.
3.1.2. Aptamer Immobilization on AuNPs-Coated OSTE Surfaces
To avoid the contribution of non-specific adsorption, OSTE surfaces were chemically modified to create selective bonding of the thiolated aptamers. Therefore, a second strategy involving a surface pretreatment with AuNPs was envisioned. In a first attempt, two immobilization ways of AuNPs-1 on OSTE surfaces (2.5 thiol and 1.3 allyl) were explored (Figure 1). The first one, named incubation treatment, consisted of immersing OSTE plates into an AuNP-1 solution (1.4 × 10⁻¹⁰ M) for 24 h (Figure 1). As for the second one, 10 µL of an AuNP-1 solution (1.4 × 10⁻¹⁰ M) was deposited onto OSTE surfaces, that were then irradiated for 40 min under UV light (Figure 1). This treatment is named UV treatment. SEM images and corresponding XPS spectra of gold-coated OSTE plates are presented in Figure 3.
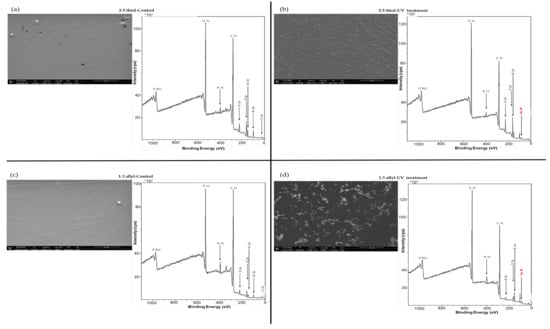
Figure 3.
SEM micrography and XPS spectra of OSTE surfaces (a,b) 2.5 thiol and (c,d) 1.3 allyl) raw material for control (a,c) and after UV treatment (b,d). The plates were treated with the AuNP-1 solution. Plates were washed with ultra-pure water using ultrasound for 1 min before surface characterization (See experimental section for more details on experimental condition).
The S 2p peak on the XPS spectra of OSTE control plates (Figure 3a,c) is 10 times higher for the 2.5 thiol plate than for the 1.3 allyl plate, in accordance with the polymer formulation. SEM, EDS and XPS characterizations did not permit to confirm the presence of gold on OSTE surfaces (2.5 thiol and 1.3 allyl) after incubation treatment (Table S1 and Figure S1). However, SEM and XPS spectra (Figure 3), as well as EDS (Table S1) confirmed the presence of gold on OSTE plates after UV treatment. A close observation of the 2.5 thiol and 1.3 allyl surface topologies obtained with SEM characterization seems to evidence the presence of AuNP aggregates (Figure 3b,d). However, the distribution of AuNP aggregates on a 2.5 thiol surface is more homogeneous than on a 1.3 allyl one (Figure 3b,d). Therefore, subsequent aptamer immobilization studies were first performed on 2.5 thiol substrates beforehand coated with AuNPs using the UV treatment.
Fluorescent C3-SH-modified aptamer immobilization was performed by incubation or UV treatment (Figure 1). As the presence of thiol groups in contact with gold surfaces generally generates the formation of S-Au covalent bonds [23], the immobilization of aptamers on the gold NPs was studied in these conditions. Non-specific adsorption was evaluated by implementing the same protocol with fluorescent non-thiolated aptamers. AuNP-coated 2.5 thiol plates (UV treatment) treated with buffer only were considered as controls. The corresponding fluorescence gains due to fluorescent aptamer binding onto gold-coated 2.5 thiol plates are displayed in Figure 4.
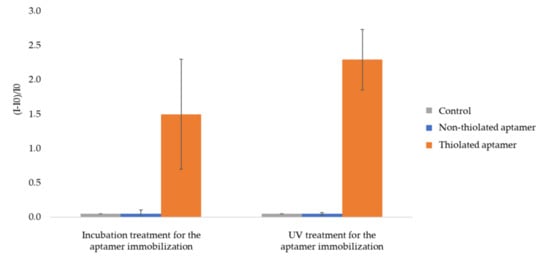
Figure 4.
Relative fluorescence intensity of AuNPs 1-coated 2.5 thiol plates functionalized by fluorescent aptamer. I0 is the fluorescence intensity of AuNPs-1-coated 2.5 thiol substrate. I is the intensity of fluorescence measured after functionalization by aptamers and rinsing (See experimental section for more details on experimental conditions and fluorescence measurement parameters). The error bars represent the standard deviation for 3 repetitions.
Whatever the experimental procedure (incubation or UV treatment) for aptamer grafting, fluorescence gains are close to zero for the control and AuNP-coated plates treated with fluorescent non-thiolated aptamers but markedly high (150 % for incubation treatment and 230 % for UV treatment, respectively) for AuNP-coated plates treated with fluorescent thiolated aptamers. From these results, it clearly appears that the presence of the homogeneous gold nanostructured layer beforehand deposited on 2.5 thiol plates by UV treatment (i) promotes aptamer immobilization through specific covalent bonding and (ii) prevents any non-specific interaction as compared to aptamer direct immobilization strategy (Figure 2). It was not possible to quantitatively compare the fluorescence gains obtained upon UV or incubation treatments as UV exposure induces the photobleaching of the fluorescent tag. Indeed the exposure of the aptamer fluorescent tag (AlexaFluor® 532) to UV light led to a 64 ± 10% decrease in measured fluorescence intensity. Thus, it can only be put forward that UV treatment is a faster treatment than the incubation one.
Aptamer immobilization onto AuNP-coated 1.3 allyl plates by UV treatment was performed under the same experimental conditions as for 2.5 thiol AuNP-coated plates. The obtained results show an important retention of non-thiolated aptamer. Indeed, the relative fluorescence gains values for fluorescent non-thiolated and thiolated aptamers were 210% and 260% for incubation treatment, and 200% and 130% after UV treatment, respectively (Figure 5). This was attributed to the inhomogeneous coverage of 1.3 allyl plates by AuNPs (Figure 3d), allowing for non-specific adsorption on the native OSTE material. Therefore 2.5 thiol substrates appeared as the most suitable material to prevent non-specific adsorption after surface pretreatment with AuNPs.
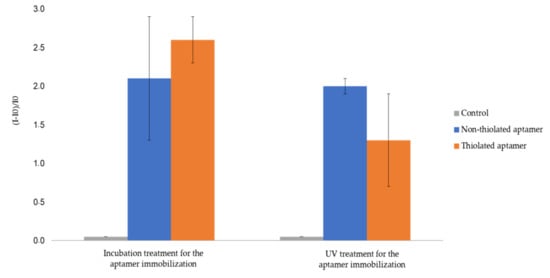
Figure 5.
Relative fluorescent intensity of gold (AuNPs-1)-coated 1.3 allyl plates functionalized by fluorescent aptamerd. I0 is the fluorescence intensity of gold (AuNPs-1)-coated 1.3 allyl substrate. I is the intensity of fluorescence measured after functionalization by fluorescent aptamers and rinsing (See experimental section for more details on experimental conditions and fluorescence measurement parameters). The error bars represent the standard deviation for three repetitions.
3.2. Influence of Experimental Conditions on The Functionalization of 2.5 Thiol Plates and Stability Study
3.2.1. Influence of The Ionic Strength
The influence of the ionic strength of the buffer solution on the immobilization of the aptamer onto the gold surface was investigated in previous studies [32,33]. The aptamer is a negatively charged molecule with ionizable phosphate groups. Thus, in low ionic strength buffers, the surface concentration of aptamers on the gold surface should be low, owing to the repulsion between the negatively charged aptamer strands. Under high ionic strength conditions, the intermolecular electrostatic repulsion between neighboring strands of aptamers is minimized because the charged strands are electrostatically shielded, thus allowing higher surface concentrations of aptamer [33]. In this context, the influence of the ionic strength of sodium phosphate buffer (pH 8, ISx (x = 50, 150 and 300 mM) + 5 mM MgCl2) used to solubilize aptamers on their immobilization on (AuNPs-1)-coated OSTE plates was studied. Fluorescence intensities were measured after rinsing to remove non-immobilized aptamers. Relative fluorescence gains obtained are presented in Figure 6.
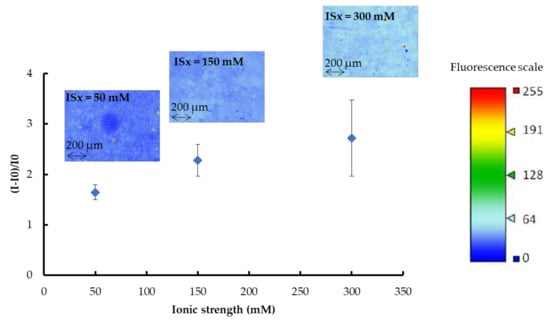
Figure 6.
Relative fluorescent gains and fluorescence images (recorded as false color) of gold (AuNPs-1)-coated OSTE plates functionalized with fluorescent thiolated aptamer in sodium phosphate buffer (pH 8, ISx with x = 50, 150, and 300 mM) + 5 mM MgCl2. I0 is the fluorescence intensity of the gold-coated OSTE substrate. I is the fluorescence intensity measured after functionalization with fluorescent thiolated aptamers and rinsing (See experimental section for more details on experimental conditions and fluorescence measurement parameters). The error bars represent the standard deviation for three repetitions.
Regardless of the ISx value, the fluorescence distribution on OSTE plates functionalized with aptamer is homogeneous. Figure 5 shows that the relative fluorescence intensity increases with ISx, as well as the standard deviation values. Calibration curves of fluorescence intensity versus the surface concentration of the aptamer (in the 0 to 14 picomoles/mm2 range) were plotted for each ISx. The equations of the calibration curves, determined as explained in Section 2.8 are: (I-I0)/I0 = 0.3343 × CApt (r2 = 0.9171) for ISx = 50 mM, (I-I0)/I0 = 0.3805 × CApt (r2 = 0.8881) for ISx = 150 mM and (I-I0)/I0 = 0.5233 × CApt (r2 = 0.9831) for ISx = 300 mM, with CApt the surface concentration of aptamer in picomoles/mm2. After rinsing, the surface concentrations of the aptamers were calculated as: 5 ± 1 picomoles/mm2, 6 ± 1 picomoles/mm2, and 5 ± 2 picomoles/mm2 for ISx = 50, 150, and 300 mM, respectively. Thus, the ionic strength of the buffer used to prepare aptamer solutions has a negligible influence on the surface concentration of the immobilized aptamers. The increase in fluorescence intensity with ISx could be explained by the variation in the distance between the dye at the 5‘-end of the aptamer and the surface according to the ISx value [34]. Rant et al. [35] have studied the influence of the distance of one dye from a gold-coated surface and showed that the energy transfer of the excited dye molecule to the metal facilitates nonradiative transitions for relaxation to the dye’s electronic ground state, causing a “quenching” of the observed fluorescence. Thus, the smaller the distance between the dye and the metal, the greater the fluorescence quenching effect, which should induce a decrease in the fluorescence intensity [35]. In our case, it is possible to make the assumption that the dye at the 5‘-end of the anti-sulforhodamine B aptamer is closer to the gold-coated OSTE surface for ISx = 50 mM than for ISx = 300 mM. Such a variation of the distance between the dye and the surface could be provoked by a conformational change of the aptamer depending on the buffer ISx. Indeed, some studies have shown the influence of nature and the concentration of alkali metals or alkaline earth metal solutions on the aptamer structure [36,37].
3.2.2. Influence of The Gold Nanoparticles Diameter
So as to optimize the surface concentration of immobilized aptamers on the gold-coated OSTE, two AuNP sizes have been evaluated: 28 and 18 nm diameter (named AuNPs-1 and -2, respectively), which is in the range typically used for ligand immobilizations (< 60 nm of diameter) [38]. For this purpose, fluorescent anti-sulforhodamine B aptamer was used for the proof of concept. As the affinity between an aptamer and its target seems favored in a low ionic strength medium (below 200 mM) [39], aptamers were dissolved in sodium phosphate buffer at ISx = 50 mM + 5 mM of MgCl2. AuNPs-coated OSTE plates treated with the buffer only were considered as control. As the fluorescence quenching of dyes increases with the decrease of gold nanoparticles size [40], calibration curves were determined for each nanoparticle size, while depositing and measuring the fluorescence of the same volume of aptamer leading to theoretical surface concentrations of 0 to 10 picomoles/mm2 for AuNPs-1 and 0 to 4 picomoles/mm2 for AuNPs-2. The calibration curves were (I-I0)/I0 = 0.33 × CApt (r2 = 0.9171) and (I-I0)/I0 = 0.23 × CApt (r2 = 0.9739) for AuNPs-1 and AuNPs-2, respectively, indicating a very low quenching effect due to AuNP size. The relative fluorescence intensities of gold-coated OSTE plates after treatment and washing under a continuous water flow for 3 min were measured as 5 ± 1 and 3 ± 1 picomoles/mm2 for AuNPs-1 and AuNPs-2, respectively, which indicates no significant effect of AuNP size on the surface concentration of immobilized aptamers.
3.2.3. Stability of Aptamer Immobilization
The stability of gold (AuNPs-1)-coated OSTE plates functionalized by fluorescent thiolated aptamers by UV treatment, stored in air (at room temperature and in the dark), was evaluated for 14 days. The relative fluorescence intensities of controls (plates treated with buffer only) are close to 0 from day zero to 14. For plates functionalized with fluorescent thiolated aptamers, the relative fluorescence intensities decrease by about 8 % to 18 % according to ISx. Indeed, relative fluorescence intensities decrease from 1.6 ± 0.2 to 1.3 ± 0.2 for ISx = 50 mM, from 2.3 ± 0.3 to 1.9 ± 0.3 for ISx = 150 mM, and from 2.7 ± 0.8 to 2.5 ± 0.3 for ISx = 300 mM, just after functionalization and after 14 days storage, respectively. The functionalization is, therefore, considered as stable in the air over a period of two weeks.
3.3. Aptamer Immobilization as Multiple Zones in 2.5 Thiol Ppen-Microchannel
Immobilization of aptamers in multiple zones of a 2.5 thiol open-microchannel was performed by successive droplet depositions of AuNPs-2 and aptamer solutions cured by UV irradiation. In a 3.5 cm length channel, seven droplets of c.a. 1 mm radius separated by c.a. 3 mm of distance were deposited. A fluorescence image of a section of the functionalized microchannel after rinsing is presented in Figure 7. The unique example of such local surface modification reported in the literature is that of Campos et al. [10] who performed the grafting of enzymes on the wall of a closed-microchannel by the UV-initiated click chemistry reaction, placing on the top of the OSTE microchannel a mask designed as a chess-board, with square spots of 1 × 1 cm. In this context, our approach allows creating, for the first time, by implementing a mask-free process, multiple discrete functional zones with controlled spacing between each other.
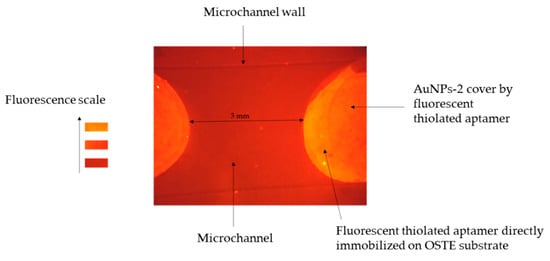
Figure 7.
Fluorescence image of an open OSTE-microchannel coated with AuNPs-2 and functionalized with fluorescent aptamers. The image acquisition was recorded after rinsing the excess of the aptamer (See experimental part for more details on the experimental conditions and the fluorescence detection set-up).
Fluorescence intensity values of open OSTE-microchannels functionalized as described above with fluorescent thiolated aptamers, non-fluorescent thiolated aptamers, and without an aptamer (as a control) after rinsing, are presented in Figure 8.
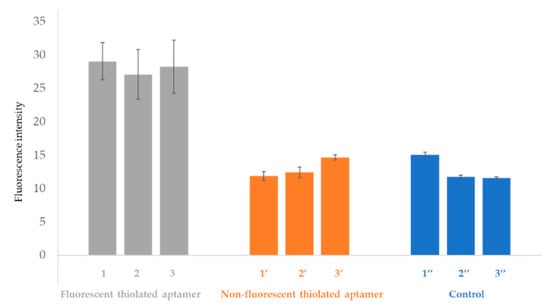
Figure 8.
Fluorescence intensity of gold (AuNPs-2)-coated open OSTE-microchannels functionalized with fluorescent thiolated aptamers (channels 1, 2, and 3), non-fluorescent thiolated aptamer (channel 1′, 2′, and 3′). As controls, microchannels (1′′, 2′′, and 3′′) were treated according to the same experimental process but only with droplets of sodium phosphate buffer (pH 8, IS = 50 mM) + 5 mM MgCl2. Fluorescence intensities are presented after washing the microchannels (See experimental section for more details on experimental conditions and fluorescence measurement parameters). Error bars represent standard deviations for seven repetitions.
As can be seen in Figure 8, the fluorescence intensities of the controls and the microchannels treated with non-fluorescent aptamers are similar. The fluorescence intensity values of the controls and the microchannels treated with non-fluorescent aptamers are different from zero due to the auto-fluorescence of the OSTE polymer. The fluorescence intensity gain for experiments performed in the presence of fluorescent aptamers is 54% compared to the control. This result demonstrates the local immobilization of aptamers on gold-coated open OSTE-microchannels, and evidences that the fluorescence is only due to the fluorescent tag on the aptamer strand at the 5′-end. The fluorescence intensity values are similar between batches of microchannels functionalized by fluorescent aptamers (channels 1, 2, and 3), which proves the reproducibility of the overall microfabrication process.
The surface concentration of immobilized aptamers was calculated after establishing a calibration curve ((I-I0)/I0 = 1.8684 × CApt + 11.9, r2 = 0.91, in the 0 to 14 picomoles/mm2 range). The average surface coverage of aptamers immobilized through this process on gold-coated 2.5 thiol microchannels was estimated at 9 ± 1 picomoles/mm2. The surface coverage is higher than the one previously calculated on plates (5 picomoles/mm2). This can be explained by a higher preconcentration effect due to the rapid evaporation of the 3 µL droplets deposited on microchannel during UV-irradiation.
3.4. Affinity Study
It is known that the ionic strength of the buffer used for the affinity test can have an important influence on the non-covalent interactions between the aptamer and its target [39]. Thus, buffer solutions at two different ISx (50 or 300 mM) were used to solubilize the aptamer and sulforhodamine B. Open-microchannels were functionalized with the same protocol used in Section 3.3: AuNPs-2 and aptamers were immobilized by droplet (3 µL) deposition: seven spots in a row of c.a. 1 mm radius and separated by c.a. 3 mm. For this study, non-fluorescent thiolated aptamers were used for the functionalization to allow measuring only the signal contribution of the fluorescent target sulforhodamine B [29]. The open-microchannel was then immersed one night in a solution containing sulforhodamine B at 14.5 µM. To remove the non-retained sulforhodamine B, the microchannels were immersed for 3 min in the buffer solution used for sulforhodamine B solubilization. As a control, solubilization buffer was introduced instead of the aptamer solution for the functionalization step.
The corresponding fluorescence images (image in false color) of the microchannel after the affinity test and rinsing are presented in Figure 9. The fluorescence signal from areas functionalized with non-fluorescent thiolated aptamer (affinity test) is higher than the one of non-functionalized areas (control). However, fluorescent spots are observed for the control experiences (Figure 9a,c), meaning that non-specific interactions (electrostatic interactions) between the negatively-charged fluorescent targets and the surface of the gold nanoparticles may occur. As the fluorescence intensity values of the controls are equal to 42 ± 3 and 37 ± 3 for ISx = 50 mM and ISx = 300 mM, respectively, no significant influence of the ionic strength could be evidenced on the non-specific adsorption of the sulforhodamine B on gold-coated OSTE surfaces.
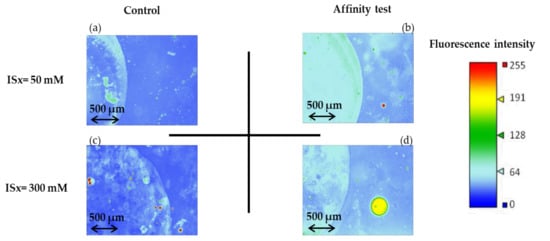
Figure 9.
Fluorescence images (recorded as false color) of the microchannels after the affinity test for sulforhodamine B and after rinsing (See experimental section for more details on experimental conditions and fluorescence measurement parameters). (a,b) are the fluorescence images recorded for experiences carry out with the phosphate sodium buffer with ISx = 50 mM, for the control and affinity test, respectively, and (c,d) are the fluorescence images recorded for the experiences to carry out the phosphate sodium buffer at ISx = 300 mM.
However, when AuNPs are grafted with aptamers, fluorescence imaging (Figure 9b,d) allows to evidence the interaction with the fluorescent target, even after the rinsing step. This aptamer/target interaction leads to higher and more homogeneous coverage of the functionalized zone by the target at ISx = 50 mM than at ISx = 300 mM, in accordance with previously reported studies [29]. Thanks to a calibration curve plotted for CSB ranging from 0 to 3.3 × 10⁻⁹ M (I = 1 × 10¹⁰ [SB]+37.357, r2 = 0.9955), the concentration of sulforhodamine B at ISx = 50 mM present at the surface after rinsing is estimated to 1.9 ± 0.1 × 10⁻⁹ M and corresponds to the concentration of the aptamer-sulforhodamine B complex formed.
The obtained results prove that aptamers immobilized on AuNPs-coated microchannels can capture their target in buffer solution at ISx = 50 mM, so this microfluidic system can be adapted for the development of the LOAC containing several extraction/preconcentration zones for the simultaneous analysis of multiple compounds of interest present in low concentrations in complex samples.
4. Conclusions
This study demonstrated the creation of multiple functional zones in an OSTE open-microchannel for efficient pre-treatment and preconcentration via aptamer immobilization. Two strategies for OSTE functionalization by aptamers modified at their 3′-end by C3-SH were studied for the first time. The direct UV-initiated click chemistry reaction between the allyl groups of OSTE materials and thiolated aptamers favored the non-specific immobilization of aptamers on OSTE surfaces. A second strategy consisted of pre-coating OSTE materials with AuNPs either by incubation or UV treatment, the latter providing a better coverage ruggedness and a more homogeneous distribution of AuNPs on 2.5 thiol plates. Finally, aptamers modified with C3-SH at their 3′-end could be efficiently immobilized on gold-coated 2.5 thiol plates by both UV and incubation treatments, with negligible non-specific adsorption of the aptamer. As the UV treatment allows to reach a faster functionalization as compared to the incubation treatment, it was chosen for the development of the microchannel with multiple functional zones based on the immobilization of thiolated aptamers. Thanks to this methodological development, a fast and cheap method to create multiple aptamer immobilization zones by droplet deposition was demonstrated for the first time in an OSTE open-microchannel. The droplet deposition does not necessitate expensive and complicated devices and allows the creation of several consecutive zones of 1 mm radius in only 30 min in open-single OSTE-microchannels with a mask-free process. Moreover, we proved that immobilized aptamers preserve their affinity for the target to be captured, leading to a purification and preconcentration strategy, which can be adapted for the industrial development of LOAC containing several zones of extraction/preconcentration for multiple compounds of interest present at trace level in complex samples.
Supplementary Materials
The following are available online at https://www.mdpi.com/2227-9040/8/2/24/s1, Table S1: Gold atoms characterized by EDS (energy dispersive spectroscopy) of OSTE surfaces either raw or treated (incubation and UV treatment) with gold nanoparticles. Plates were washed with ultra-pure water using ultrasound for 1 min before surface analysis (See experimental section for more details on experimental conditions), Figure S1: SEM micrography and XPS spectra of OSTE surfaces ((a) 2.5 thiol and (b) 1.3 allyl) after incubation with gold nanoparticles. Plates were washed with ultra-pure water using ultrasound for 1 min before surface characterizations (See experimental section for more details on experimental conditions).
Author Contributions
Conceptualization, A.V., F.B., J.A.F.d.S.; methodology, S.G., F.d., S.B., F.B., J.A.F.S, A.V.; validation, S.G., F.d., F.B., J.A.F.d.S. and A.V.; formal analysis, S.B.; investigation, S.B.; resources, A.V., F.B., J.A.F.d.S.; writing—original draft preparation, S.B.; writing—review and editing, S.G., F.d., F.B., J.A.F.d.S., A.V.; visualization, S.B., S.G., F.d., F.B., J.A.F.d.S., A.V.; supervision, A.V., F.B., J.A.F.S; project administration, A.V., F.B., J.A.F.d.S.; funding acquisition, A.V., F.B., J.A.F.d.S. All authors have read and agreed to the published version of the manuscript.
Funding
This work was financially supported by CAPES-COFECUB (802-14); FAPESP (2013/22127-2); CNPq (444514/2014-7); INCTBio; PICS CNRS (A1INC 229294, France Brazil 2019-2021); and Michem.
Acknowledgments
This study has received the technical support of “Institut Pierre-Gilles de Gennes” (laboratoire d’excellence, “Investissements d’avenir”program ANR-10-IDEX-0001-02 PSL and ANR-10-LABX-31). Acknowledgment to PSL (France) for their support.
Conflicts of Interest
The authors declare no conflict of interest.
References
- Contreras-Naranjo, J.C.; Wu, H.-J.; Ugaz, V.M. Microfluidics for exosome isolation and analysis: Enabling liquid biopsy for personalized medicine. Lab Chip 2017, 17, 3558–3577. [Google Scholar] [CrossRef] [PubMed]
- Auroux, P.-A.; Koc, Y.; deMello, A.; Manz, A.; Day, P.J.R. Miniaturised nucleic acid analysis. Lab Chip 2004, 4, 534–546. [Google Scholar] [CrossRef] [PubMed]
- Sackmann, E.K.; Fulton, A.L.; Beebe, D.J. The present and future role of microfluidics in biomedical research. Nature 2014, 507, 181–189. [Google Scholar] [CrossRef] [PubMed]
- Tomazelli Coltro, W.K.; Cheng, C.-M.; Carrilho, E.; de Jesus, D.P. Recent advances in low-cost microfluidic platforms for diagnostic applications: Microfluidics and Miniaturization. Electrophoresis 2014, 35, 2309–2324. [Google Scholar] [CrossRef]
- Chin, C.D.; Linder, V.; Sia, S.K. Commercialization of microfluidic point-of-care diagnostic devices. Lab Chip 2012, 12, 2118–2134. [Google Scholar] [CrossRef]
- Rodriguez, I.; Spicar-Mihalic, P.; Kuyper, C.L.; Fiorini, G.S.; Chiu, D.T. Rapid prototyping of glass microchannels. Anal. Chim. Acta 2003, 496, 205–215. [Google Scholar] [CrossRef]
- Chen, Y.; Pépin, A. Nanofabrication: Conventional and nonconventional methods. Electrophoresis 2001, 22, 187–207. [Google Scholar] [CrossRef]
- Carlborg, C.F.; Haraldsson, T.; Öberg, K.; Malkoch, M.; van der Wijngaart, W. Beyond PDMS: Off-stoichiometry thiol–ene (OSTE) based soft lithography for rapid prototyping of microfluidic devices. Lab Chip 2011, 11, 3136–3147. [Google Scholar] [CrossRef]
- Bartolo, D.; Degré, G.; Nghe, P.; Studer, V. Microfluidic stickers. Lab Chip 2008, 8, 274–279. [Google Scholar] [CrossRef]
- De Campos, R.P.S.; Campos, C.D.M.; Almeida, G.B.; da Silva, J.A.F. Characterization of Off-Stoichiometry Microfluidic Devices for Bioanalytical Applications. IEEE Trans. Biomed. Circuits Syst. 2017, 11, 1470–1477. [Google Scholar] [CrossRef]
- Lafleur, J.P.; Senkbeil, S.; Novotny, J.; Nys, G.; Bøgelund, N.; Rand, K.D.; Foret, F.; Kutter, J.P. Rapid and simple preparation of thiol–ene emulsion-templated monoliths and their application as enzymatic microreactors. Lab Chip 2015, 15, 2162–2172. [Google Scholar] [CrossRef] [PubMed]
- Çakmakçi, E.; Yuce-Dursun, B.; Demir, S. Maleic anhydride functionalization of OSTE based coatings via thiol-ene “Click” reaction for the covalent immobilization of xylanase. React. Funct. Polym. 2017, 111, 38–43. [Google Scholar] [CrossRef]
- Tähkä, S.M.; Bonabi, A.; Nordberg, M.-E.; Kanerva, M.; Jokinen, V.P.; Sikanen, T.M. Thiol-ene microfluidic devices for microchip electrophoresis: Effects of curing conditions and monomer composition on surface properties. J. Chromatogr. A 2015, 1426, 233–240. [Google Scholar]
- Bou, S.J.M.C.; Ellis, A.V. Microfluidic Devices Using Thiol-ene Polymers. In Proceedings of SPIE—The International Society for Optical Engineering; Friend, J., Tan, H.H., Eds.; SPIE: Bellingham, WA, USA, 2013; p. 89232B. [Google Scholar]
- Fouassier, J.P.; Rabek, J.F. Radiation Curing in Polymer Science and Technology. In Practical Aspects and Applications; Elsevier Applied Science: London, UK, 1993; Volume 4, ISBN 978-1-85166-938-7. [Google Scholar]
- Cramer, N.B.; Bowman, C.N. Kinetics of thiol-ene and thiol-acrylate photopolymerizations with real-time fourier transform infrared. J. Polym. Sci. Part A Polym. Chem. 2001, 39, 3311–3319. [Google Scholar] [CrossRef]
- Kharasch, M.S.; May, E.M. The peroxide effect in addition of regents to unsaturated compounds. XVIII. The addition and substitution of bisulfite. J. Org. Chem. 1938, 3, 3092–3098. [Google Scholar]
- Mesbah, K.; Mai, T.D.; Jensen, T.G.; Sola, L.; Chiari, M.; Kutter, J.P.; Taverna, M. A neutral polyacrylate copolymer coating for surface modification of thiol-ene microchannels for improved performance of protein separation by microchip electrophoresis. Microchim. Acta 2016, 183, 2111–2121. [Google Scholar] [CrossRef]
- Xu, Y.; Yang, X.; Wang, E. Review: Aptamers in microfluidic chips. Anal. Chim. Acta 2010, 683, 12–20. [Google Scholar] [CrossRef]
- Toulmé, J.-J.; Da Rocha, S.; Dausse, E.; Azéma, L.; Lebars, I.; Moreau, S. Les aptamères: Du concept à l’outil. Médecine Nucléaire 2007, 31, 478–484. [Google Scholar] [CrossRef]
- Reyes-Garcés, N.; Gionfriddo, E.; Gómez-Ríos, G.A.; Alam, M.D.N.; Boyacı, E.; Bojko, B.; Singh, V.; Grandy, J.; Pawliszyn, J. Advances in Solid Phase Microextraction and Perspective on Future Directions. Anal. Chem. 2018, 90, 302–360. [Google Scholar] [CrossRef]
- Balamurugan, S.; Obubuafo, A.; Soper, S.A.; Spivak, D.A. Surface immobilization methods for aptamer diagnostic applications. Anal. Bioanal. Chem. 2008, 390, 1009–1021. [Google Scholar] [CrossRef]
- Castañeda, M.T.; Alegret, S.; Merkoçi, A. Electrochemical Sensing of DNA Using Gold Nanoparticles. Electroanalysis 2007, 19, 743–753. [Google Scholar] [CrossRef]
- Girardot, M.; d’Orlyé, F.; Descroix, S.; Varenne, A. Aptamer-conjugated nanoparticles: Preservation of targeting functionality demonstrated by microchip electrophoresis in frontal mode. Anal. Biochem. 2013, 435, 150–152. [Google Scholar] [CrossRef] [PubMed]
- Masini, J.C.; Svec, F. Porous monoliths for on-line sample preparation: A review. Anal. Chim. Acta 2017, 964, 24–44. [Google Scholar] [CrossRef] [PubMed]
- Wang, Z.; Zhao, J.; Lian, H.; Chen, H. Aptamer-based organic-silica hybrid affinity monolith prepared via “thiol-ene” click reaction for extraction of thrombin. Talanta 2015, 138, 52–58. [Google Scholar] [CrossRef]
- Marechal, A.; Jarrosson, F.; Randon, J.; Dugas, V.; Demesmay, C. In-line coupling of an aptamer based miniaturized monolithic affinity preconcentration unit with capillary electrophoresis and Laser Induced Fluorescence detection. J. Chromatogr. A 2015, 1406, 109–117. [Google Scholar] [CrossRef]
- Chen, Y.; Deng, N.; Wu, C.; Liang, Y.; Jiang, B.; Yang, K.; Liang, Z.; Zhang, L.; Zhang, Y. Aptamer functionalized hydrophilic polymer monolith with gold nanoparticles modification for the sensitive detection of human α-thrombin. Talanta 2016, 154, 555–559. [Google Scholar] [CrossRef]
- Perréard, C.; d’Orlyé, F.; Griveau, S.; Liu, B.; Bedioui, F.; Varenne, A. Aptamer entrapment in microfluidic channel using one-step sol-gel process, in view of the integration of a new selective extraction phase for lab-on-a-chip: CE and CEC. Electrophoresis 2017, 19, 2456–2461. [Google Scholar] [CrossRef]
- Turkevich, J.; Stevenson, P.C.; Hillier, J. A study of the nucleation and growth processes in the synthesis of colloidal gold. Discuss. Faraday Soc. 1951, 11, 55–75. [Google Scholar] [CrossRef]
- Hagen, U. Current aspects on the radiation induced base damage in DNA. Radiat. Environ. Biophys. 1986, 25, 261–271. [Google Scholar] [CrossRef]
- Herne, T.M.; Tarlov, M.J. Characterization of DNA Probes Immobilized on Gold Surfaces. J. Am. Chem. Soc. 1997, 119, 8916–8920. [Google Scholar] [CrossRef]
- Balamurugan, S.; Obubuafo, A.; Soper, S.A.; McCarley, R.L.; Spivak, D.A. Designing Highly Specific Biosensing Surfaces Using Aptamer Monolayers on Gold. Langmuir 2006, 22, 6446–6453. [Google Scholar] [CrossRef]
- Tello, A.; Cao, R.; Marchant, M.J.; Gomez, H. Conformational Changes of Enzymes and Aptamers Immobilized on Electrodes. Bioconjugate Chem. 2016, 27, 2581–2591. [Google Scholar] [CrossRef]
- Rant, U.; Arinaga, K.; Fujita, S.; Yokoyama, N.; Abstreiter, G.; Tornow, M. Structural Properties of Oligonucleotide Monolayers on Gold Surfaces Probed by Fluorescence Investigations. Langmuir 2004, 20, 10086–10092. [Google Scholar] [CrossRef]
- Huang, C.-C.; Cao, Z.; Chang, H.-T.; Tan, W. Protein−Protein Interaction Studies Based on Molecular Aptamers by Affinity Capillary Electrophoresis. Anal. Chem. 2004, 76, 6973–6981. [Google Scholar] [CrossRef] [PubMed]
- Girardot, M.; Gareil, P.; Varenne, A. Interaction study of a lysozyme-binding aptamer with mono- and divalent cations by ACE. Electrophoresis 2010, 31, 546–555. [Google Scholar] [CrossRef] [PubMed]
- Tiwari, P.; Vig, K.; Dennis, V.; Singh, S. Functionalized Gold Nanoparticles and Their Biomedical Applications. Nanomaterials 2011, 1, 31–63. [Google Scholar] [CrossRef] [PubMed]
- Zhang, J.; Loo, R.R.O.; Loo, J.A. Structural Characterization of a Thrombin-Aptamer Complex by High Resolution Native Top-Down Mass Spectrometry. J. Am. Soc. Mass Spectrom. 2017, 28, 1815–1822. [Google Scholar] [CrossRef] [PubMed]
- Xue, C.; Xue, Y.; Dai, L.; Urbas, A.; Li, Q. Size- and Shape-Dependent Fluorescence Quenching of Gold Nanoparticles on Perylene Dye. Adv. Opt. Mater. 2013, 1, 581–587. [Google Scholar] [CrossRef]


© 2020 by the authors. Licensee MDPI, Basel, Switzerland. This article is an open access article distributed under the terms and conditions of the Creative Commons Attribution (CC BY) license (http://creativecommons.org/licenses/by/4.0/).