Abstract
A cobalt (II) oxide/carboxylic acid functionalized multiwalled carbon nanotube (CoO/COOH-MWNT) composite was fabricated for the biochemical detection of dopamine (DA). CoO particles were tethered to COOH-MWNTs by sonication. The current response versus different concentration was measured using cyclic voltammetry. Various parameters, including sonication time, pH, and loading were varied for the best current response. The composite with optimum current response was formed using a 30-min sonication time, at pH 5.0 and a 0.89 µg/mm2 loading onto the glassy carbon electrode surface. Good sensitivity with a limit of detection of 0.61 ± 0.03 μM, and dynamic range of 10–100 µM for DA is shown, applicable for neuroblastoma screening. The sensor was selective against ascorbic and uric acids.
1. Introduction
Neuroblastoma is a type of pediatric cancer that forms in the adrenal glands, which can be exhibited in the spine, chest, neck and abdomen. This condition is characterized by a high dopamine (DA) content in urinary excretion. Multiple analytical approaches, such as UV-vis spectrophotometry, high-performance liquid chromatography, fluorescence spectrophotometry and electrochemical methods, have been applied to detect dopamine in environmental and biological samples [1,2,3,4,5]. However, sample preparation prior to analysis by applying these methods can be time-consuming and complex.
Among the various techniques used for the detection of DA, electrochemical methods provide a simple and rapid means of detection without the need for costly instrumentation [6,7,8,9,10,11,12,13,14,15,16]. Normal urine pH can be slightly acidic or basic, ranging from pH = 4.5 to 8.0 [17]. Electrochemical analysis provides a rapid, cost-effective means of disease monitoring. The presence of ascorbic acid (AA) and uric acid (UA), in particular, interferes with DA during electrochemical detection and the electrochemical approach becomes difficult [18,19,20,21,22]. To this end, Khamlichi et al. [23] developed an L-leucine modified sol-gel carbon electrode for DA detection in the 10-to-120 μM concentration range in urine. We have re-designed the working electrode by incorporating solely non-perishable materials for the electrocatalyst surface to detect dopamine, making it more amenable for industrial scale-up, while also overcoming selectivity issues with UA and AA.
Carbon nanotubes are attractive materials for use in electrochemical electrodes applicable for DA [24]. Cobalt (II)-containing complexes are known to be effective electrocatalyst materials for the detection of DA [25]. In this study, we explore the utilization of the cobalt (II) oxide (CoO) particles tethered to COOH-functionalized multiwalled carbon nanotubes (COOH-MWNTs) to produce a composite to modify glassy carbon electrodes (GCE) for assaying DA using cyclic voltammetry (CV).
2. Materials and Methods
2.1. Materials
All reagents were of analytical grade (99% or greater purity). COOH-MWNTs were purchased from NanoLab, Inc. (Walton, MA, USA). Cobalt (II) oxide (CoO) particles were purchased from Nanostructured and Amorphous Materials (Los Alamos, NM, USA). Dopamine, L-ascorbic acid, phosphate buffer solution (PBS) at pH 7.00 and uric acid were purchased from Sigma-Aldrich (St. Louis, MO, USA). NafionTM was purchased from Ion Power, Inc (New Castle, DE, USA). HCl and NaOH were purchased from Fisher Scientific (Pittsburgh, PA, USA). Absolute anhydrous ethyl alcohol (AAEA) was purchased from Pharmco-AAPER (Brookfield, CT, USA). MicropolishTM Al2O3 slurries 0.05 and 1.0 µM in diameter were purchased from Buehler, Ltd. (Lake Bluff, IL, USA). Solutions were buffered using phosphate buffer solution (PBS) pH at 7.0 (Sigma-Aldrich, St. Louis, MO, USA) and acetic acid/acetate buffer solution pH at 4.66 (EMD Millipore Corporation, Billerica, MA, USA).
2.2. Nanocomposite Synthesis
COOH-MWNTs (2 mg) and CoO (2 mg) were combined in a 1:1 mixture. The mixture was then sonicated in 1 mL of AAEA to get the colloidal suspension. Ultrasonication was performed on Sharpertek Stamina XPTM sonicator (Pontiac, MI, USA). WaveNanoTM USB potentiostat was purchased from the Pine Instrument Co. (Raleigh, NC, USA). The resulting suspension contained the CoO/COOH-MWNT composite, which was applied to the GCE surface. A drop casting method was used to modify the GCE surface using CoO/COOH-MWNT composite suspension. This approach has been effective for attaching metal oxide nanoparticles to the COOH-MWNT sidewalls using the cavitation process offered by sonication to tether them to the COOH functional groups [26,27,28]. The GCE surface was polished using 1.0 and 0.05 µm diameter alumina slurries, successively, with 10 min of sonication in between to obtain a mirror-like finish. The electrode was then sonicated using concentrated nitric acid:deionized water 1:1 for 5 min to activate the surface and dried at room temperature. CoO/COOH-MWNT suspensions were vortexed for a few minutes to obtain uniform dispersions. Aliquots of 10-μL suspensions were applied to the electrode. A first suspension was drop-casted onto the GCE and dried in an oven for 10 min at 80 °C. Finally, a 10-μL aliquot of Nafion (2% wt) in AAEA solution was then applied to the GCE surface to bind the CoO/COOH-MWNTs to the GCE surface. The above modified electrode was then dried in an oven at 80 °C for another 10 min to form the Nafion/CoO/COOH-MWNT/GCE sensing composite.
2.3. Characterization of CoO/COOH-MWNTs
X-ray photoelectron spectroscopy (XPS) was performed using a Perkin Elmer PHI 560 system (Eden Prairie, MN, USA) using a Mg Kα anode (hν = 1253.6 eV) operated at 250 W and 13 kV. Transmission electron microscopy (TEM) was performed using a Hitachi H-7650 (Krefeld, Germany) instrument operated at 100 kV, drop casting colloidal samples onto 200-mesh Cu grids (Ted Pella, Inc.: Redding, CA, USA). A WaveNanoTM potentiostat (Pine Instrument Co.: Raleigh, NC, USA) was used for CV measurements. The electrochemical measurements were performed in a 3-electrode cell using a Pt wire counter electrode, Ag/AgCl (3.5 M KCl) reference electrode and the Nafion/CoO/COOH-MWNT/GCE as the working electrode. CV experiments were performed in deoxygenated solution via sparging with 99.9% purity N2 gas (Air Gas Products; Radnor, PA, USA) for 15 min prior to each experiment. Raman spectroscopy was performed using an Enwave Optronics ProRaman-L spectrometer (Irvine, CA, USA) using a 500-mW class 3B laser (λ = 785 nm). Samples from Raman analysis were prepared by pipetting composite colloidal suspensions onto Si(100) wafers and allowing the AAEA to evaporate in a clean air environment. The isoelectric point (Ip) of the composite was measured using a spear-tip electrode applying the method originally described by Park and Regalbuto [29], which was later modified for measuring the Ip of carbon nanomaterials [30]. CV current measurements as a function of sonication time, DA concentration, and pH were obtained in triplicate from multiple batches of the CoO/COOH-MWNT composite produced.
3. Results and Discussion
Scheme 1 shows the electrochemical mechanism of DA on the working electrode surface corresponding to the two observed peaks in the CV data (vide infra). XPS binding energy core level shifts of the synthesized CoO/COOH-MWNTs verified that the tethered particles were CoO, and not from Co3O4 (Figure S1 in the Supplemental Materials).
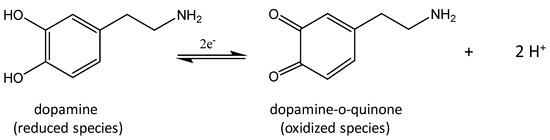
Scheme 1.
Reduction products of dopamine.
A pH dependence on signal sensitivity was observed with maximum current occurring at pH 5.0 for 100 mM DA (Figure S2); pH values below and above 5.0 had a diminished current. We attribute the variations in signal to Coulombic effects from protonation/deprotonation of the CoO/COOH-MWNT surface contributing to electrostatic attraction of DA to the electrode surface. In addition to increased sensitivity to DA, surface charge can also explain the electrode’s selectivity. AA, UA and DA have known Ip values (based on their pKas) of 4.2, 5.4 and 8.93, respectively. Under pH 5.0 solution conditions, AA and UA are near electrostatically neutral conditions as compared to DA, which, on the other hand, would be significantly more protonated according to Gouy–Chapman theory, and hence adopt a positive charge. The measured Ip of the CoO/COOH-MWNT composite itself was found to be 7.86 (Figure S3 in the Supplemental Materials). The lower Ip value of the CoO/COOH-MWNTs as compared to that of DA (8.93) denotes a greater electron rich density for the composite at pH 5.0. The combination of the positively charged DA and the electron-rich character of the electrocatalyst serves as the driving force for the electrode’s pronounced Coulombic attraction to DA as compared to AA and UA, providing a basis for the sensor’s selectivity.
The CV of 100 μM DA shows a sharp anodic peak at oxidation potential +0.300V (Figure 1A). The asymmetric shape of CV indicates a quasi-reversible redox process. We observe an electrocatalytic activity dependence with sonication time (Figure 1B). Sonication was used to attach the particles to the underlying COOH-MWNT surface, as demonstrated previously in our laboratory [26,27,28]. Sonication periods that are too brief are known to result in a sparse density of attached particles while excessively prolonged times damages the stable carboxylate –COO– structures needed to create a fine dispersion of them, often resulting in agglomeration and reduced electroactive surface area [31]. Hence, the sonication time needed to produce the optimized dispersion of the composite needs to be experimentally determined prior to its use as a sensor.
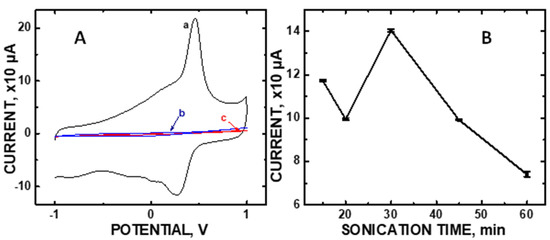
Figure 1.
(A) Cyclic voltammetries (CVs) of 100 μM concentrations of (a) dopamine (DA), (b) ascorbic acid (AA), and (c) uric acid (UA) using the Nafion/CoO/.COOH-MWNT/GCE at pH 5.0 at a scan rate of 50 mV/s; (B) CV current at oxidation potential +0.300V vs sonication time (error bars of the data points are smaller than the symbols).
Figure 1B shows the ideal sonication period to be 30 min at the +0.300 V anodic voltage for 100 μM DA in order to achieve maximum current output. Furthermore, no signal at +0.300 V was observed for either 100 μM AA or 100 μM UA, common interferents in urinalysis. Additional control experiments involving composite sub-components and various composite loadings on the GCE are shown in Figure S4 in the Supplementary Materials.
We have recently discovered that sonication can disentangle the COOH-MWNT support such that more of the particulate surface area can be exposed and thereby increase electrocatalytic activity of ZnO/COOH-MWNTs [28]. However, this same effect was not observed for CoO/COOH-MWNTs for the detection of DA; the degree of disentanglement of the underlying carbon nanotube surface had no effect on the sensitivity of the composite. Dissimilar to the findings pertaining to UA detection with ZnO/COOH-MWNTs as the working electrode material, measuring the integrated peak area intensity of the G band alone was insufficient to identify the optimum sonication time for DA detection. Rather, the dominant factor affecting sensitivity was the CoO particle surface density on the COOH-MWNT underlying substrate, which can be indirectly measured by noting the sp3-to-sp2 hybridized carbon ratio of the electrocatalyst surface. A correlation between the relative sp3-hybridized carbon with increased DA signal at the maximum Raman D/G band ratio (relative integrated peak area at 2.59) in occurring at 30 min of sonication was observed (Figure 2A). The peaks at 1325 and 1625 cm−1 correspond to the D and G bands, respectively. The D bands at 1325 cm−1 denote the disordered sp3-hybridized carbon and the G bands at 1625 cm−1 are related to ordered sp2-hybridized carbon [32].
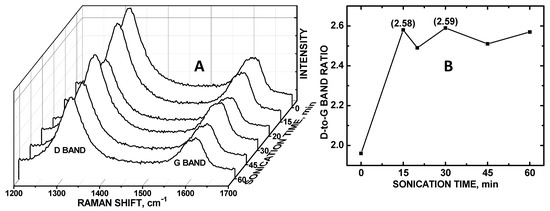
Figure 2.
(A) Raman spectra of CoO/COOH-MWNT at 0 to 60 min of sonication; (B) Plot of Raman D/G band integrated peak area ratio vs sonication time.
Unlike the electrocatalytic activity of the ZnO/COOH-MWNTs, the relative degree of exposed sp2-hybridized carbon as exhibited by the Raman G bands (Figure 2A) did not correlate with the magnitudes if the CV intensities observed. Rather, it was the relative degree of disordered sp3-hybridized carbon on the MWNTs that correlated with the CV peak maximum current, coinciding with the largest D-to-G band ratio (Figure 2B). It should be noted that the CoO particles used in this composite had a markedly larger diameter (~80 nm) (Figure 3) as compared to the previously tethered metal oxide nanoparticles (~15 nm diameter). Both CoO/COOH-MWNT (in this experiment) and ZnO/COOH-MWNT (in our previous experiment [29]) composites were tethered to carbon nanotube supports with the same length and diameter. We postulate that disentanglement plays a larger role in affecting the electroactive surface area for the particles (tethered to the MWNT surface) that are smaller in diameter, suggesting that the aspect ratio between the tethered particulate diameter vs. the carbon nanotube length and diameter is an important variable governing the exposed electroactive surface area. Beyond a certain particle-to-COOH-MWNT size ratio threshold (i.e., if the diameter is too large), disentanglement has little, if any, effect. In the case of the CoO/COOH-MWNT composite, the degree of sp3-hybridized carbon from the MWNT sidewalls plays a dominant role, linking to the density of tethered particles tethered to the sidewalls corresponding to the relative electroactive surface area; this phenomenon has also been observed for other particles attached to COOH-MWNTs, also verified by Raman spectroscopy [29].
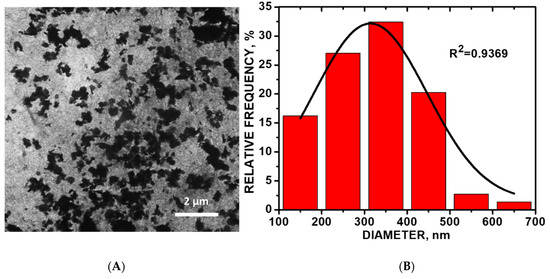
Figure 3.
(A) Transmission electron microscopy (TEM) image of CoO/COOH-MWNT composite in absolute anhydrous ethyl alcohol solution 30-min sonication; (B) size distribution histogram of the CoO particles.
Figure 3A shows a representative TEM image of CoO/COOH-MWNTs at 30-min sonication time. The composite becomes disentangled with an increase in sonication time. The highest amount of disordered sp3-hybridized carbon occurred at 30 min of sonication of the composite as observed from Raman analysis. As sonication proceeded beyond the 30-min point, the composite becomes more entangled with the increase in sonication time. The TEM histogram (Figure 3B) shows an average CoO particle size of 315 ± 12 nm (n = 74). Close-up TEM images revealing the underlying carbon nanotube support are shown in Figures S6 and S7 in the Supplemental Materials.
XPS analysis (Figure S1) showed that the atomic percent composition of the CoO/COOH-MWNT composite was 97.03% carbon, 2.83% oxygen and 0.14% cobalt from the normalized integrated peak areas of the C 1s, O 1s and Co 2p core levels, respectively. Core level binding energy (BE) shifts confirm that the attached particles were those of CoO, not Co3O4 (see Figure S1 and narrative in the Supplementary Materials).
The asymmetric line shape of the CV shows greater signal for reduction than for oxidation (Figure 1A). The measured voltage for oxidation remained constant, while that for reduction shifted to higher voltages with increase in DA concentration. For this reason, the CV oxidation current at +0.300 V was selected over that for reduction (at ~0.4V) to quantify DA concentration in aqueous solution.
Figure 4 shows the CV current vs DA concentration plot. Asymmetry in the CV indicating irreversibility suggests the possible decomposition of DA on the electrode surface. Surface adsorption of the residue could impede DA oxidation and result in deviation from linear current vs concentration measurements. However, the saturation of surface sites was minimal since Randles–Sevcik analysis also showed a diffusion controlled process for the amperometric detection of DA (Figure S5). A quadratic relationship in the 10 to 100 µM DA concentration range is observed, following the regression equation: I (μA) = −(7.00 × 10⁻³) [DA]2 + 2.135 [DA]−7.813 with a correlation coefficient R2 = 0.9883.
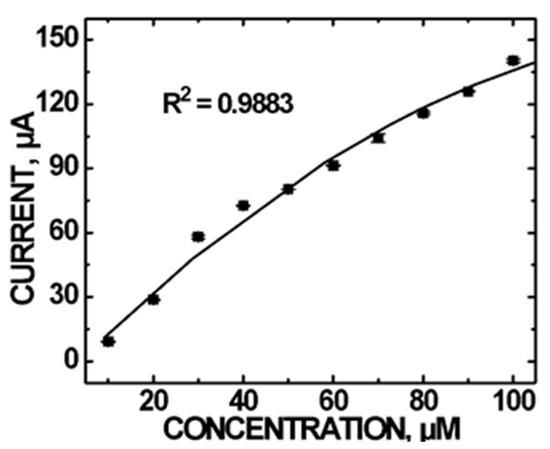
Figure 4.
CV current vs DA concentrations using the CoO/COOH-MWNT/GCE sensor at +0.300 V in the concentration range of (10–100) µM at pH 5.0. Error bars are smaller than the symbols.
In summary, the CoO/COOH-MWNT/GCE sensor, fabricated in a facile fashion using entirely non-perishable components, showed fast electrochemical responses with good sensitivity and selectivity. DA was detected selectively in the presence of AA and UA at pH 5.0, relevant for urinalysis to screen for neuroblastoma.
Supplementary Materials
The following are available online at https://www.mdpi.com/2227-9040/8/2/22/s1, Figure S1: XPS of C 1s, O 1s and Co 2p core levels from CoO/COOH-MWNTs, Figure S2: (A) CV of 100 µM dopamine using Nafion/CoO/COOH-MWNT/GCE at various pH; (B) Peak current versus pH of 100 µM dopamine, Figure S3: Point-of-Zero-Charge (PZC) measurement of CoO/COOH-MWNT composite, Figure S4: (A) CVs of 100 µM DA using (a) CoO/COOH-MWNT /GCE, (b) Pure COOH-MWNT/GCE, (c) Pure CoO/GCE, and (d) GCE; (B) CVs of DA at (a) 0.13 µg/mm2, (b) 0.25 µg/mm2, (c) 0.38 µg/mm2, (d) 0.51 µg/mm2, (e) 0.64 µg/mm2, (f) 0.76 µg/mm2, and (g) 0.89 µg/mm2 loadings of the CoO/COOH-MWNT/GCE composite in PBS at pH 7.0 under N2 atmosphere, Figure S5: (A) Current versus scan rate for a 100 µM dopamine concentration; (B) Current versus square root of the scan rate plot; Spreadsheet calculation of the limit of detection (LOD) for DA. Figure S6: Close-up TEM image of CoO/COOH-MWNTs showing the underlying MWNTs in area without CoO particles. Figure S7: Close-up TEM image of CoO/COOH-MWNTs showing the underlying MWNTs in area with CoO particles.
Author Contributions
Conceptualization, C.C.C.; methodology, M.S.K.; software, M.S.K. and C.C.C.; validation, M.S.K. and C.C.C.; formal analysis, M.S.K.; investigation, M.S.K.; resources, C.C.C.; data curation, M.S.K.; writing—original draft preparation, M.S.K.; writing—review and editing, C.C.C.; visualization, C.C.C.; supervision, C.C.C.; project administration, C.C.C.; funding acquisition, C.C.C. All authors have read and agreed to the published version of the manuscript.
Funding
This material is based upon work supported by the National Science Foundation under Grant No. 1920293.
Acknowledgments
We gratefully acknowledge support of this work from the Office of Research Services and the Molecular Biosciences (MOBI) PhD program at Middle Tennessee State University. We thank Joyce Miller for her assistance in obtaining the TEM data.
Conflicts of Interest
The authors declare no conflict of interest.
References
- Van Dersarl, J.J.; Mercanzini, A.; Renaud, P. Integration of 2d and 3d thin film glassy carbon electrode arrays for electrochemical dopamine sensing in flexible neuroelectronic implants. Adv. Funct. Mater. 2015, 25, 78–84. [Google Scholar] [CrossRef]
- Zhang, M.; Liao, C.; Yao, Y.; Liu, Z.; Gong, F.; Yan, F. High performance dopamine sensors based on whole graphene solution- gated transistors. Adv. Funct. Mater. 2014, 24, 978–985. [Google Scholar] [CrossRef]
- Li, B.-R.; Hsieh, Y.-J.; Chen, Y.-X.; Chung, Y.-T.; Pan, C.-Y.; Chen, Y.-T. An ultrasensitive nanowire-transistor biosensor for detecting dopamine release from living PC12 cells under hypoxic stimulation. J. Am. Chem. Soc. 2013, 135, 16034–16037. [Google Scholar] [CrossRef] [PubMed]
- Yue, H.Y.; Huang, S.; Chang, J.; Heo, C.; Yao, F.; Adhikari, S.; Gunes, F.; Liu, L.C.; Lee, T.H.; Oh, E.S.; et al. ZnO nanowire arrays on 3d hierarchical graphene foam: Biomarker detection of Parkinson’s disease. ACS Nano 2014, 8, 1639–1646. [Google Scholar] [CrossRef] [PubMed]
- Weng, J.; Xue, J.M.; Wang, J.; Ye, J.S.; Cui, H.F.; Sheu, F.S.; Zhang, Q.Q. Gold-cluster sensors formed electrochemically at boron-doped-diamond electrodes: Detection of dopamine in the presence of ascorbic acid and thiols. Adv. Funct. Mater. 2005, 15, 639–647. [Google Scholar] [CrossRef]
- Jiang, L.; Nelson, G.W.; Abda, J.; Foord, J.S. Novel modifications to carbon-based electrodes to improve the electrochemical detection of dopamine. ACS Appl. Mater. Interfaces 2016, 8, 28338–28348. [Google Scholar] [CrossRef] [PubMed]
- Dong, H.; Wang, S.; Liu, A.; Galligan, J.J.; Swain, G.M. Drug effects on the electrochemical detection of norepinephrine with carbon fiber and diamond microelectrodes. J. Electroanal. Chem. 2009, 632, 20–29. [Google Scholar] [CrossRef]
- Park, J.; Quaiserová-Mocko, V.; Pecková, K.; Galligan, J.J.; Fink, G.D.; Swain, G.M. Fabrication, characterization, and application of a diamond microelectrode for electrochemical measurement of norepinephrine release from the sympathetic nervous system. Diam. Relat. Mater. 2006, 15, 761–772. [Google Scholar] [CrossRef]
- Huang, J.; Liu, Y.; Hou, H.; You, T. Simultaneous electrochemical determination of dopamine, uric acid and ascorbic acid using palladium nanoparticle-loaded carbon nanofibers modified electrode. Biosens. Bioelectron. 2008, 24, 632–637. [Google Scholar] [CrossRef]
- Alwarappan, S.; Liu, G.; Li, C.-Z. Simultaneous detection of dopamine, ascorbic acid, and uric acid at electrochemically pretreated carbon nanotube biosensors. Nanomedicine 2010, 6, 52–57. [Google Scholar] [CrossRef]
- Wang, M.; Gao, Y.; Zhang, J.; Zhao, J. Highly dispersed carbon nanotube in new ionic liquid-graphene oxides aqueous dispersions for ultrasensitive dopamine detection. Electrochim. Acta 2015, 155, 236–243. [Google Scholar] [CrossRef]
- Malem, F.; Mandler, D. Self-assembled monolayers in electroanalytical chemistry: Application of omega-mercapto carboxylic acid monolayers for the electrochemical detection of dopamine in the presence of a high concentration of ascorbic acid. Anal. Chem. 1993, 65, 37–41. [Google Scholar] [CrossRef]
- Dalmia, A.; Liu, C.C.; Savinell, R.F. Electrochemical behavior of gold electrodes modified with self-assembled monolayers with an acidic end group for selective detection of dopamine. J. Electroanal. Chem. 1997, 430, 205–214. [Google Scholar] [CrossRef]
- Plowman, B.J.; Mahajan, M.; O’Mullane, A.P.; Bhargava, S.K. Electrochemical detection of dopamine and cytochrome C at a nanostructured gold electrode. Electrochim. Acta 2010, 55, 8953–8959. [Google Scholar] [CrossRef]
- Tang, L.; Li, S.; Han, F.; Liu, L.; Xu, L.; Ma, W.; Kuang, H.; Li, A.; Wang, L.; Xu, C. SERS-active Au @ Ag nanorod dimers for ultrasensitive dopamine detection. Biosens. Bioelectron. 2015, 71, 7–12. [Google Scholar] [CrossRef]
- Wang, H.-B.; Zhang, H.-D.; Chen, Y.; Huang, K.-J.; Liu, Y.-M. A label-free and ultrasensitive fluorescent sensor for dopamine detection based on double-stranded DNA templated copper nanoparticles. Sens. Actuators B 2015, 220, 146–153. [Google Scholar] [CrossRef]
- Bell, D.S. Beware the low urine pH-the major cause of the increased prevalence of nephrolithiasis in patient with type 2 diabetes. Diabetes Obes. Metab. 2012, 14, 299–303. [Google Scholar] [CrossRef]
- Ali, S.R.; Parajuli, R.R.; Ma, Y.; Balogun, Y.; He, H. Interference of ascorbic acid in the sensitive detection of dopamine by a nonoxidative sensing approach. J. Phys. Chem. B 2007, 111, 12275–12281. [Google Scholar] [CrossRef]
- Venton, B.J.; Troyer, K.P.; Wightman, R.M. Response times of carbon fibre microelectrodes to dynamic changes in catecholamine concentration. Anal. Chem. 2002, 74, 539–546. [Google Scholar] [CrossRef]
- Troyer, K.P.; Heien, M.L.A.V.; Venton, B.J.; Wightman, R.M. Neurochemistry and electroanalytical probes. Curr. Opin. Chem. Biol. 2002, 6, 696–703. [Google Scholar] [CrossRef]
- Justice, J.B. Quantitative Microdialysis of neurotransmitters. J. Neurosci. Meth. 1993, 48, 263–276. [Google Scholar] [CrossRef]
- O’Neill, R.D. Microvoltammetric techniques and sensors for monitoring neurochemical dynamics in vivo. A review. Analyst 1994, 119, 767–779. [Google Scholar]
- Khamlichi, R.C.; Bouchta, D.; Anounar, E.H.; Atia, M.B.; Attar, A.; Choukairi, M.; Tazi, S.; Ihssane, A.; Faiza, C.; Khalid, R.J. A novel l-leucine modified sol-gel-carbon electrode for simultaneous detection of homovanillic acid, dopamine and uric acid in neuroblastoma diagnosis. Mater. Sci. Eng. C 2017, 71, 870–878. [Google Scholar] [CrossRef]
- Zhao, J.; Zhang, W.; Sherrell, P.; Razal, J.M.; Huang, X.; Andrew, I.; Minett, A.I.; Jun, C. Carbon nanotube Nanoweb-Bioelectrode for highly selective dopamine sensing. ACS Appl. Mater. Interfaces 2012, 4, 44–48. [Google Scholar] [CrossRef]
- Nagles, E.; Ibarra, L.; Llanos, J.P.; Hurtado, J.; Barcia-Belrán, O. Development of a novel electrochemical sensor based on cobalt (II) complex useful in the detection of dopamine in presence of ascorbic acid and uric acid. J. Electroanal. Chem. 2017, 788, 38–43. [Google Scholar] [CrossRef]
- Wayu, M.B.; Spidle, R.T.; Devkota, T.; Deb, A.K.; Delong, R.K.; Ghosh, K.C.; Wanekaya, A.K.; Chusuei, C.C. Morphology of hydrothermally synthesized ZnO nanoparticles tethered to carbon nanotubes affects electrocatalytic activity for H2O2 detection. Electrochem. Acta 2013, 97, 99–104. [Google Scholar] [CrossRef]
- Wayu, M.; King, J.E.; Johnson, J.A.; Chusuei, C.C. A zinc oxide carbon nanotube based sensor for in situ monitoring of hydrogen peroxide in swimming pools. Electroanal 2015, 27, 2552–2558. [Google Scholar] [CrossRef]
- Das, S.C.; Pandey, R.R.; Devkota, T.; Chusuei, C.C. Raman spectroscopy as an assay to disentangle zinc oxide carbon nanotube composites for optimized uric acid detection. Chemosensors 2018, 6, 65. [Google Scholar] [CrossRef]
- McPhail, M.R.; Sells, J.A.; He, Z.; Chusuei, C.C. Charging nanowalls: Adjusting the carbon nanotube isoelectric point via surface functionalization. J. Phys. Chem. C 2009, 113, 14102–14109. [Google Scholar] [CrossRef]
- Park, J.; Regalbuto, J.R. A simple, accurate determination of oxide PZC and the strong buffering effect of oxide surfaces at incipient wetness. J. Colloid Interface Sci. 1995, 175, 239–252. [Google Scholar] [CrossRef]
- Hull, R.V.; Li, L.; Xing, Y.; Chusuei, C.C. Pt nanoparticle binding on functionalized multiwalled carbon nanotubes. Chem. Mater. 2006, 18, 1780–1788. [Google Scholar] [CrossRef]
- Dresselhaus, M.S.; Torio, A.; Hofman, M.; Dreselhaus, G.; Saito, R. Perspectives on carbon nanotube and graphene raman spectroscopy. Nano Lett. 2010, 10, 751–758. [Google Scholar] [CrossRef]


© 2020 by the authors. Licensee MDPI, Basel, Switzerland. This article is an open access article distributed under the terms and conditions of the Creative Commons Attribution (CC BY) license (http://creativecommons.org/licenses/by/4.0/).