Formaldehyde and Total VOC (TVOC) Commercial Low-Cost Monitoring Devices: From an Evaluation in Controlled Conditions to a Use Case Application in a Real Building

Abstract
:1. Introduction
- Usage 1: Formaldehyde and TVOC sensors to follow IAQ trends (=IAQ indicator)
- Usage 2: Formaldehyde and TVOC sensors to monitor IAQ with accurate values of pollutants (comparable to standard methods)
2. Materials and Methods
2.1. Materials: Sensors and Sensing Technologies
- Formaldehyde detection: electrochemistry (EC) or optical (colorimetric) (C) technology
- ⚬
- EC detection is one of the oldest known technologies used for chemical detection. It is low-cost, low-power, and compact. The principle relies on an oxydo-reduction reaction that takes place at the surface of the sensing electrode (the element is composed of two electrodes and one electrolyte). This generates a current or a voltage difference that can be measured which is proportional to the gas concentration. Selective membranes are most often added to improve selectivity. The sensitivity is generally at the ppm level and not the ppb level. The three EC sensors integrated in the tested devices are from the same manufacturer.
- ⚬
- Colorimetric detection of formaldehyde is also well known and documented [20]. It is based on a chemical reaction between formaldehyde and a probe molecule immobilized on a substrate (solid state reaction) or in solution (liquid state reaction). The newly formed molecule is detected by an optical measurement, either in transmission by measuring the optical density variation or by emission (fluorescence) of the new molecule when submitted to UV. This method is highly selective compared to EC as the probe molecule selectively reacts with formaldehyde. It is generally more sensitive and more expensive. For the three devices tested, the probe molecules were impregnated in a solid support and the reaction happened in the solid state. The probe molecules were different for the three detectors.
- TVOC detection [21]: metal oxide semi-conductor (MOS) or photo ionization detection (PID) technology
- ⚬
- MOS: The sensing element is a semi-conductor (a common one is SnO2). In clean air, oxygen is adsorbed at the surface of tin dioxide grains, forming an insulating barrier. When the sensor is exposed to combustible gas or reducing gas, an oxidation reaction with the adsorbed oxygen occurs at the surface of tin dioxide. The potential barrier is reduced. The sensor resistance decreases. The affinity of the pollutant depends on the working temperature of the sensor. Usually, these sensors are combined with a heating system. Doping the semi-conductor is often used to improve selectivity. Seven out of the eight selected sensors tested integrate MOS from two different suppliers. The four connected objects integrate a MOS sensor from Supplier 1 and the three devices for professionals integrate a MOS sensor from Supplier 2. For the remaining sensor, no information on the sensitive element could be obtained.
- ⚬
- PID: Photo ionization detectors use high-energy photons, typically in the UV range, to excite the molecules, resulting in the ionization of the gas. The energy is quite low so only gases with low ionization energy, i.e., organic vapor, can be ionized. The resulting ions produce a current that is proportional to the gas concentration. Intrinsically, PIDs are not selective, as they ionize everything with ionization energy which is less or equal to the lamp output. There are usually more sensitive to humidity than MOS sensors and require recalibration more often. They are also more expensive. The two PID sensors tested came from different suppliers.
- Multi VOCs: No commercial portable device able to detect individual indoor VOCs was identified.
2.2. Methods
2.2.1. Sensor Evaluation Under Controlled Conditions
- Laboratory-Scale Evaluation Chamber
- ⚬
- ThermoElectron Forma Environmental Cabinet (Model 3920 or equivalent) capable of maintaining 23 °C ± 1 °C.
- ⚬
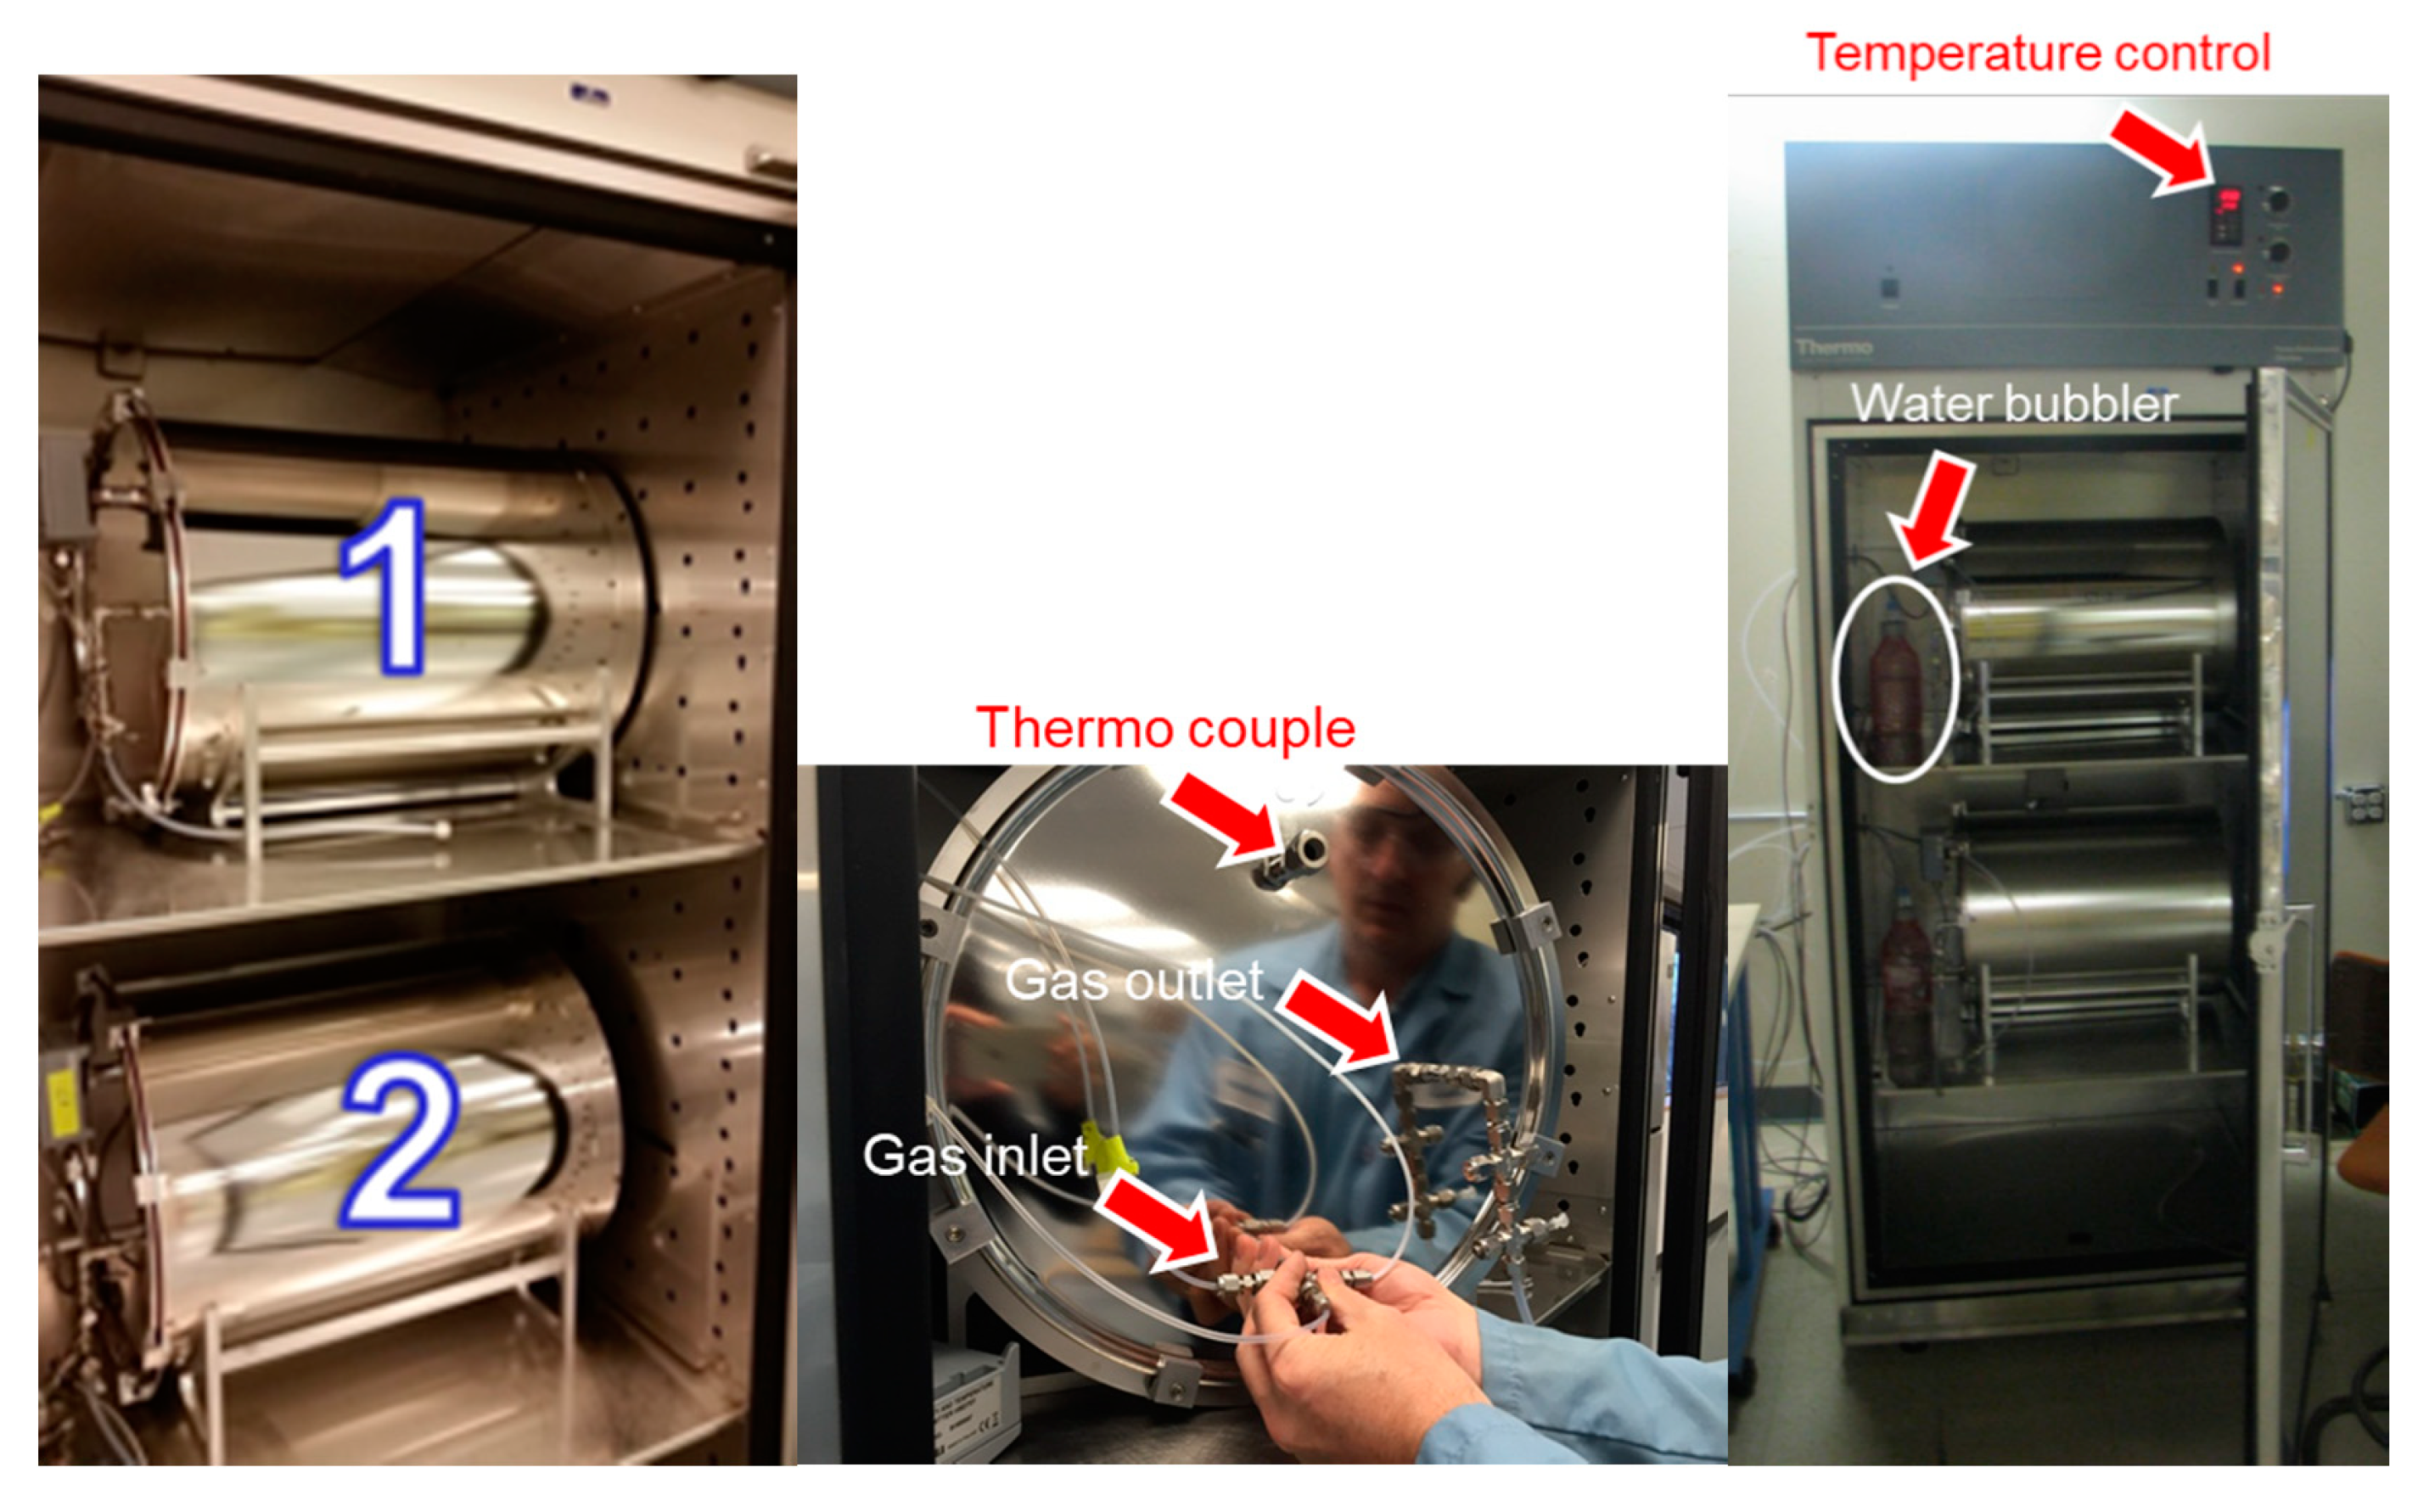
- Sixty-seven-liter stainless steel climatic chambers with a temperature and humidity sensor and plumbing to supply high-purity air and sampling outlets to allow for simultaneous formaldehyde sampling. As shown in Figure 2, there are three ports for the gas inlet; these were connected to dry air, wet air, and the formaldehyde cylinder. The gas inlet goes to the bottom of the chamber and there is no fan or splitter inside the chamber to agitate the gas flow. There are four sampling ports and one exhaust port for the gas outlet on the outside cover lid.
- ⚬
- Ultra-zero-grade air cylinders (<0.1 ppm total hydrocarbons, <1 ppm CO2, and <1 ppm CO) or air from a zero-air generator that was tested for background aldehydes and VOCs.
- ⚬
- Two formaldehyde cylinders (500 ppb in N2 and 1 ppm in N2) were purchased from Air Liquide America Specialty Gases, LLC.
- ⚬
- Mass flow controllers, a sampling pump, and proper electronic control (e.g., Build Time software) to maintain stainless steel chambers at 50% relative humidity (RH) with a total inlet flow of 1.12 L/min. RH deviation was <±3% for the 50% RH set up.
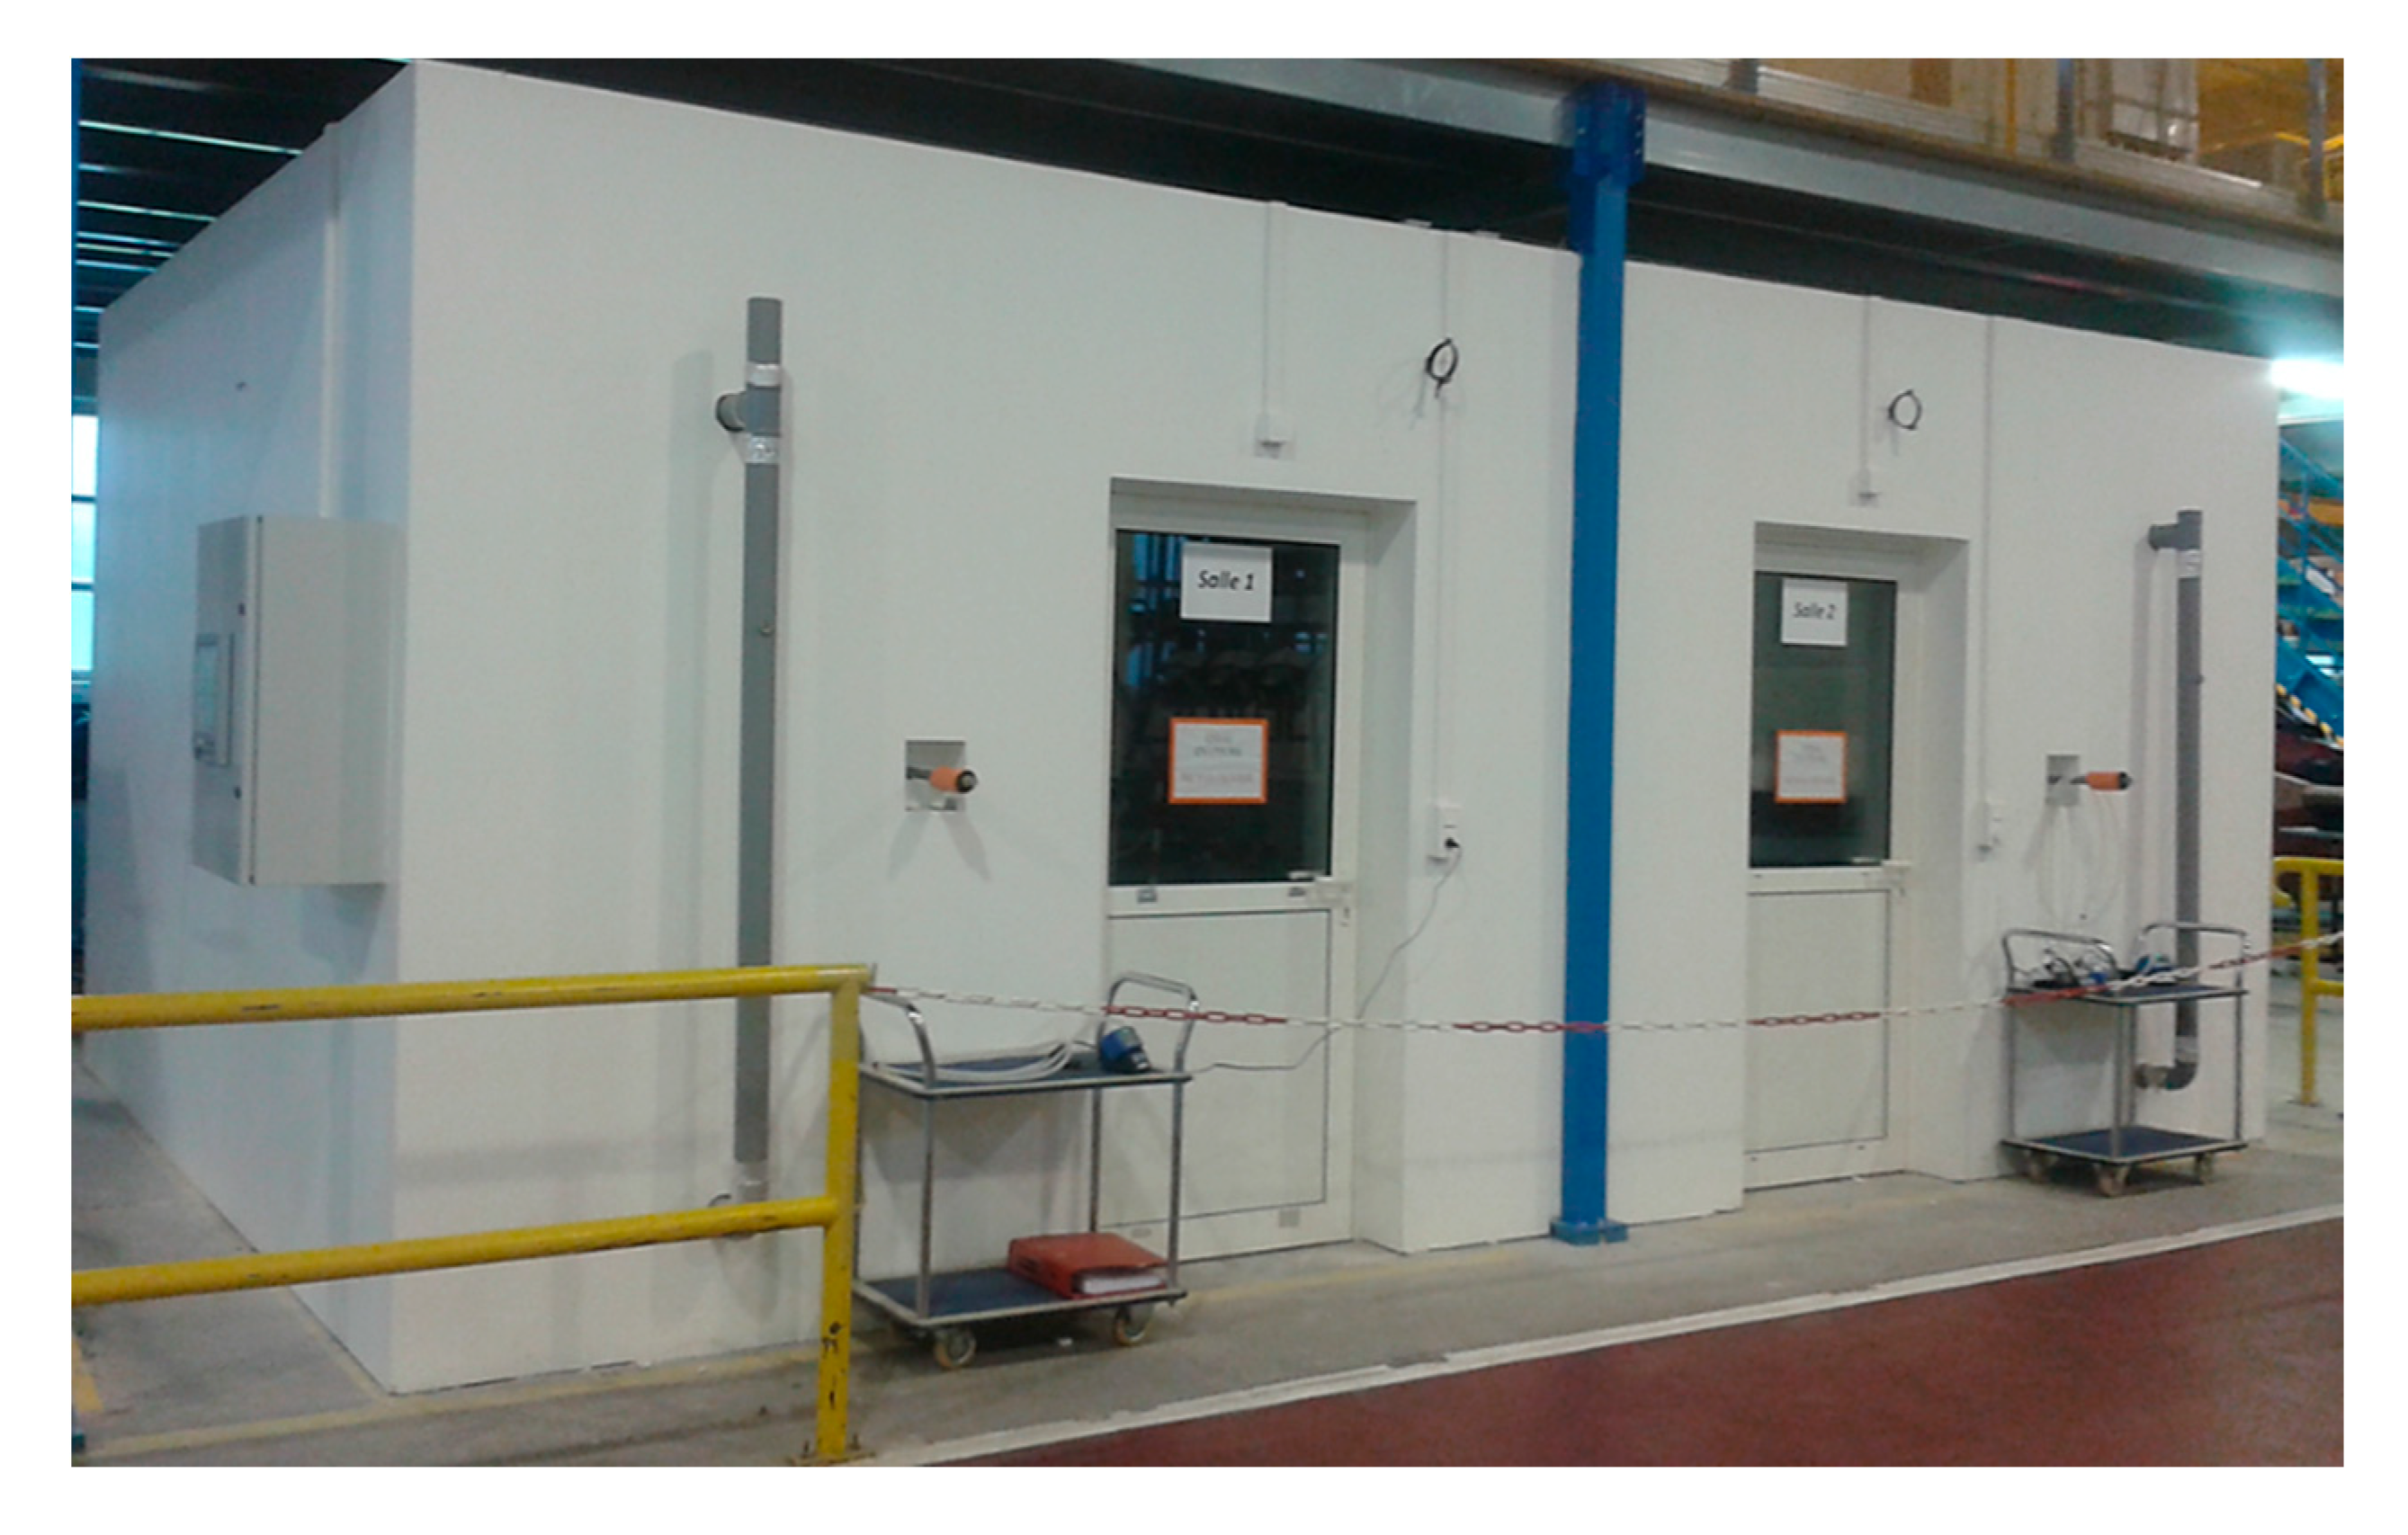
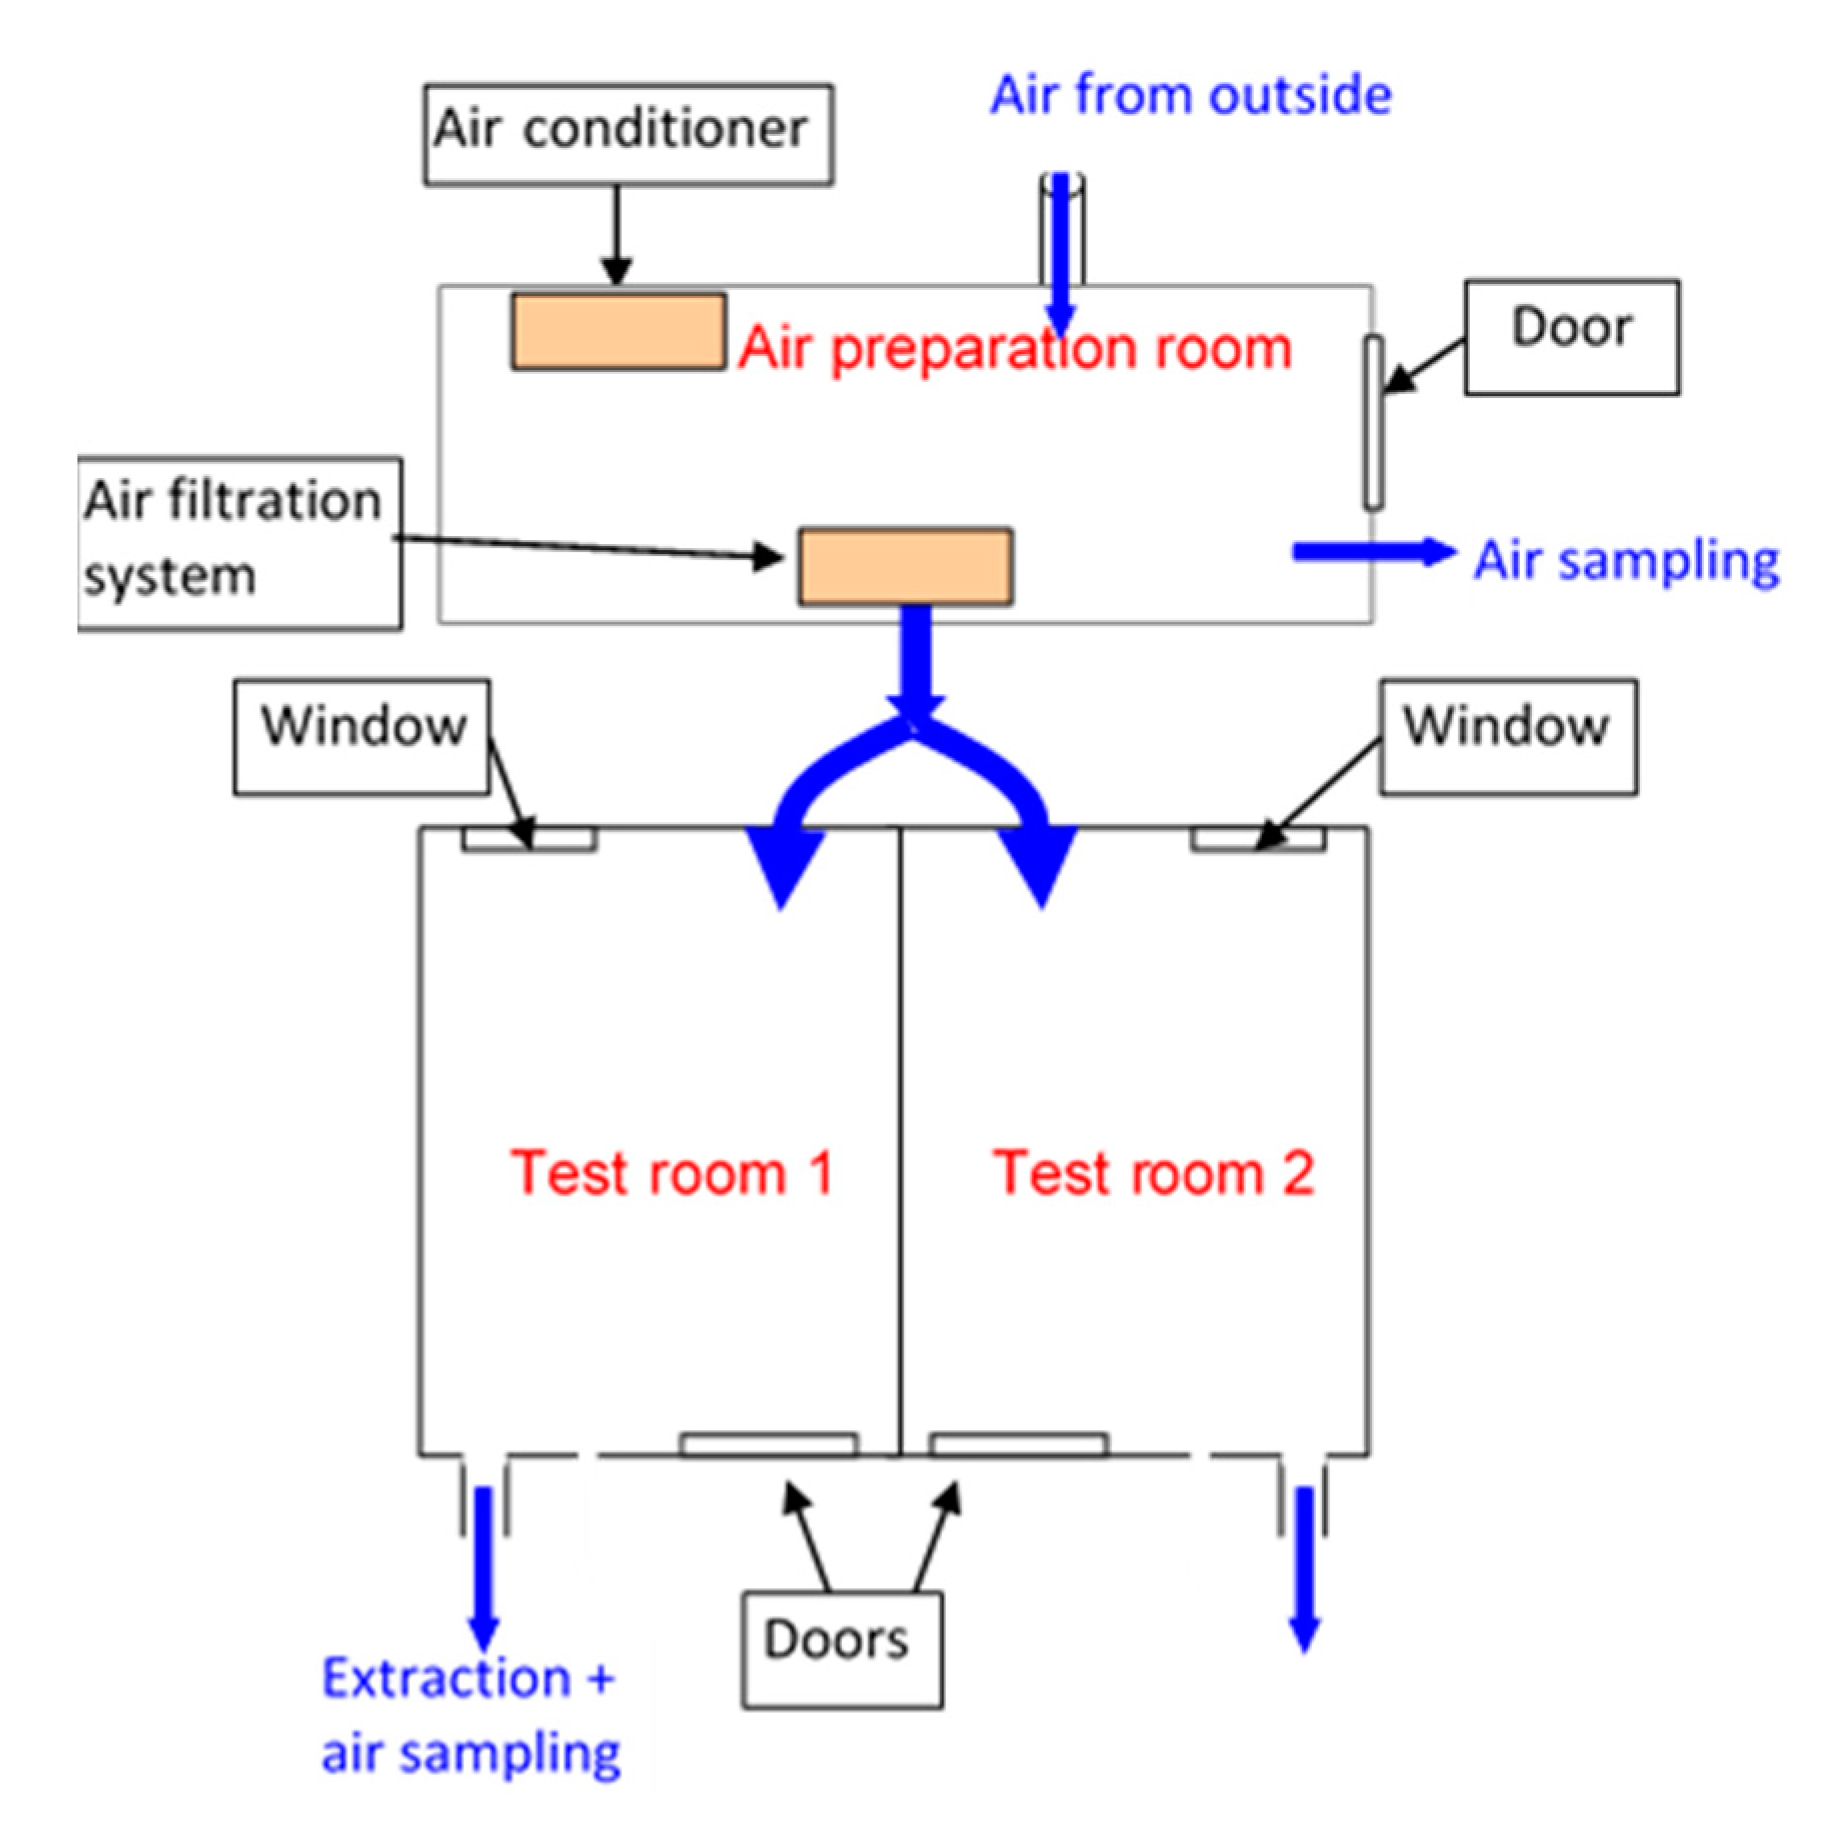
- Full-Scale Evaluation Chamber
- –
- The walls were 2.5 m high.
- –
- The floor and ceiling both measured 3 m × 4 m, resulting in surfaces of 12 m2 each.
- –
- There was one door of 0.8 m (width) × 2 m (height) (1.6 m2).
- –
- There was one window of 2 m2.
- –
- Sealants and other very small surfaces accounted for up to 0.2 m2.
2.2.2. Test Case in a Real Building
- Takshasila (ground floor): near the entrance, can be accessed by outsiders and employees, and two ACs are available
- Sydney opera (first floor): can only be accessed by employees and two ACs are available
- Lothal (ground floor): can be accessed by outsiders and employees, one AC is available, and construction work was occurring outside the room
- Empire state (first floor): can only be accessed by employees, one AC is available, and construction work was occurring outside the room
- Chandrasekhar (second floor): can only be accessed by employees, and is connected to the central HVAC
- Visvesvaraya (second floor): can only be accessed by employees and is connected to the central HVAC
3. Results
3.1. Evaluation of Formaldehyde Sensors
3.1.1. Evaluation at Lab Scale
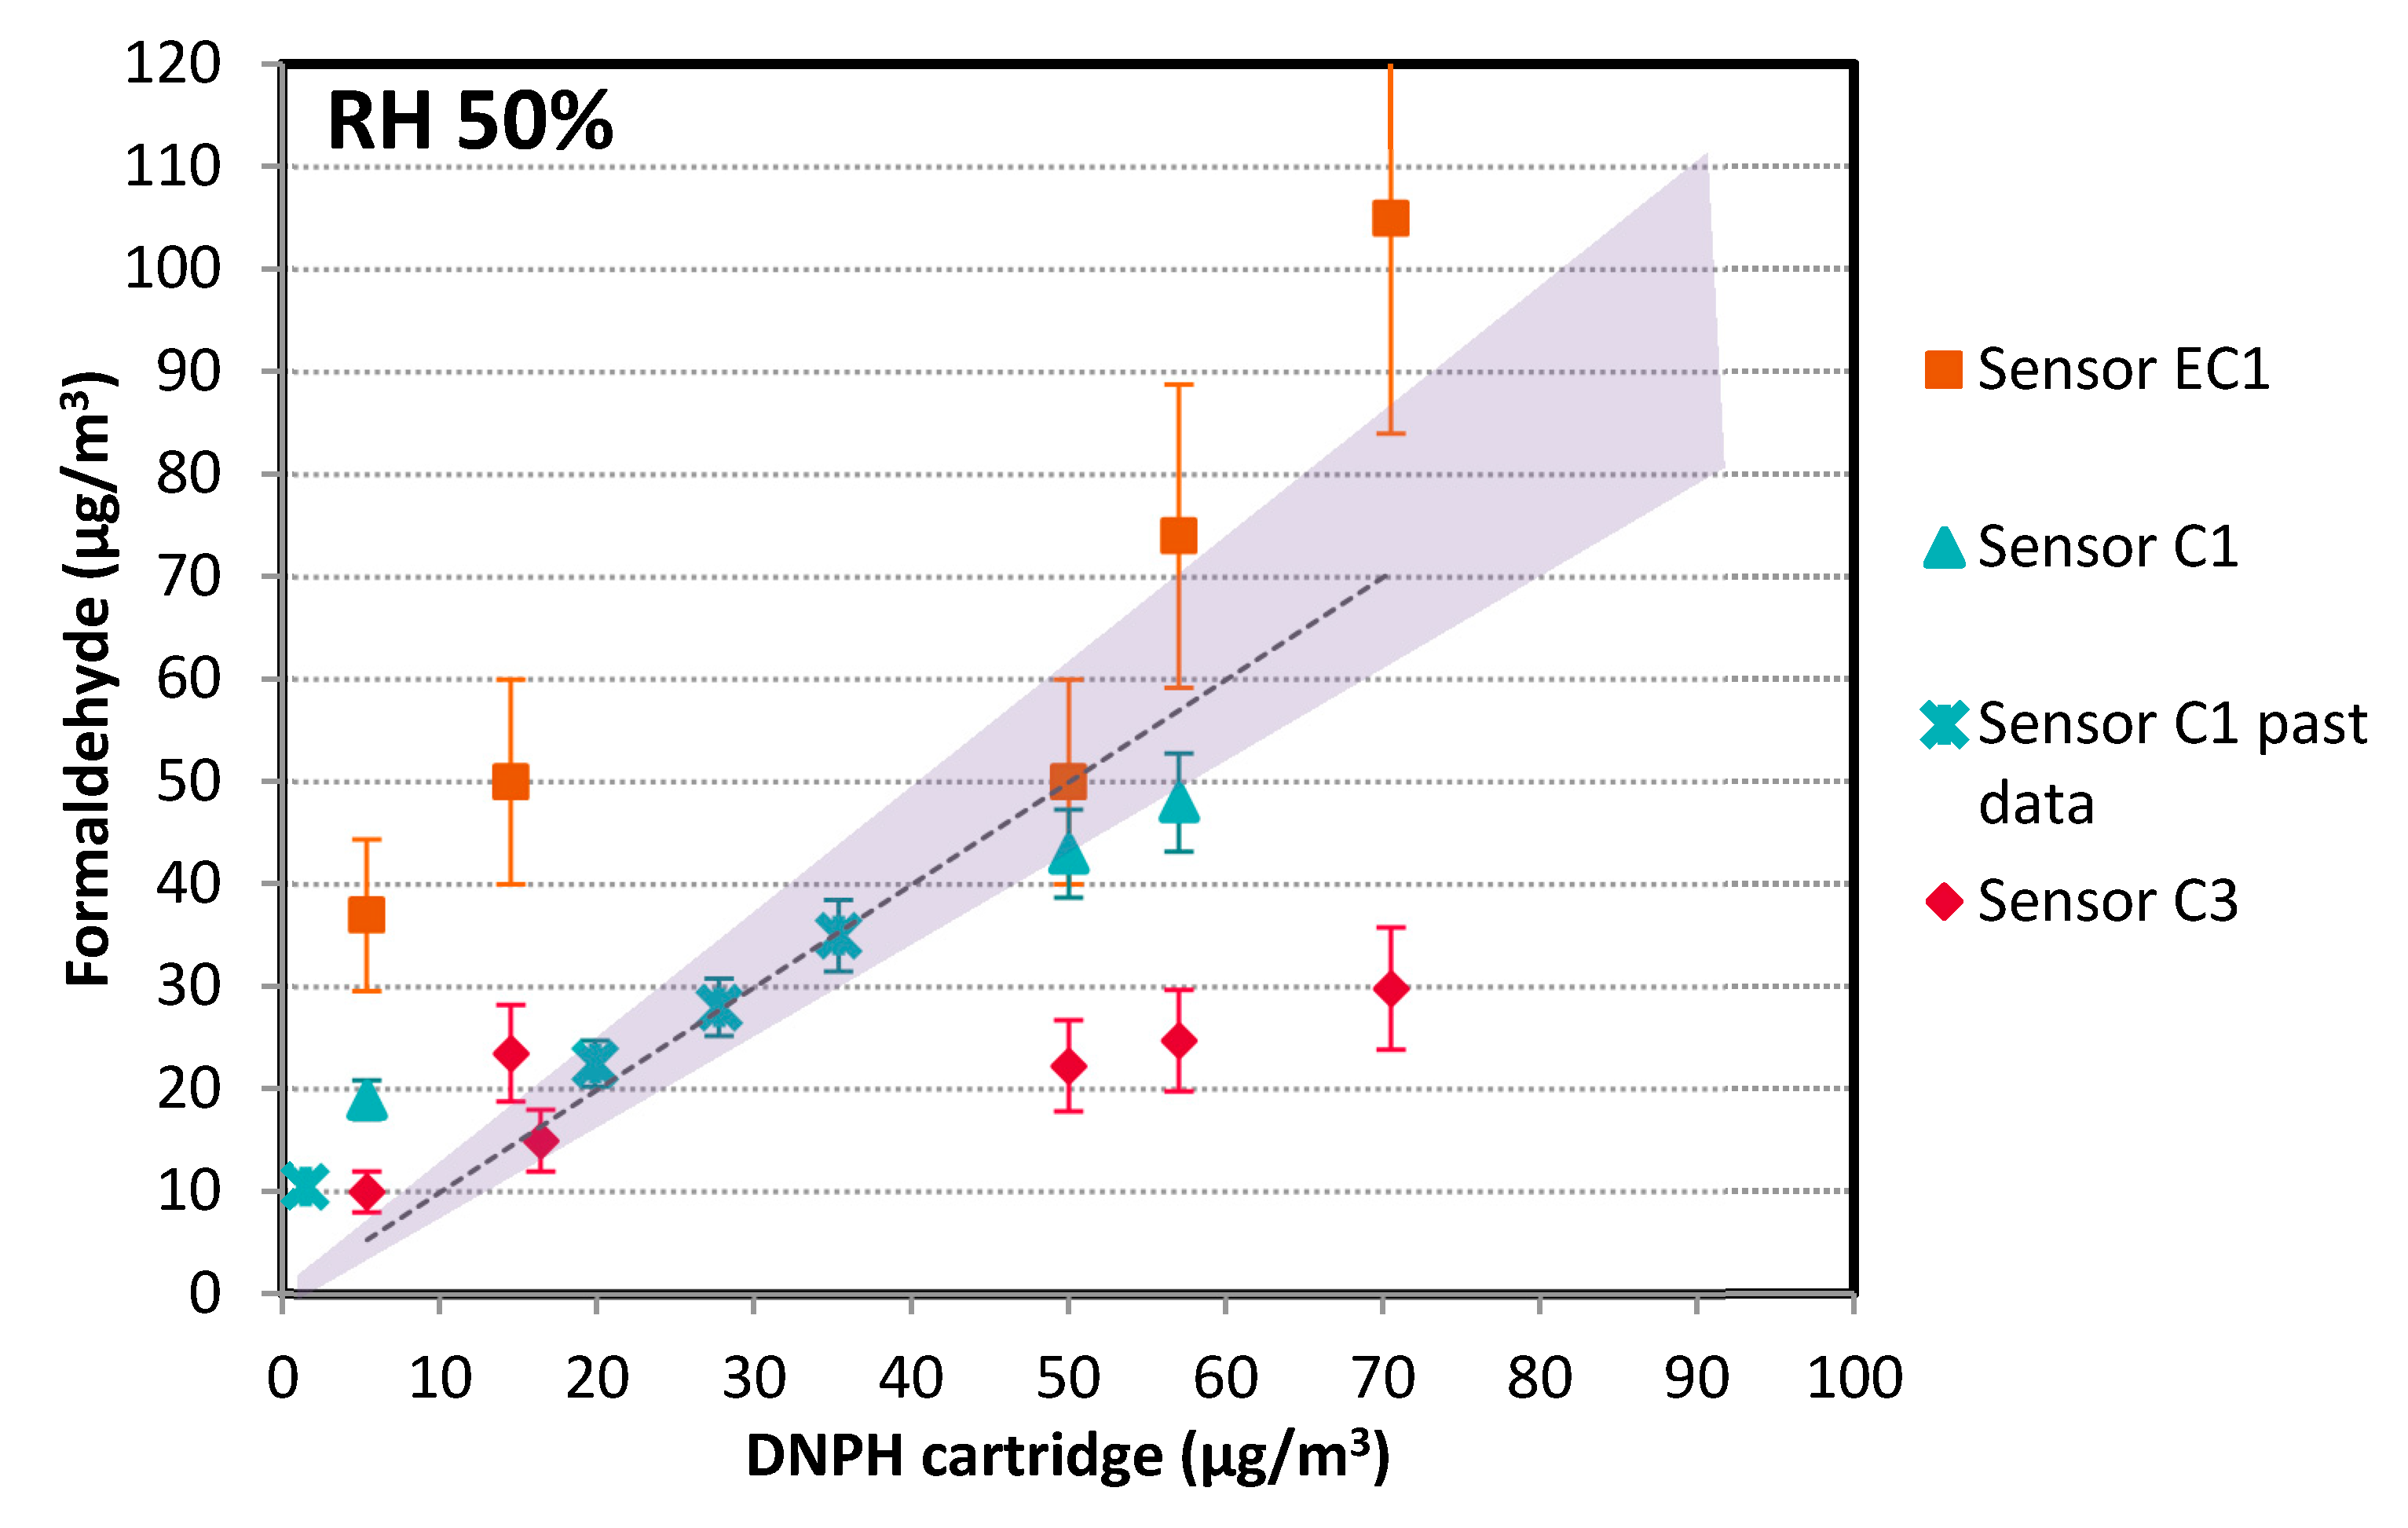
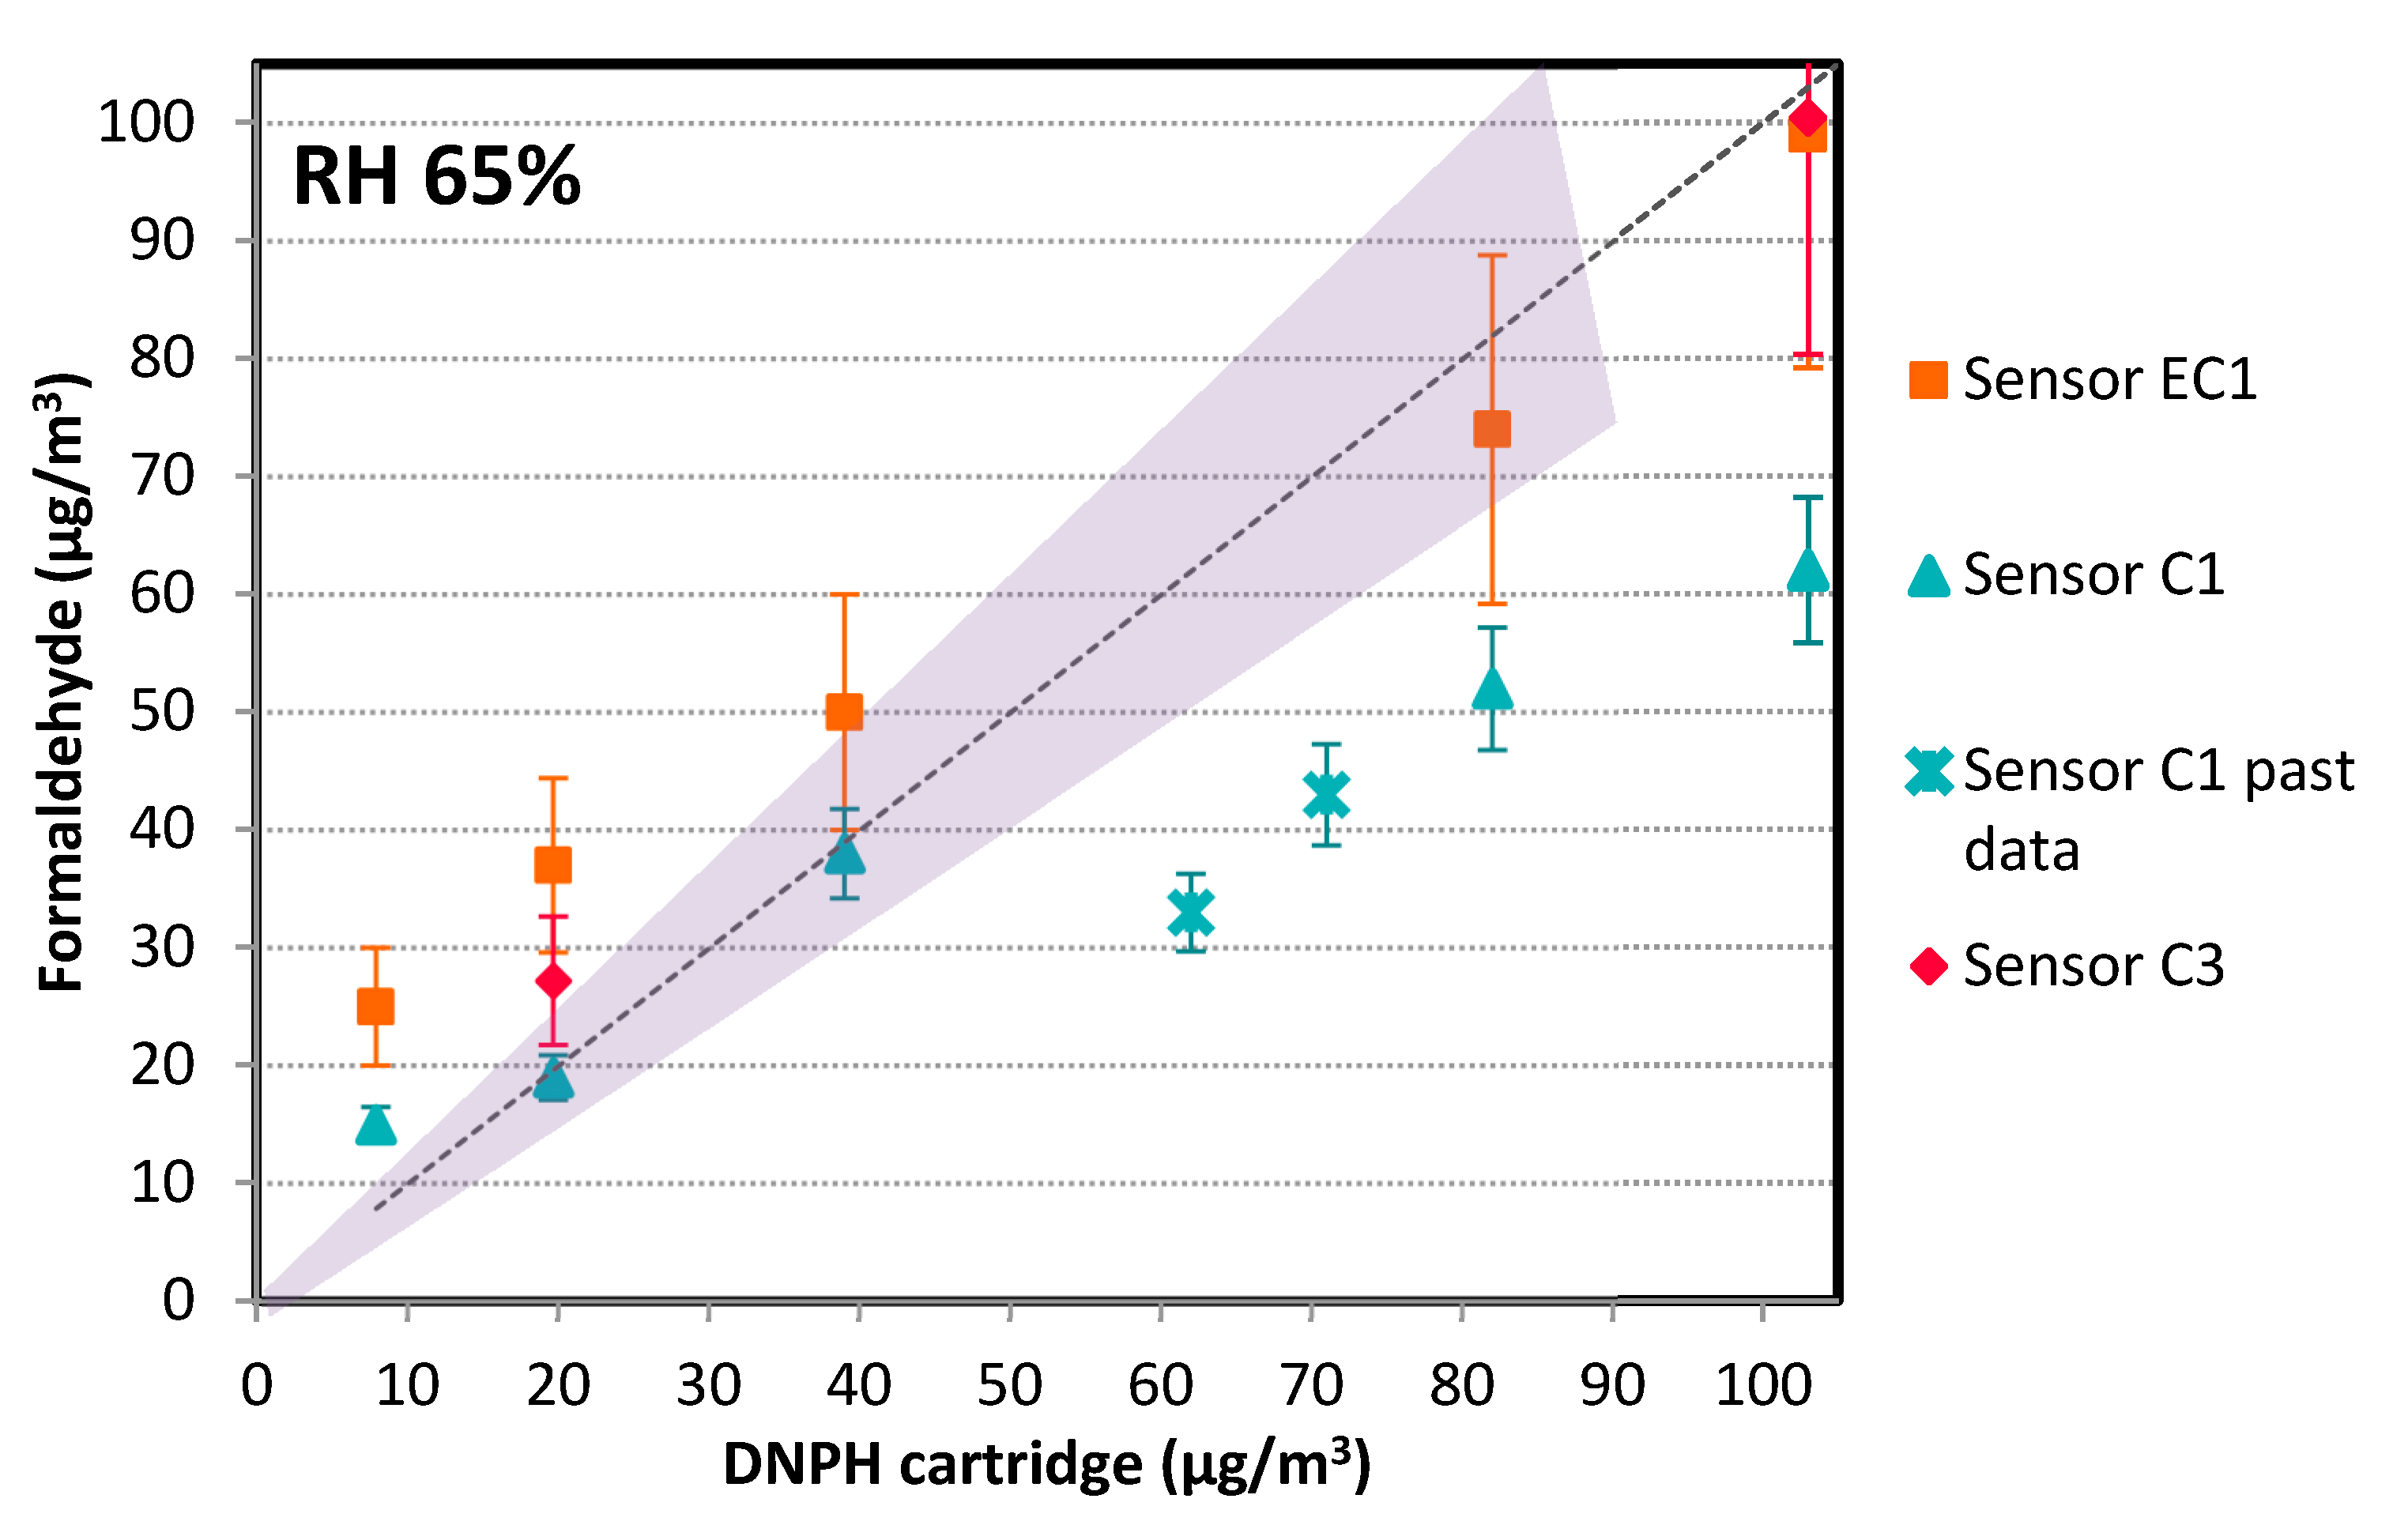
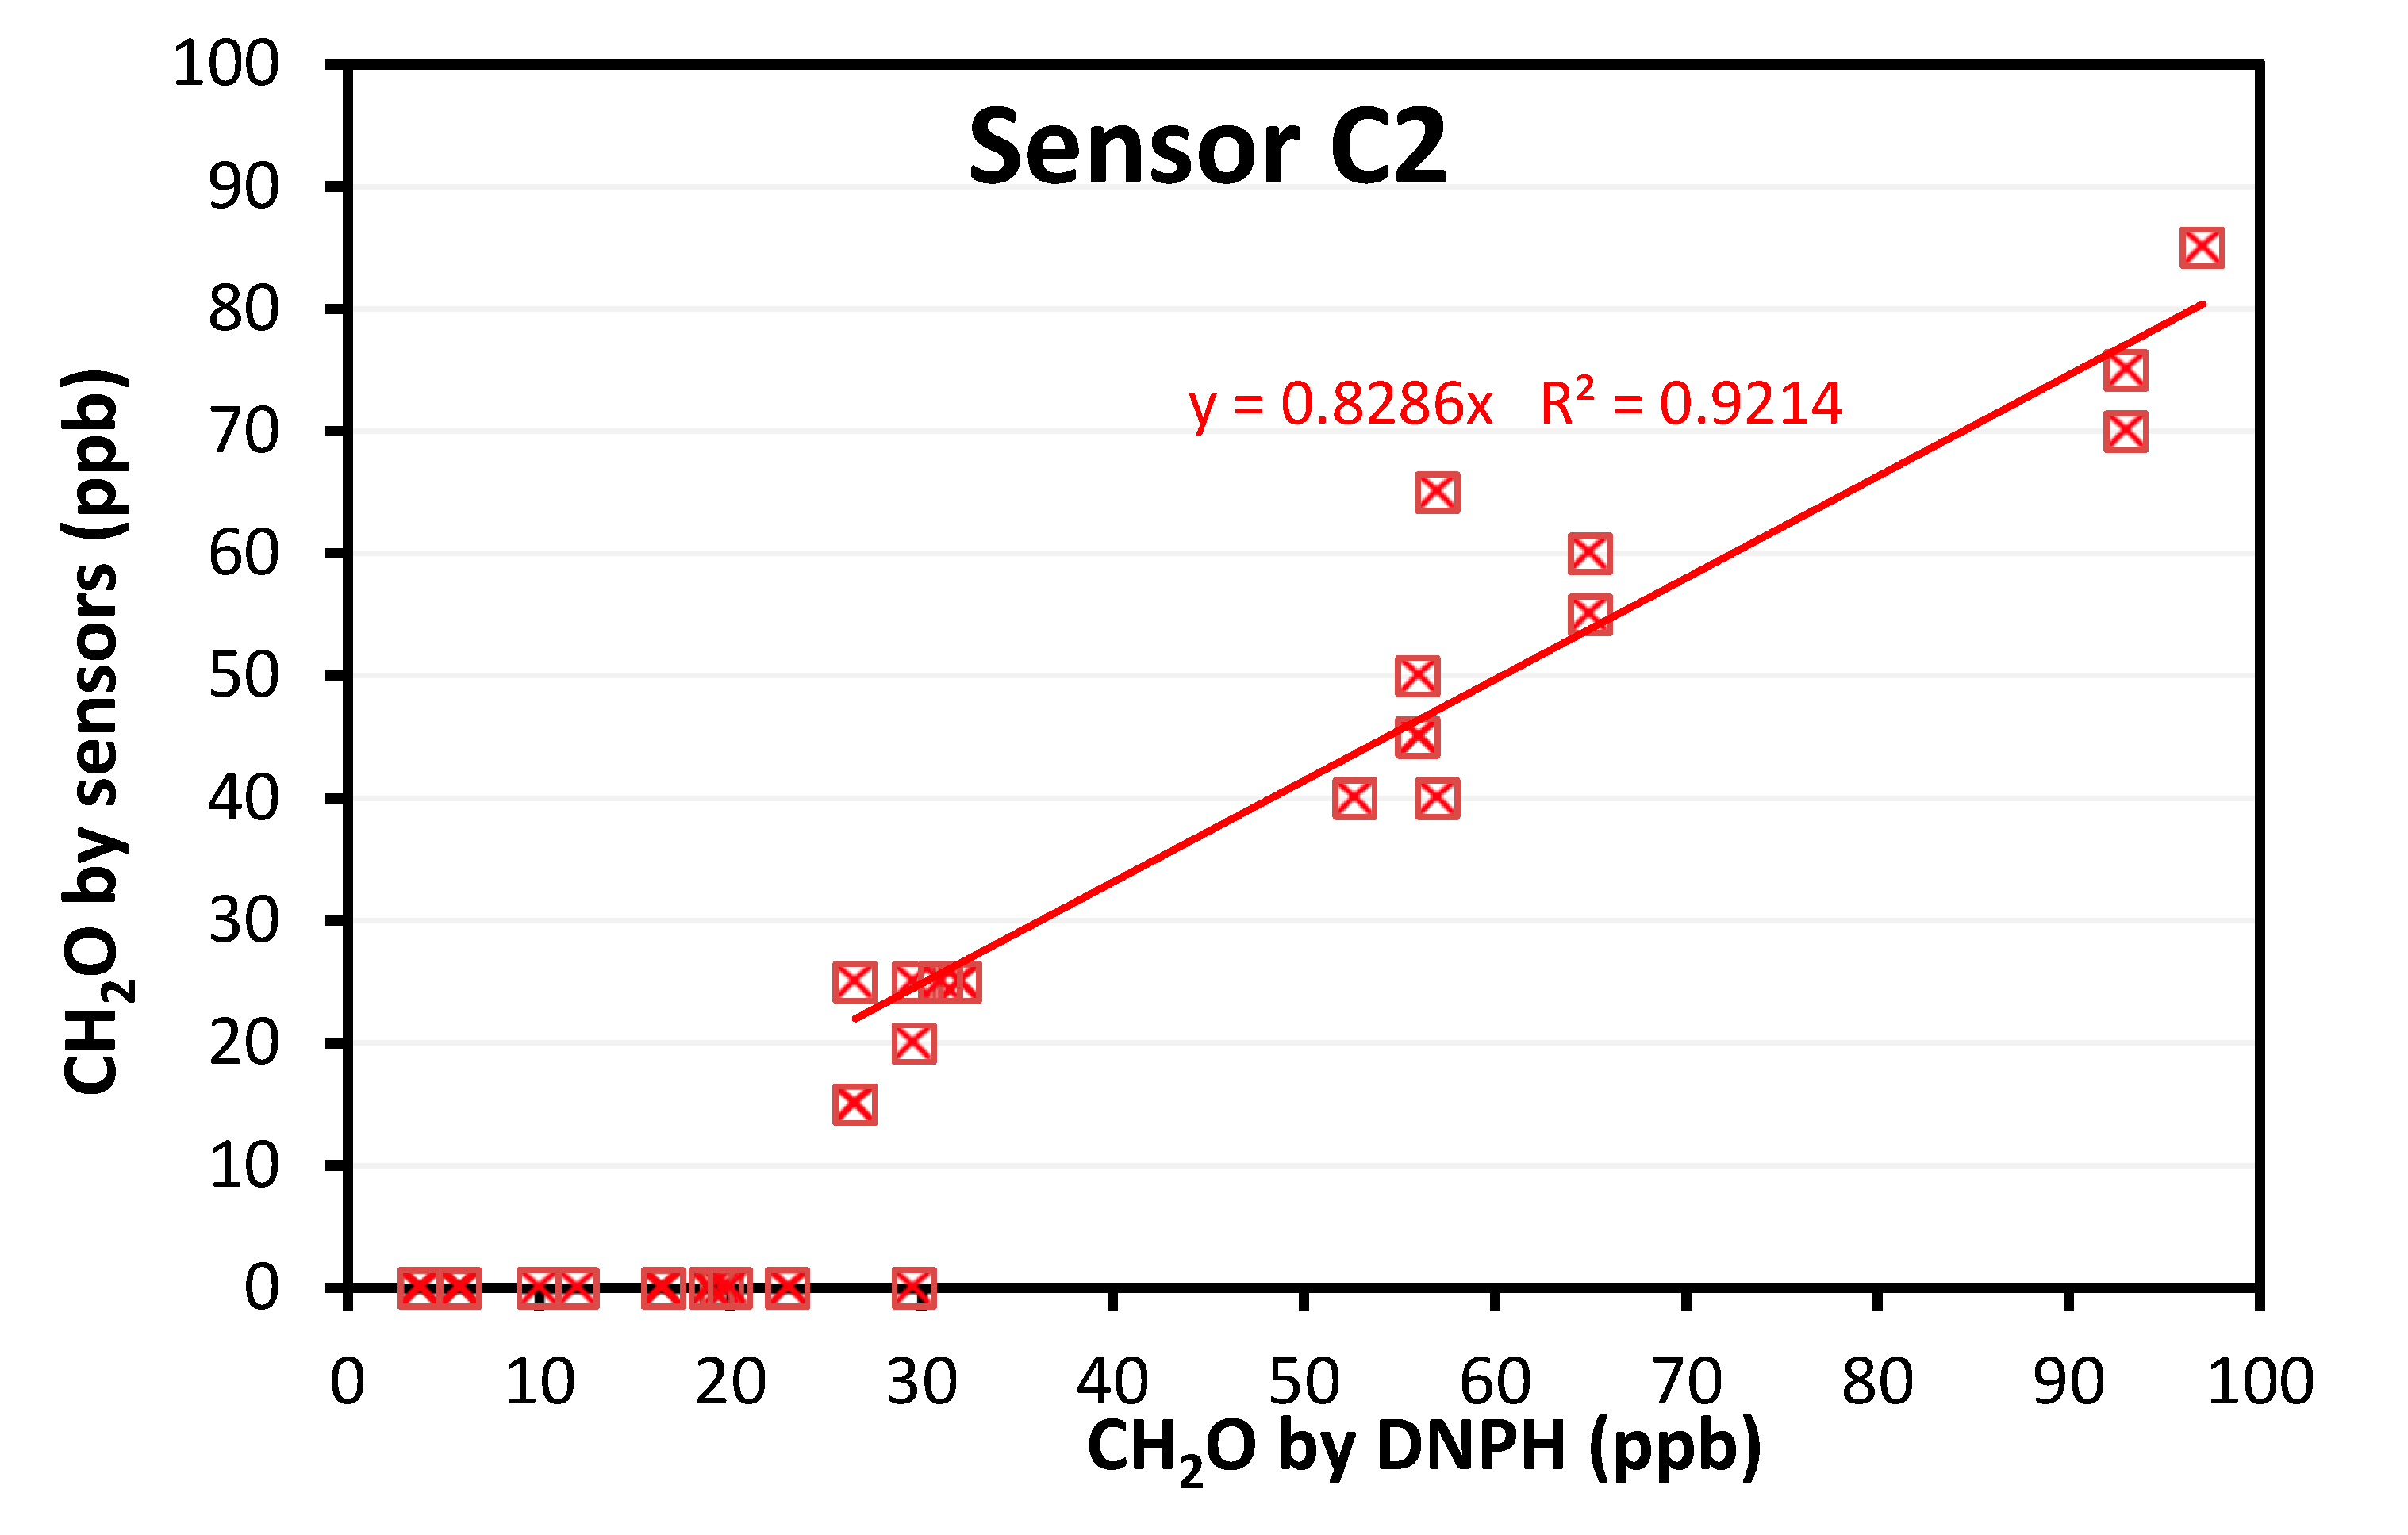
3.1.2. Evaluation in Full-Scale Chamber
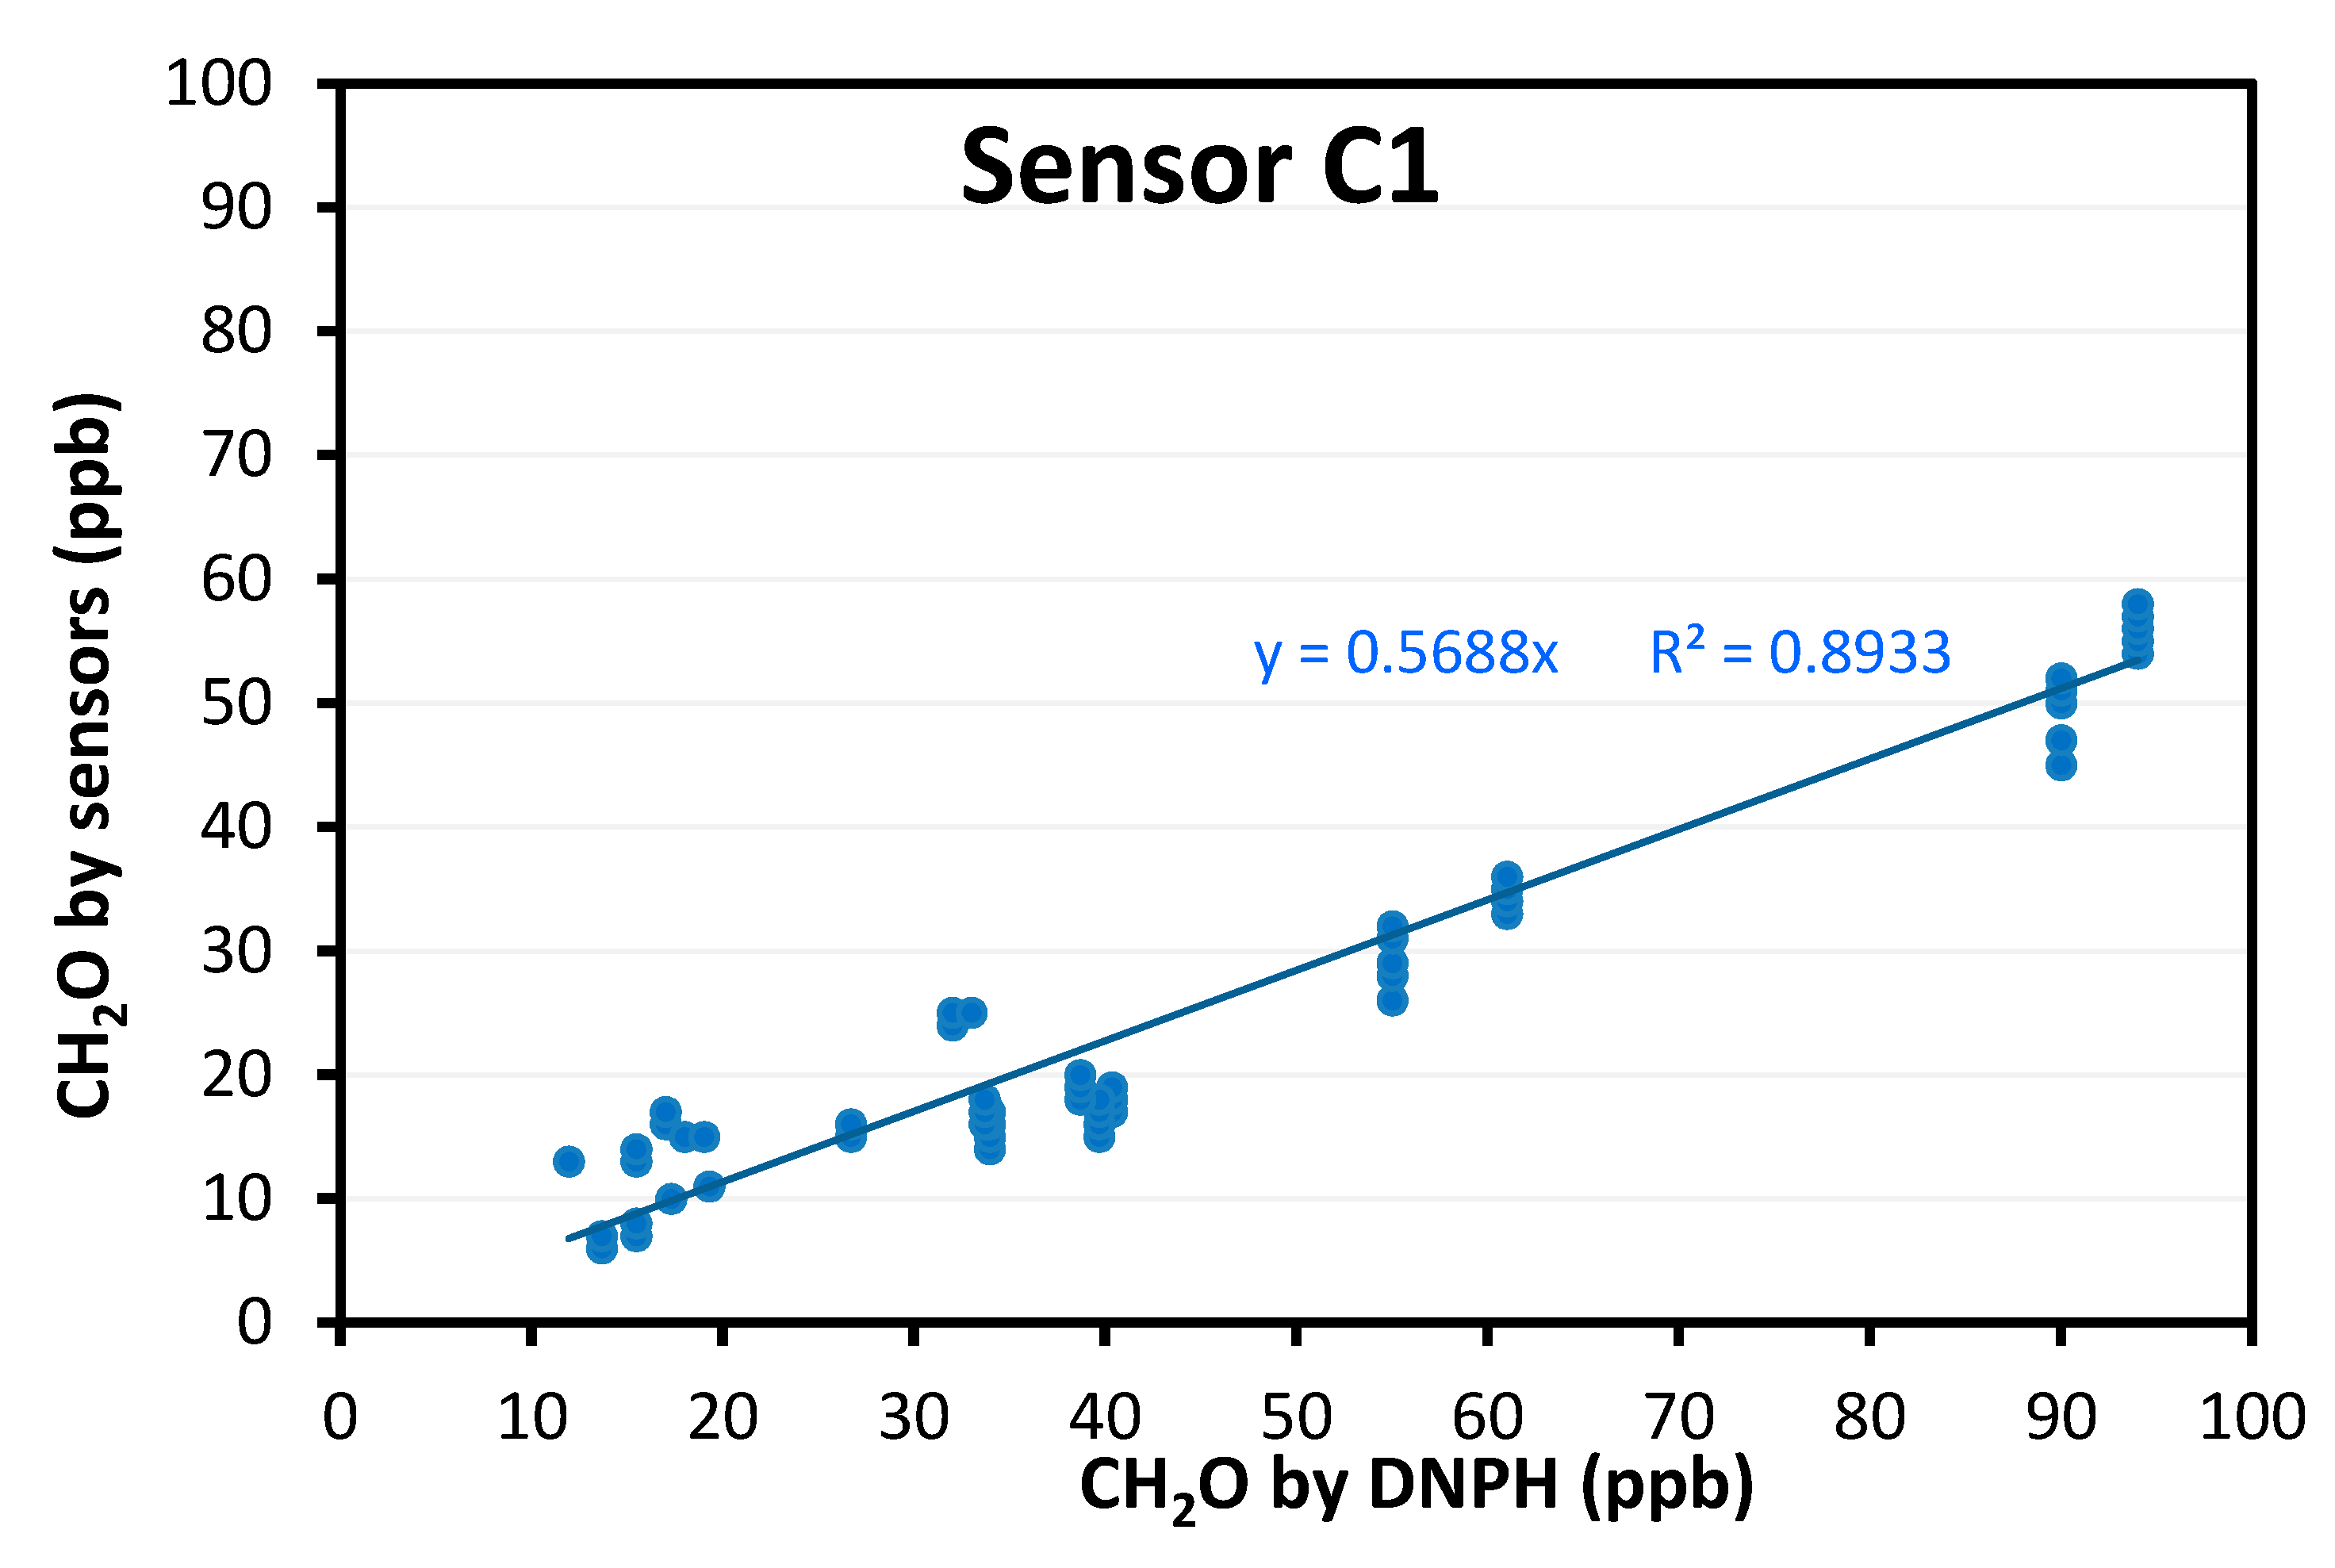
- Colorimetric: two commercial references, namely, Sensor C1, previously evaluated at lab scale, and Sensor C3, were tested. Sensor C3 used a different probe molecule from Sensors C1 and C2.
- Electrochemical: three commercial references, namely, Sensors EC1, EC2, and EC3, were tested. Out of the three, two presented dysfunctions during the trials and had to be excluded from the data analysis (battery problems, no sensitivity for concentration variations, poor working time <15 min before standby mode, etc.). This was the case for the connected objects that fall into this category.
- Concerning trends:
- Concerning accuracy:
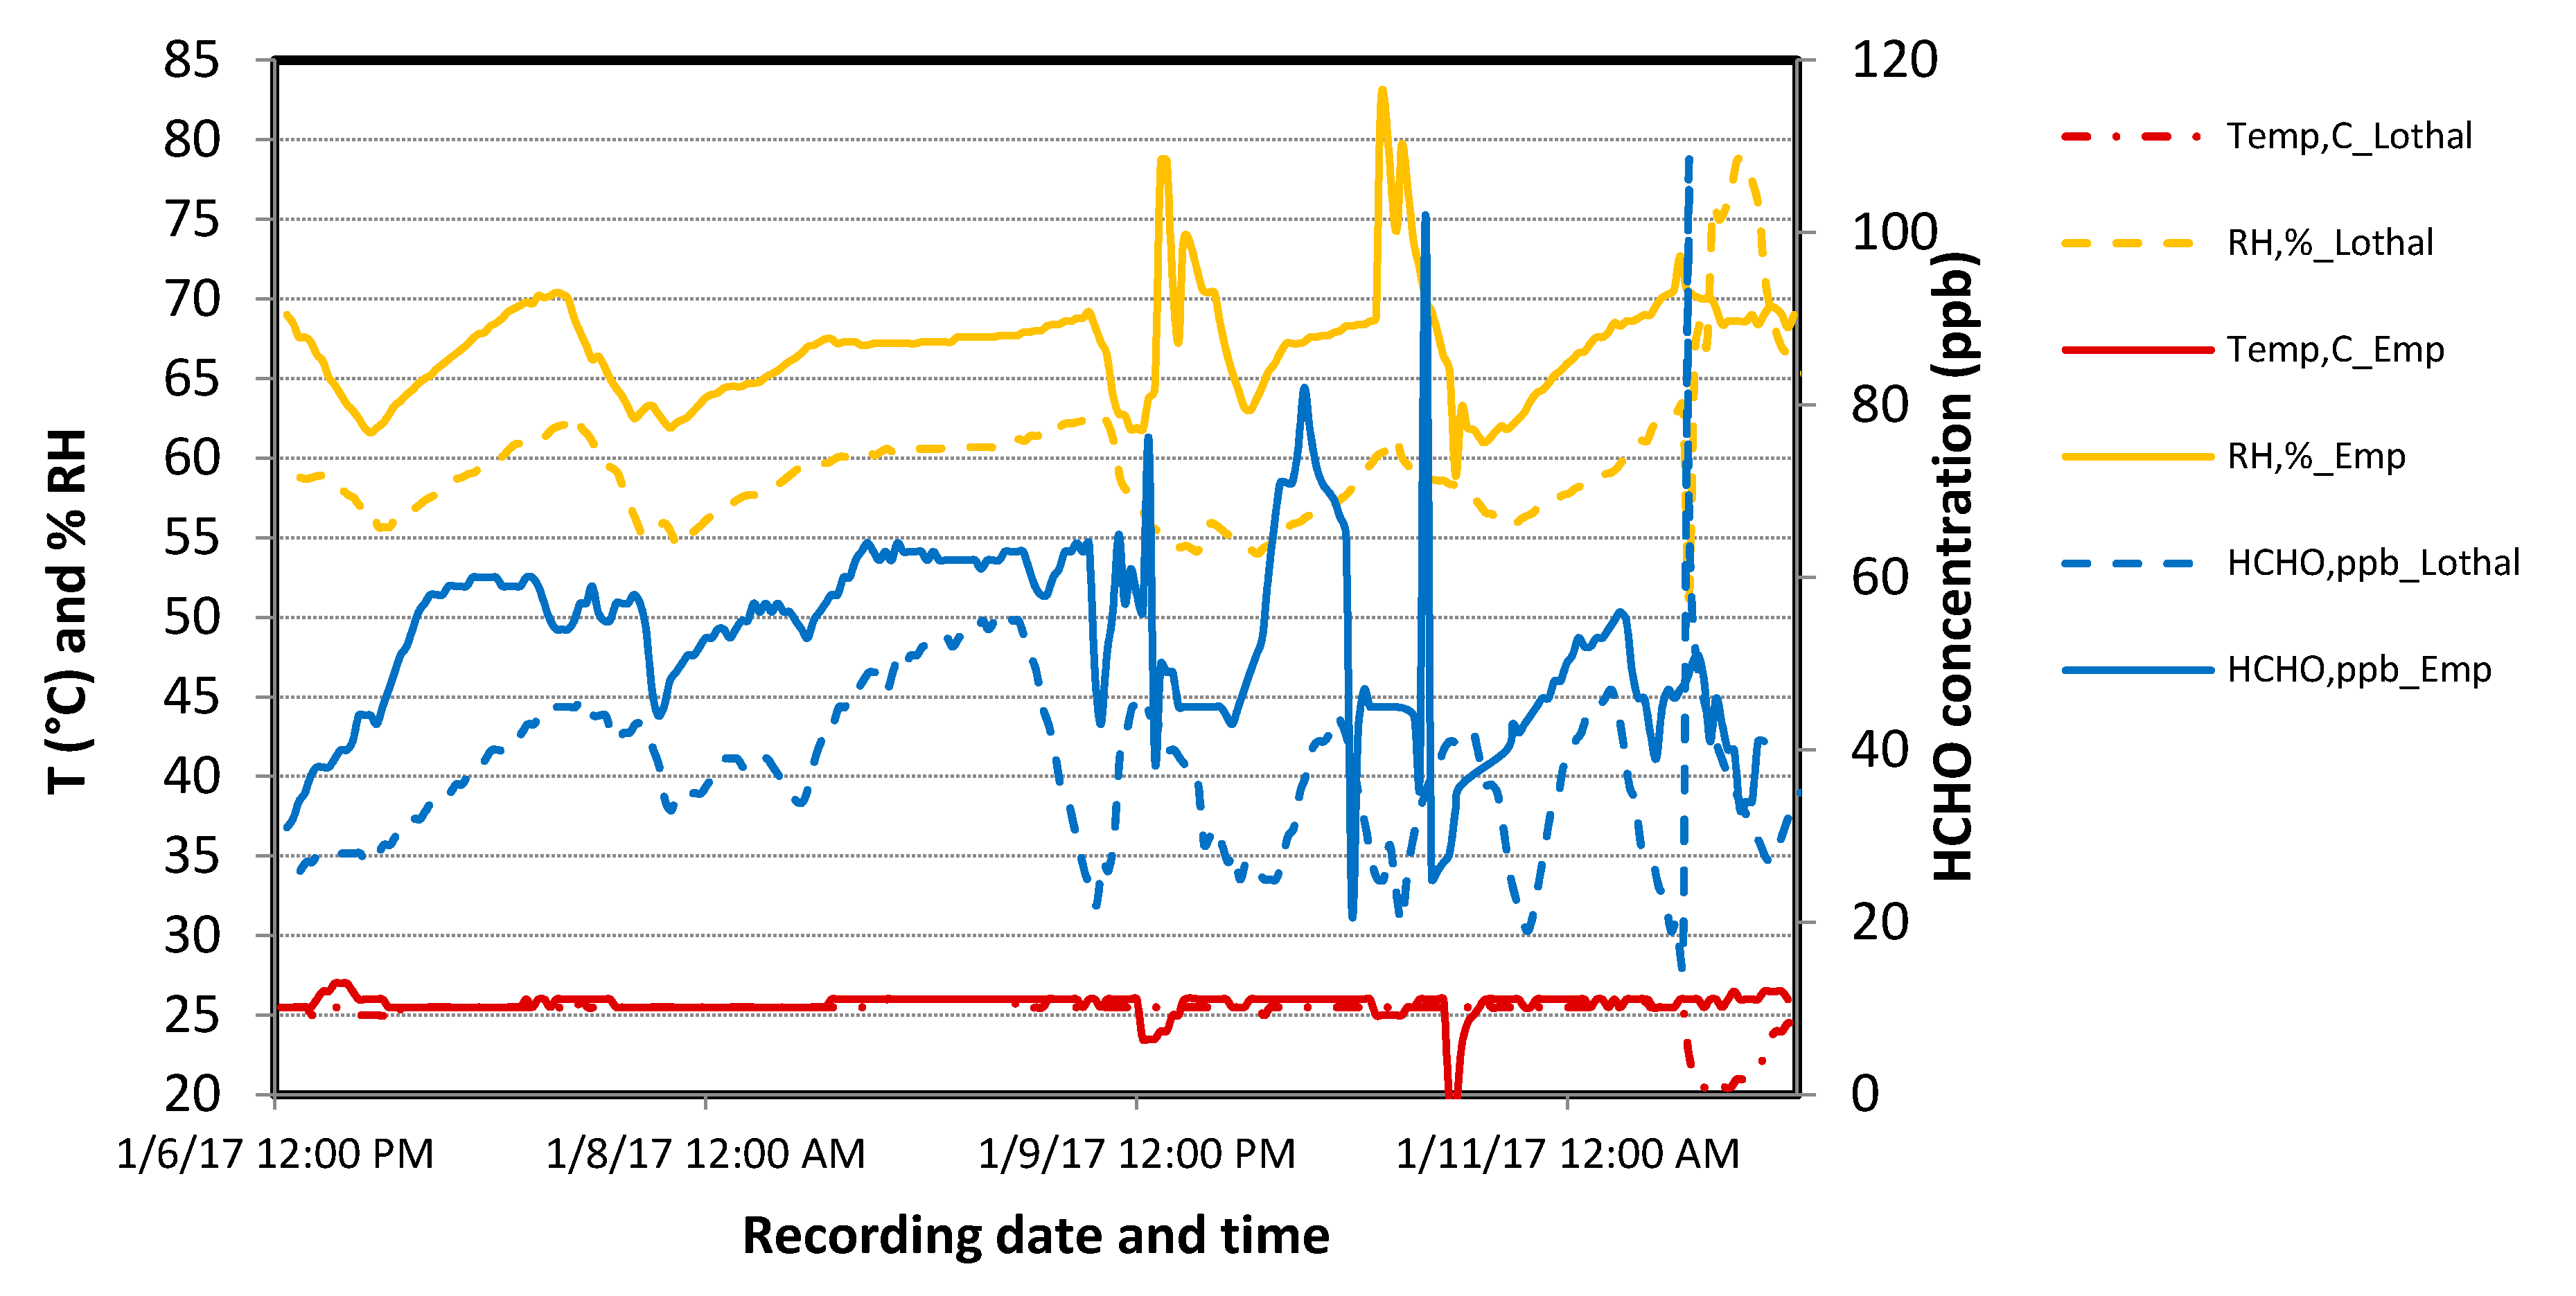
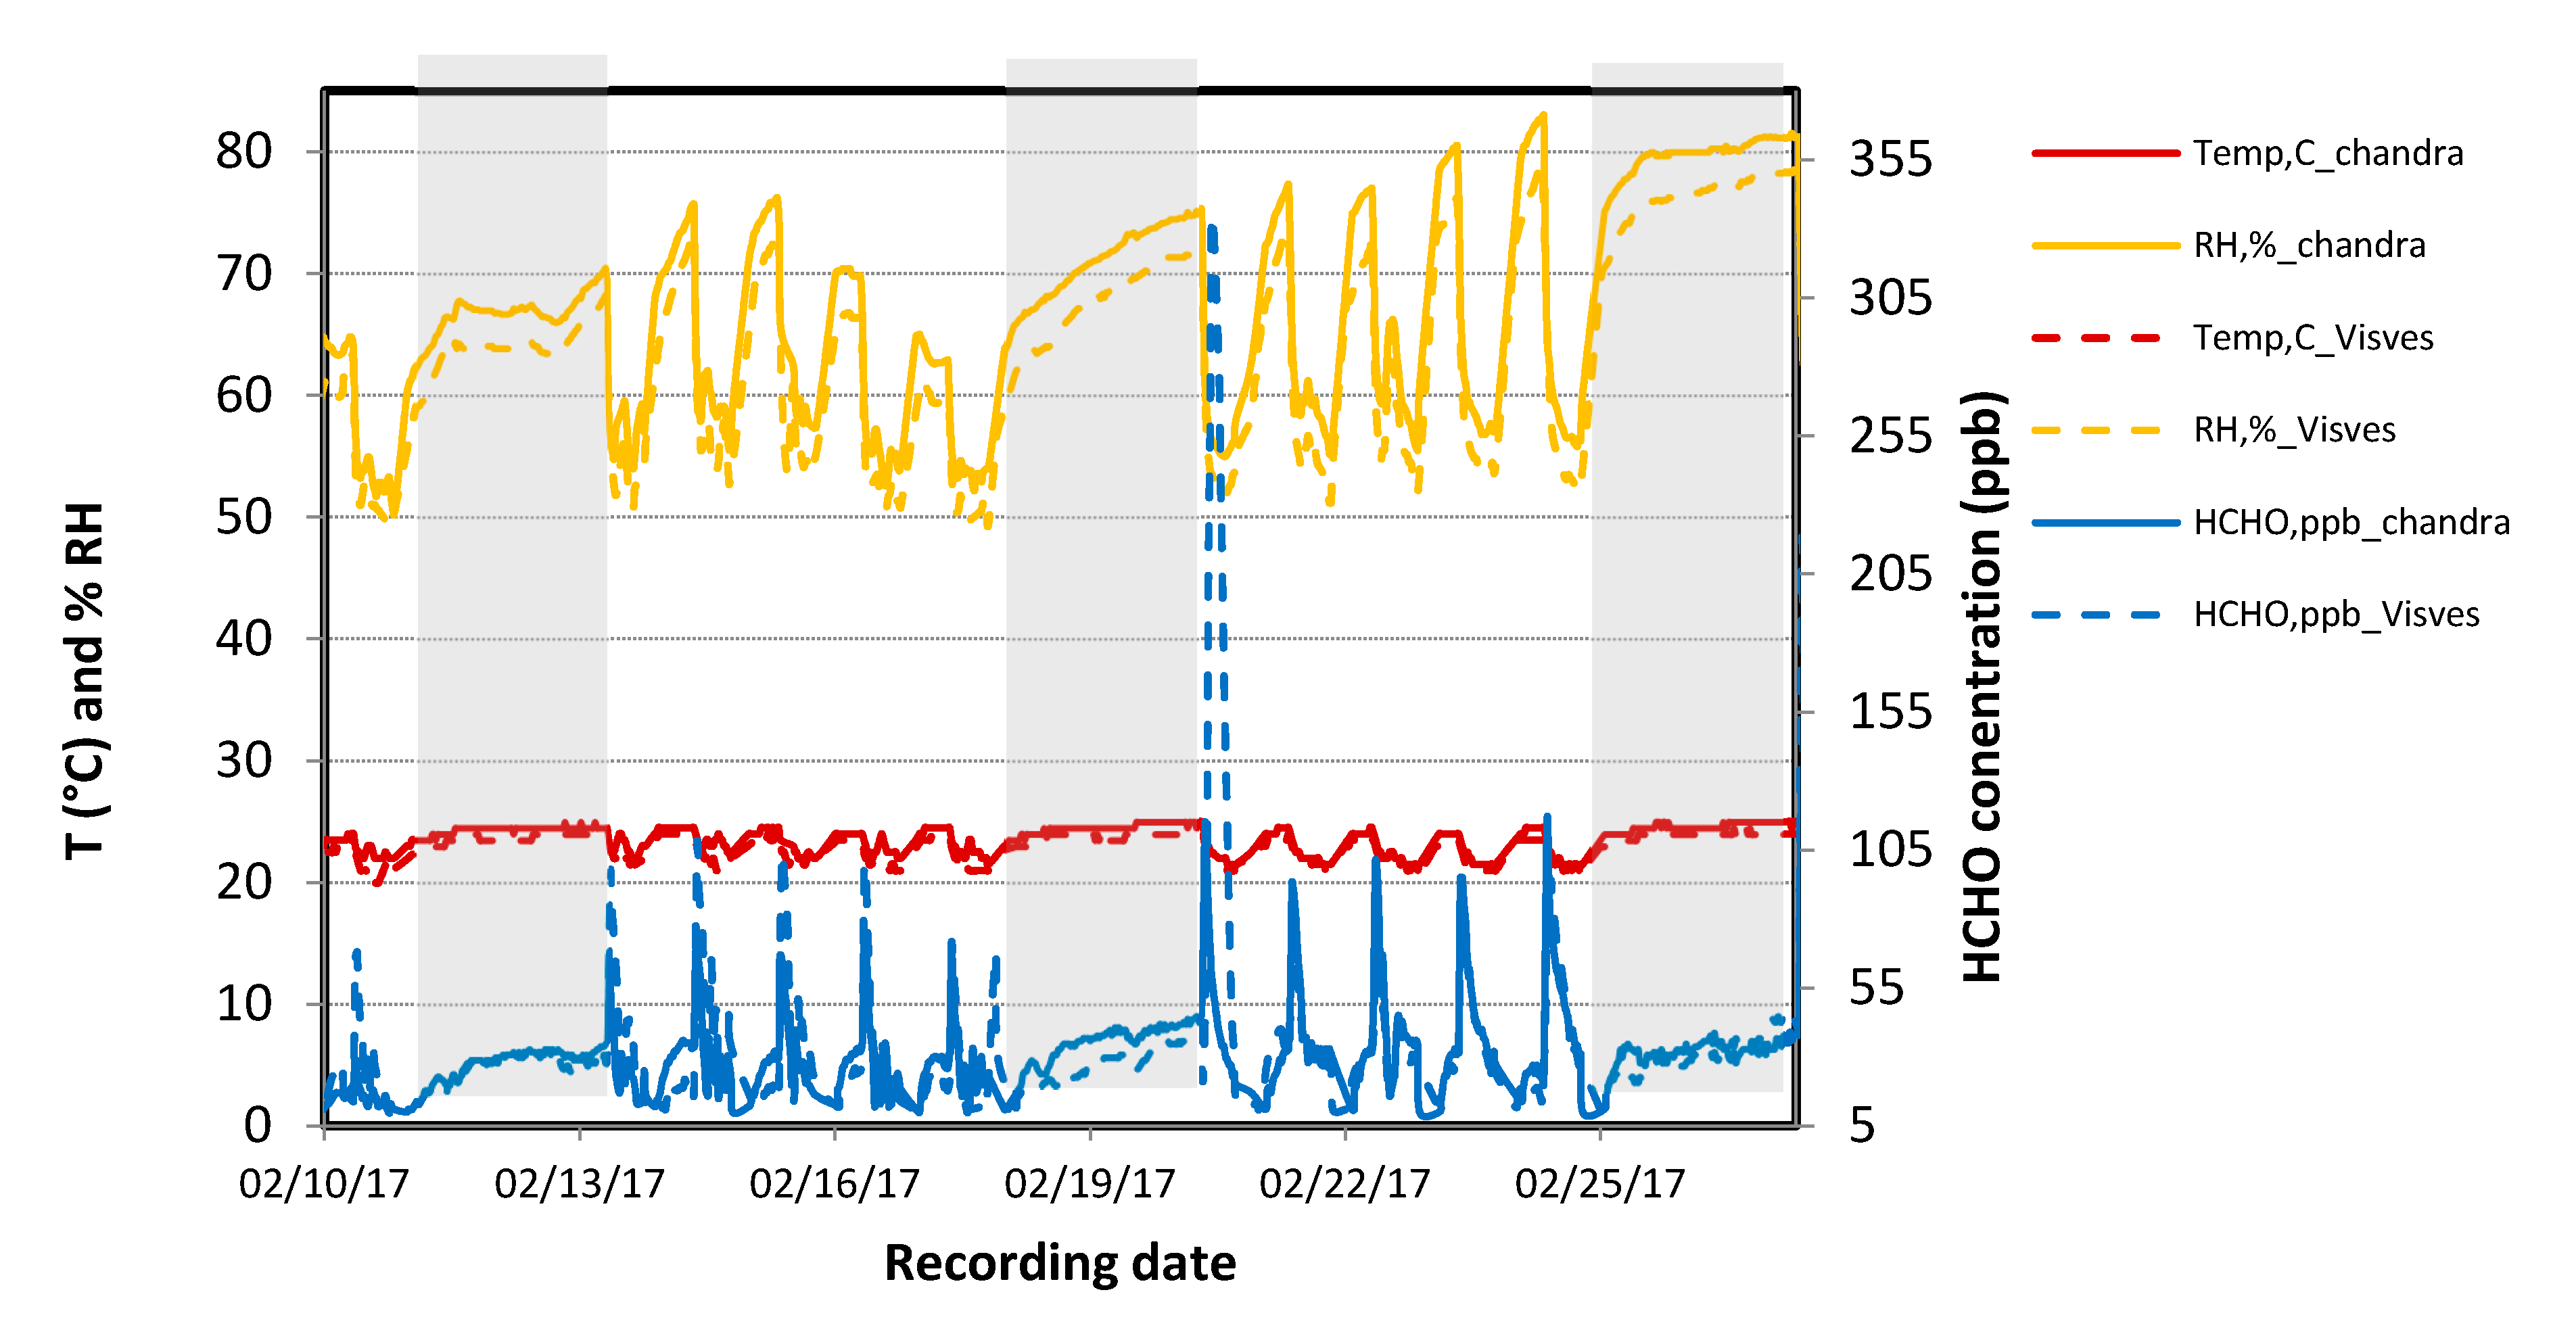
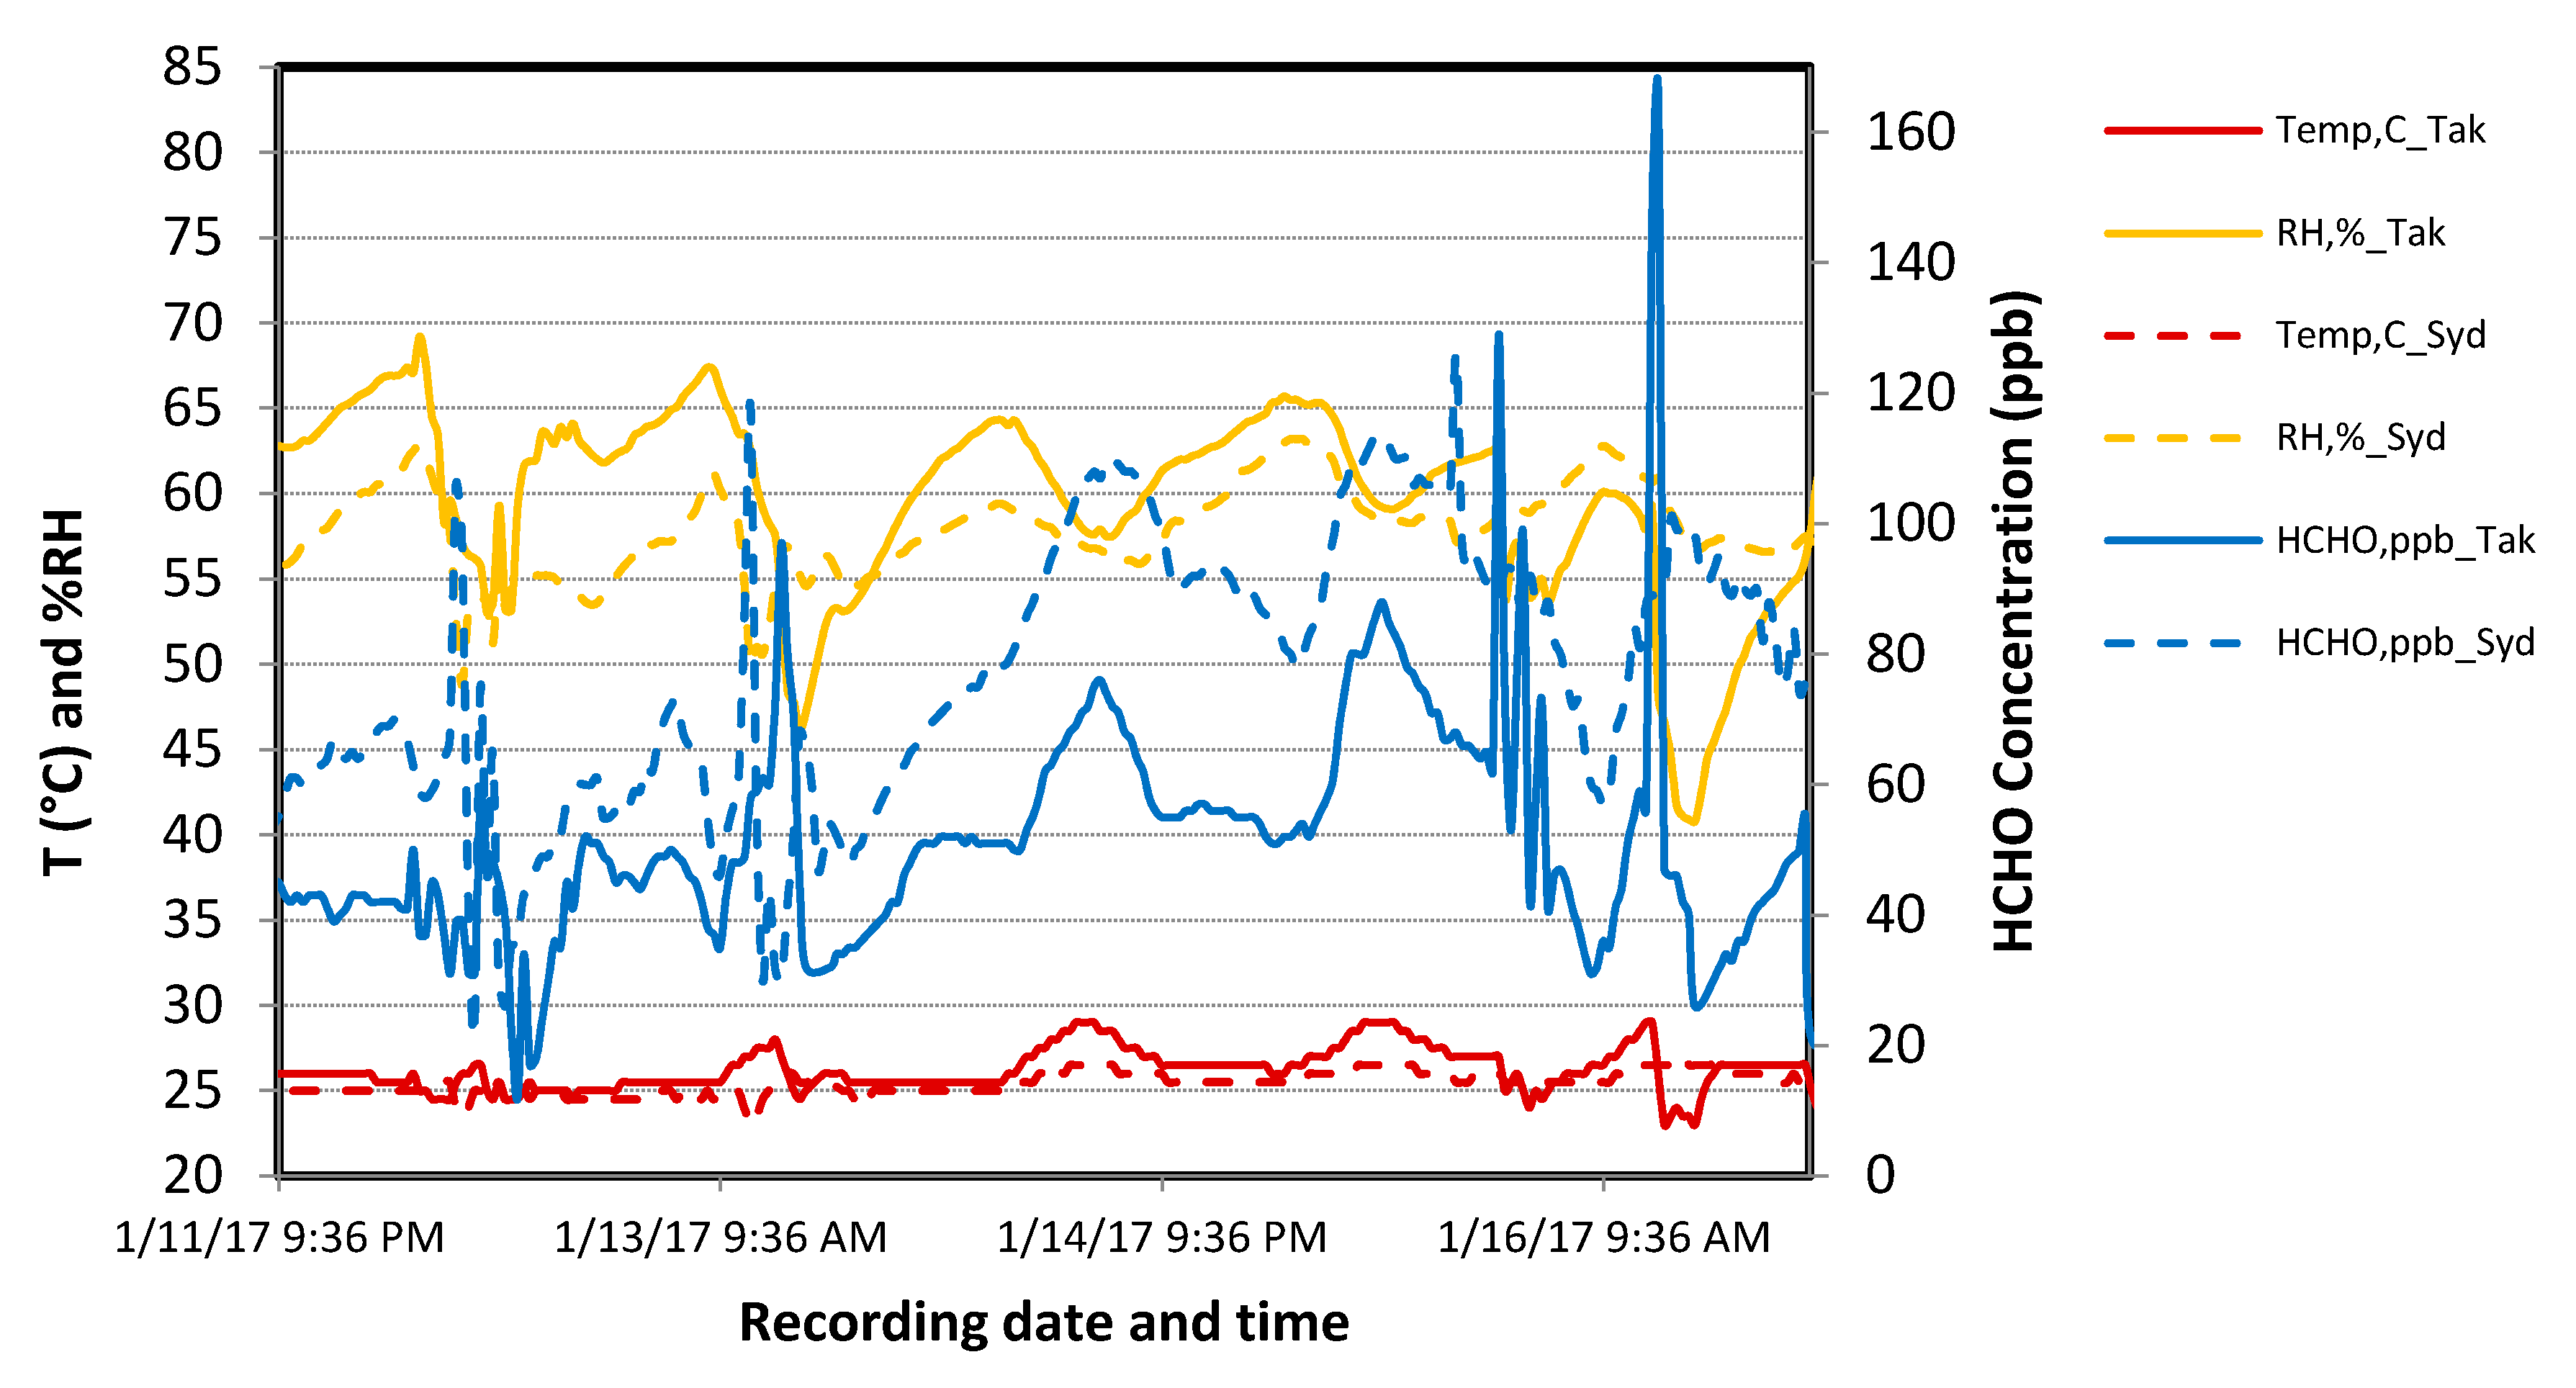
3.1.3. Application in a Test Case in Meeting Rooms in a Real Building
- ⚬
- Temperature was maintained between 20 and 24.5 °C in both rooms with a minimum temperature difference of 0.5–1 °C always observed between both rooms, which may have been due to instruments or because of the HVAC system.
- ⚬
- Relative humidity was in the range 55%–75% and sometimes reached 80%–85%, the RH difference between both the rooms was minimal, and the relative humidity increased overnight when HVAC was switched off.
- ⚬
- Once the HVAC was switched on in the morning, we detected formaldehyde spikes.
3.1.4. Overall Conclusion Regarding the Evaluation of Formaldehyde Sensors
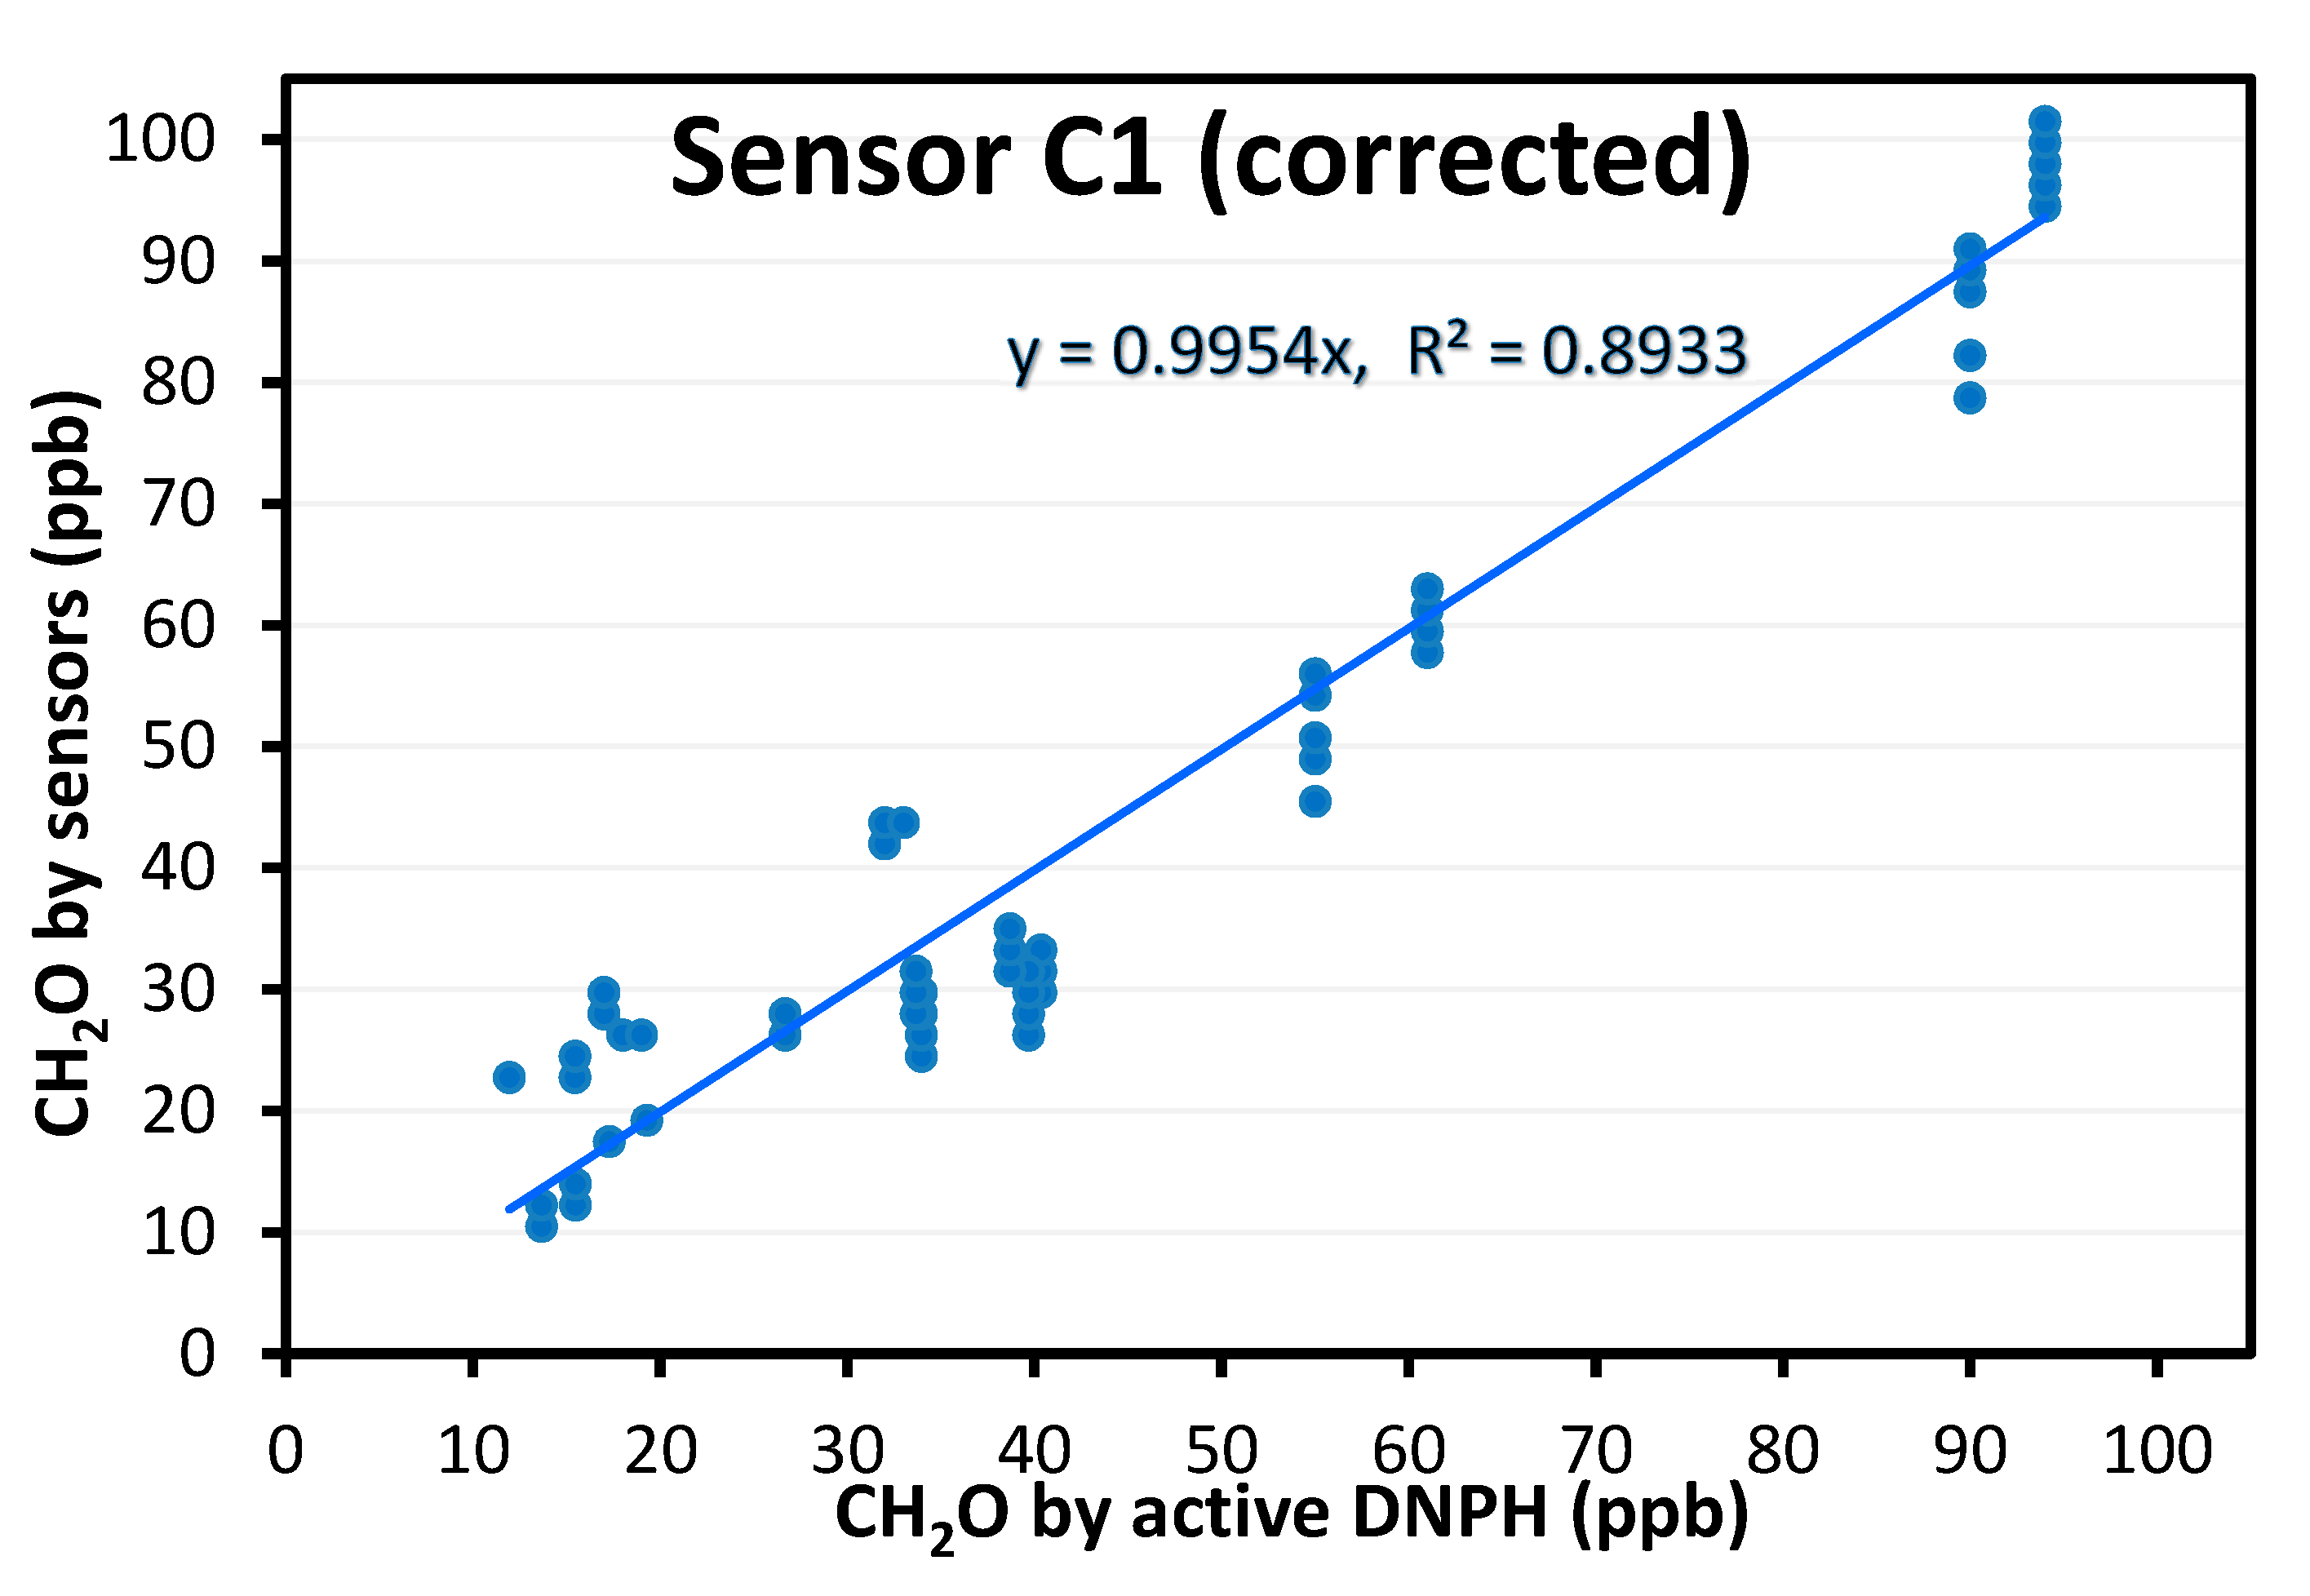
- Colorimetric technology is preferred, especially when sensitivity is needed. With Sensor C1, we could detect concentrations as low as 20 ppb. We even obtained sensor responses for concentrations down to 10 ppb and below (data not shown) but we prefer to make no recommendations for this range as the supplier does not guarantee accuracy for <20 ppb. However, to obtain absolute values comparable to the reference method, a correction factor has to be applied. Based on the different tested conditions, this correction factor could depend on temperature and humidity. This device was used in a practical real building to compare meeting rooms, confirming the interest of the device for such a use case. This in situ test also showed that Sensor C1 is quite easy to use for non-experts, based on the feedback collected.
- Electrochemical technology may still retain some interest for its ability to obtain a very basic trend, but not at concentrations <30 ppb, which are often met in buildings today. Although they were not presented in this study, electrochemical sensors have interference issues, in particular in the presence of alcohol. When sensitivity and selectivity are key criteria, colorimetric technology is preferred.
3.2. Evaluation of TVOC Sensors
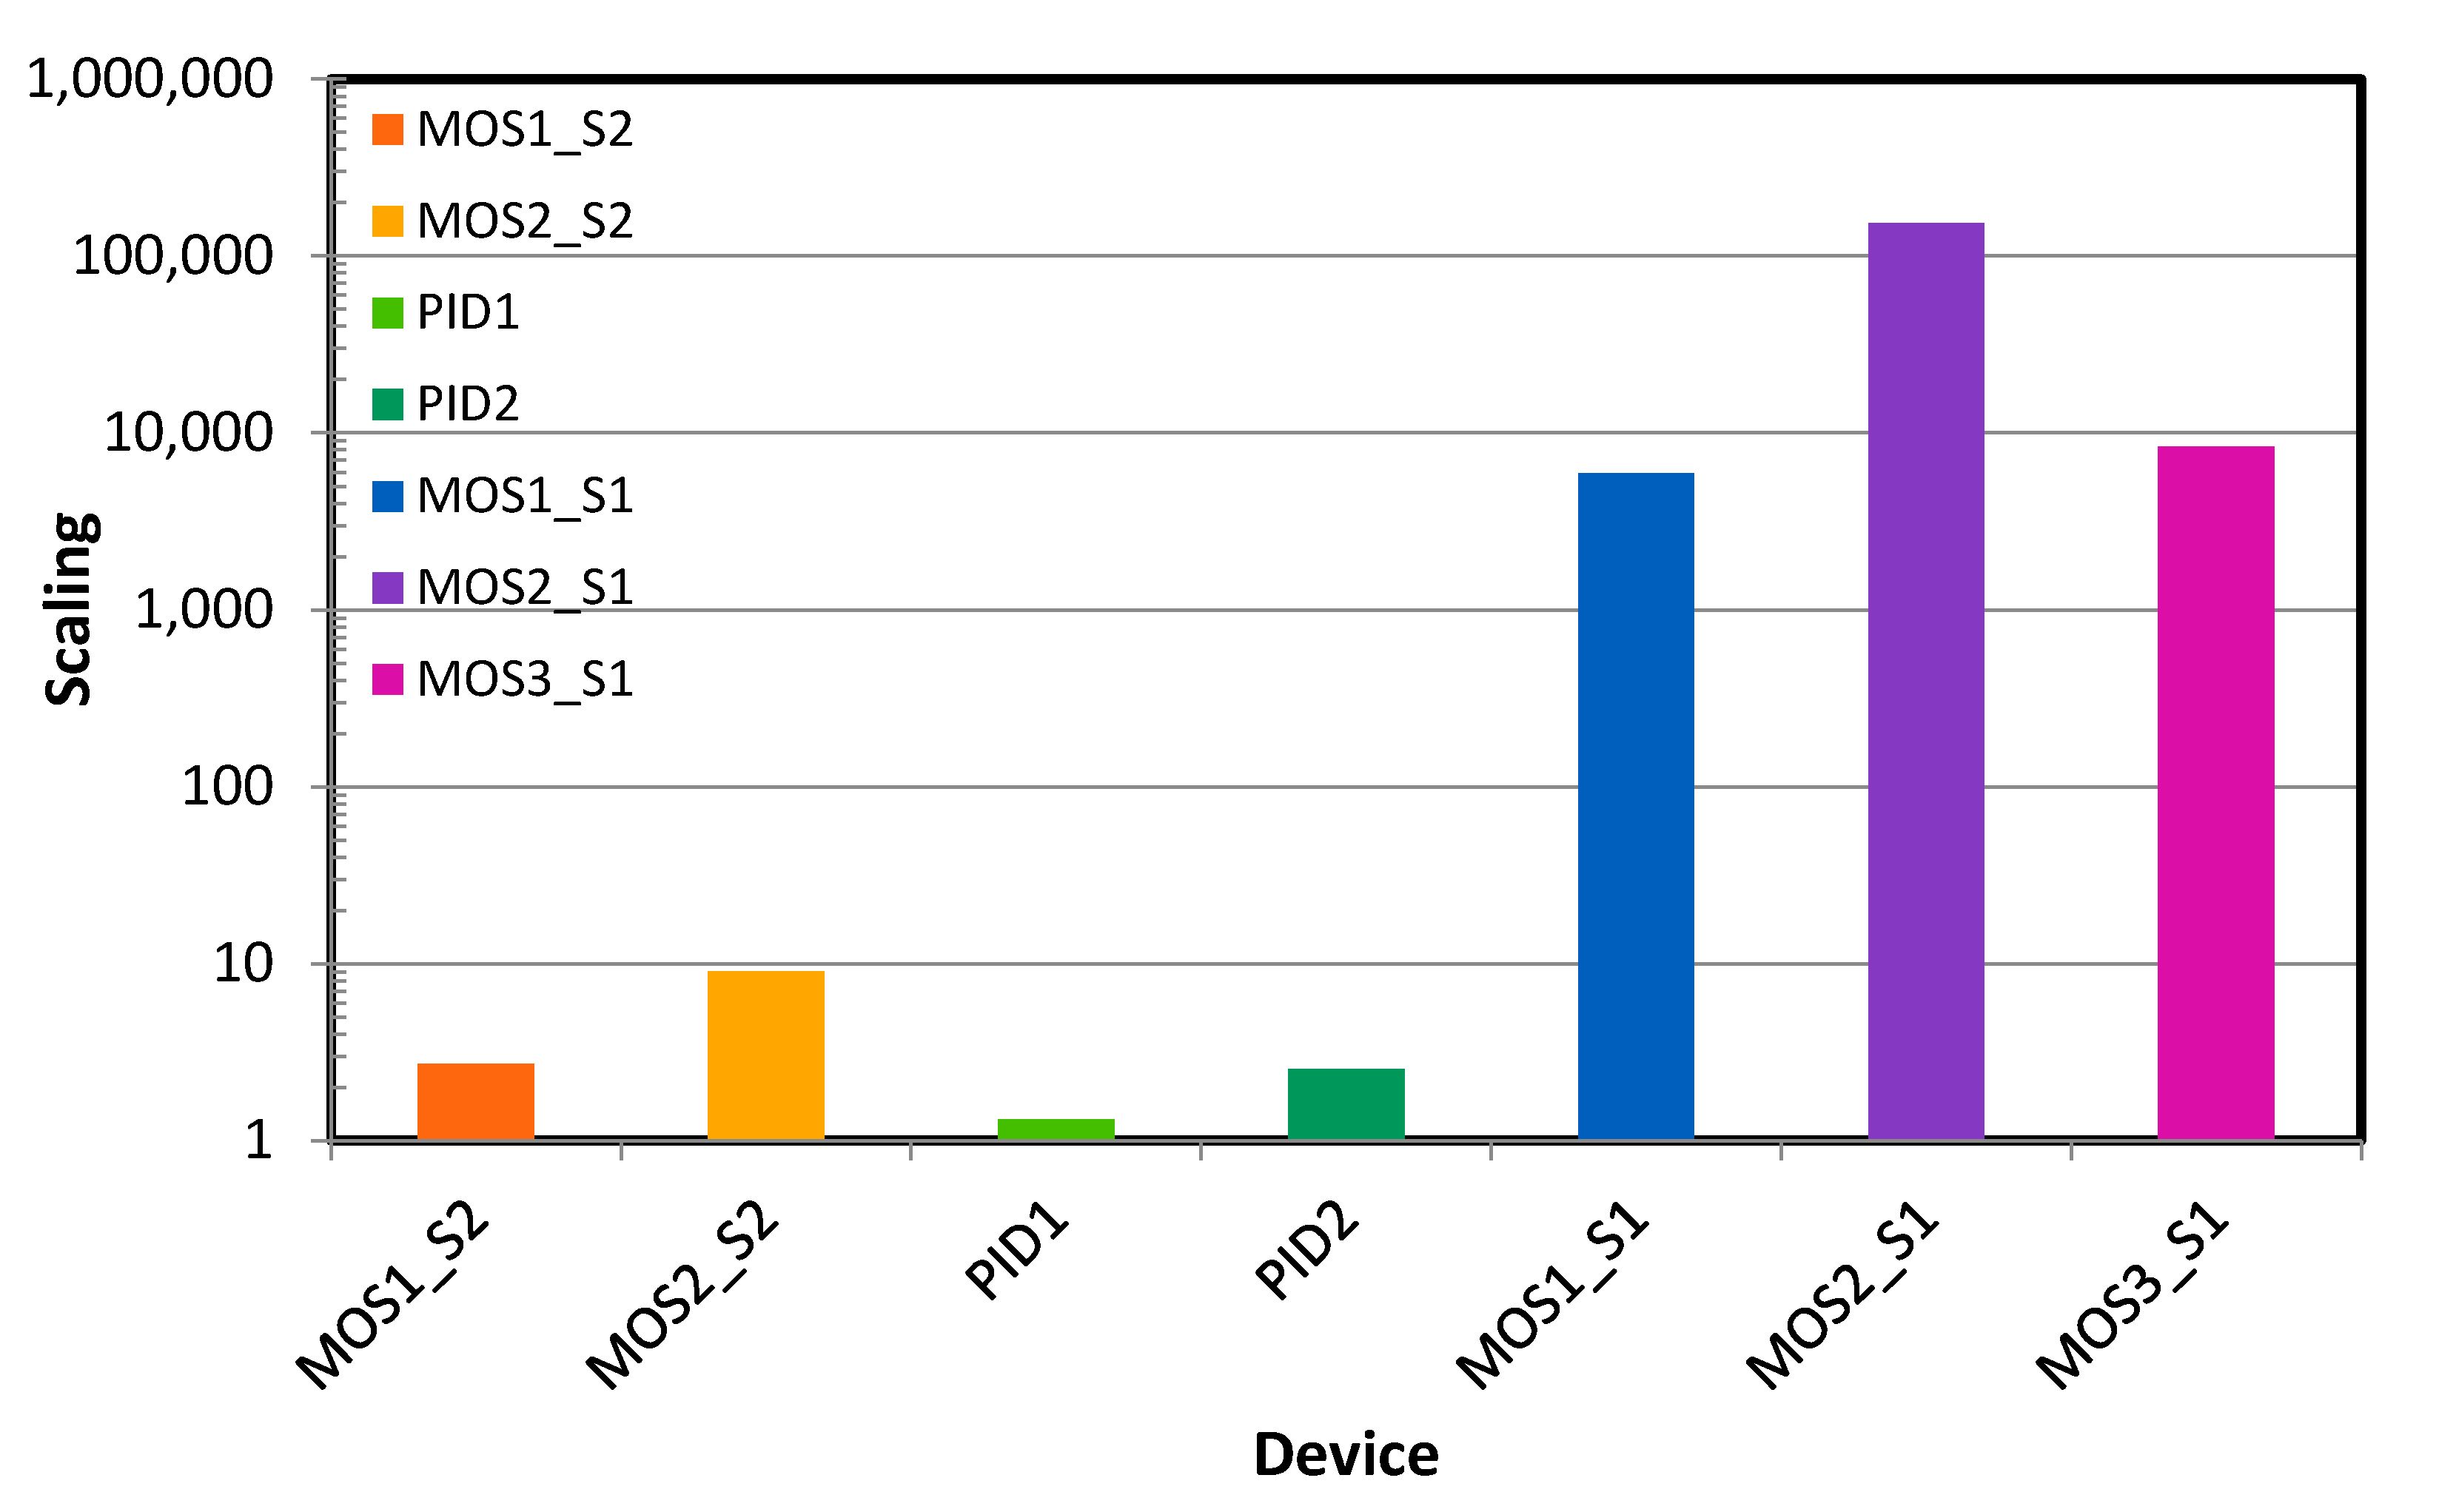
- Sensor scaling factor:
- ➢
- For MOS: Devices with MOSX_S2 sensors are better calibrated than MOSX_S1 devices, as their scaling factor is closer to 1. For MOSX_S1 devices, the TVOC concentration is given in equivalent CO2. Indeed, these devices do not have a CO2 sensor inside. It is not valid to make a direct correlation between CO2 and TCOV concentration in a room. The first is essentially due to human breathing and the second has multiple origins, including building materials, perfumes, and human activities. Therefore, such an analogy is confusing.
- ➢
- For PID: The two tested devices have a scaling factor close to one, which would suggest they are well calibrated.
- Sensor linearity
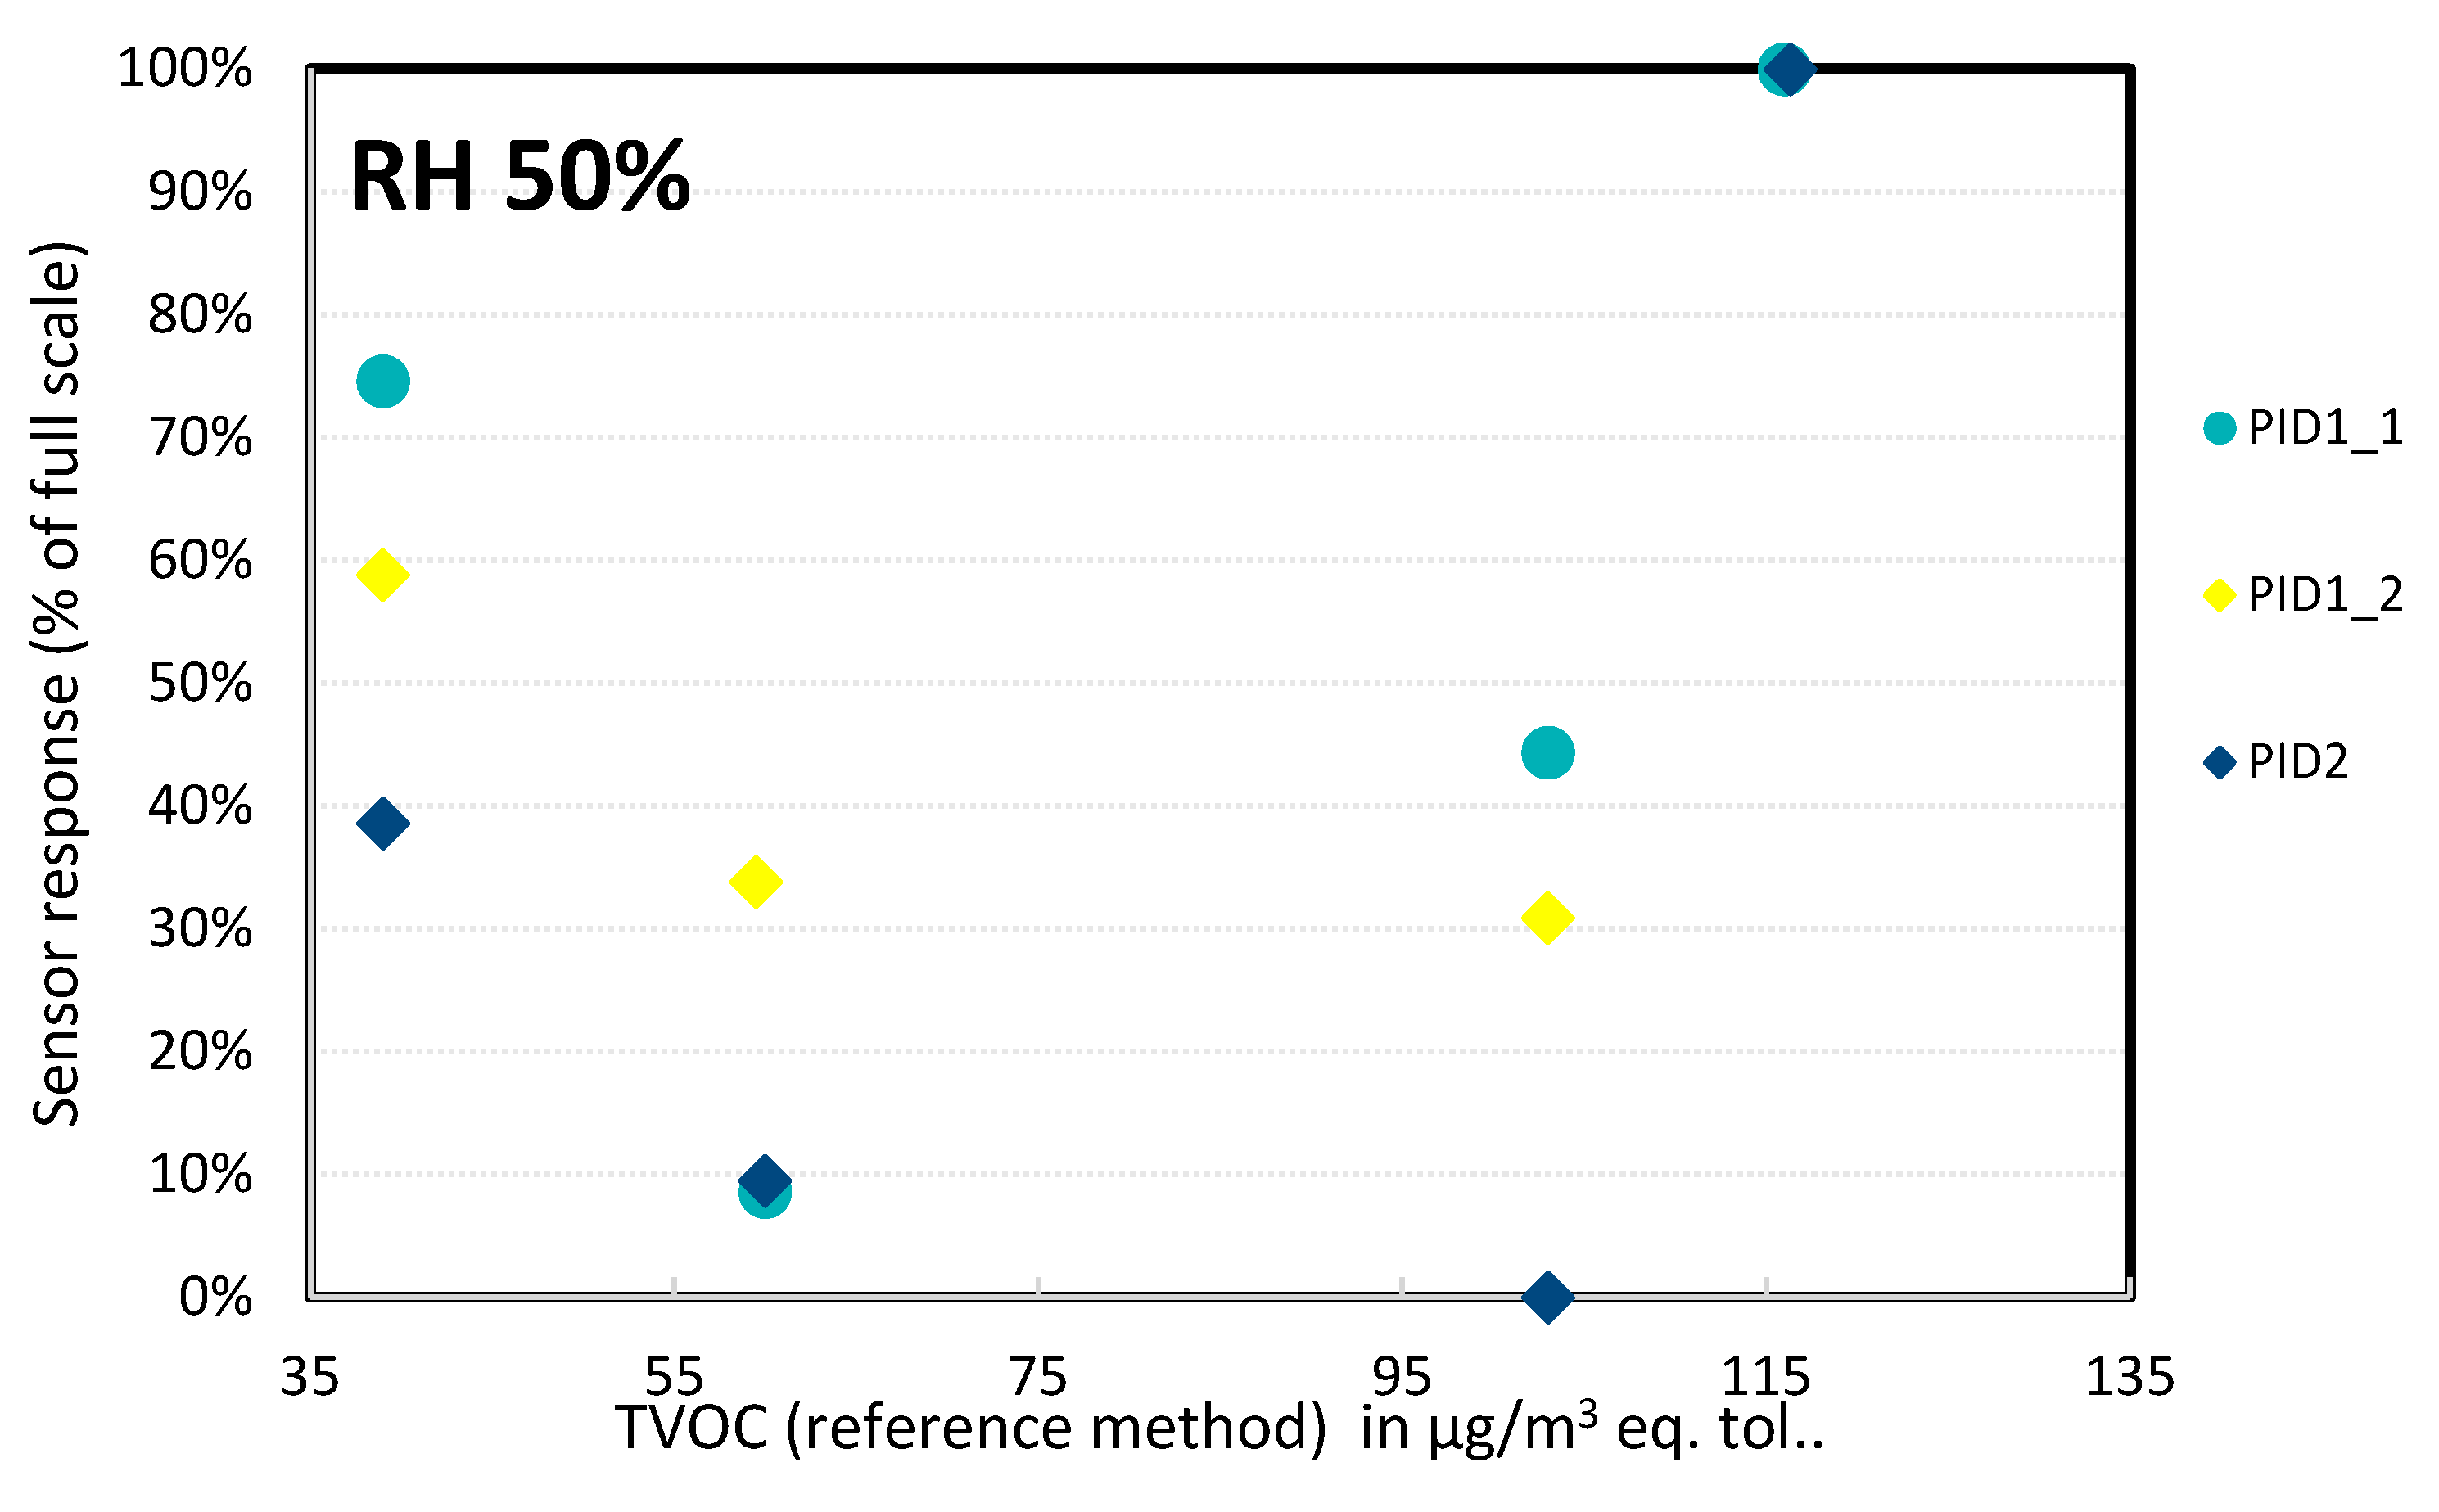
- ➢
- PID sensors (Figure 16): In the concentration range tested, the sensor did not show a linear response. In addition, the two measurements performed at the same TVOC concentration of 60 µg/m3 gave very different results, suggesting a high error: for PID1-1, the average value of the two measurements was 17%, but the error bar was 100%; for one of these measurements the sensor did not detect any concentration and for the second measurement the value was 34% of the full scale. A similar observation was performed with PID1-2 co-located with PID1-1: the average result of the two measurements was 34% but again the error bar was 100%. A possible explanation could be that the devices were tested for a very low range of TVOC concentrations; these tests may have been performed for below their detection limit, and additional trials should be carried out at higher TVOC concentrations (200–1000 µg/m3).
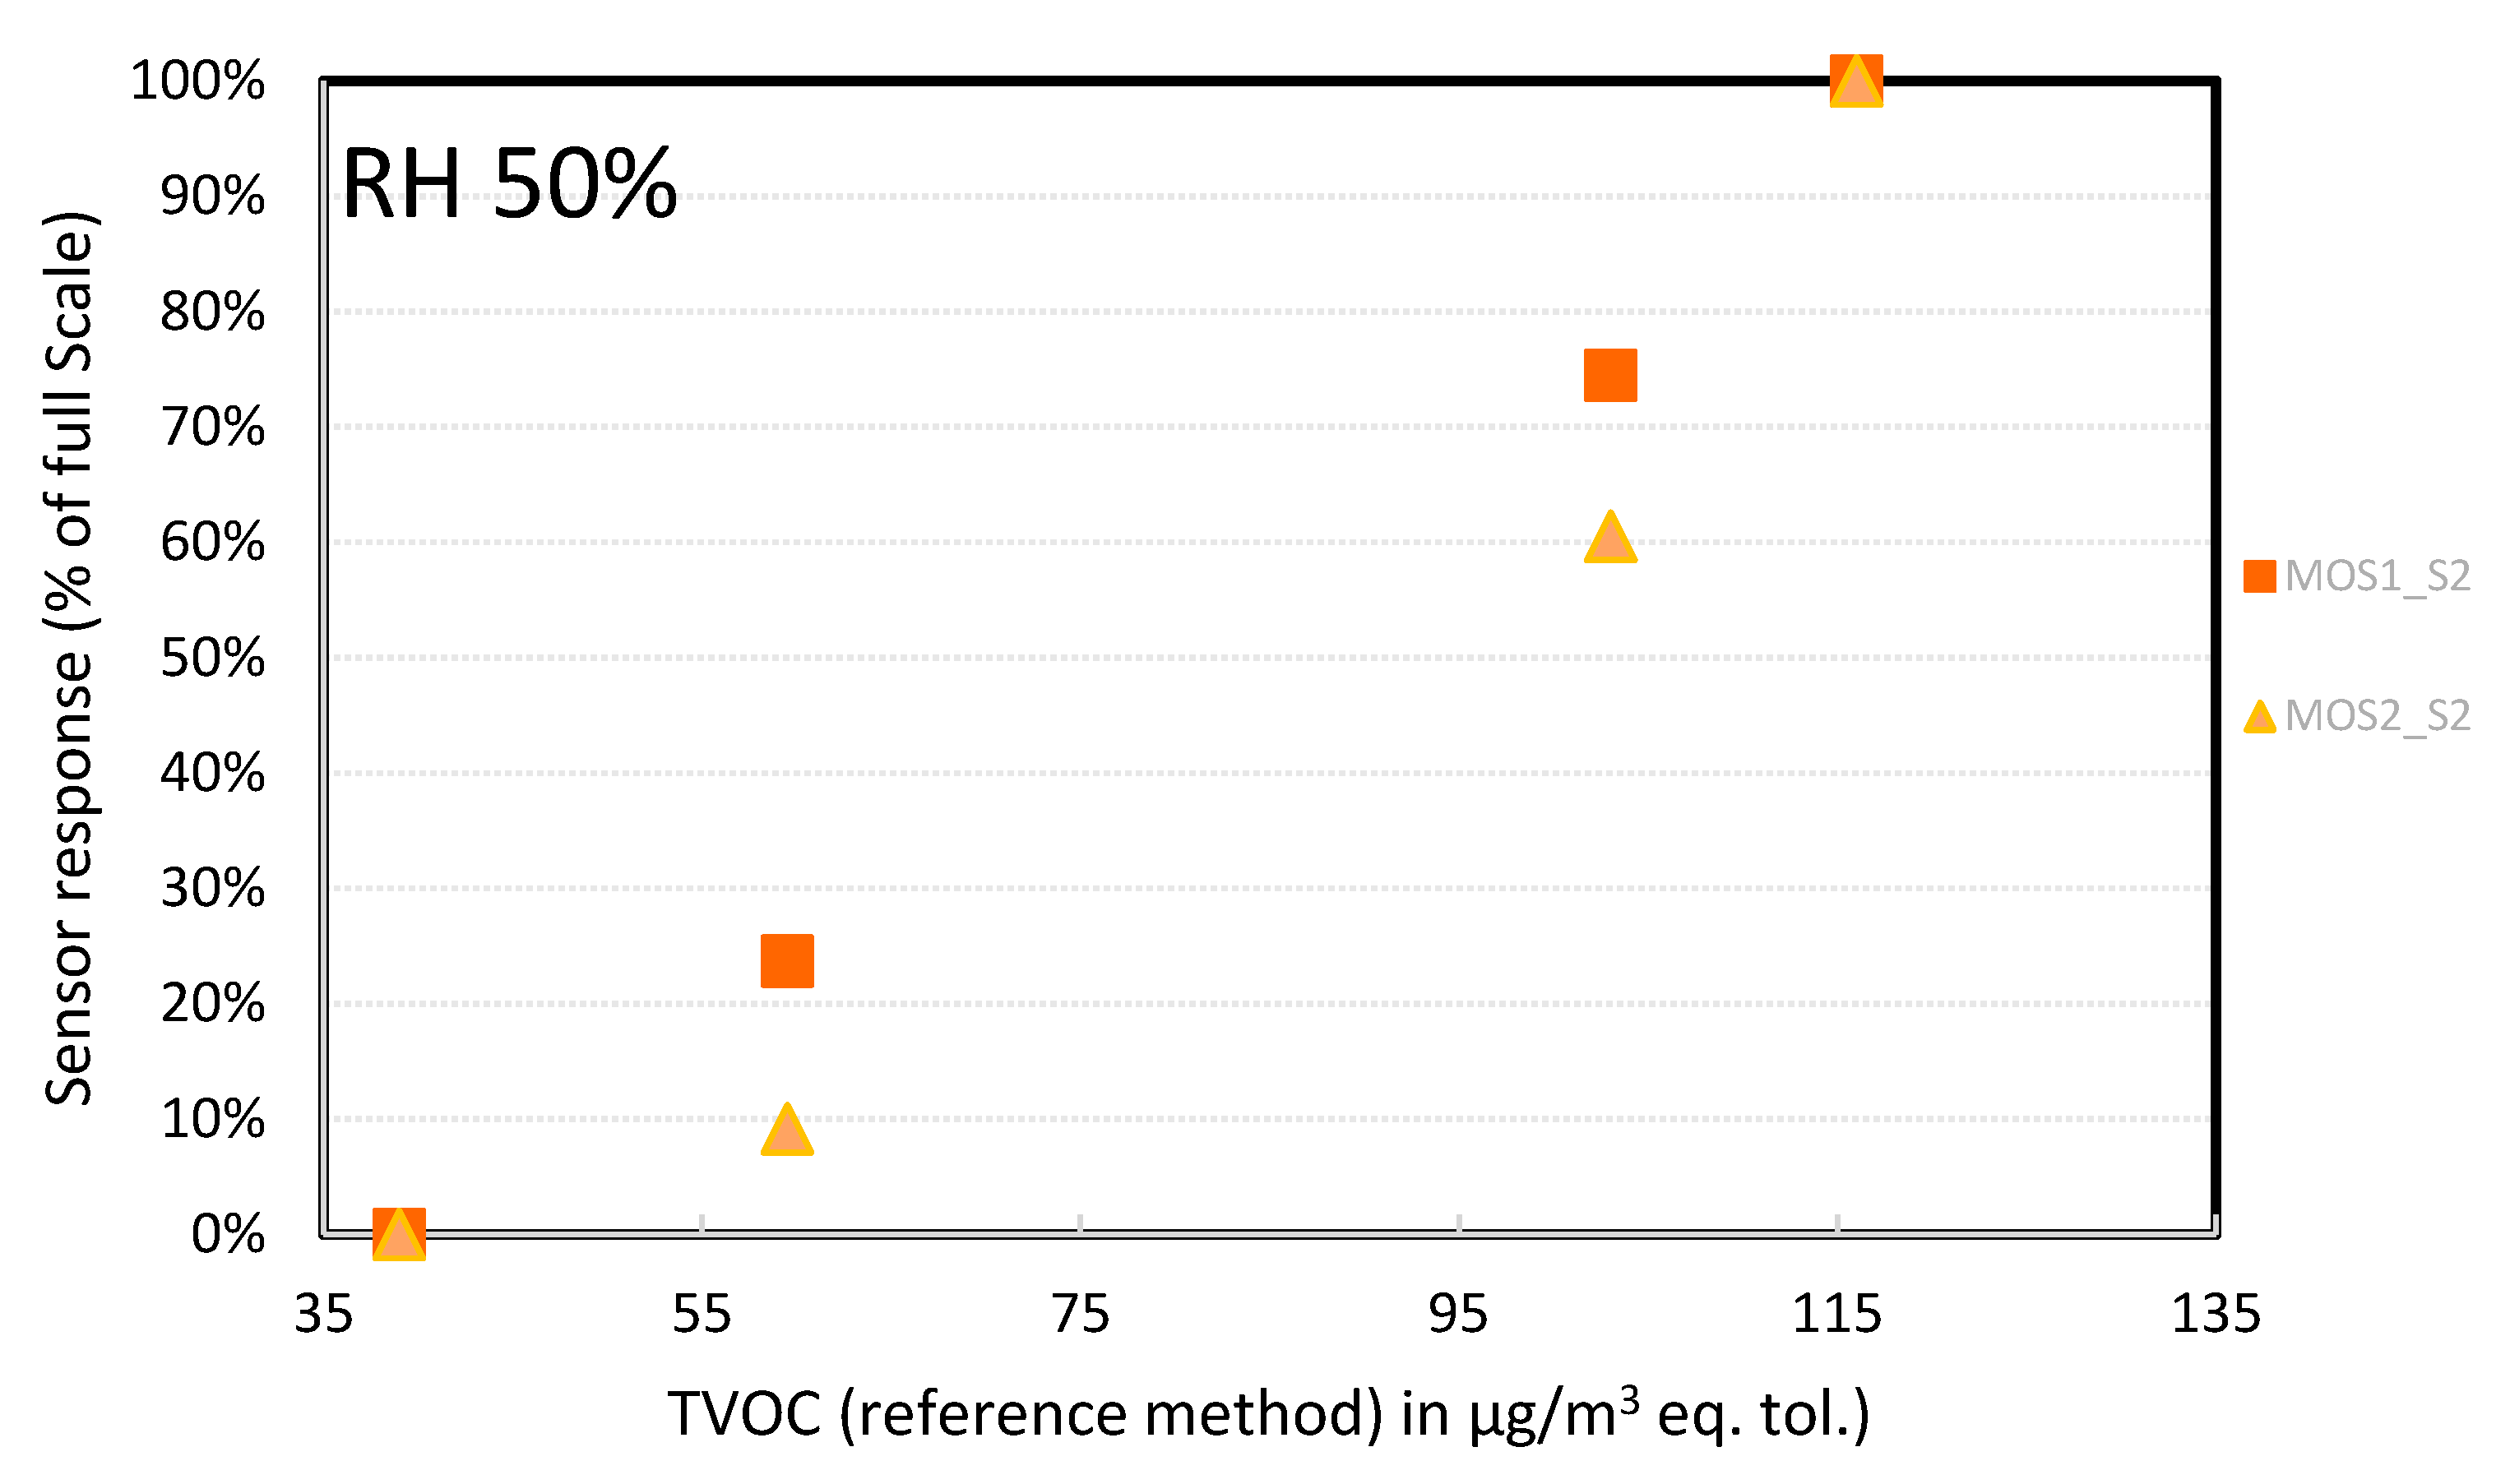
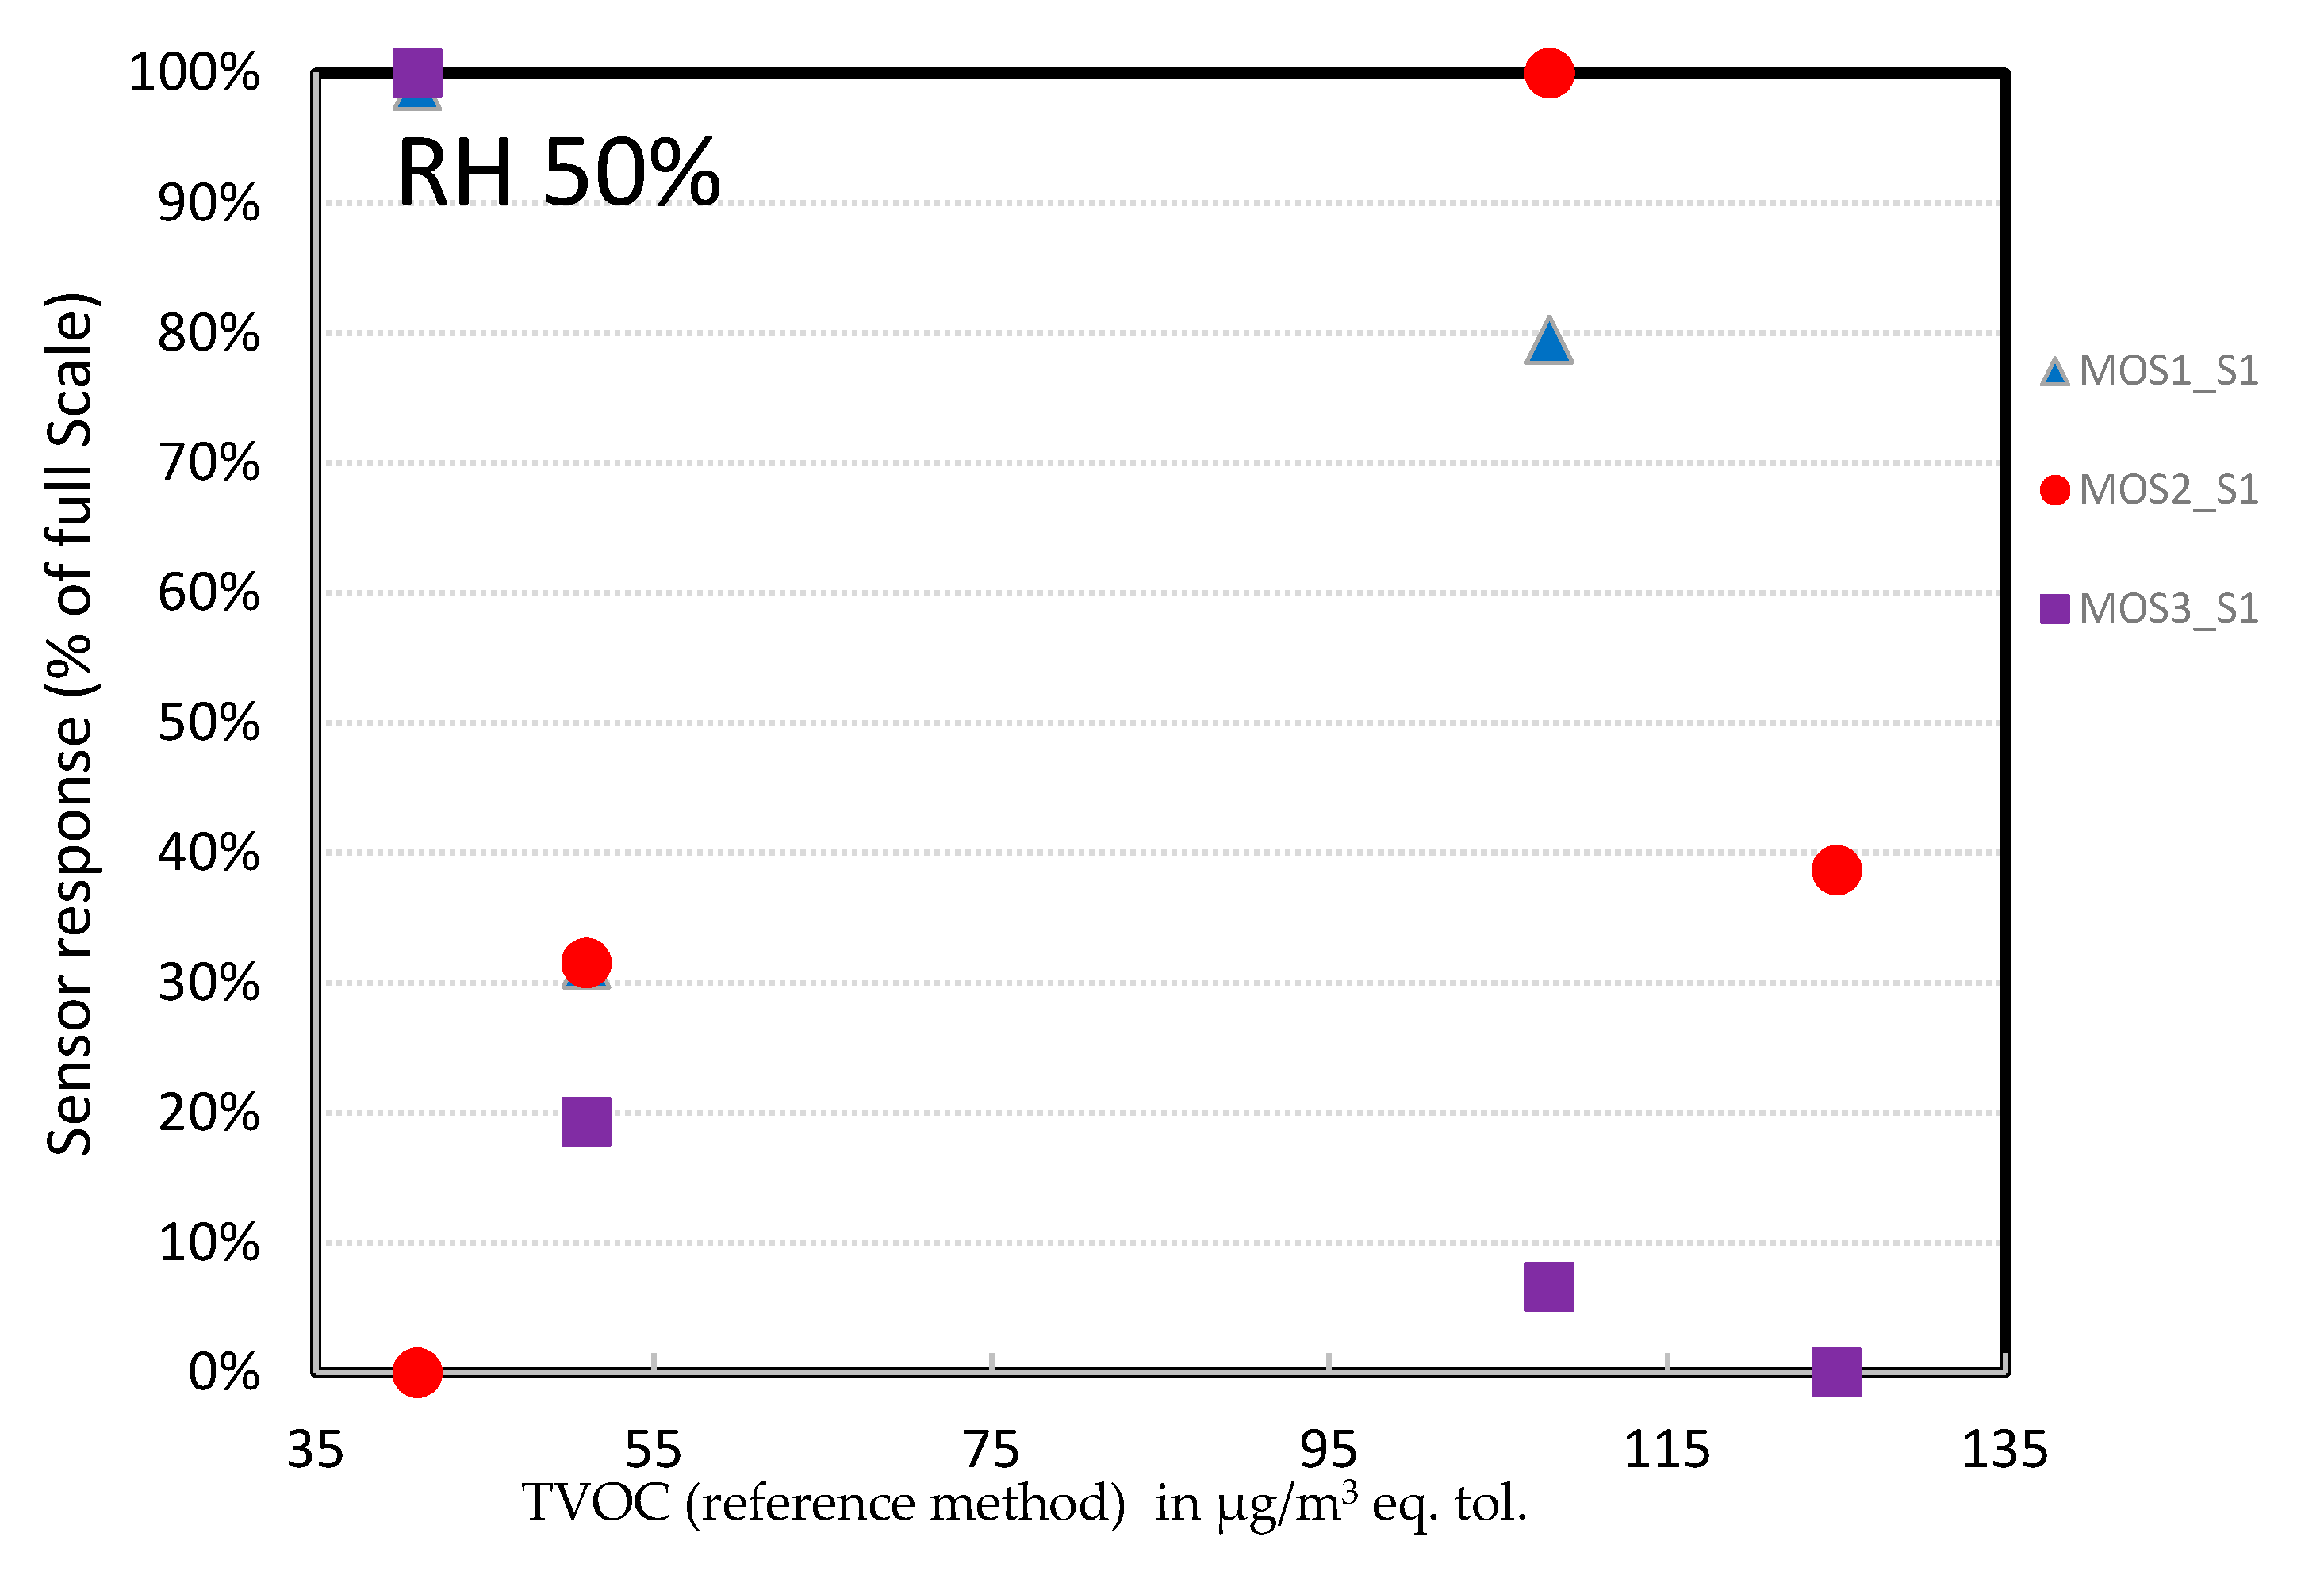
- ➢
- MOS sensors: At 50% RH, the MOSx_S2 devices showed linear behavior in the concentration range tested (Figure 17). However, the error bar at 60 µg/m3 was high (100%); for one of the two measurements the device hardly picked up a signal (1–2%). A possible explanation could be that the tests were performed close to their detection limit, as for the PID sensors. Additional testing should be carried out at higher TVOC concentrations. As for the MOSx_S1 devices (Figure 18), the behavior was not linear at all. Together with the scaling issue detailed before, we discarded these connected objects; they could not even be used for a qualitative analysis.
3.3. Overall Conclusion from Evaluation of TVOC Sensors
- PID technology: The tested devices gave TVOC concentrations close to the reference method, based on the scaling results. However, in the range of tested TVOC concentrations, the results were not linear. We think that we probably tested them in a range close to their detection limit. Further tests should be done at higher TVOC concentrations (200–1000 µg/m3 equivalent toluene). The impact of humidity should be further investigated. We know that PID sensors are more sensitive to humidity, which is a problem for hot and humid climates. During these trials, we did not collect enough data at 65% RH to present conclusive results in this paper.
- MOS technology: The results were very dependent on the sensor manufacturer. One series had to be discarded completely (MOSx_S2). For MOSx_S1, the response was linear, but should be confirmed at higher TVOC concentrations. The TVOC concentrations were overestimated, as their scaling factor was higher than 1. If their linearity was to be confirmed for a larger TVOC concentration range, they could be used for comparative analysis.
4. Discussion
- A sensitive element (i.e., the sensor) which is defined by a specific technology and which is the most important part is the first part. The signal delivered by this component is usually an electron or a photon. It is not always easy to obtain information on the sensor part from the manufacturer. A good sensitive element will be selective, sensitive enough, and robust. Robustness can be understood in different ways from mechanical robustness to the absence of maintenance or drift in the measured value in the long term.
- Integration of the sensitive element in an end-user product, which determines how the raw data are acquired and how to minimize noise, is the second part. This includes the hardware interface as well as possible drivers requested for the sensitive element to perform under the best conditions. It is also important to know if a calibration has been performed, how this calibration was carried out, and how often recalibration needs to happen.
- Data display, which is the way the raw values of the sensitive element are converted to pollution concentration values, accounting for possible cross-sensitivity via a compensation system, is the third part. The way data can be extracted is also important (e.g., API, or as a .csv file). Usually, for connected objects targeting the general public, the end user is not able to extract the raw data and obtain a comprehensive result through a mobile application.
- Connected objects targeting the general public, from which we might expect to obtain a good trend, without expecting too high an accuracy.
- Monitoring devices for professional users, from which we expect better accuracy, even if we do not expect to obtain the exact concentration as the reference method would give.
- ➢
- All connected objects targeting the general public must be excluded. Most of their manufacturers buy sensitive elements off-the-shelf; they are not experts on sensing technologies. Their added value is more in terms of their design and their mobile application interface; they may neglect some key steps in their integration. Indeed, we know that miniaturized sensors for formaldehyde detection are still difficult to find. There are new proprietary technologies under development, but in the meantime, the user should be very cautious when buying such objects.
- ➢
- For devices targeting professionals, we achieved promising results for formaldehyde detection using colorimetric technology. It is known that electrochemical technology is not as selective and has some issues regarding the detection limit at the ppb level. Still, for colorimetric devices, the acquisition time is recommended to be at least 30 min to obtain sufficient sensitivity. There are still some issues with very low concentrations (<20 ppb) which can be met in buildings. In addition, the sensing part of the device is consumable and needs to be replaced after a few days or a few weeks, has to be kept in a refrigerated environment, and has an expiration date (usually one year starting from the manufacturing date if kept refrigerated). If we consider these devices to be used by professionals, it may be difficult for them to manage these practical aspects. For the most promising device identified in our benchmark, our results showed that the formaldehyde concentration was always underestimated. A correction factor was determined to obtain the absolute concentration. This correction factor seems to depend on temperature and humidity. As for TVOC detection, we could not find a solution for our use cases, and we may have to test them at a higher range of TVOC concentrations. Our results suggest that their evaluation is even more complex as a large variety of units can be used by the manufacturer.
Supplementary Materials
Author Contributions
Funding
Acknowledgments
Conflicts of Interest
References
- World Health Organization (WHO). Indoor Air Quality: Organic Pollutants; EURO Reports and Studies No 111; WHO: Copenhagen, Denmark, 1980. [Google Scholar]
- ISO 16000-6:2011. Indoor Air—Part 6: Determination of Volatile Organic Compounds in Indoor and Test Chamber Air by Active Sampling on Tenax TA Sorbent, Thermal Desorption and Gas Chromatography Using MS or MS-FID; ISO Organization: Geneva, Switzerland, 2011. Available online: https://www.iso.org/home.html (accessed on 3 December 2019).
- ISO 16000-3:2011. Indoor Air—Part 3: Determination of Formaldehyde and Other Carbonyl Compounds in Indoor Air and Test Chamber Air—Active Sampling Method; ISO Organization: Geneva, Switzerland, 2011. Available online: https://www.iso.org/home.html (accessed on 3 December 2019).
- ISO 16000-4:2011. Indoor Air—Part 4: Determination of Formaldehyde—Diffusive Sampling Method; ISO Organization: Geneva, Switzerland, 2011. Available online: https://www.iso.org/home.html (accessed on 3 December 2019).
- Scientific Report by ANSES: Update of Guideline Indoor Air Values for Formaldehyde. February 2018. Available online: https://www.anses.fr/fr/system/files/AIR2017SA0041Ra.pdf (accessed on 2 February 2018).
- WHO Guidelines for Indoor Air Quality-Selected Pollutants. 2010. Available online: https://www.who.int/airpollution/guidelines/en/ (accessed on 3 December 2019).
- Abdul-Wahab, S.A.; En, S.C.F.; Elkamel, A.; Ahmadi, L.; Yetilmezsoy, K. A review of standards and guidelines set by international bodies for the parameters of indoor air quality. Atmos. Pollut. Res. 2015, 6, 751–767. [Google Scholar] [CrossRef]
- Heinzow, B.; Sagunski, H. Beurteilung von Innenraumluftkontaminationen mittels Referenz-und Richtwerten [Evaluation of indoor air contaminants based on reference and guide values]. Bundesgesundheitsblatt Gesundheitsforschung Gesundheitsschutz 2007, 50, 990–1005. [Google Scholar]
- Fromme, H.; Debiak, M.; Sagunski, H.; Röhl, C.; Kraft, M.; Kolossa-Gehring, M. The German approach to regulate indoor air contaminants. Int. J. Hyg. Environ. Health 2019, 222, 347–354. [Google Scholar] [CrossRef] [PubMed]
- ISO 16000-29:2014. Indoor Air—Part 29: Test Methods for VOC Detectors; ISO Organization: Geneva, Switzerland, 2014. [Google Scholar]
- Szulczyński, B.; Gębicki, J. Currently Commercially Available Chemical Sensors Employed for Detection of Volatile Organic Compounds in Outdoor and Indoor Air. Environment 2017, 4, 21. [Google Scholar] [CrossRef] [Green Version]
- Spinelle, L.; Gerboles, M.; Kok, G.; Persijn, S.; Sauerwald, T. Review of Portable and Low-cost Sensors for the Ambient Air Monitoring of Benzene and Other Volatile Organic Compounds. Sensors 2017, 17, 1520. [Google Scholar] [CrossRef] [PubMed] [Green Version]
- Kukkar, D.; Vellingiri, K.; Kaur, R.; Bhardwaj, S.K.; Deep, A.; Kim, K.H. Nanomaterials for sensing of formaldehyde in air: Principles, applications, and performance evaluation. Nano Res. 2019, 12, 25–246. [Google Scholar] [CrossRef]
- Leidinger, M.; Sauerwald, T.; Conrad, T.; Reimringer, W.; Ventura, G.; Schütze, A. Selective Detection of Hazardous Indoor VOCs Using Metal Oxide Gas Sensors. Procedia Eng. 2014, 87, 1449–1452. [Google Scholar] [CrossRef] [Green Version]
- SENSIndoor Project, Nanotechnology-based Intelligent Multi-SENsor SYSTEM with Selective Pre-Concentration for Indoor Air Quality Control. Available online: http://www.eunetair.it/cost/meetings/Brescia/01-PRESENTATIONS/01_TD1105_EUROSENSORS-2014/04_TD1105_EUROSENSORS-2014_Schuetze.pdf (accessed on 10 September 2014).
- Caron, A.; Redon, N.; Thevenet, F.; Hanoune, B.; Coddeville, P. Performances and limitations of electronic gas sensors to investigate an indoor air quality event. Build. Environ. 2016, 107, 19–28. [Google Scholar] [CrossRef]
- Air Quality Sensor Performance Evaluation Center (AQ-SPEC), SC-AQMD. Available online: http://www.aqmd.gov/aq-spec (accessed on 3 December 2019).
- MicroSensor Challenge, Airlab. Available online: http://www.airlab.solutions/fr (accessed on 3 December 2019).
- Bi, A.; Yang, S.; Liu, M.; Wang, X.; Liao, W.; Zeng, W. Fluorescent probes and materials for detecting formaldehyde: From laboratory to indoor for environmental and health monitoring. RSC Adv. 2017, 7, 36421. [Google Scholar] [CrossRef] [Green Version]
- Yurko, G.; Roostaei, J.; Dittrich, T.; Xu, L.; Ewing, M.; Zhang, Y.; Shreve, G. Shreve Real-Time Sensor Response Characteristics of 3 Commercial Metal Oxide Sensors for Detection of BTEX and Chlorinated Aliphatic Hydrocarbon Organic Vapors. Chemosensors 2019, 7, 40. [Google Scholar] [CrossRef] [Green Version]
- Lee, C.S.; Li, H.Y.; Kim, B.Y.; Jo, Y.M.; Byun, H.G.; Hwang, I.S.; Abdel-Hady, F.; Wazzan, A.A.; Lee, J.H. Discriminative detection of indoor volatile organic compounds using a sensor array based on pure and Fe-doped In2O3 nanofibers. Sens. Actuators B. Chem. 2019, 285, 193–200. [Google Scholar] [CrossRef]
- Nasriddinov, A.; Rumyantseva, M.; Marikutsa, A.; Gaskov, A.; Lee, J.H.; Kim, J.H.; Kim, J.Y.; Kim, S.S.; Kim, H.W. Sub-ppm Formaldehyde Detection by n-n TiO2@SnO2 Nanocomposites. Sensors 2019, 19, 3182. [Google Scholar] [CrossRef] [PubMed] [Green Version]


| Formaldehyde (HCOH) | TVOC (Expressed as Toluene Equivalent) | |
|---|---|---|
| Residential | 100 µg/m3 (short term, 30 min) | Five levels from <300 µg/m3 to >10–25 mg/m3 |
| Technology and Price Range | ||||
|---|---|---|---|---|
| Formaldehyde | TVOC | |||
| Colorimetry (C) | Electrochemical (EC) | MOS | PID | |
| 3 | 3 | 8 | 2 | |
| Connected objects for the general public (<500 €) | 2 | 4 | ||
| Monitoring devices for professional users (>500–5000 €) | 3 | 1 | 4 | 2 |
| Date | Time | Condition | HCHO (Chandrasekhar) | CorrectIon Factor | HCHO (Visvesvaraya) | CorrectIon Factor | ||
|---|---|---|---|---|---|---|---|---|
| DNPH (ppb) | Sensor (ppb) | DNPH (ppb) | Sensor (ppb) | |||||
| 16 February 2017 | 10:00 a.m. | HVAC on, with occupancy | 22.7 | 25.6 | 0.89 | 32 | 21.4 | 1,50 |
| 16 February 2017 | 6:20 p.m. | Daytime, during week | ||||||
| 16 February 2017 | 8:15 p.m. | HVAC off, no occupancy | 31.8 | 25.6 | 1.24 | 32 | 23 | 1.39 |
| 17 February 2017 | 8:30 a.m. | Overnight, during week | ||||||
| 17 February 2017 | 8:15 p.m. | HVAC off, no occupancy | 59.3 | 35.6 | 1.67 | 44.5 | 30 | 1.48 |
| 20 February 2017 | 9:15 a.m. | Over weekend | ||||||
| 23 February 2017 | 10:15 a.m. | HVAC on, room locked | 45 | 40.4 | 1.11 | 50.5 | 38 | 1.33 |
| 23 February 2017 | 6:40 p.m. | Daytime, during week | ||||||
| 23 February 2017 | 8:00 p.m. | HVAC off, room locked | 29 | 26.2 | 1.11 | 32.8 | 20 | 1.64 |
| 24 February 2017 | 8:20 a.m. | Overnight, during week | ||||||
| 24 February 2017 | 6:30 p.m. | HVAC off, room locked | 40.6 | 33.6 | 1.21 | 42 | 33.7 | 1.25 |
| 27 February 2017 | 9:00 a.m. | Over weekend | ||||||
| Technology and Price Range | ||
|---|---|---|
| MOS | PID | |
| Connected objects for the general public (<500 €) | MOS from supplier 1 MOS1_S1, MOS2_S1, MOS3_S1 | |
| Monitoring devices for professional users (>500–5000 €) | MOS from supplier 2 MOS1_S2, MOS2_S2 | Unknown PID supplier PID1, PID2 |
© 2020 by the authors. Licensee MDPI, Basel, Switzerland. This article is an open access article distributed under the terms and conditions of the Creative Commons Attribution (CC BY) license (http://creativecommons.org/licenses/by/4.0/).
Share and Cite
Goletto, V.; Mialon, G.; Faivre, T.; Wang, Y.; Lesieur, I.; Petigny, N.; Vijapurapu, S. Formaldehyde and Total VOC (TVOC) Commercial Low-Cost Monitoring Devices: From an Evaluation in Controlled Conditions to a Use Case Application in a Real Building. Chemosensors 2020, 8, 8. https://doi.org/10.3390/chemosensors8010008
Goletto V, Mialon G, Faivre T, Wang Y, Lesieur I, Petigny N, Vijapurapu S. Formaldehyde and Total VOC (TVOC) Commercial Low-Cost Monitoring Devices: From an Evaluation in Controlled Conditions to a Use Case Application in a Real Building. Chemosensors. 2020; 8(1):8. https://doi.org/10.3390/chemosensors8010008
Chicago/Turabian StyleGoletto, Valérie, Geneviève Mialon, Timothé Faivre, Ying Wang, Isabelle Lesieur, Nathalie Petigny, and SnehaSruthi Vijapurapu. 2020. "Formaldehyde and Total VOC (TVOC) Commercial Low-Cost Monitoring Devices: From an Evaluation in Controlled Conditions to a Use Case Application in a Real Building" Chemosensors 8, no. 1: 8. https://doi.org/10.3390/chemosensors8010008
APA StyleGoletto, V., Mialon, G., Faivre, T., Wang, Y., Lesieur, I., Petigny, N., & Vijapurapu, S. (2020). Formaldehyde and Total VOC (TVOC) Commercial Low-Cost Monitoring Devices: From an Evaluation in Controlled Conditions to a Use Case Application in a Real Building. Chemosensors, 8(1), 8. https://doi.org/10.3390/chemosensors8010008