Abstract
The impedance response of an electrochemical cell able to convert sunlight into electrical power is analyzed and discussed. Light conversion is due to a photosynthetic system known as reaction center, which is the core of photosynthesis in several living beings. Under illumination, an abrupt transformation drives the cell electrical response from insulator to conductor and a photocurrent is observed. The impedance spectrum shows a peculiar shape which significantly modifies after the protein activation. It has been analyzed by means of a graphical/analytical/numerical procedure. Some impedance graphical representations are indicated as the most appropriate to suggest the design of an equivalent electrical circuit. Then, the analytical expression of this circuit is formulated and used to set-up a custom Phyton code useful for fitting experimental data. Finally, an appropriate normalization procedure is proposed, which validates data in dark and light and can be useful as a fast screening of measurements.
1. Introduction
The increasing demand for renewable energy; the necessity of reducing greenhouse gas emissions; and in general, the desirable evolution toward a more sustainable lifestyle have addressed the attention of researchers towards the development of innovative energy conversion devices, based on sun, wind, and thermal energy. Many commercial photovoltaic devices based on inorganic semiconductors are available. On the other side, there is a growing interest in mimicking sunlight energy conversion occurring in the natural photosynthetic process, such as in the Grätzel cell [1]. More recently, photoactive proteins extracted from plants, bacteria, and archaea [2,3,4,5] have been tested with the aim of producing biological-based photoelectrochemical cells (bPECs). In particular, much interest is devoted to the reaction center (RC) isolated from the purple photosynthetic bacterium Rhodobacter sphaeroides, thanks to its simple extraction and purification procedure, stability outside its natural environment, and large possibility of genetic manipulation for mutant construction [6]. The RC is a transmembrane pigment–protein complex in which light absorption promotes a cascade of electron transfer reactions among its cofactors, leading to a charge-separated state with a free energy higher than that of the ground state. The primary donor is a dimer of bacteriochlorophyll molecules, while the final acceptor is a ubiquinone-10 molecule located in a specific pocket named QB. In vivo, this intra-protein charge-separation process is coupled with the electron transfer from periplasmic cytochrome c2 to lipid dispersed ubiquinone-10 molecules [7]. In RC-based devices, RC retains in vitro the ability to drive a photocycle which is analogue to that performed in vivo, taking shape as a golden standard for third generation solar cells. Although the processes that the protein activates in vivo are known in sufficient detail, the features of the operating mechanisms in the electrochemical cell have to be clarified. In fact, many factors dramatically influence the behavior of the device, depending on the different kind of assembly, as for example, the protein location, dissolved in the bulk [5] or immobilized on the working electrode (WE) [8,9,10]; the type of employed mediators, endogenous or exogenous [11]; the applied bias [12]; and so on.
Electrochemical measurements, although simple to carry out, may be tricky to interpret because the processes occurring in the electrochemical cell (EC) are complex. They involve diffusion, multiple chemical equilibria, electron exchange between solid electrodes and dissolved species, and so on. Even more puzzling is the case of an EC in which an active layer deposited on the WE promotes, upon external stimulus, a displacement of the concentrations of electroactive species from their redox equilibria. This is the case of the analyzed bPEC in which the WE is functionalized with a photosynthetic protein that, upon light excitation, promotes processes resulting in photocurrent generation. The physico-chemical contents of the underlying processes require many different techniques to complete the picture of the various processes involved in the electrochemical cell. Results are of interest for both basic and applied research, due to possibility of improving the device response [12]. The information that can be extracted by classical chronoamperometric or voltammetric measurements can be complemented with that coming from Electrochemical Impedance Spectroscopy (EIS), a powerful technique in electrochemistry. It measures the cell properties by using a small perturbation, modulated in a wide range of frequencies, around the applied bias that can be, in turn, varied in a suitable range [12]. EIS is hence useful to explore the electric and dielectric response when the system is tested with small perturbation at equilibrium [12].
In the present paper, we outline a procedure to interpret the impedance response of a bPEC, synergistically using graphical, analytical, and numerical investigations. The proposed theoretical modelling is tested against two independent datasets that, after a normalization procedure, result in agreement, ensuring that, in the explored bias range, the physico-chemical mechanisms of the process do not change, i.e., the device, particularly the protein substrate, is not altered during the measurement time.
2. Experiments
Reaction centers were extracted and purified from the carotenoidless strain R26 of the bacterium Rhodobacter sphaeroides as previously described [13], obtaining a 30 µM stock solution in Tris ((tris(hydroxymethyl)aminomethane)) 20 mM, EDTA (Ethylenediaminetetraacetic acid) 1 mM, LDAO (Lauryldimethylamine oxide) 0.03% pH 8.0, stored at −20 °C.
The bPEC is a three electrode EC made of screen printed electrodes (SPEs) DRP-550 (DropSens, Spain) with a Pt round-shaped WE of 0.12 cm2 surrounded by a Pt counter electrode (CE) and an Ag quasi-reference electrode (RE) whose potential has been estimated to be +210 mV vs NHE. The aqueous medium used for electrochemical measurements was potassium phosphate 90 mM, TX 0.03% v/v, pH 7.0, I = 0.2 (PB90T). The potentiostat was an Ivium Vertex One controlled by computer with the IviumSoft program. Modified SPEs were obtained by depositing PVA/RC films onto the Pt WE surface using two different procedures. In the first case, 9 µL of the RC stock solution were deposited and dried onto the WE and subsequently 9 µL of PVA 0.5% has been added and dried (modified SPEs 1). In the second case, a mixture of 9 µL RC stock +1 µL PVA 5% has been prepared; 3 µL of this solution were deposited and dried onto the WE; then, a second aliquot of 3 µL has been added and dried (modified SPEs 2). In both cases, the electron donor ferrocenemethanol (FcnMeOH) and the electron acceptor decylubiquinone (dQ) have been added in the solution to a final concentration of 300 µM and 100 µM, respectively, to drive the RC photocycle [7]. The bPEC response has been recorded in dark and under light exposure using a light emitting diode (LED) centered at 800 nm with full width at half maximum of 30 nm, providing a light intensity of 25 mW/cm2 at the surface of the WE. Illumination at 800 nm allows selective excitation of RC bacteriochlorophylls avoiding thermal and photo-oxidative stress effects. RC proteins were indeed extracted from a carotenoidless mutant bacterium, sensitive to excess of light in aerobic environment. Tandori et al.[14] EIS measurements were performed at controlled WE potential of 0.0, −25, −50, −75, and −100 mV vs the Ag quasi-RE with a modulation of 10 mV and frequency range 1– 100 KHz for the first electrode and 0.1–100 KHz for the second electrode. The largest light-dark difference in response is obtained at 0.0 mV applied bias, which corresponds to the measured open circuit potential (OCP) in the dark.
Data were collected using as WEs both modified SPEs 1 and modified SPEs 2 referred as Dataset 1 and Dataset 2, respectively. They lead to qualitatively similar, although quantitatively different impedance responses. Figure 1, Figure 2, Figure 3 and Figure 4 report the Datasets 1 and 2 in the Nyquist and Phase representation (symbols). The Nyquist plot is the drawing of the imaginary vs. the real part of impedance, and the Phase plot is the drawing of the impedance phase angle vs. the frequency. Lines come from simulations.
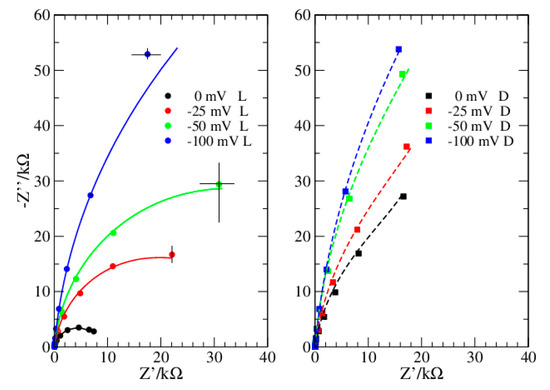
Figure 1.
Dataset 1. Data taken in light (circles) and dark (squares). Lines reproduce data from simulations.
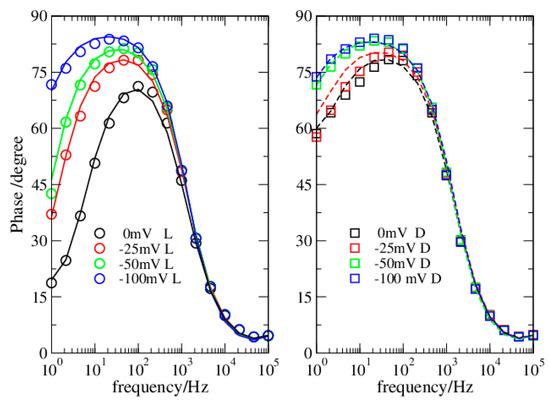
Figure 2.
Dataset 1. Data in light (circles) and dark (squares). Lines reproduce data from simulations.
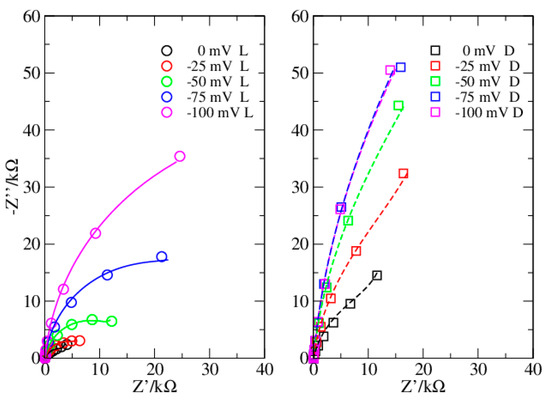
Figure 3.
Dataset 2. Data in light (circles) and dark (squares). Lines reproduce data from simulations.
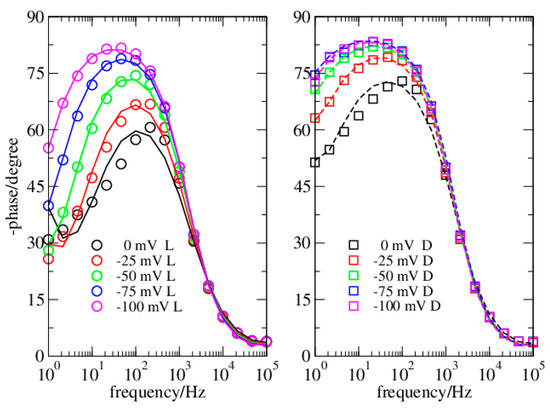
Figure 4.
Dataset 2. Data in dark (squares) and light (circles). Lines reproduce data from simulations.
3. Theory
The strategy we follow is based on the design of an equivalent electrical circuit (EEC) [15,16,17], which maps the electronic response into a minimal set of circuital elements. It successfully applies when the different characteristic times of each element have negligible overlaps. Although EEC is a very simplified description of the actual phenomena, it is quite powerful in data interpretation. The procedure develops in two steps, the first one, qualitative, is based on the graphical analysis of the impedance spectrum. It allows to identify the main elements of the EEC, associating them with different frequency ranges [15,17]. Once the EEC has been designed, the quantitative step is taken, calculating the best-fitting value of the circuit elements. Finally, the main phenomena inside the electrochemical cell are pulled off these values. Analyses performed under different bias and illumination conditions help to produce a complete model of the physico-chemical mechanism underlying the impedance response.
3.1. Graphical Analysis
As widely shown in the literature [15], in the simplest cases, the graphical features of the Nyquist and Phase plots may suggest a good estimate of the EEC parameters [15,17].
In the present investigation, the Nyquist plots appear different when obtained in dark or in light (Figure 1 and Figure 3), thus suggesting a different modelling for the two conditions. Instead, the Phase plots ensure this is not the case (Figure 2 and Figure 4). Specifically, in light, the Nyquist plots are arcs while in dark they tend to a linear shape. On the other side, the Phase plots have a very similar shape both in dark and light, the major differences are at the OCP, and reduce considerably at more negative bias. The analyzed Phase plots appear like bell-shaped curves, which suggest a Voigt element as the main term [16]. The maximum of the curve, which roughly determines the Voigt characteristic time, is in the middle of the intermediate frequency range of the bPEC. At high frequencies, the phase angle reaches the frequency axis, thus revealing a solution impedance element. Finally, at low frequencies, the curve shows a puzzling shape that strongly depends both on the applied bias and on the illumination conditions. Specifically, it remains far from zero, and its absolute value becomes larger by increasing the bias. In light, this deviation from the ideal case is milder. This behavior has been attributed to a capacitor [17], which pushes the phase angle toward 90°.
3.2. The EEC
The suitable EEC is displayed in Figure 5 and contains a quite standard arrangement, made of three elements: a solution impedance ZS and a Voigt circuit, both in series with a capacitor, CDL. This latter term is the most distinctive one of this EEC and takes into account the differences between dark and light: if small (dark), it produces quite a linear Nyquist plot, otherwise, when large (light), it allows the semicircular shape to emerge. In Figure 5, the Nyquist plot of the EEC is drawn for decreasing values of CDL, from CDL = C to CDL = 0.001 C, with C being the capacitor of the Voigt element.
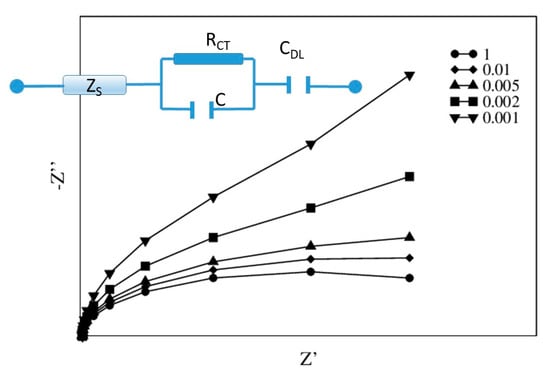
Figure 5.
The proposed EEC and the expected Nyquist plot for CDL = C, 0.01C, 0.005C, 0.002C, 0.001C.
Each of the three EEC elements is associated with a specific conduction term, relevant in a specific frequency range. In the high frequency (HF) range, the response is dominated by the solution parameters, i.e., the impedance (ZS), in which the resistance RS is in parallel with the capacitor CS. It mimics the charge transport and the polarization inside the solution, mainly due to the supporting electrolytes. Although in many cases the resistance alone is used to describe this impedance contribution, in present analysis, the polarization is detectable, although tiny. Since both RS and CS are small, the impedance characteristic time is also small and corresponds to a high value of the characteristic frequency. In the intermediate frequencies, the Voigt element describes the electronic conduction inside the electrode and the ability of the redox couple to drain electrons. Electrons are transferred from the Pt electrode to the redox couple within the PVA-RC films, characterized by two different protein distributions. In particular, modified SPEs 1 (Dataset1) present a sandwich structure where RC proteins are layered between the Pt surface and the PVA film. In modified SPEs 2 (Dataset2), RC proteins are randomly distributed within the PVA matrix, adhering to the Pt electrode. Overall, modified SPEs 1 contain 30% more RC than modified SPEs 2. The conductive properties of these two typologies of modified electrodes are expected to be different and to change in light. As a matter of fact, while Pt and PVA are poorly affected by visible light, under illumination RC promotes an electron flow from FcnMeOH to dQ, altering the redox equilibria of these dissolved species. In the applied bias conditions, electrons eventually flow towards the oxidized species FcnMeOH+ generated by the photoexcitation of RC, i.e., the conduction at the interface electrode/solution varies with the amount of FcnMeOH+. Current does not depend linearly on the applied bias, but it is governed by Nernst’s law [18]. In other words, making the bias more negative, the amount of FcnMeOH+ reduces and RCT grows, therefore the current tends to an asymptotic value, which depends on the initial concentration of FcnMeOH. Despite being so complex, this sequence of events happens in cascade, and a single resistance RCT may be a sufficient description.
To account for the dielectric aspects, the capacitor C is put in parallel with RCT. In most cases, as in the present analysis, deviations from the ideal response are detected and therefore the circuit element describing the polarization is mapped into a constant phase element ZCPE. Mathematically, it is obtained by introducing a phase, α, in the standard capacitor impedance:
where r is the ZCPE resistance, here RCT, τ the characteristic time, and τ/r is the associated capacitor, C.
Basically, a Voigt element made of a ZCPE instead of a simple capacitor, distributes part of the impedance in the dissipative term so reducing the reactance. In other terms, it describes a system more entropic than the ideal one, i.e., α = 1. Sometimes, α < 1 is used to describe a condition in which many characteristic times are present: When they are very close, they can interfere, thus enhancing the entropic part. A similar behavior has been observed when electrodes with a significant porosity are involved, in which each pore contributes to the impedance with a different time [19]. The corresponding Nyquist plot deviates from ideal semicircle, showing a flattening. This is in agreement with the platinum screen-printed electrode surface roughness (based on platinum ink) and characterized by a porosity at sub-micrometric scale [20,21].
Finally, the capacitive impedance, r/jω also accounts for the redox couple. Specifically, in dark, the amount of FcnMeOH around the WE is so high that it reduces the electronic conduction, allowing only a small current leakage. In light, the current leakage increases. The elementary capacitor CDL, when interpreted as a parallel plate element, enables a simple picture of the phenomenon: FcnMeOH forms a layer of size L around the WE and the larger the L, the smaller the CDL. In dark and for more negative bias values, L grows and CDL decreases. This element adds a pure imaginary term to the total impedance, becoming even more relevant at decreasing frequencies, f < 1/2πσ (see Figure 5).
It is noteworthy that the choice of a specific EEC is often not unique and even more complex circuits can be designed to describe in even more details the impedance response [22]. On the other side, our approach is based on the selection the simplest EEC, i.e., on the best compromise between the smallest number of parameters and the most effective description. Nyquist and Phase plots give a cross-check of the model and the parameters.
3.3. The Custom-Fit Software
The optimal value of the EEC parameters has been determined by a custom Python code that minimizes a suitable χ2 function, measuring the deviation from the experimental complex-valued impedance. In particular, we exploited the least squares function in the optimize module of the Python-based open-source SciPy library [23]. We remark that the EEC parameters appear in the theoretical expression of the complex impedance in a non-linear way.
The values of the circuital elements are reported in Table 1 and Table 2 for Datasets 1 and 2, respectively.

Table 1.
EEC parameters for Dataset 1. Nominal impedance solution is less than 63 Ω.
Table 2.
EEC parameters for Dataset 2. Nominal impedance solution is less than 60 Ω.
Dataset 1 shows values of RCT and C larger than dataset 2, in each experimental condition. The value of the solution impedance is practically the same for both datasets. The “roughness” parameter, α, appears smaller for the dataset 2, mainly at the OCP. This suggests that the samples used for dataset 2 were more porous than samples of dataset 1. Making the bias more negative, α tends to 1 for both datasets, i.e., the role of the specific functionalization becomes less relevant. In both cases, at growing values of the applied bias, the impedance response in light becomes even more similar to that measured in dark. The EEC values for each dataset are reported in Table 1 and Table 2.
3.4. Analytical vs. Computational Procedure
Table 1 and Table 2 summarize the results of the data analysis performed with a best-fitting software. Nevertheless, as we have highlighted in a previous paper [17], even the best software needs an analytical control. This is particularly true when the number of parameters is high; the experimental errors are relevant; and in general, the system is so complex that several solutions are allowed. Multiple possible choices of the fitting parameter give apparently similar results, often with comparable confidence levels. A visual inspection of Nyquist and Phase plot can help in selecting the best one but is not sufficient. In general, this is due to the very wide frequency range, so different least-square solutions can be found by privileging different frequency ranges.
A tool that is always helpful to test the quality of results is the comparison with a benchmark. In more simple cases, when a single Voigt element is sufficient to describe the data [17,24], a normalization procedure is adopted to standardize the device response. The normalization factor is the impedance evaluated at the frequency f = 1/(2πτ); then, the normalized variables are , , being . In such a way, the curves obtained with different values of the Voigt parameters collapse into a single arc of radius ½.
In the present case, neglecting the HF impedance, the impedance is described by [17]:
Therefore, for f = 1/(2πτ), the real and imaginary parts are different and read:
The enhancement factor ε (see Table 1 and Table 2) is close to 1 in light and close to 2 in dark and grows when the applied bias becomes more negative. For ε = 1, the single Voigt circuit response is reproduced (ideal condition), while values less than 1 give a flattened Voigt circuit (with a ZCPE element). It is noteworthy that the ideal condition is achieved as the combination of two competitive effects: a suppression due to the electrode roughness (α), which increases the dissipative term (RCT) compared to the energy storage term, and the enhancement due to the capacitor CDL, which restores the energy storage. On the other side, when the storage term overcomes the dissipative term, electron transport is inhibited. The normalized Nyquist plots for both datasets are now obtained by using Equation (4) and are reported in Figure 6 and Figure 7.
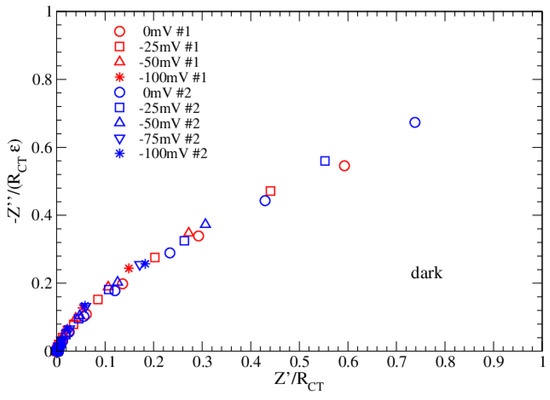
Figure 6.
Normalized Nyquist plots in dark for Datasets 1 and 2.
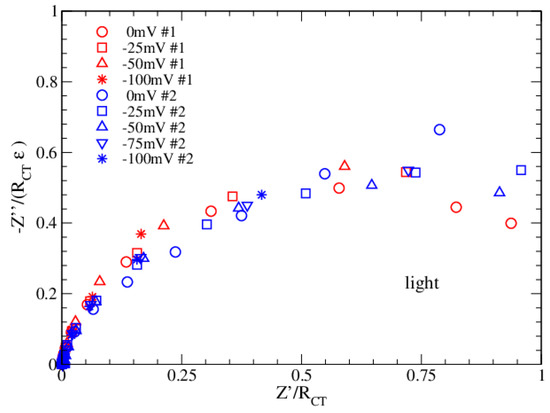
Figure 7.
Normalized Nyquist plots in light for Datasets 1 and 2.
Figure 6 and Figure 7 confirm that the proposed EEC correctly describes the impedance of the bPEC in each possible condition of bias and functionalization. The ε parameter, entering the normalization of the vertical axis, plays an important role in the universal data collapse. From this perspective, it can be used to discriminate among different fitting solutions. Furthermore, comparing the results in dark and light, it emerges that measurements in light are more critical at low frequencies (1–2 points), and this is probably due to a thermal effect related to the long-time exposure.
4. Conclusions
In this paper, we have discussed the impedance spectroscopy data of a bio-based photovoltaic device, using a graphical/analytical/numerical procedure. The device is very sensitive to light and gives the best performances under an applied potential equal to the OCP of the cell measured in the dark. The modelling is performed by means of a non-standard equivalent electrical circuit, simulated by using an open-source code. Here we apply this technique to two series of measurements, both performed in light and dark, using different bias values. The Datasets refer to quite different functionalizations of the working electrode. A capacitor, CDL, in series with the rest of the EEC, well describes the transition from an insulator-like to a conductor-like behavior: The larger the value of CDL, the better the conduction, i.e., the smaller the frequency at which the circuit opens. The value of CDL grows with the concentration of the oxidized specie of the redox couple. A suitable normalization procedure is introduced that shows that both datasets reflect the same phenomenon, with illumination promoting the system from insulator to conductor.
The described modelling is rather simple to implement, and the normalization procedure that we proposed confirms our interpretation and can be used to standardize data and identify errors in measurements.
Author Contributions
Conceptualization E.A., F.M., L.G., M.R.G.; methodology E.A.; software M.B.; resources M.T.; investigation F.M., L.G., M.R.G.; visualization R.C.; writing, review and editing E.A., F.M., M.B., R.C., L.G., M.T., M.R.G. All authors have read and agreed to the published version of the manuscript.
Funding
This research received no external funding.
Acknowledgments
This research was supported in part by the Italian Ministry of Education, University and Research (MIUR) with the grant Project FFABR 2017.
Conflicts of Interest
The authors declare no conflict of interest.
References
- O’Regan, B.; Grätzel, M. A low-cost, high-efficiency solar cell based on dye-sensitized colloidal TiO2 films. Nature 1991, 353, 737. [Google Scholar] [CrossRef]
- Alfinito, E.; Pousset, J.; Reggiani, L.; Lee, K. Photoreceptors for a light biotransducer: a comparative study of the electrical responses of two (type-1) opsins. Nanotechnology 2013, 24, 395501. [Google Scholar] [CrossRef] [PubMed]
- Alfinito, E.; Reggiani, L. Mechanisms responsible for the photocurrent in bacteriorhodopsin. Phys. Rev. E 2015, 91, 032702. [Google Scholar] [CrossRef] [PubMed]
- Białek, R.; Swainsbury, D.J.; Wiesner, M.; Jones, M.R.; Gibasiewicz, K. Modelling of the cathodic and anodic photocurrents from Rhodobacter sphaeroides reaction centres immobilized on titanium dioxide. Photosynth. Res. 2018, 138, 103–114. [Google Scholar] [CrossRef] [PubMed]
- Milano, F.; Ciriaco, F.; Trotta, M.; Chirizzi, D.; De Leo, V.; Agostiano, A.; Valli, L.; Giotta, L.; Guascito, M.R. Design and modelling of a photo-electrochemical transduction system based on solubilized photosynthetic reaction centres. Electrochim. Acta 2019, 293, 105–115. [Google Scholar] [CrossRef]
- Espiritu, E.; Chamberlain, K.D.; Williams, J.C.; Allen, J.P. Bound manganese oxides capable of reducing the bacteriochlorophyll dimer of modified reaction centers from Rhodobacter sphaeroides. Photosynth. Res. 2019, 143, 129–141. [Google Scholar] [CrossRef] [PubMed]
- Milano, F.; Gerencsér, L.; Agostiano, A.; Nagy, L.; Trotta, M.; Maróti, P. Mechanism of Quinol Oxidation by Ferricenium Produced by Light Excitation in Reaction Centers of Photosynthetic Bacteria. J. Phys. Chem. B 2007, 111, 4261–4270. [Google Scholar] [CrossRef] [PubMed]
- Chatzipetrou, M.; Milano, F.; Giotta, L.; Chirizzi, D.; Trotta, M.; Massaouti, M.; Guascito, M.R.; Zergioti, I. Functionalization of gold screen printed electrodes with bacterial photosynthetic reaction centers by laser printing technology for mediatorless herbicide biosensing. Elettrochem. Commun. 2016, 64, 46–50. [Google Scholar] [CrossRef]
- Ravi, S.K.; Tan, S.C. Progress and perspectives in exploiting photosynthetic biomolecules for solar energy harnessing. Energy Environ. Sci. 2015, 8, 2551–2573. [Google Scholar] [CrossRef]
- Kamran, M.; Delgado, J.D.; Friebe, V.; Aartsma, T.J.; Frese, R.N. Photosynthetic protein complexes as bio-photovoltaic building blocks retaining a high internal quantum efficiency. Biomacromolecules 2014, 15, 2833–2838. [Google Scholar] [CrossRef] [PubMed]
- Friebe, V.M.; Millo, D.; Swainsbury, D.J.K.; Jones, M.R.; Frese, R.N. Cytochrome c provides an electron-funneling antenna for efficient photocurrent generation in a reaction center biophotocathode. ACS Appl. Mater. Interfaces 2017, 9, 23379–23388. [Google Scholar] [CrossRef] [PubMed]
- Milano, F.; Giotta, L.; Cataldo, R.; Carlino, A.; Cotardo, E.; De Bartolomeo, A.R.; Guascito, M.R.; Trotta, M.; Alfinito, E. A screen-printed photo-responsive electrochemical cell based on polyvinyl alcohol-entrapped photosynthetic reaction center proteins. in preparation.
- De Leo, V.; Catucci, L.; Falqui, A.; Marotta, R.; Striccoli, M.; Agostiano, A.; Comparelli, R.; Milano, F. Hybrid Assemblies of Fluorescent Nanocrystals and Membrane Proteins in Liposomes. Langmuir 2014, 30, 1599–1608. [Google Scholar] [CrossRef]
- Tandori, J.; Hideg, É.; Nagy, L.; Maróti, P.; Vass, I. Photoinhibition of carotenoidless reaction centers from Rhodobacter sphaeroides by visible light. Effects on protein structure and electron transport. Photosynth. Res. 2001, 70, 175–184. [Google Scholar]
- Orazem, M.E.; Tribollet, B. Electrochemical impedance spectroscopy; John Wiley & Sons: Hoboken, NJ, USA, 2011. [Google Scholar]
- Sacco, A. Electrochemical impedance spectroscopy: Fundamentals and application in dye-sensitized solar cells. Renew. Sustainable Energy Rev. 2017, 79, 814–829. [Google Scholar] [CrossRef]
- Guascito, M.R.; Alfinito, E.; Cataldo, R.; Giotta, L. Tips for a (simple) interpretation of the impedance response of an electrochemical cell. IEEE Sens. J. 2019, 19, 11318–11322. [Google Scholar] [CrossRef]
- Bard, A.J.; Faulkner, L. Electrochemical Methods: Fundamentals and Applications, 2nd ed.; John Wiley & Sons: Hoboken, NJ, USA, 2000. [Google Scholar]
- Huang, J. Diffusion impedance of electroactive materials, electrolytic solutions and porous electrodes: Warburg impedance and beyond. Electrochim. Acta 2018, 281, 170–188. [Google Scholar] [CrossRef]
- Milano, F.; Giotta, L.; Chirizzi, D.; Papazoglou, S.; Kryou, C.; De Bartolomeo, A.; De Leo, V.; Guascito, M.R.; Zergioti, I. Phosphate Modified Screen Printed Electrodes by LIFT Treatment for Glucose Detection. Biosensors 2018, 8, 91. [Google Scholar] [CrossRef] [PubMed]
- Dropsens.com. Available online: http://www.dropsens.com/en/pdfs_productos/new_brochures/550_c550.pdfrif (accessed on 28 February 2020).
- Ramanavicius, A.; Genys, P.; Ramanaviciene, A. Electrochemical impedance spectroscopy based evaluation of 1, 10-phenanthroline-5, 6-dione and glucose oxidase modified graphite electrode. Electrochim. Acta 2014, 146, 659–665. [Google Scholar] [CrossRef]
- SciPy.org. Available online: https://scipy.org (accessed on 21 January 2020).
- Alfinito, E.; Pousset, J.; Reggiani, L. Proteotronics: Development of Protein-Based Electronics; Pan Stanford Publishing: Danvers, MA, USA, 2015. [Google Scholar]
© 2020 by the authors. Licensee MDPI, Basel, Switzerland. This article is an open access article distributed under the terms and conditions of the Creative Commons Attribution (CC BY) license (http://creativecommons.org/licenses/by/4.0/).