1. Introduction
In recent years, there has been some concern regarding environmental contaminants as endocrine disruptor compounds (EDCs). These deregulators have shown adverse effects on the endocrine system of humans and other animals, affecting the health, growth, and reproduction of these species, and further, may act as inducers of cancer [
1,
2,
3]. EDCs encompass countless chemical groups among which are steroid estrogens of both natural and synthetic origin [
4]. Belonging to the class of the EDCs, 17α-ethinyl estradiol (EE) (
Figure 1) is a synthetic estrogen widely used as an oral contraceptive and is considered a powerful estrogenic [
5].
However, EE can cause adverse effects such as accelerated coagulation and fibrinolysis. In addition, the use of combined hormonal contraceptives has shown to be associated with an increased risk of venous thrombosis according to estrogen concentration [
6]. The EE is a pharmaceutically active compound that is inserted into aquatic environments through human and animal excretion [
7]. These residues into the environment can induce severe effects for humans and biota [
8]. Therefore, the determination of EE both in pharmaceutical formulations and in environmental samples is relevant.
There are several analytical methods for the determination of EE in a variety of sample matrices involved such as surface water, underground water, waste water, pharmaceutical formulations, and biological fluid [
9], usually employing chromatographic techniques such as gas chromatography (GC) and high performance liquid chromatography (HPLC) [
10,
11,
12,
13]. Electrochemical sensors have also been widely applied in the determination of EE [
8]. The characteristics of electrochemical techniques as low detection limits as well as its low acquisition costs made them widely applied in the various fields [
9].
Nunes et al. [
14] developed and validated a screening tool for detecting EE in water. EE detection was carried out using differential pulse adsorptive cathodic stripping voltammetry (DPAdCSV) with a hanging mercury drop electrode (HMDE). The method was applied to the detection of EE in water samples with recoveries ranging from 93.7% to 102.5%.
Pavinatto el al. [
5] developed a new nanostructured sensing platform aimed at the electrochemical detection of EE. The platform was based on a fluorine doped tin oxide (FTO) electrode coated with nanostructured layer-by-layer (LbL) films of chitosan/multi-walled carbon nanotubes (Chi/CNTs). The sensor showed a linear response for EE detection in the range of 0.05–20 μmol L
−1 with a detection limit of 0.09 μmol L
−1.
Electrochemical sensors have versatility and can be prepared from materials that provide higher reactivity and selectivity. Among the materials used for the modification of the electrode surface, carbon nanotubes (CNTs), mainly multiwalled carbon nanotubes (MWCNTs), have been widely used. The carbon nanotubes possess attractive features due to their porous and large surface area, excellent electrical conductivity, chemical stability, interfacial adsorption properties, electrocatalytic activity, and excellent mechanical properties [
15].
Metalloporphyrins also offer interesting opportunities for the development of chemical sensors. These molecules may change the sensor selectivity toward desired analyte [
16]. Additionally, metalloporphyrins have been extensively employed for electrode surface modifications due to their outstanding electrocatalytic properties [
17].
In this work, we developed an electrochemical sensor based on a glassy carbon electrode (GCE) modified with multiwalled carbon nanotubes (MWCNTs) and cobalt phthalocyanine (CoPc) for the determination of 17α-ethinyl estradiol (EE) in samples of pharmaceutical formulations, river water, and milk.
2. Materials and Methods
2.1. Chemicals and Materials
Phosphoric acid was purchased from Qhemis® (Indaiatuba, SP, Brazil), boric acid purchased from Labsynth® (Diadema, SP, Brazil), acetic acid purchased from Labsynth® (Diadema, SP, Brazil), hydrochloric acid purchased from Vetec Química Fina® (Industrial District of Duque de Caxias, RJ, Brazil), sodium hydroxide purchased from Sigma Aldrich® (St. Louis, MO, USA), sodium phosphate bibasic heptahydrate (Na2HPO4·7H2O) purchased from Synth® (Diadema, SP, Brazil), monobasic sodium phosphate monohydrate (NaH2PO4·H2O) purchased from Synth® (Diadema, SP, Brazil), and pure powder graphite was purchased from Synth® (Diadema, SP, Brazil). Multiwalled carbon nanotubes (MWCNTs)—of 99% purity, 6–13 nm in diameter and 2.5–20 μm in length—were purchased from Nanocyl® (Auvelais, Belgium), reduced graphene oxide synthesized by the Polymer and Electroanalytical Research Group (GPPE, UFSJ, São João Del-Rei, MG, Brazil), dimethylformamide (DMF) purchased from F.MAIA Indústria e Comércio Ltd. (Cotia, SP, Brazil), methanol purchased from J.T.Baker® (Mexico), suspension of alumina (Al2O3) with particles of 0.3 μm purchased from Fortel® (São Paulo, SP, Brazil), and 17α-ethynylestradiol was purchased from Sigma Aldrich® (St. Louis, MO, USA). Iron (III) Phthalocyanine was purchased from Sigma Aldrich (St. Louis, MO, USA), manganese (III) phthalocyanine purchased from Sigma Aldrich (St. Louis, MO, USA), and cobalt (II) phthalocyanine purchased from Sigma Aldrich® (St. Louis, MO, USA). Hydroxymethyl aminomethane (Trizma) was purchased from Sigma Aldrich® (St. Louis, MO, USA), 1,4-piperazinadietanesulfonic acid (Pipes) purchased from Sigma Aldrich® (St. Louis (MO, USA), 4-(2-hydroxyethyl) piperazine-1-ethanesulfonic acid (Hepes) purchased from Sigma Aldrich® (St.Louis, MO, USA), estrone purchased from Sigma Aldrich® (St. Louis, MO, USA), and 17β-Estradiol was obtained from the United States Pharmacopeia (USP).
All chemical reagents were of analytical grade and solutions prepared in distilled and deionized water (resistivity > 18 MΩ cm−1, 25 °C; purification system Milli-Q® Millipore, Bedford, MA, USA).
2.2. Instrumentation
The electrochemical measurements were performed with a Multi Autolab Potentiostat/Galvanostat model PGSTAT101 Ecochemie coupled to a microcomputer containing Nova 1.11 software. A conventional three-electrode system was used. A modified glassy carbon electrode (GCE) was used as the working electrode. A platinum wire was employed as the counter electrode and Ag/AgCl electrode served as the reference electrode. Prior to each experiment, the solutions analyzed were degassed by bubbling N2 for about 15 min.
The final pH of the buffer solutions was determined by means of a Tecnal pH-meter, model TEC-5 duly calibrated and the solutions were adjusted with solutions 1.0 mol L−1 of HCl or 1.0 mol L−1 of NaOH. The weighing of reagents was carried out on the analytical balance of Shimadzu model AUW2200.
Characterizations of materials in the infrared region were obtained on a Varian model 640-IR spectrometer with ATR from Pike Technologies. SEM characterizations were performed on a scanning electron microscope model TM-3000 from Hitachi. The analyzes were performed by Professor Lucas Franco Ferreira, at the Universidade Federal dos Vales do Jequitinhonha e Mucuri-UFVJM.
2.3. Preparation of Modified Electrode
The electrochemical studies were performed using a modified glassy carbon electrode. Electrode modification was performed using 3 mg of carbonaceous material (MWCNTs, RGO or graphite) dispersed in 1 mL of DMF and 3 mg of metal phthalocyanine (cobalt II, manganese III or iron III) dispersed in 1 mL of DMF. First, the dispersions of carbonaceous material and phthalocyanine were placed in an ultrasonic bath for 5 min to form homogeneous dispersions of each modifier. Then, 5 μL of the carbonaceous material dispersion was deposited on the surface of the GCE, it was oven-dried temperature of 60 °C for approximately 9 min. Finally, 5 μL of the metal phthalocyanine dispersion was deposited on the electrode already modified with the carbonaceous material, and again it was placed in an oven at 60 °C for approximately 6 min.
2.4. Optimization of Experimental Conditions
The study of the effect of the different configurations of the surface of the working electrode for determination of ethinyl estradiol was evaluated by means of the comparison of the intensity of anodic peak current (Ipa) generated for determination of the analyte using the cyclic voltammetry as electrochemical technique, varying the potential from 0.1 to 0.8 V at a scan rate of 10 mV s−1 in the presence of 175 μmol L−1 of EE. Thus, the different configurations of the working electrode were prepared: unmodified glassy carbon electrode (GCE); carbonate-modified glassy carbon electrode (GCE-CM) in which MWCNT was used; metal-phthalocyanine-modified glassy carbon electrode (GCE-Pc) in which cobalt phthalocyanine (CoPc) was used; (GCE-CM-Pc) in which the MWCNT and CoPc were used to evaluate the influence of this modification on the EE determination. After the evaluation of the influence of the modification on EE determination, the study of the carbonaceous material used (MWCNT, RGO and graphite) was carried out to evaluate the influence of this material in the determination of EE. Then, the metal phthalocyanine (cobalt, manganese and iron) study was carried out to evaluate which would play the best catalysts role in the oxidation reaction of EE. Then the amount of carbonaceous material at 3.0 mg/mL and the amount of metal phthalocyanine (2.0 to 5.0 mg/mL) was varied. Then, the amount of metal phthalocyanine which had the best anodic peak current intensity (ΔI) was fixed and the amount of carbonaceous material (2.0 to 5.0 mg/mL) was varied. After optimizing the concentration of MWCNT and CoPc, the next step was to evaluate other parameters such as pH, buffer solutions, and ionic strength. The pH of the 0.1 mol L−1 phosphate buffer solution was studied in the range of 3.0–10.0. Next, the effect of different buffer solutions (Hepes, Pipes, Britton-Robinson, Trizma, Phosphate) was evaluated. After the selection of the best buffer solution as a support electrolyte, different concentrations of buffer solution (0.05, 0.10, 0.15, 0.20 and 0.25 mol L−1) were also evaluated. The optimization of the experimental conditions is important to define the best response of the peak oxidation currents and to improve the sensitivity of the GCE-MWCNT-CoPc sensor.
2.5. Method Validation
After the optimization of all parameters (experimental and operational), the calibration curve was obtained by successive additions from the stock solution of ethinyl estradiol (EE) (5 mmol L
−1) in triplicate analysis. The calibration curves were linear in the concentration range of 2.5 to 90 μmol L
−1 of EE. To calculate the slope and intercept, linear regression analysis was performed. Knowing the slope of the calibration line and the standard deviation from the intercept, it was possible to calculate the limit of detection (LOD) and limit of quantification (LOQ), extremely important parameters directly related to the sensitivity of the proposed method. Estrogens were constantly found at low concentrations in the range of ng/L to μg/L in surface waters [
18]. Estrogens such as EE have been the target of research due to their high estrogen potential and effects on aquatic life [
14]. There is no legislation that regulates the limits of these substances in the water in Brazil [
8]. Thus, the determination of EE in environmental samples, pharmaceutical formulations, and milk samples is of great relevance [
14].
With the purpose of confirming the quality of the information obtained through the developed sensor, the accuracy and the precision of the method were evaluated. First of all, the accuracy and the between-day precision were evaluated over two consecutive working days by triplicate analysis (n = 3) of the EE standard solution at three different concentrations (5.0; 45.0 and 85.0 μmol L−1). Then, the accuracy and within-day precision analysis were performed by the same concentration conditions of the ethinyl estradiol solution (5.0; 45.0; and 85.0 μmol L−1) during a single day. As result, the precision of the method was expressed as relative standard deviation (RSD, %), while the accuracy was expressed as relative error (RE, %).
Finally, the stability of the standard EE solution was evaluated in terms of freezing and thawing time and temperature. For this, three groups of samples of the EE solution were analyzed in triplicate at three different concentrations. The samples were kept under different conditions. The first sample was kept at room temperature during 12 h. The second was frozen for 36 h, and the third went through a freeze-thaw cycle. After that, the signals obtained in each condition were compared.
2.6. Method Application in Pharmaceutical Formulation
Commercial ethinyl estradiol (Fertnon-Mabra) was in the form of tablets and contained, according to the manufacturer, 30 μg of ethinyl estradiol per tablet. Five tablets of this medicine were macerated in a mortar with a pistil. The powder was used to prepare 10 mL sample solution in methanol. The solution was homogenized under ultrasonic shaking for 5 min and then allowed to stand for undissolved excipients to be decanted. An aliquot of 3 mL was then withdrawn from the supernatant solution, and this, in turn, was used for the EE quantification assays.
2.7. Method Application in River Sample
The water sample of the river was collected by the technician Denilson, on 5 July 2018 upstream of the Rio das Mortes, located in the city of São João del-Rei-MG. This sample of water was enriched with standard EE solution. To this buffer solution was prepared with the water collected, the first was a study conducted in the absence of EE, or addition was not performed analyte in the electrochemical cell, showing that the river water sample did not contain EE. Then the evaluation of EE recovery was performed in three different concentrations 4.0; 10.0 and 15.0 μmol L−1.
2.8. Method of Application in Milk Sample
The milk sample (Laticínios Porto Alegre-Ponte Nova, MG) was also analyzed. First, the sample was submitted to a pre-treatment that consisted of the preparation of a sample-ethanol mixture (1:1), according to the normative instruction Das nos. 22/2003. This ethanol pretreatment inhibits the interference of the proteins, fats and lactose found in this type of sample. After stirring 5 min, the sample was centrifuged for 15 min at a rotation of 1600 rpm and then an aliquot of the supernatant was withdrawn, enriched with EE, and analyzed.
3. Results and Discussion
3.1. Study of the Work Electrode Configuration in the Determination of Ethinyl Estradiol
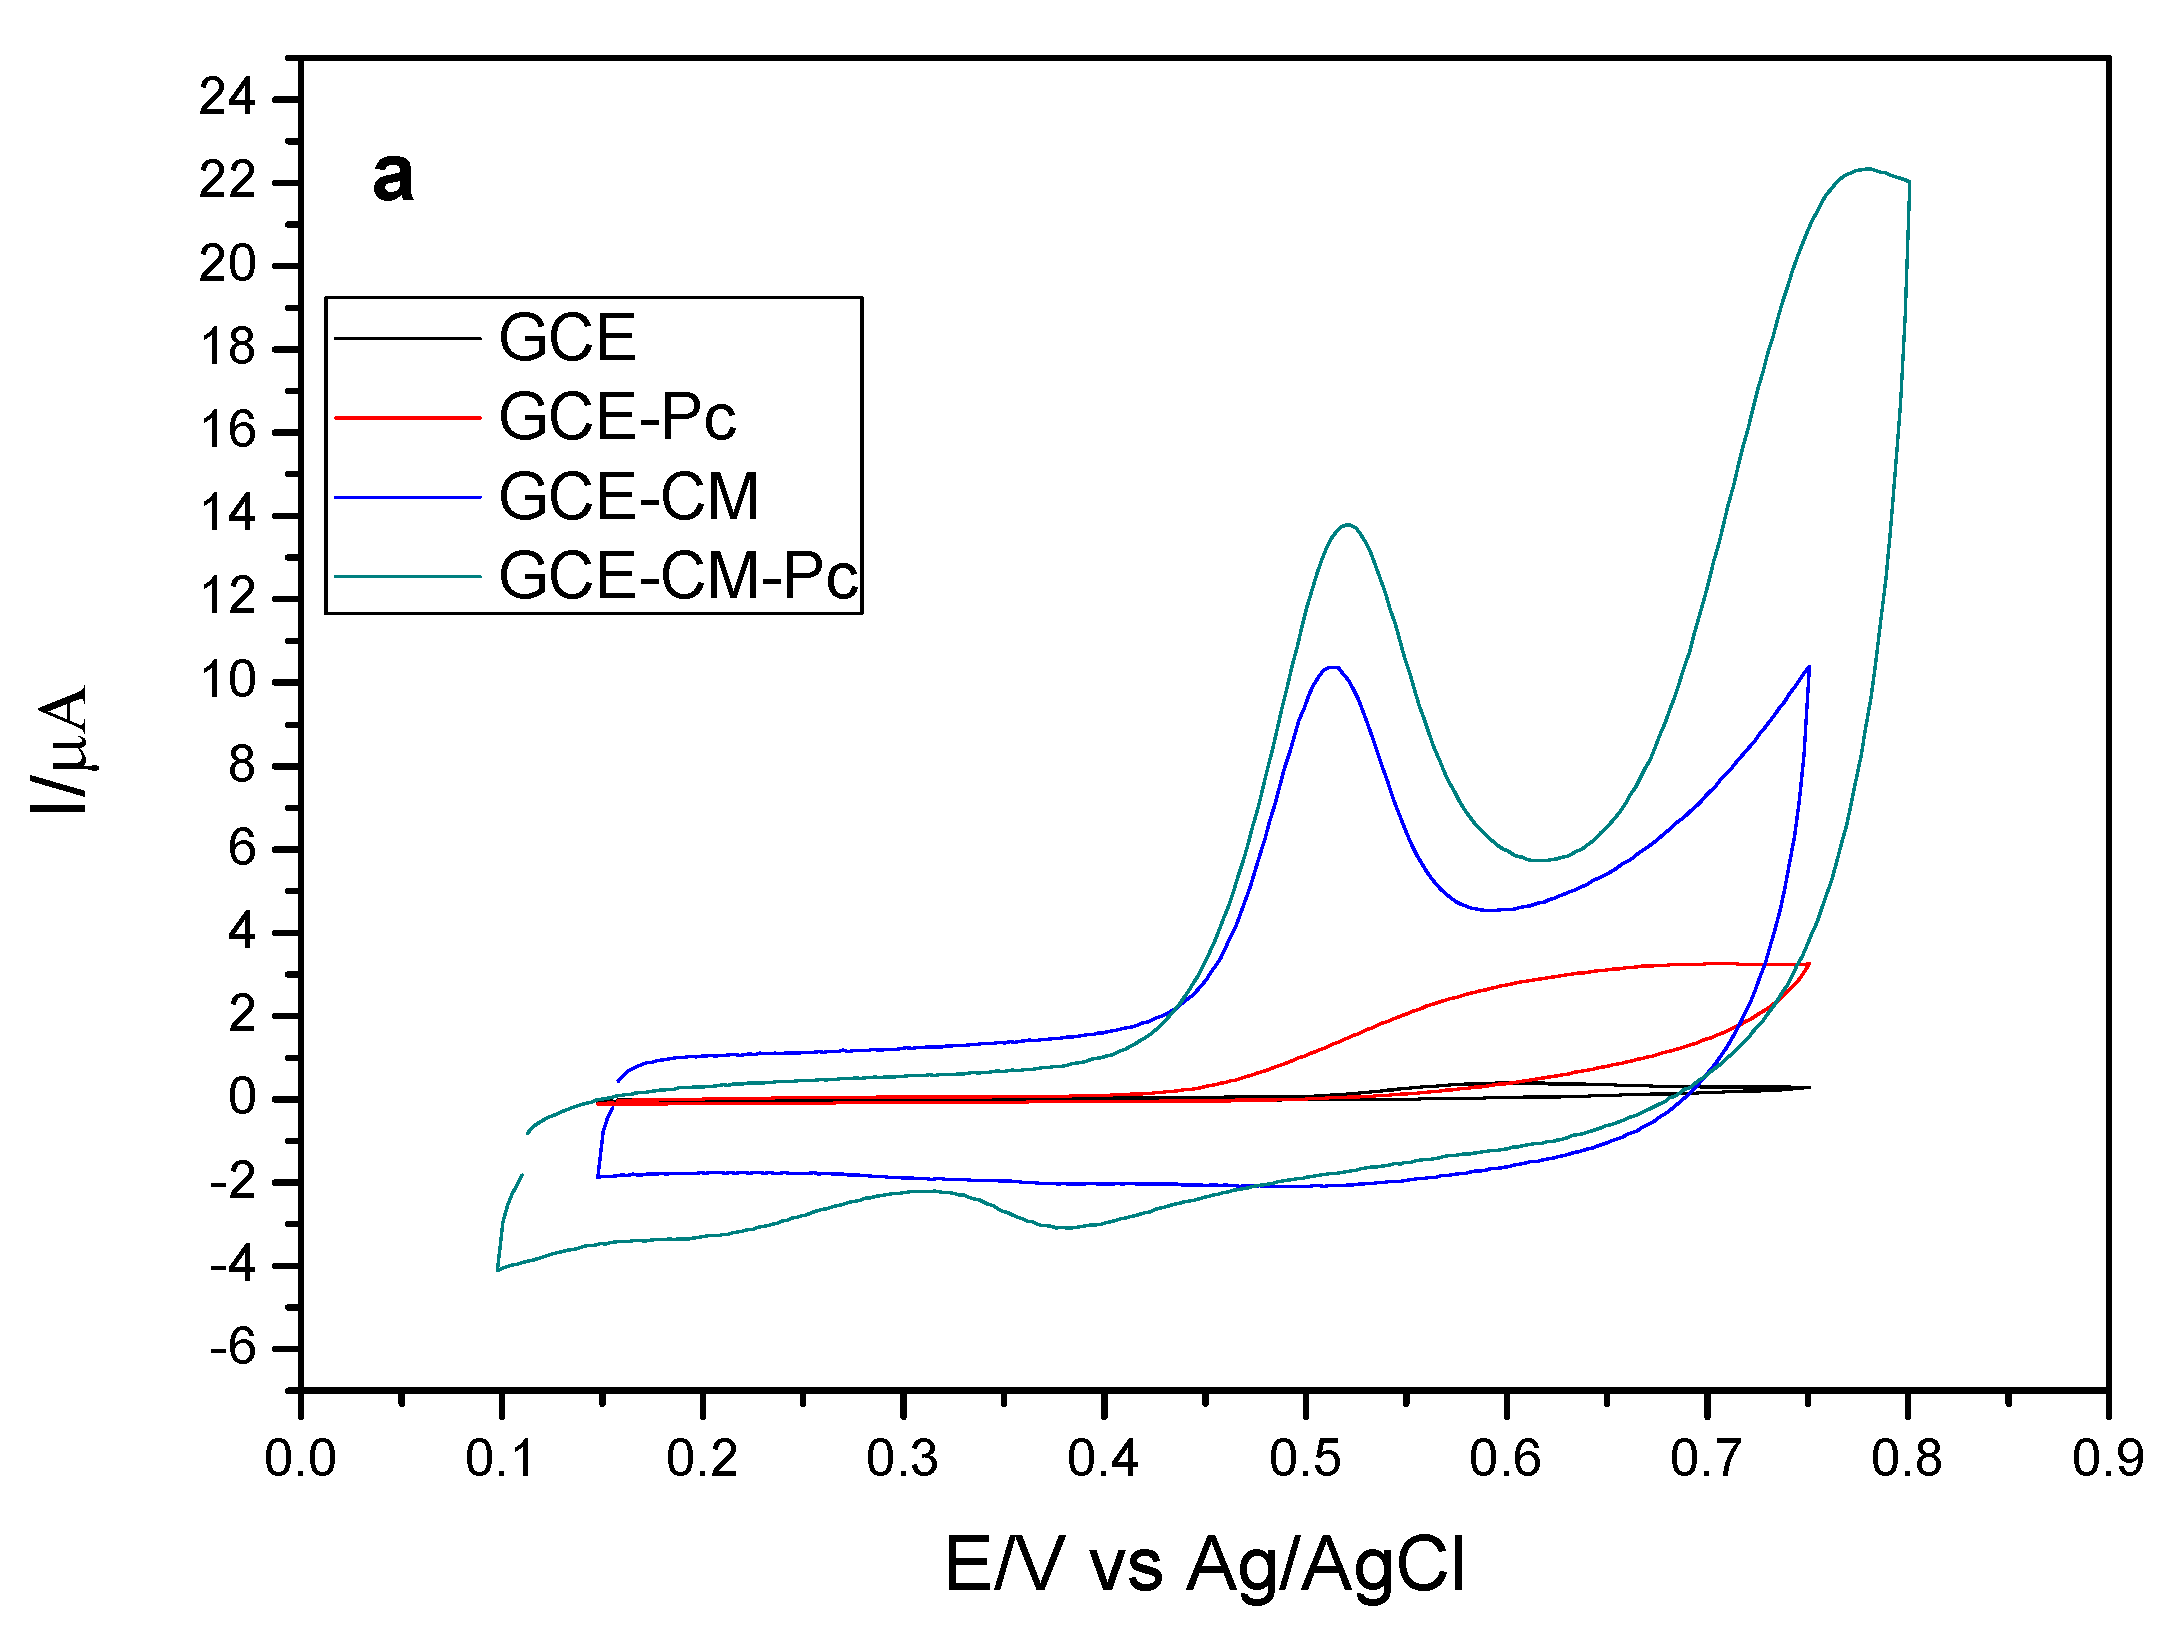
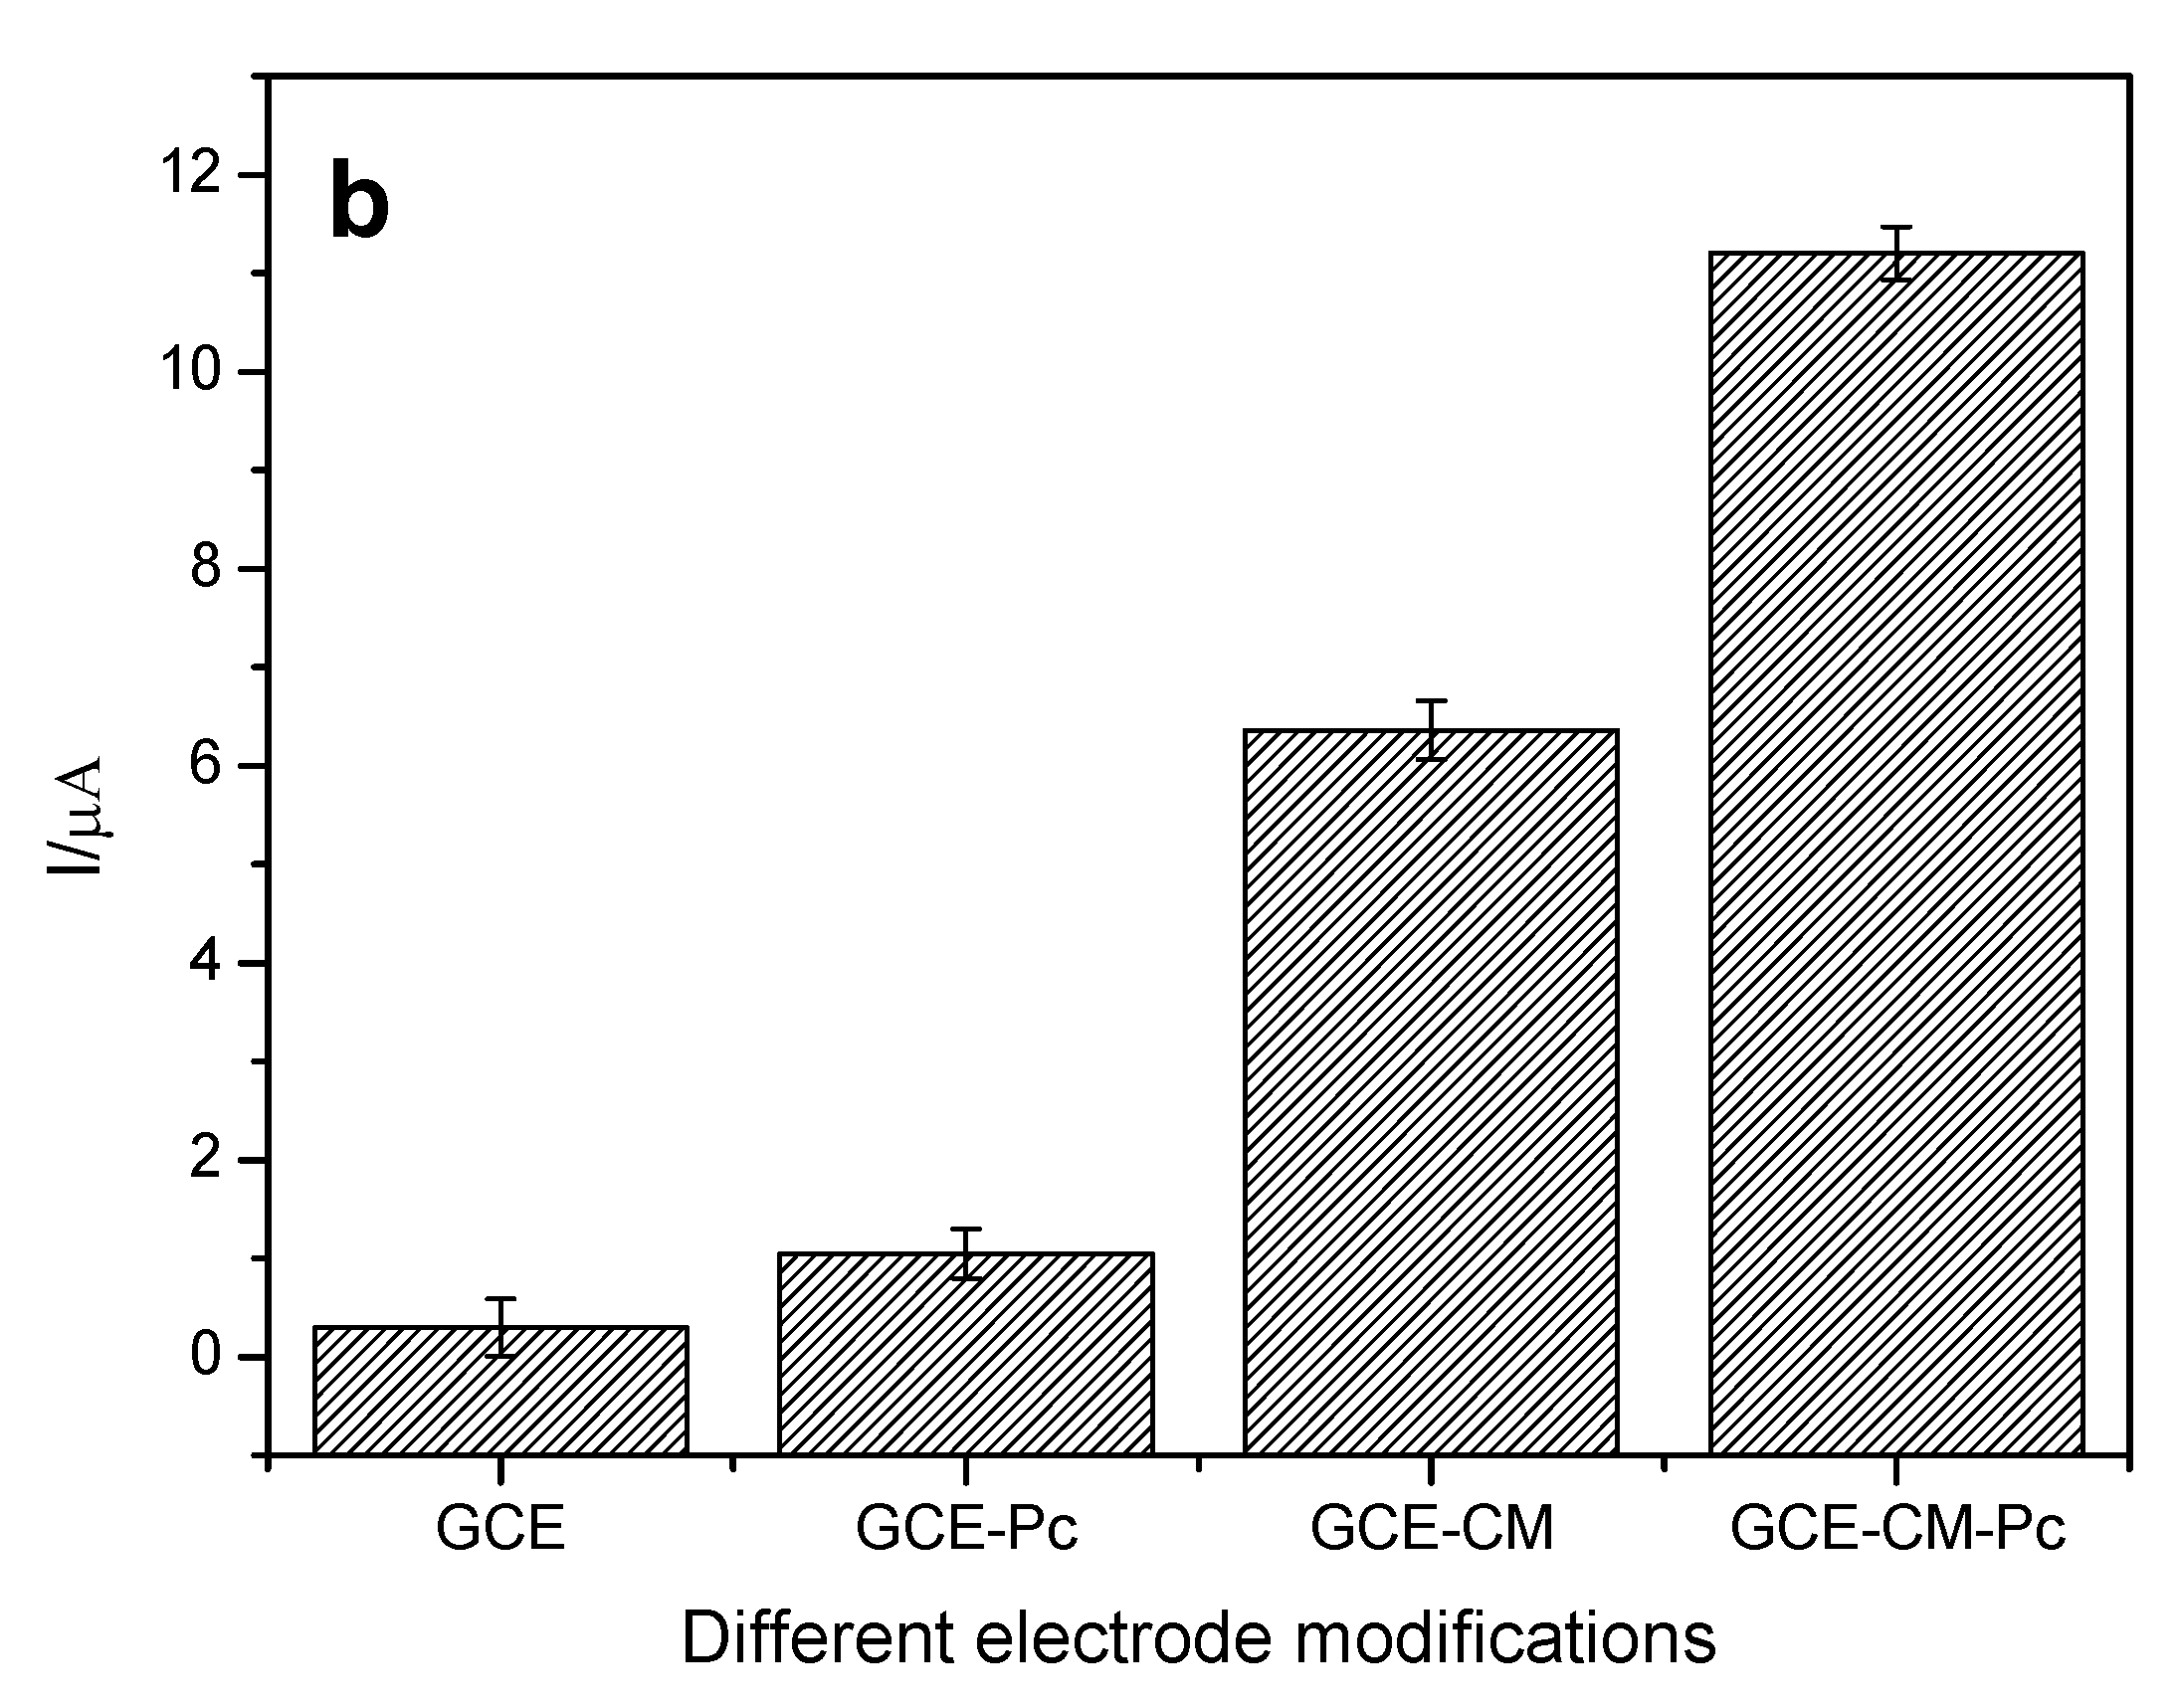
Initially, the influence of the modification of the surface of the working electrode on the response of the analyte of interest was evaluated. Thus, electrodes with different configurations were prepared, being: the bare glassy carbon electrode (GCE), the GCE electrode with carbonaceous material (CM), in which the MWCNT (GCE-CM), the electrode GCE with metal phthalocyanine (Pc), in which cobalt phthalocyanine (GCE-Pc), and the GCE electrode modified with carbonaceous material (MWCNT) and metal phthalocyanine (Cobalt), (GCE-MC-Pc) were used. The variations of anodic peak current are shown in
Figure 2a,b for each configuration of the working electrode.
It can be observed that the CM-Pc modified glassy carbon electrode presents the highest variation of anodic peak current (ΔI) when compared to the other configurations. This is probably due to the presence of carbonaceous material (MWCNT), which contributes to an increase in electrical conductivity besides acting as a support for the immobilization of phthalocyanine. Another observation is the increase of ΔI with the presence of metal phthalocyanine (Cobalt) that may be acting as a catalyst for the oxidation reaction of EE. Another characteristic of cobalt phthalocyanine is to facilitate the electronic transfer between the substrate (EE) and the surface of the electrode, thus promoting a higher current gain [
19,
20].
3.1.1. Evaluation of Metallic Phthalocyanine Used in the Proposed Sensor Response
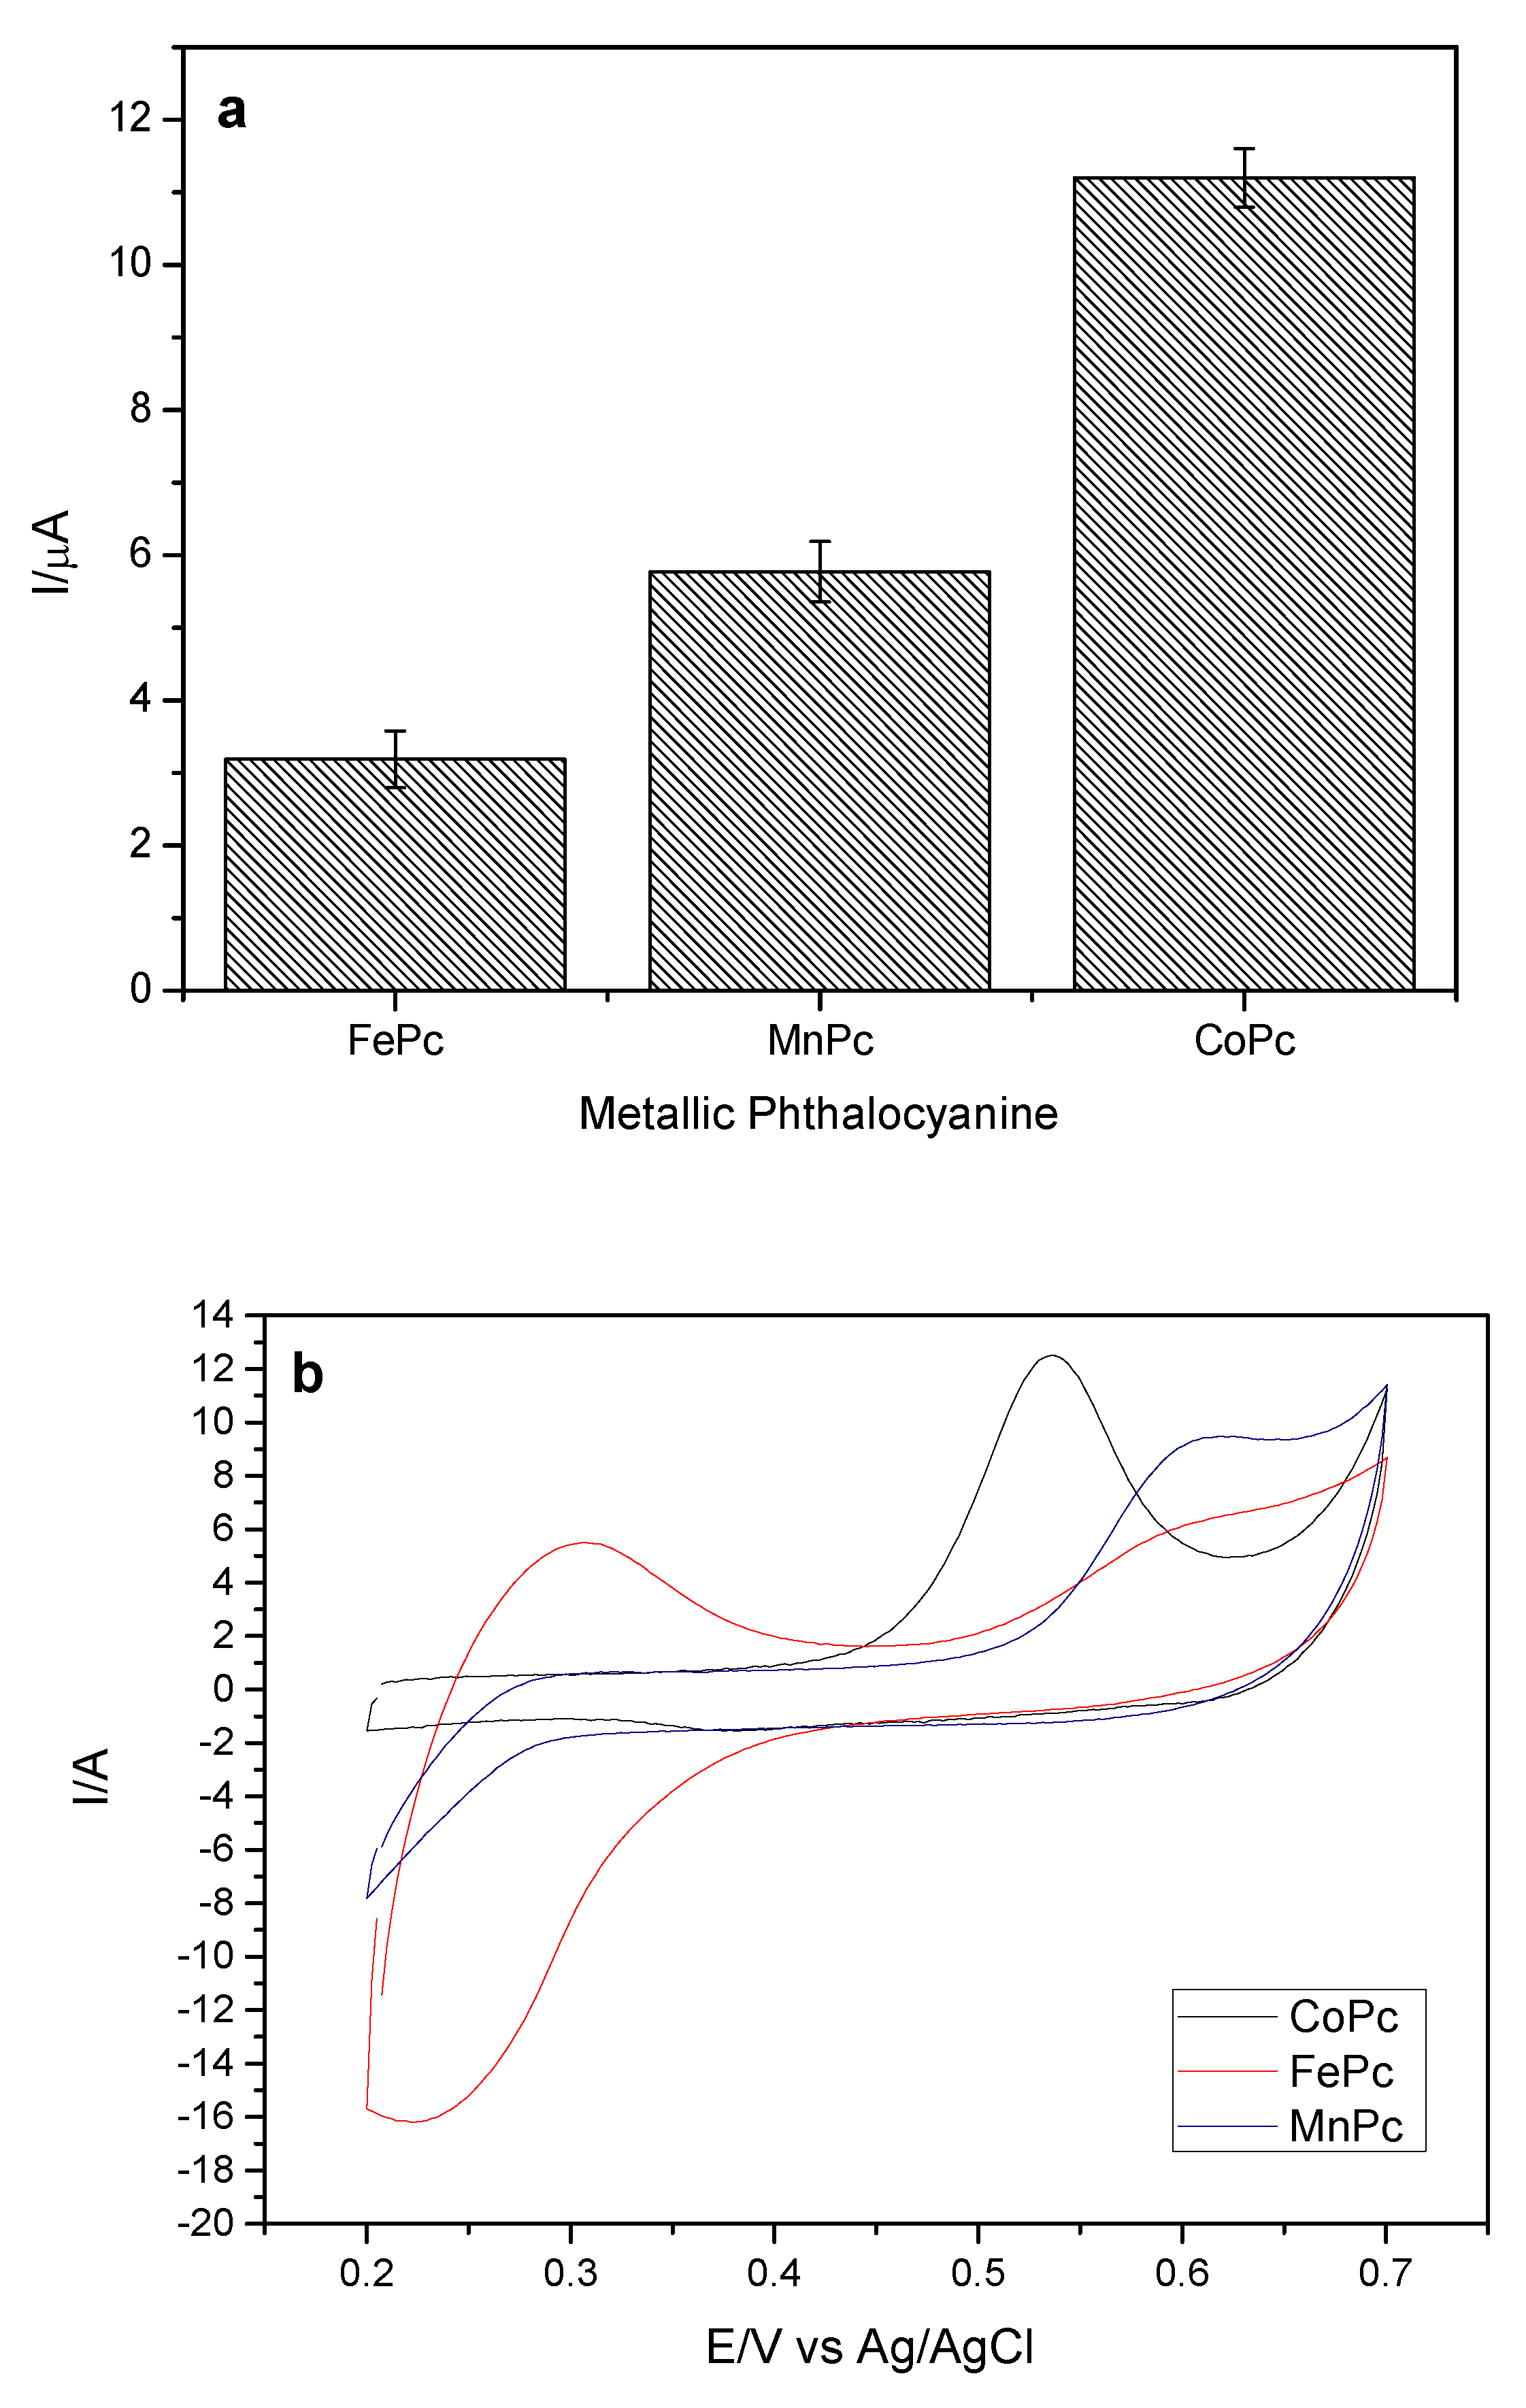
In order to optimize the experimental parameters that influence the sensor response to the studied analyte, the effect of the different phthalocyanines in the preparation of the working electrode was evaluated. The phthalocyanines of cobalt II (CoPc), manganese III (MnPc) and iron III (FePc) were evaluated, keeping MWCNT as carbonaceous material. The variation of the anodic peak current (ΔI) for the analyte in relation to the different phthalocyanines can be observed in
Figure 3a.
As can be seen from
Figure 3a,b, the oxidation peak is strongly dependent on the nature of the metal center of phthalocyanine, with a higher response to that of cobalt II. This effect strongly indicates the participation of the metallic core in the electrostatic reaction. CoPc binds to MWCNTs through non-covalent π-π interactions [
21]. In addition to the higher current gain observed for cobalt II phthalocyanine, it also leads to the reduction of the oxidation potential of EE [
22,
23] from 0.65 V to 0.53 V and has a more definite peak (
Figure 3b). For these reasons, CoPc was maintained for subsequent studies.
3.1.2. Evaluation of the Carbonaceous Material Used
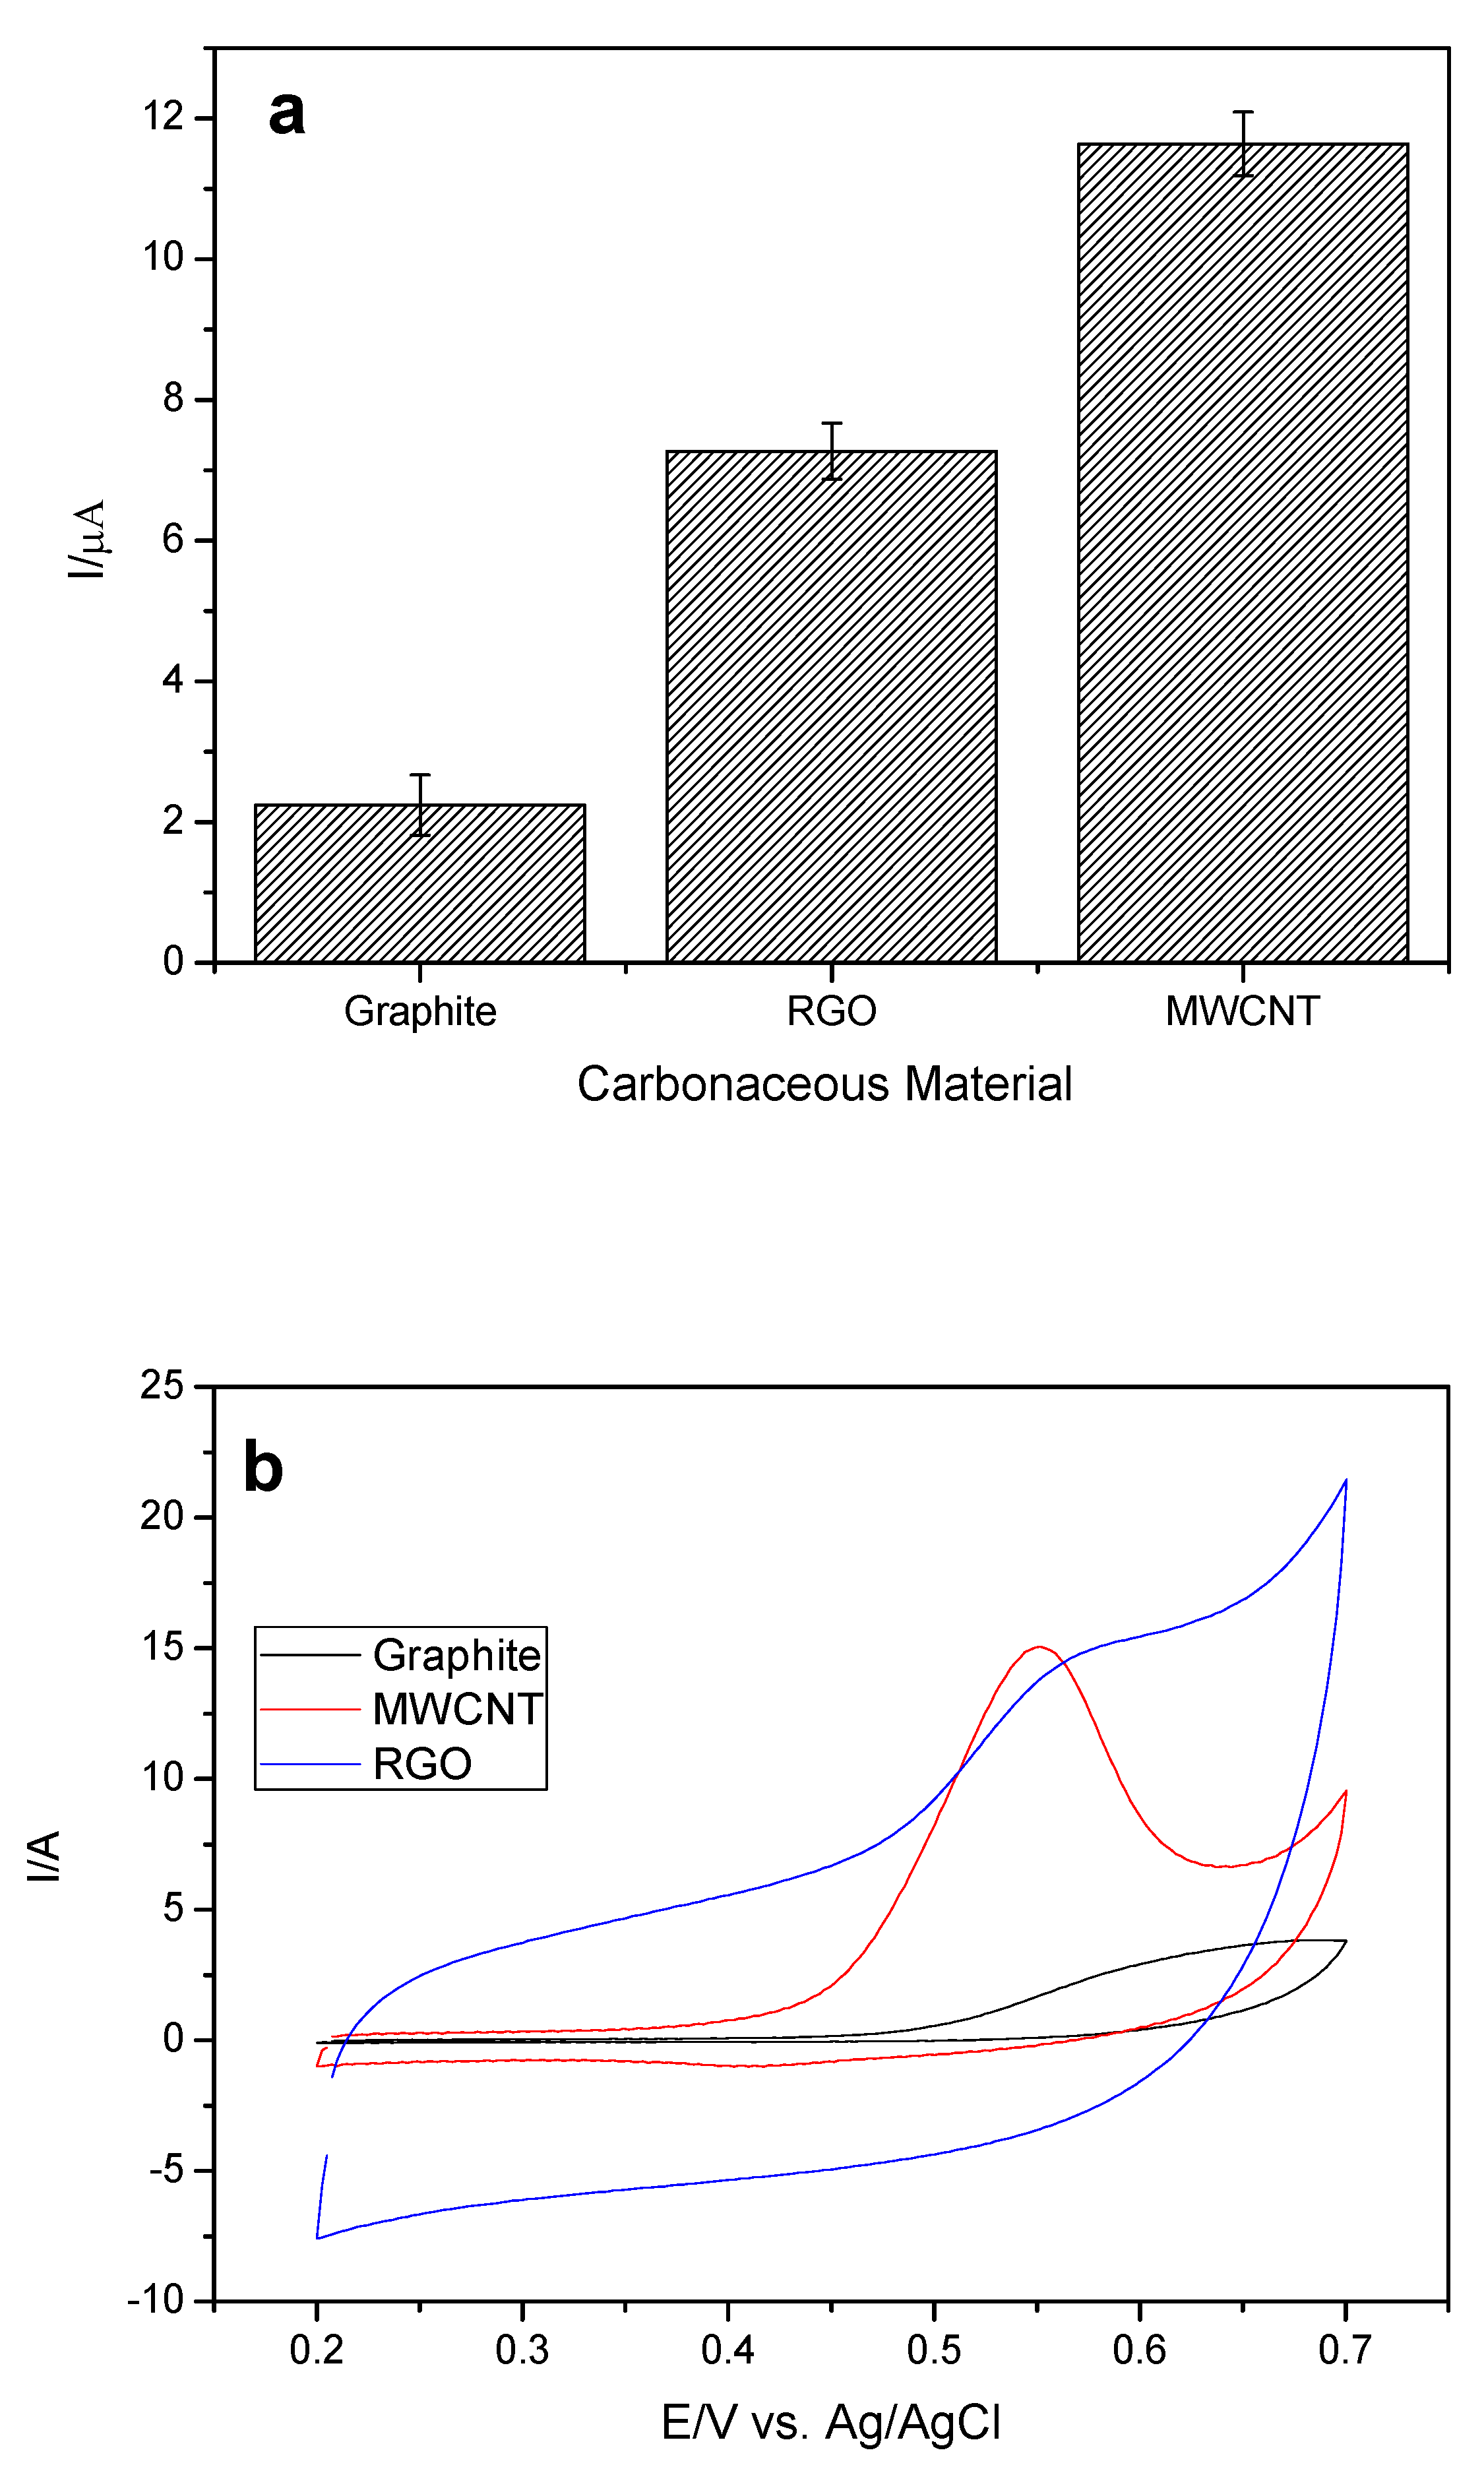
Next, the carbonaceous material used in the modification of the working electrode was evaluated. The concentration of the cobalt phthalocyanine II (CoPc) remained fixed, since it was the one that provided the greatest current variation (ΔI). Multiwalled carbon nanotube (MWCNT), reduced oxide graphene (RGO), and graphite were evaluated as these materials present advantageous characteristics, such as large surface aeration and rapid transfer of charge. The variations of the anodic peak current (ΔI) for the analyte in relation to the different materials can be observed in
Figure 4a,b.
It can be observed that the MWCNT led to a higher current variation of the analyte, and this may be related to its main properties such as high surface area, high electrical conductivity, chemical stability, and mechanical resistance. The MWCNT-CoPc system has a synergistic effect, which includes the high mediator and catalytic power of CoPc without losing any of the electronic properties of MWCNT [
24].
Among the three materials, graphite is the one that presents the smallest surface area and the highest resistivity, and due to these characteristics led to a decrease in the EE current variation [
25].
Although the RGO showed some better properties (
Table 1), such as a higher surface area and lower resistivity than MWCNT [
25,
26,
27,
28], RGO led to a decrease in EE current variation. Thus, considering that the MWCNT used is commercial, already presents a well-defined characterization and a well-founded synthesis in relation to the RGO that was synthesized by the group, a more detailed characterization of synthesis is required. In addition, we can relate the higher current gain in relation to the way the carbonaceous material is disposed on top of the working electrode, because the RGO sheets will be stacked one on the other, thus reducing the contact area of the RGO with the analyte, since the MWCNT for presenting a cylindrical shape will provide a greater area of contact with the analyte. In this way, the MWCN was chosen for the next studies.
3.1.3. Catalyst Study
Electrocatalysis is a phenomenon that aims to reduce the activation energy of electrochemical reactions, causing them to proceed faster to the same overpotential [
29,
30].
The overpotential is the additional potential to the standard potential needed to overcome the activation energy of an electrode reaction. For an electrochemical system, the reduction of the overpotential is important from several aspects. First, the system can operate at lower potentials, causing the system to consume less energy during the process. In addition, there is an increase in the selectivity of the reactions of interest, since these approach the E° potential necessary for them to occur, minimizing the chance of other species reacting in the range of applied potential [
29,
30].
In order to improve the reaction kinetics on the surface of the electrodes, decreasing the overpotential and increasing the speed of the reaction, materials known as catalysts are used. These catalysts are deposited on the surface of the working electrode so that one has an active electrode with high surface area. Therefore, much of the improvement observed in the catalytic activity of these species is due to the increase in the electrochemically active area of the electrode [
29,
30].
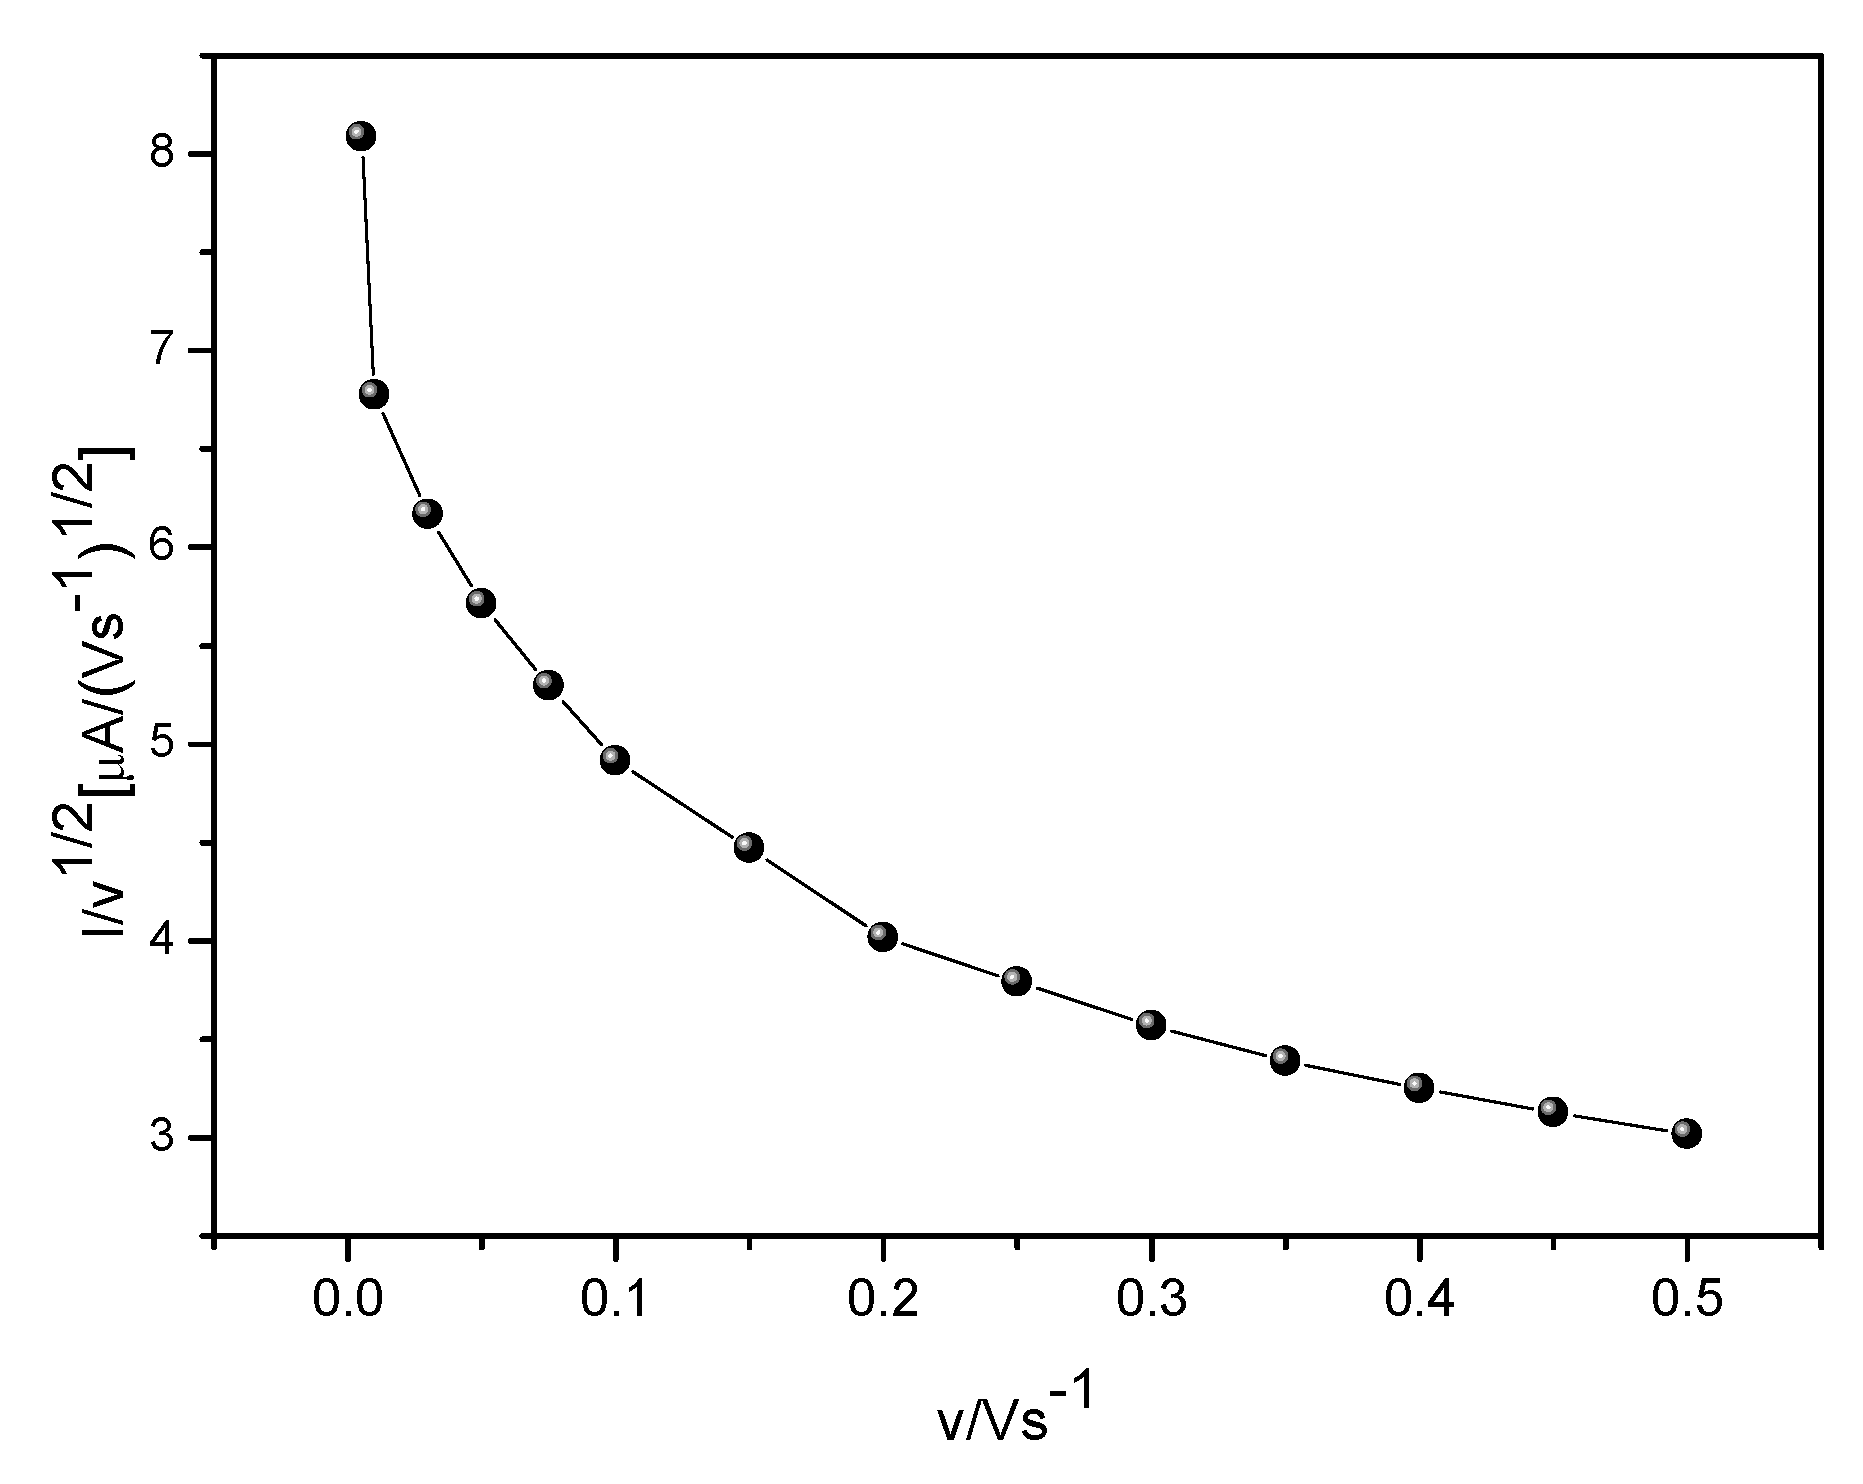
To verify that CoPc is acting as catalyst, a study was performed on the behavior of the interaction between the analyte and the immobilized cobalt phthalocyanine in the proposed sensor.
Figure 5 shows the behavior of the interaction between the analyte and the immobilized cobalt phthalocyanine in GCE-MWCNT-CoPc which presents an EC type (electrochemical-chemical catalytic) model for a species in solution in its reduced state that reacts chemically with the product of the electrochemical reaction so that the catalyst is regenerated and the analyte is oxidized. In this sense, a current function graph, Ip/v
1/2, (normalized by the square root of the sweep speed) was constructed from the peak current and sweep velocity data [
31].
As can be seen, the current versus velocity function graph led to a typical expected profile for EC systems in which the current function at low scan rate presents high values.
3.2. Characterization of the Materials Used for the Modification of the Working Electrode Surface
The characterizations were performed by means of infrared spectroscopy (FT-IR) and scanning electron microscopy (SEM).
3.2.1. Characterization by Scanning Electron Microscopy (SEM)
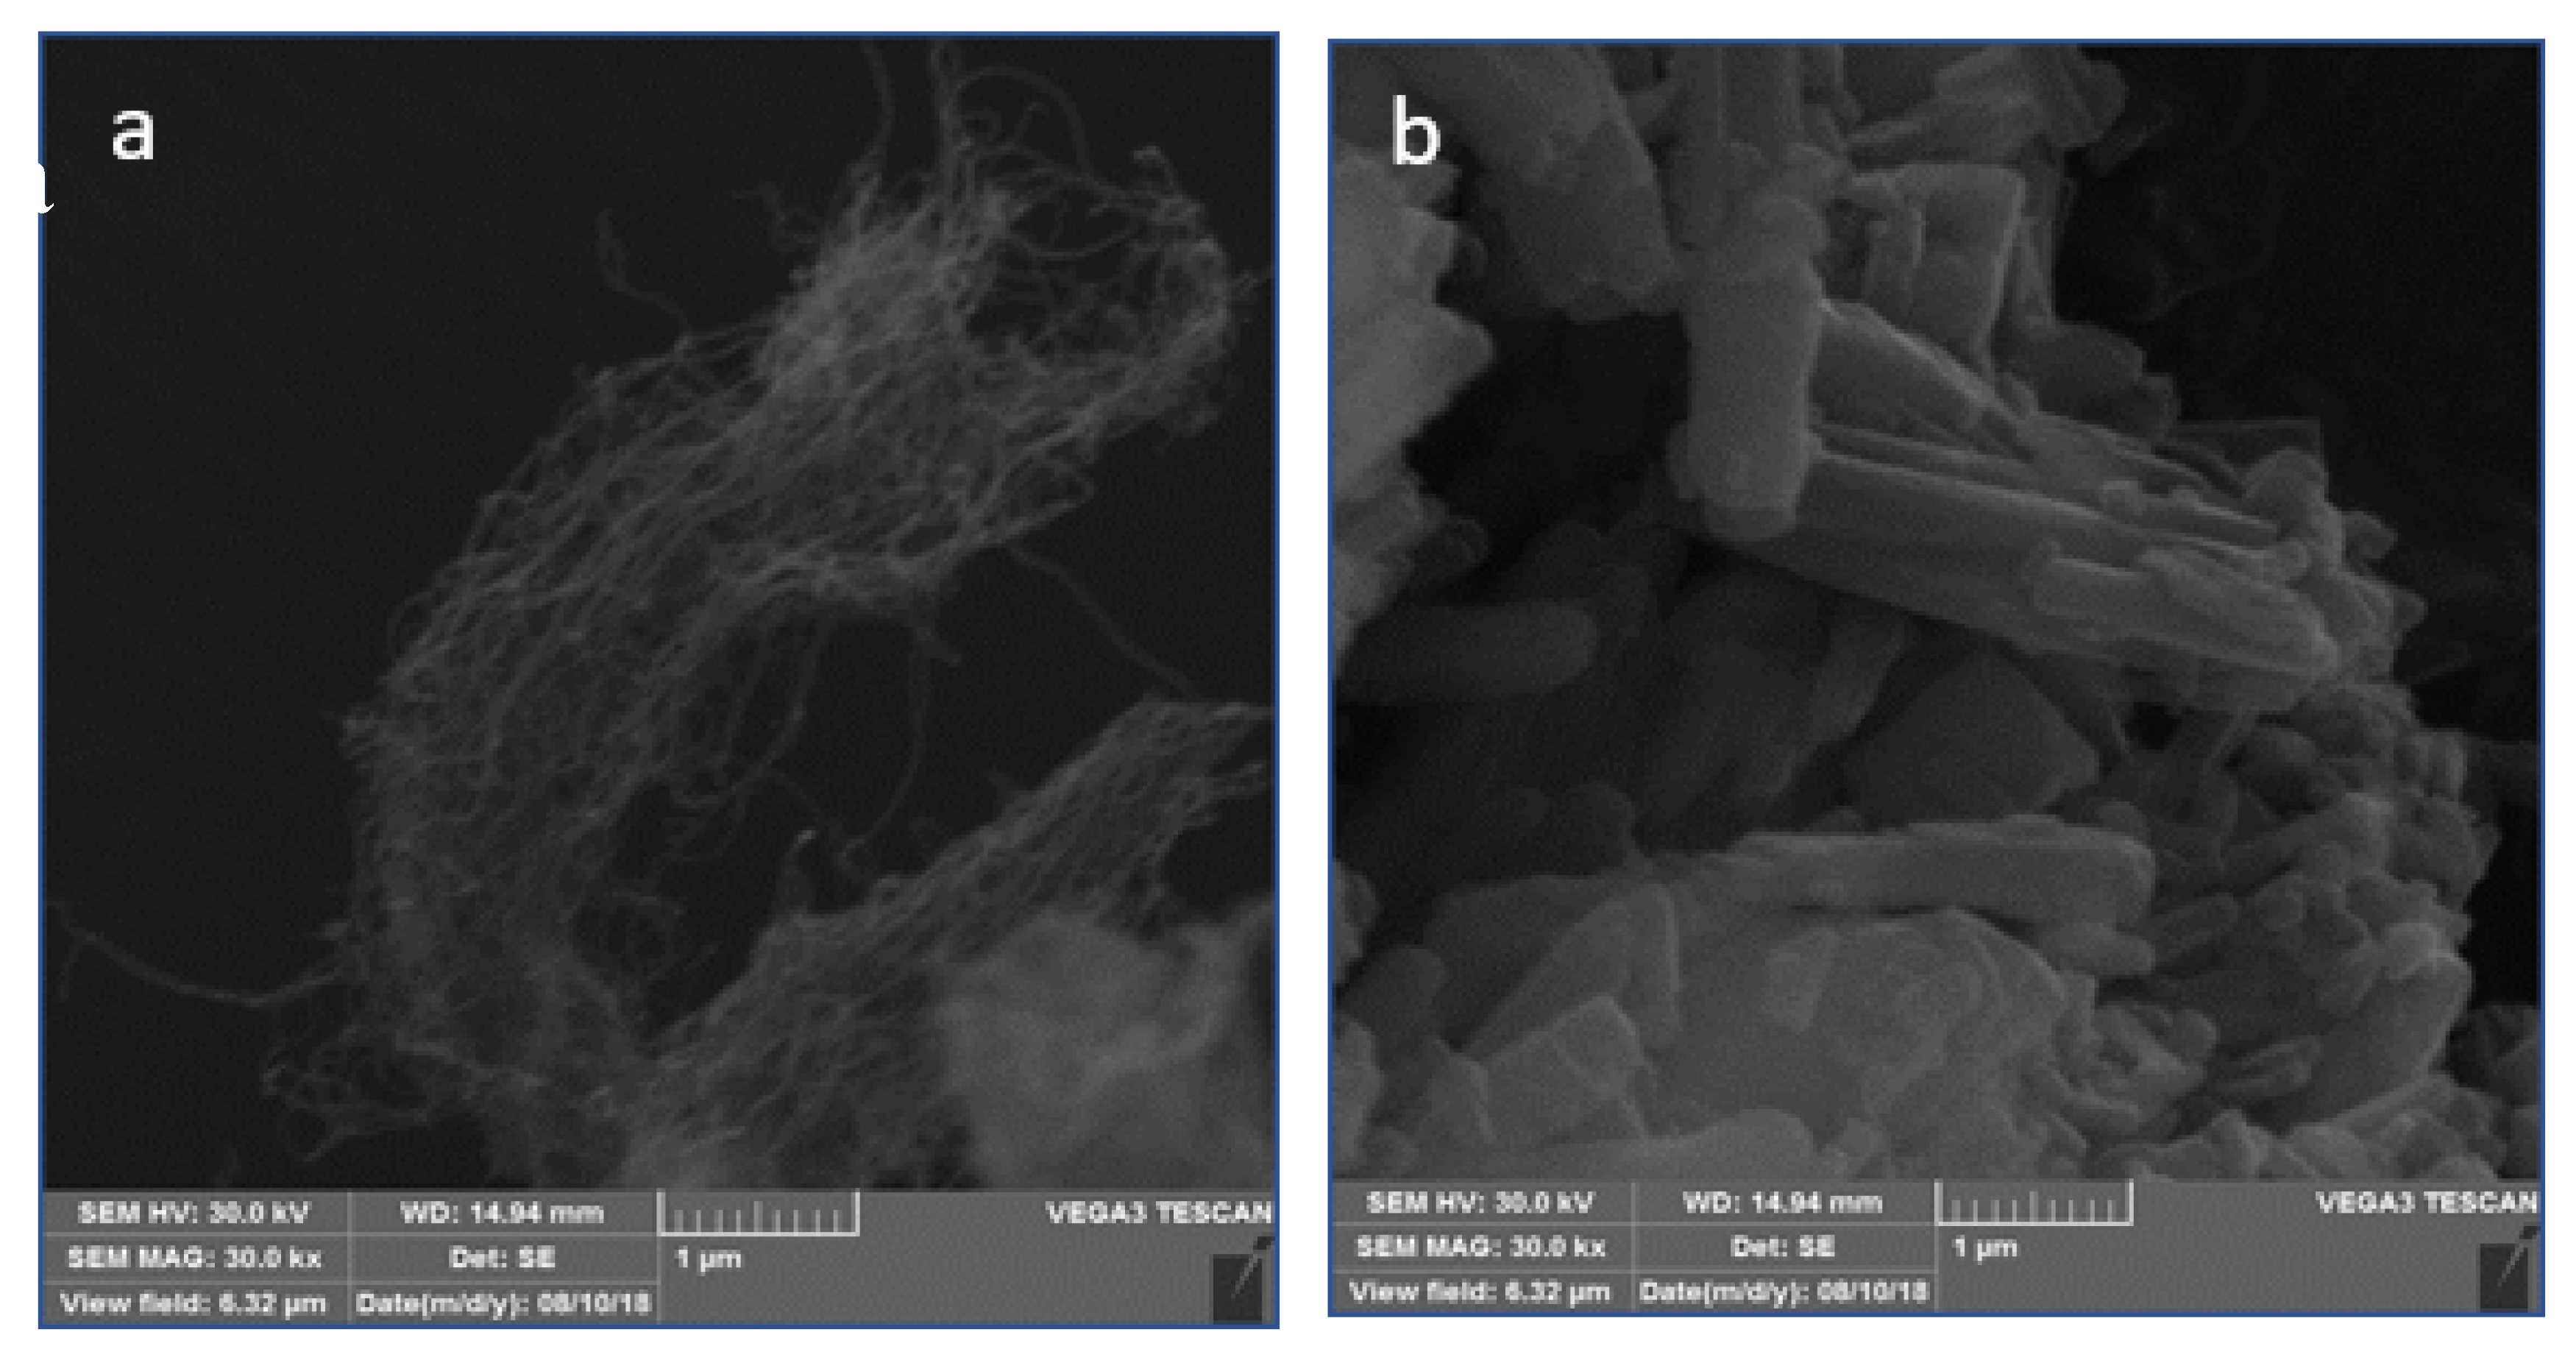
SEM images were performed with the purpose of characterizing the morphology of the different constituents used in the modification of the proposed sensor surface. SEM images were obtained from drying the dispersion of each system on the surface. In this way, the materials that form the proposed sensor, individually (MWCNT and CoPc) and in composite form, were evaluated.
Figure 6 represents, respectively, SEM images of the MWCNT (
Figure 6a), cobalt phthalocyanine (
Figure 6b), and the materials that form the composite (
Figure 6c). It is possible to verify that MWCNTs present as an irregular surface tangle as this structure increases the effective area of the device when deposited on the surface of the electrode by increasing the contact between the surface of the electrode and the solution. From
Figure 6c it is possible to observe that the CoPc crystals are distributed over the MWCNT without the formation of large aggregates of the latter on the MWCNT. Additionally, the SEM image for CoPc makes it evident that the absence of carbon nanotubes resulted in deposits made up of aggregates of CoPc molecules (
Figure 6b).
3.2.2. Infrared Spectroscopy with Fourier Transform (FT-IR)
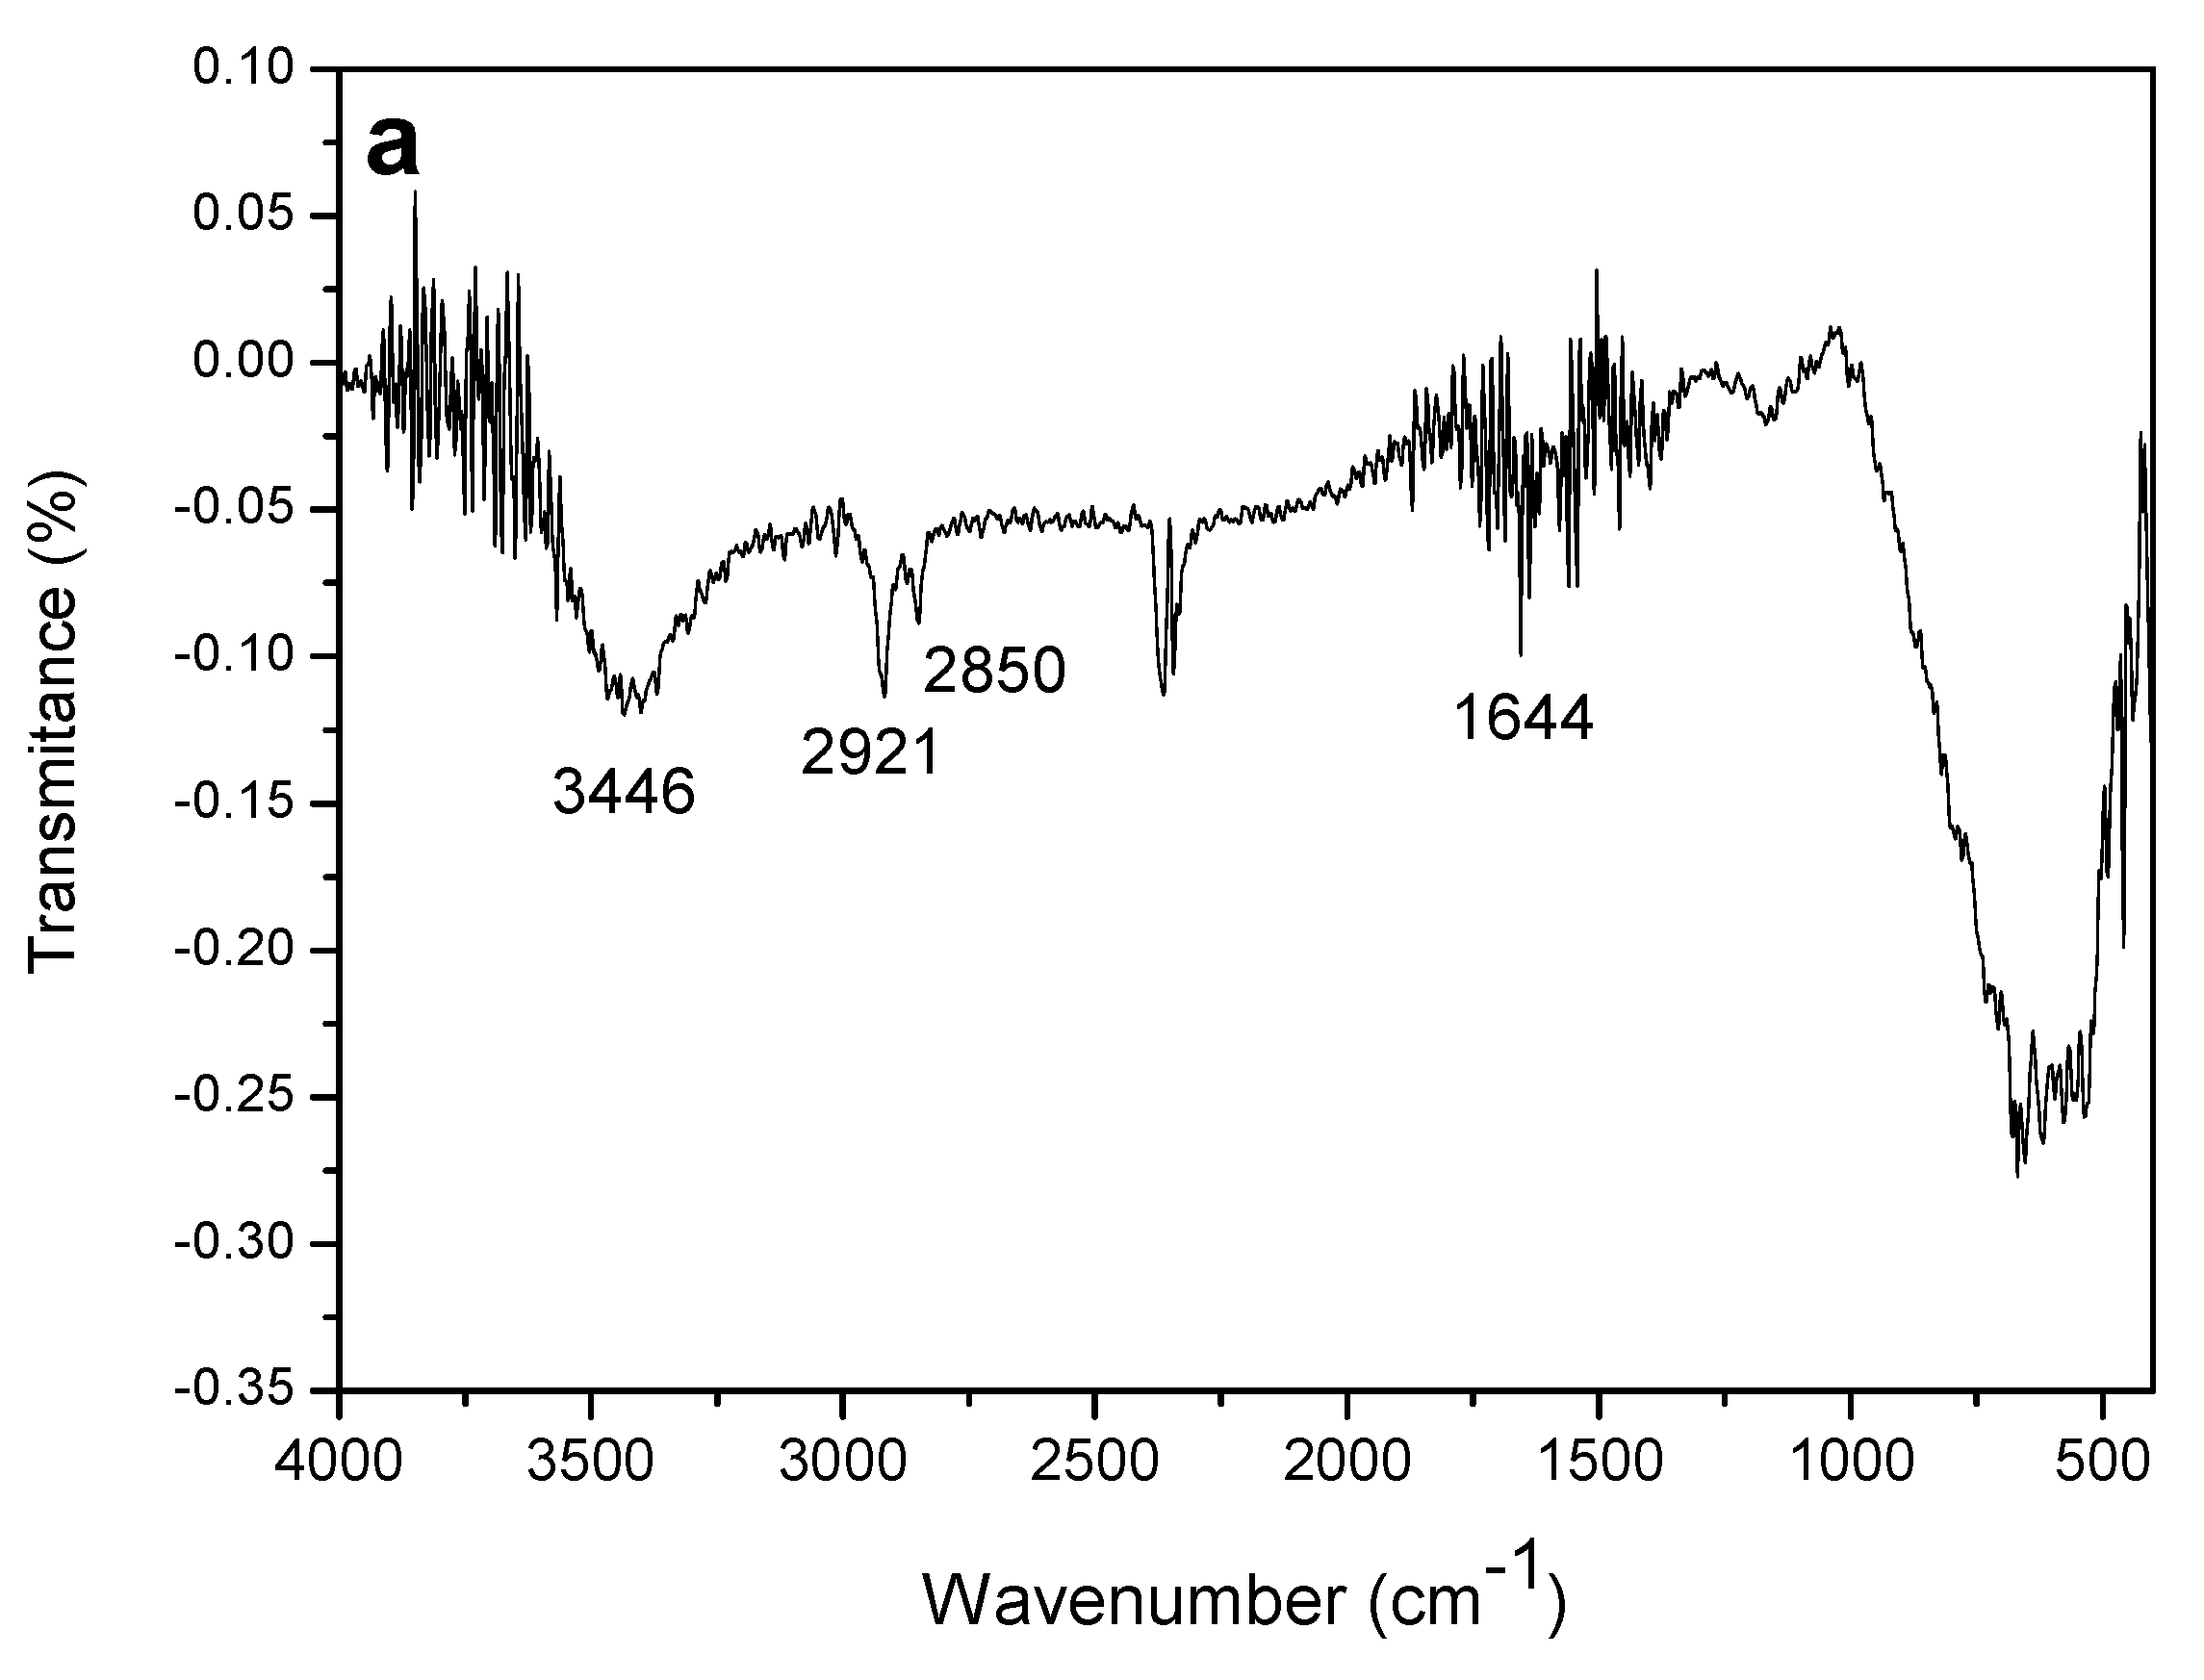
The infrared spectra recorded in the region of 4000 to 400 cm−1 were obtained for the constituents of the working electrode: MWCNT, CoPc and the composite formed between MWCNT-CoPc, in order to show the different functional groups present in the developed material.
The FT-IR spectrum for MWCNTs exhibits a broad band at 3446 cm
−1 which is associated with the stretching of the -OH (hydroxyl) linkage. The two bands located at 2921 and 2850 cm
−1 are attributed to the symmetrical and asymmetrical stretching of the -CH
2 group respectively [
32,
33]. Another 1644 cm
−1 band is associated with the stretching of the C=C- binding [
34]. All such assignments described above are features of the MWCNT (
Figure 7a).
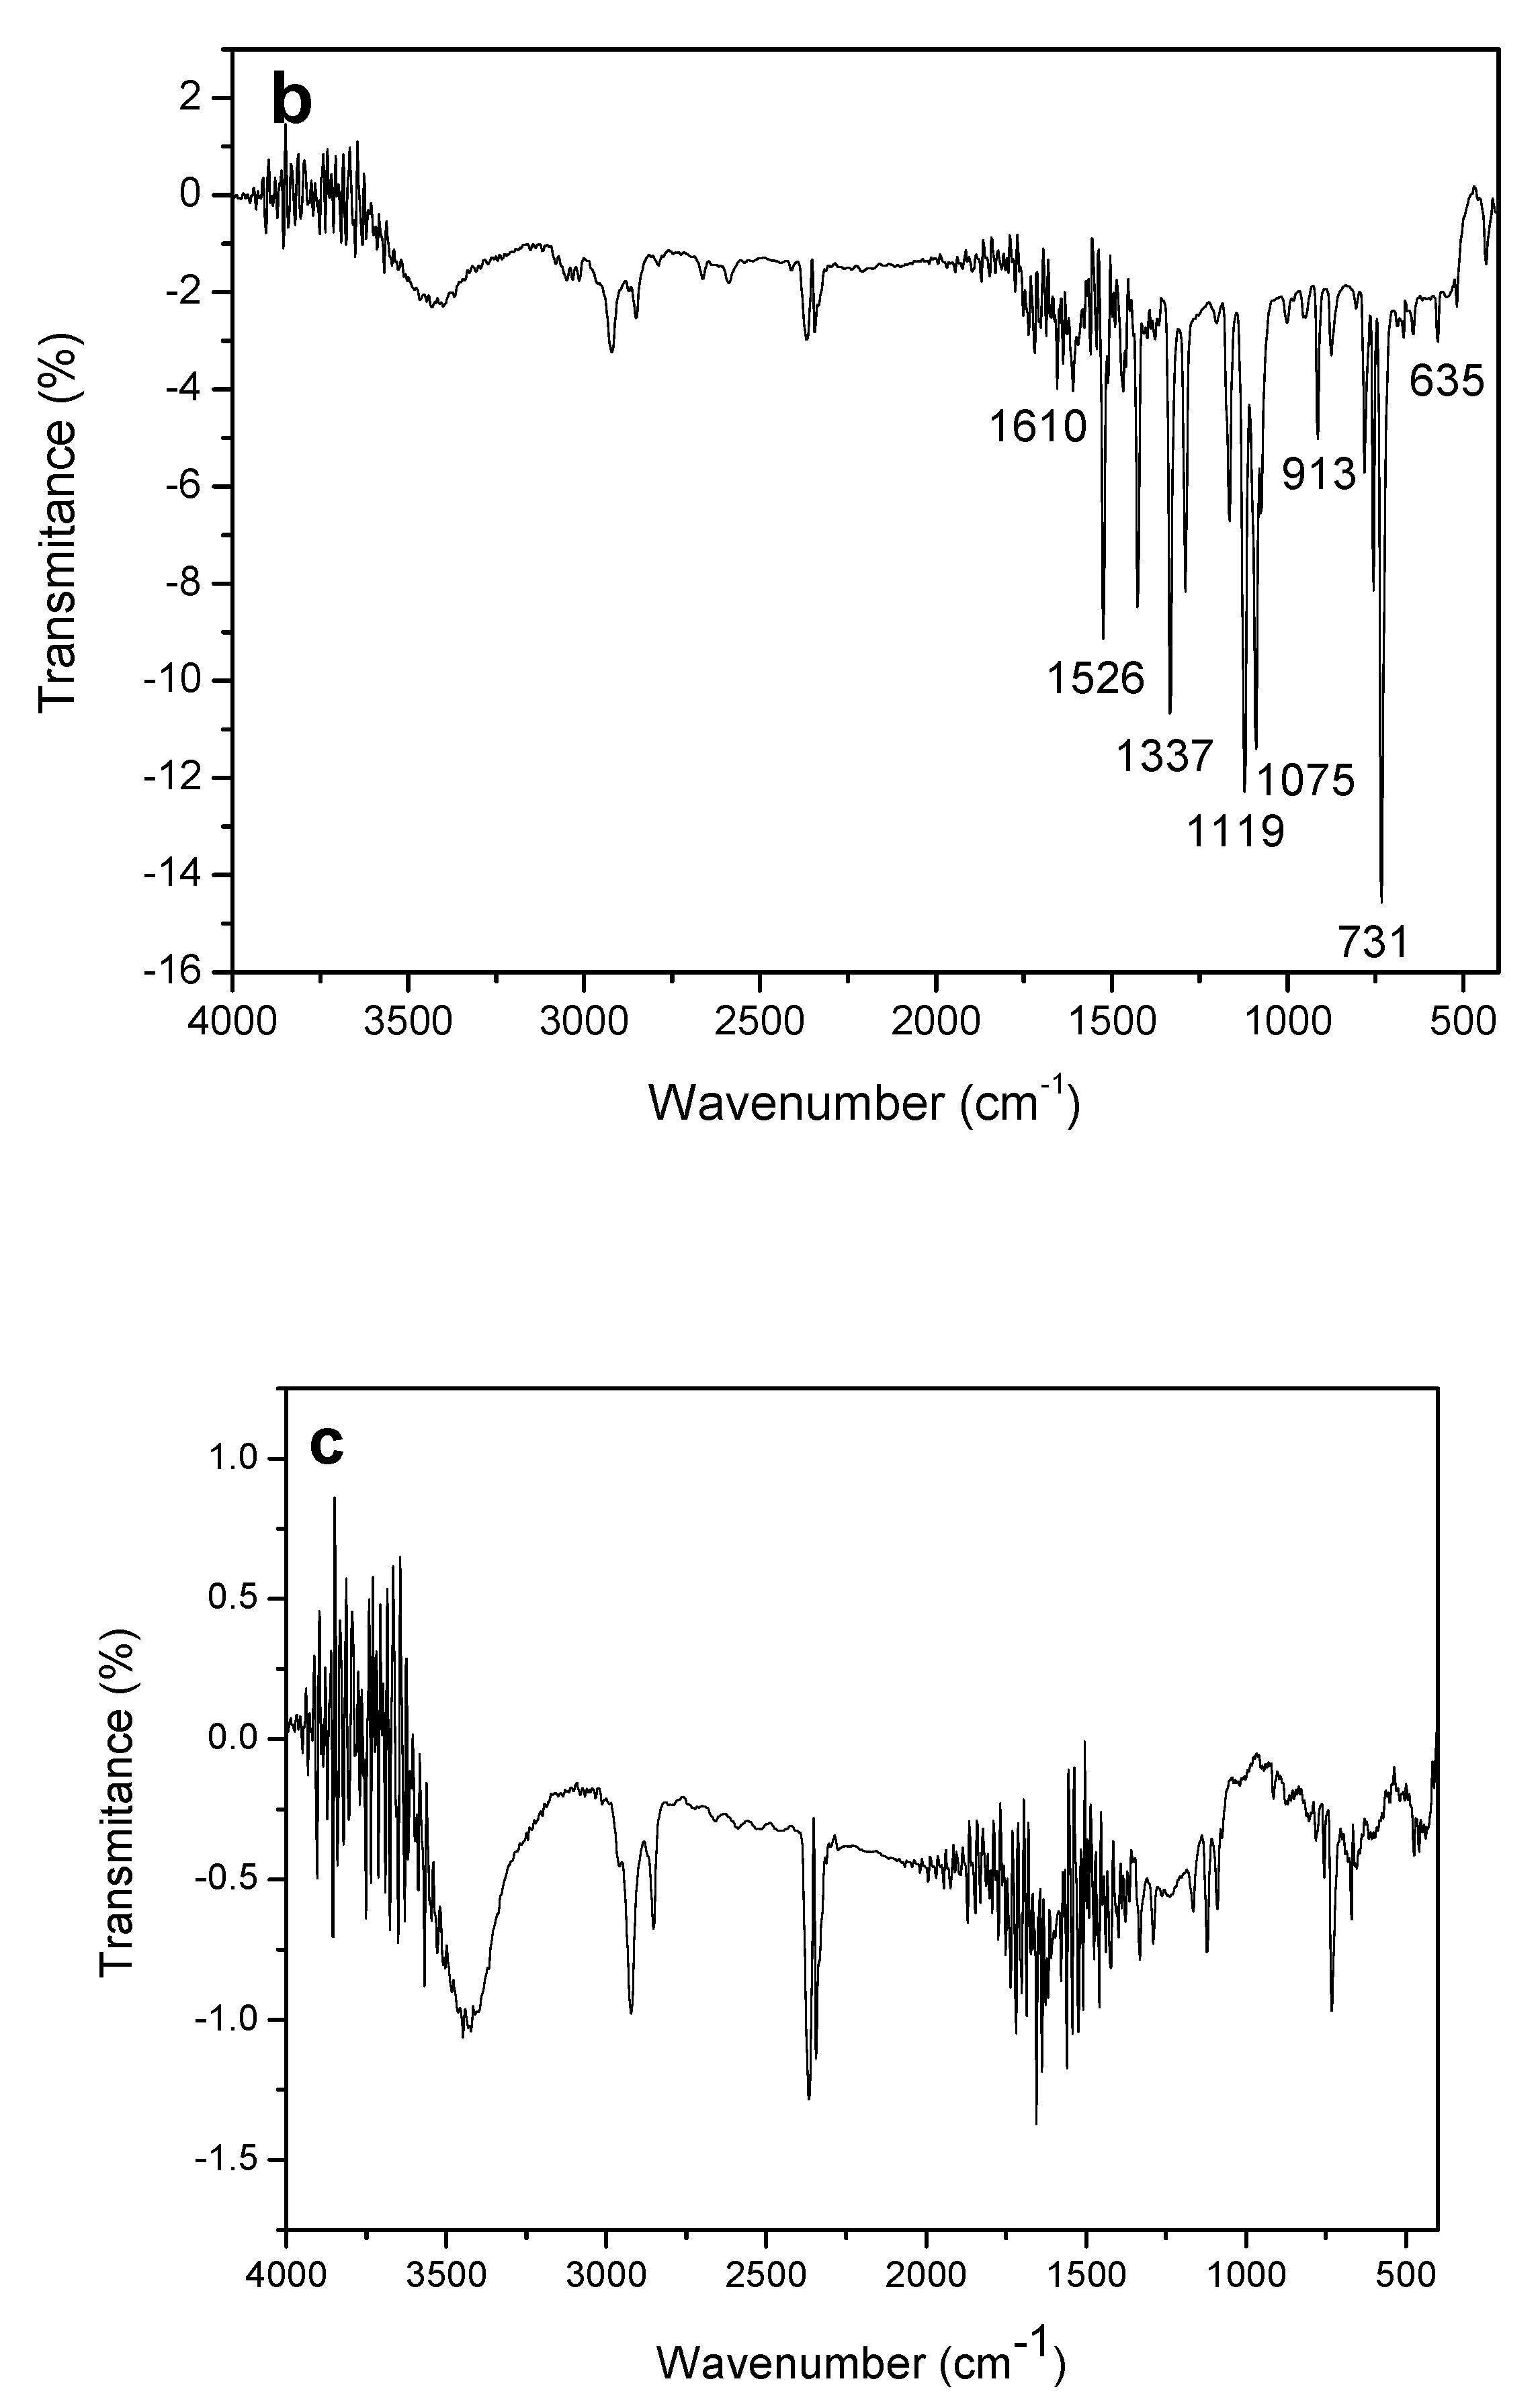
Figure 7b shows that the FT-IR spectrum for CoPc showed a large number of bands between 600 and 1610 cm
−1.
As can be observed, the assignment shown in
Table 2 makes clear the nature of the cobalt phthalocyanine when compared to the reference values established by Verma et al. in 2008 [
35].
In
Figure 7c bands similar to those observed for MWCNT as well as for CoPc are observed, which suggests that the composite material is composed of CoPc and MWCNT.
From the characterizations made it possible to observe that the formed composite (MWCNT-CoPc) presented homogeneous, which can lead to an improvement in the interaction between the modified electrode and the EE, besides being able to improve the sensitivity and the stability of the sensor.
3.3. Electrochemical Characterization of the Proposed Sensor
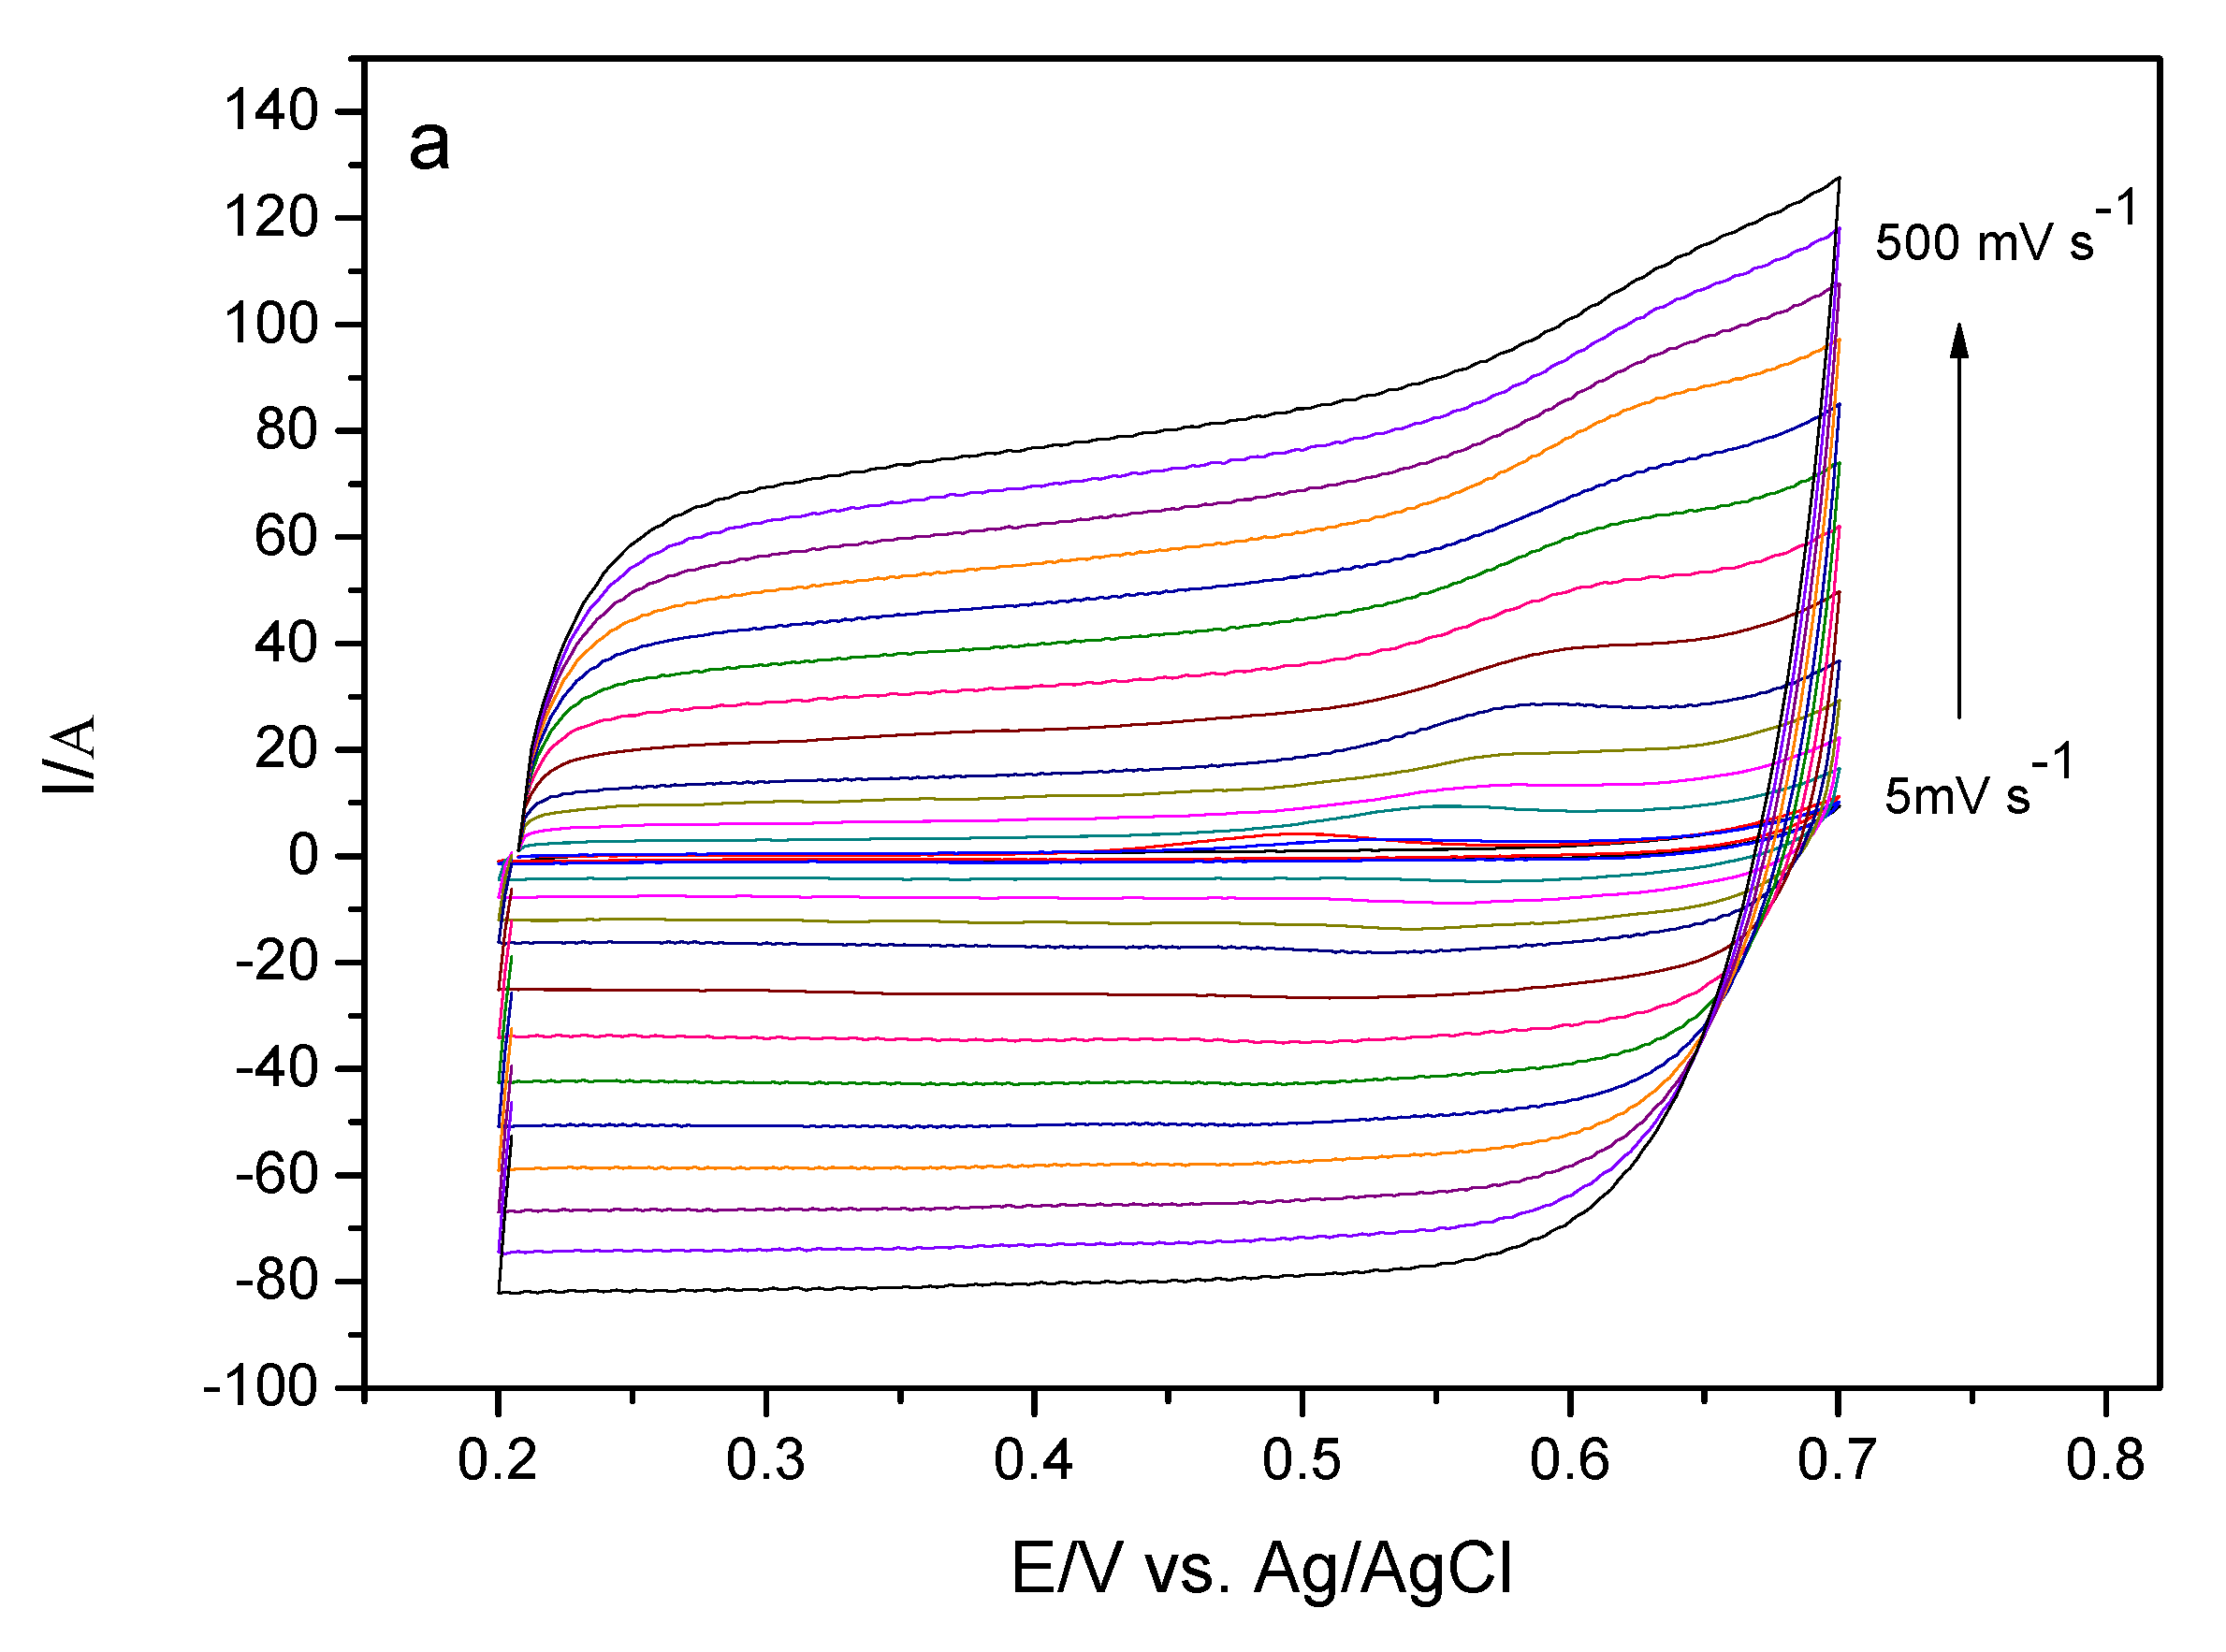
In order to evaluate some parameters and information about the kinetic properties of the sensor in the presence of EE, the influence of the scan rate on the oxidation of ethinyl estradiol was observed. Information on the oxidation process was obtained by analyzing the anode peak current, Ipa per cyclic voltammetry of this device in solution containing 175 μmol L−1 EE in 0.10 mol L−1 phosphate buffer solution pH 7.0.
Figure 8a illustrates the cyclic voltammograms of GCE-MWCNT-CoPc in the presence of EE at different scanning rates. It can be verified that in the cyclic voltammograms there is no peak during reverse sweep, so this process indicates an irreversible behavior.
In relation to
Figure 8b it is possible to observe the correlation between the peak current and the scanning rate, the linear relationship obtained suggests an electrode process controlled by adsorption of the electroactive species on the electrode surface. Another way to verify whether the mass transport at the electrode/solution interface is adsorption or diffusion is to analyze the angular coefficient of the relationship between the log of the peak current intensity and the log of the scanning rate. If the angular coefficient is close to 0.5, the mass transport is expected to be controlled by diffusion, whereas if the angular coefficient is close to 1.0, the mass transport should be controlled by adsorption of the electroactive species on the electrode surface [
36].
Figure 8c shows the relationship between log Ipa versus log ν for a solution of EE. Observing such a figure it can be verified that there was a linearity and that the value of the coefficient was 0.82. This value indicates that the mass transport is controlled by adsorption of the EE species on the surface of the electrode [
37,
38]. Further, this behavior of the analyte in front of the studied system can lead to the poisoning of the surface of the electrode, leading to a reduction in the intensity of the peak current.
In order to study the kinetic properties of electron transfer that occurs between the surface of the sensor and the EE in solution, parameters such as
α (electron transfer coefficient),
κ (velocity constant of electron transport) and
ne (number of electrons) were determined [
39,
40].
The theory proposed by Laviron [
41] for irreversible processes demonstrates that the width of the half height of the peak (δ
0.5) must be equal to
(for anode peak) where
n is the number of electrons. In this case, it is necessary to know the value of
α in order to calculate the number of electrons involved, and this can be done from the Tafel curve [
39,
40].
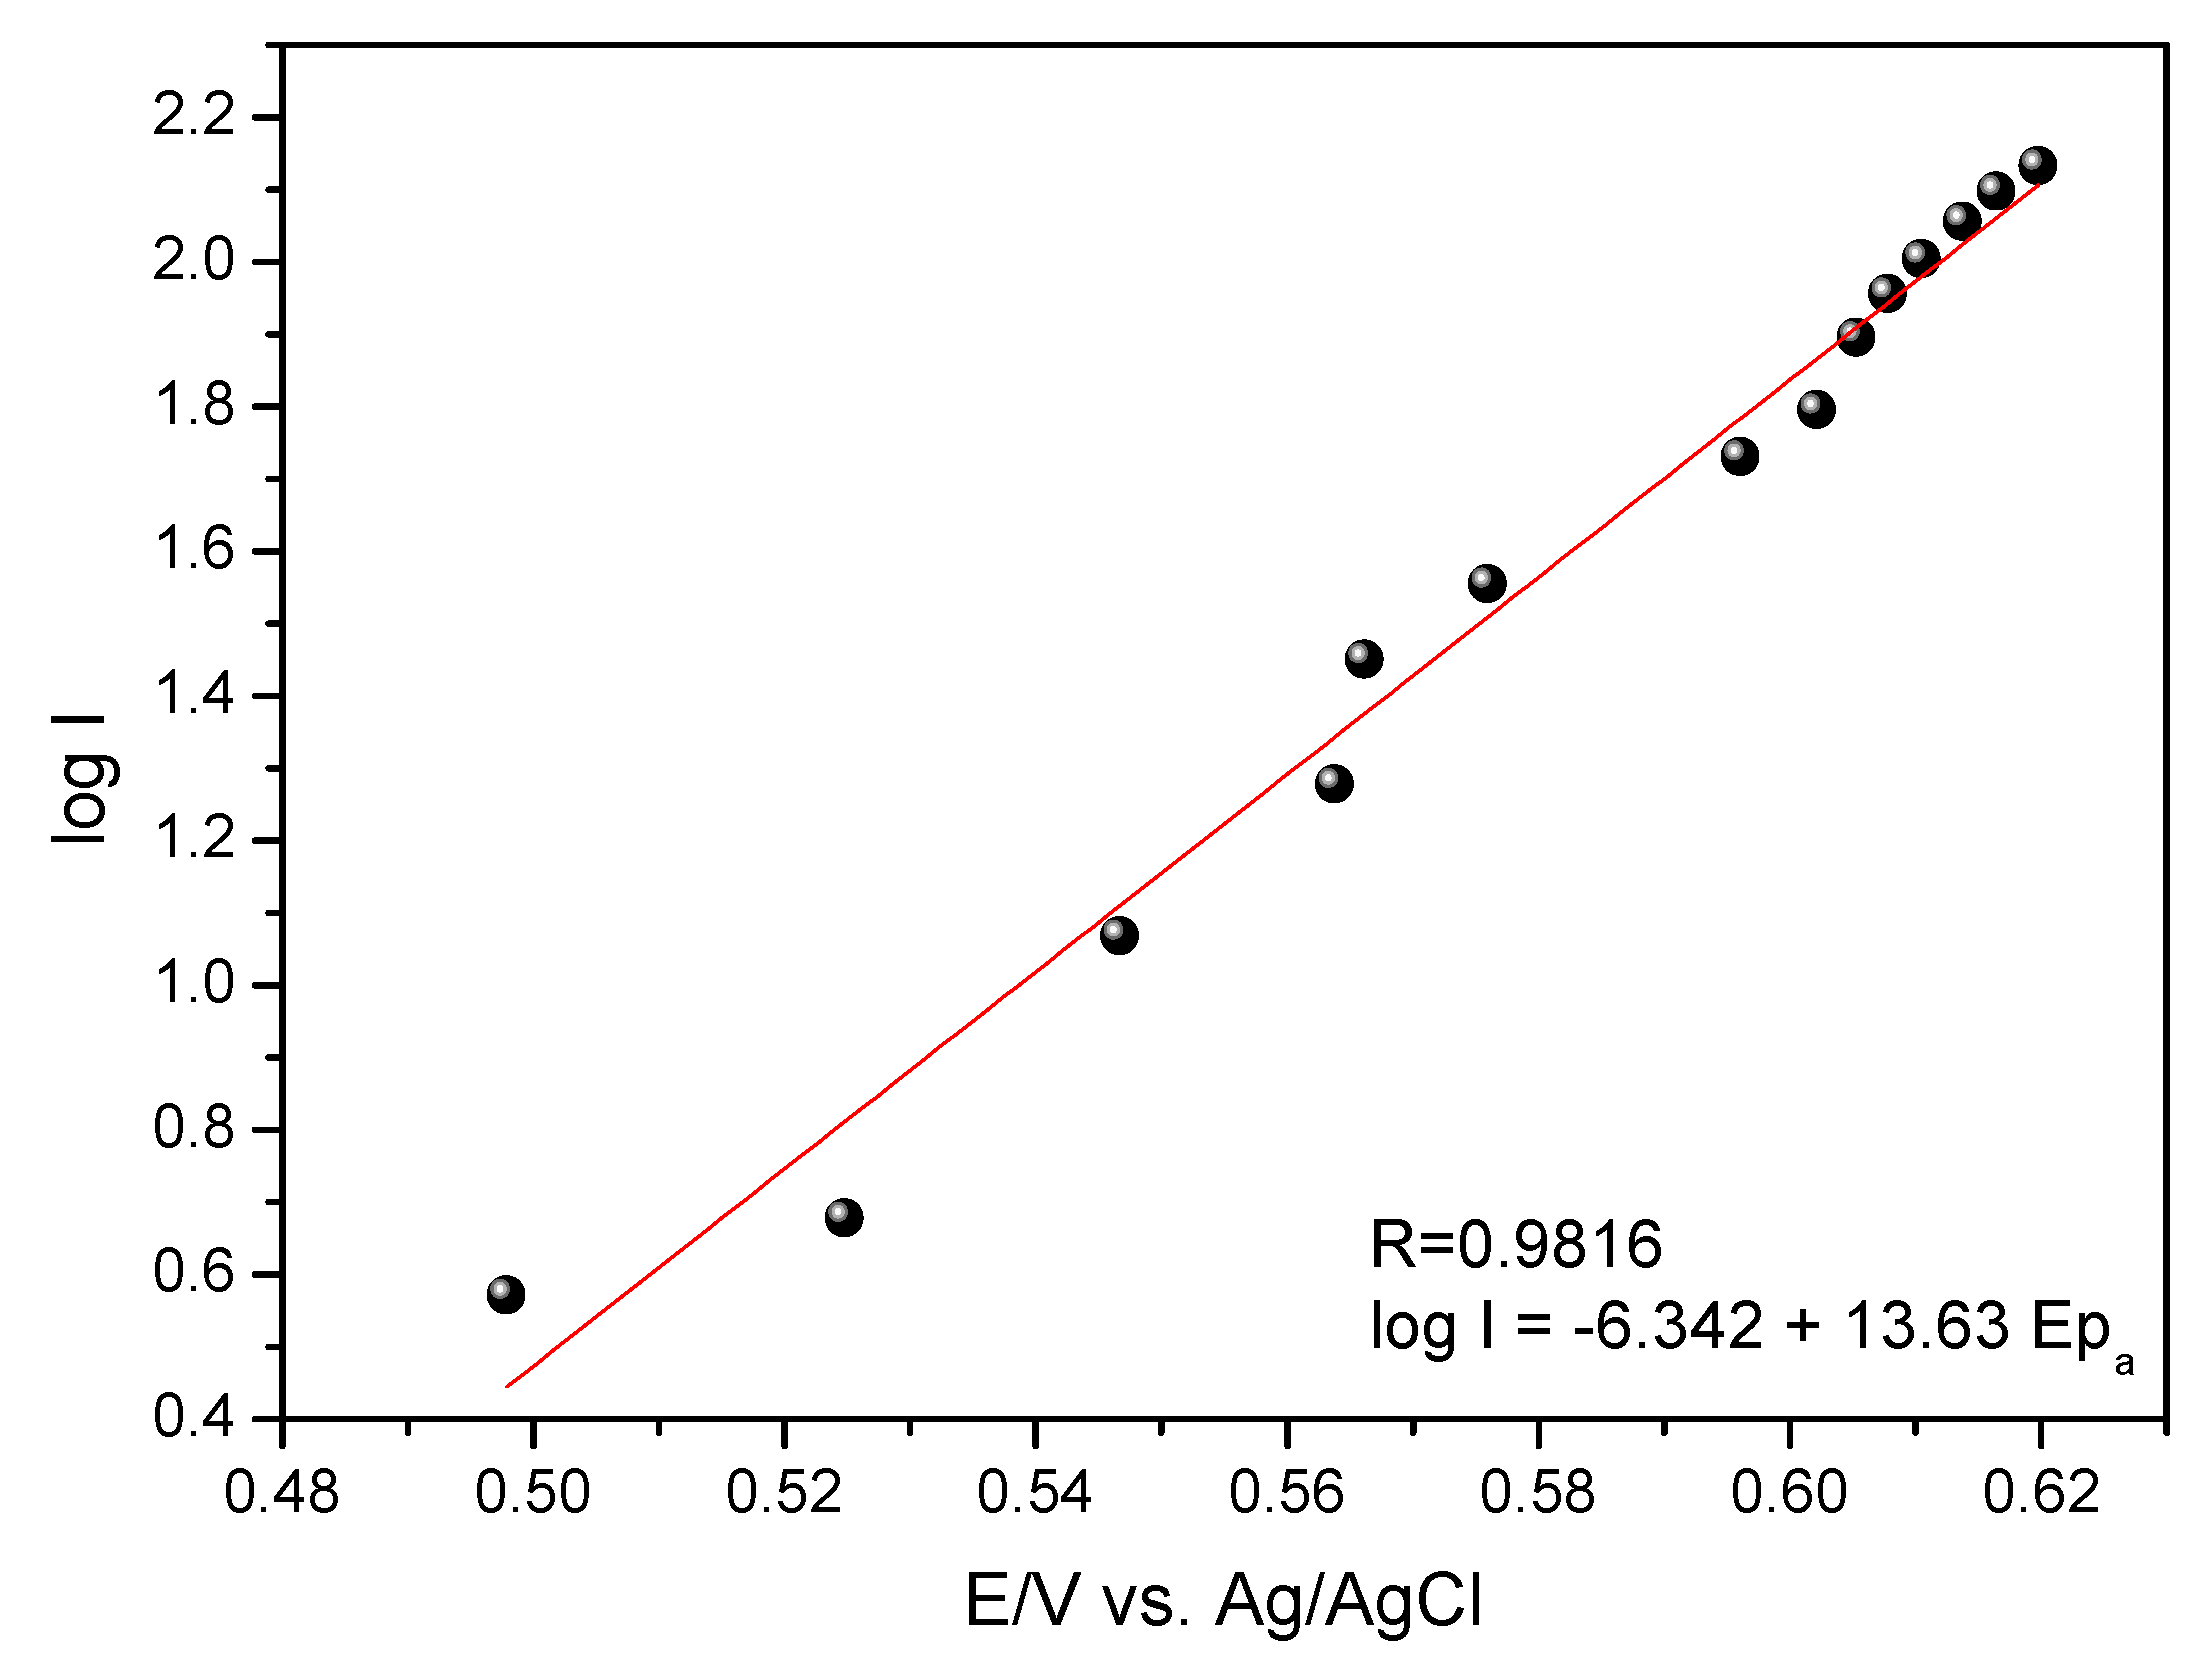
In the theory of Tafel, for the anodic peak, we have the following Equation (1):
where |
Sa| is the angular coefficient of the line obtained between the anodic peak potential as a function of the logarithm of the anodic current intensity (
Figure 9);
αa is the coefficient of electronic transfer; F is the Faraday constant (96,485.34 C mol
−1); R is the ideal gas constant (8.31 J mol
−1 K
−1), and T is the temperature (298.15 K). As can be seen in the expression, there is no need to know the number of electrons evolved in the process.
In
Figure 9 a linear relationship of Log I vs. E
pa and was adjusted by the following Equation (2):
Substituting the coefficient of Equation (2) into the Tafel Equation (1), the coefficient of electronic anodic transfer was calculated for the GCE-MWCNT-CoPc system with (αa) = 0.20.
Using this value of
αa (0.20) it was possible to calculate the number of electrons involved from Equation (3):
The proposed sensor presented low scan rate (10 mV s
−1) δ
0.5 around 45.56 mV, replacing this value in Equation (3) mentioned above, the value of
ne is approximately two electrons. In the literature [
5], the oxidation reaction of ethinyl estradiol involves the transfer of two electrons and two protons, corroborating with the value of
ne and calculated in this work.
The value of the electronic transfer coefficient calculated by the Tafel method was 0.20. The theory states that the closer to 1.0 is the value of the electron transfer coefficient, the closer to the reversibility is the system, so it can be concluded from the obtained result that the GCE-MWCNT-CoPc system is an irreversible system, presenting only a peak of oxidation.
Continuing the study of the kinetic properties, the electron transfer rate constant (
к) (Equation (4)) was determined. Through these parameters it is possible to know the behavior of the system under study.
K is the electron transfer rate constant; α is the coefficient of electronic transfer;
ne is the number of electrons involved in the process;
F is the Faraday constant (96,485.34 C mol
−1);
R is the ideal gas constant (8.31 J mol
−1 K
−1), and
T is the temperature (298.15 K).
Substituting the value of α = 0.20 and considering the scan speed equal to 1 V s−1 in Equation (4), the value of к = 62.70 s −1 is found.
The к value shows that the electron transfer rate between the EE and the modified surface of the electrode is high enough to allow the use of these materials as modifiers for the determination of ethinyl estradiol.
The estimated value of
к in conjunction with the value of
α [
31] suggests that the system is irreversible and has kinetic viability for the determination of ethinyl estradiol.
3.4. Optimization of Experimental Parameters
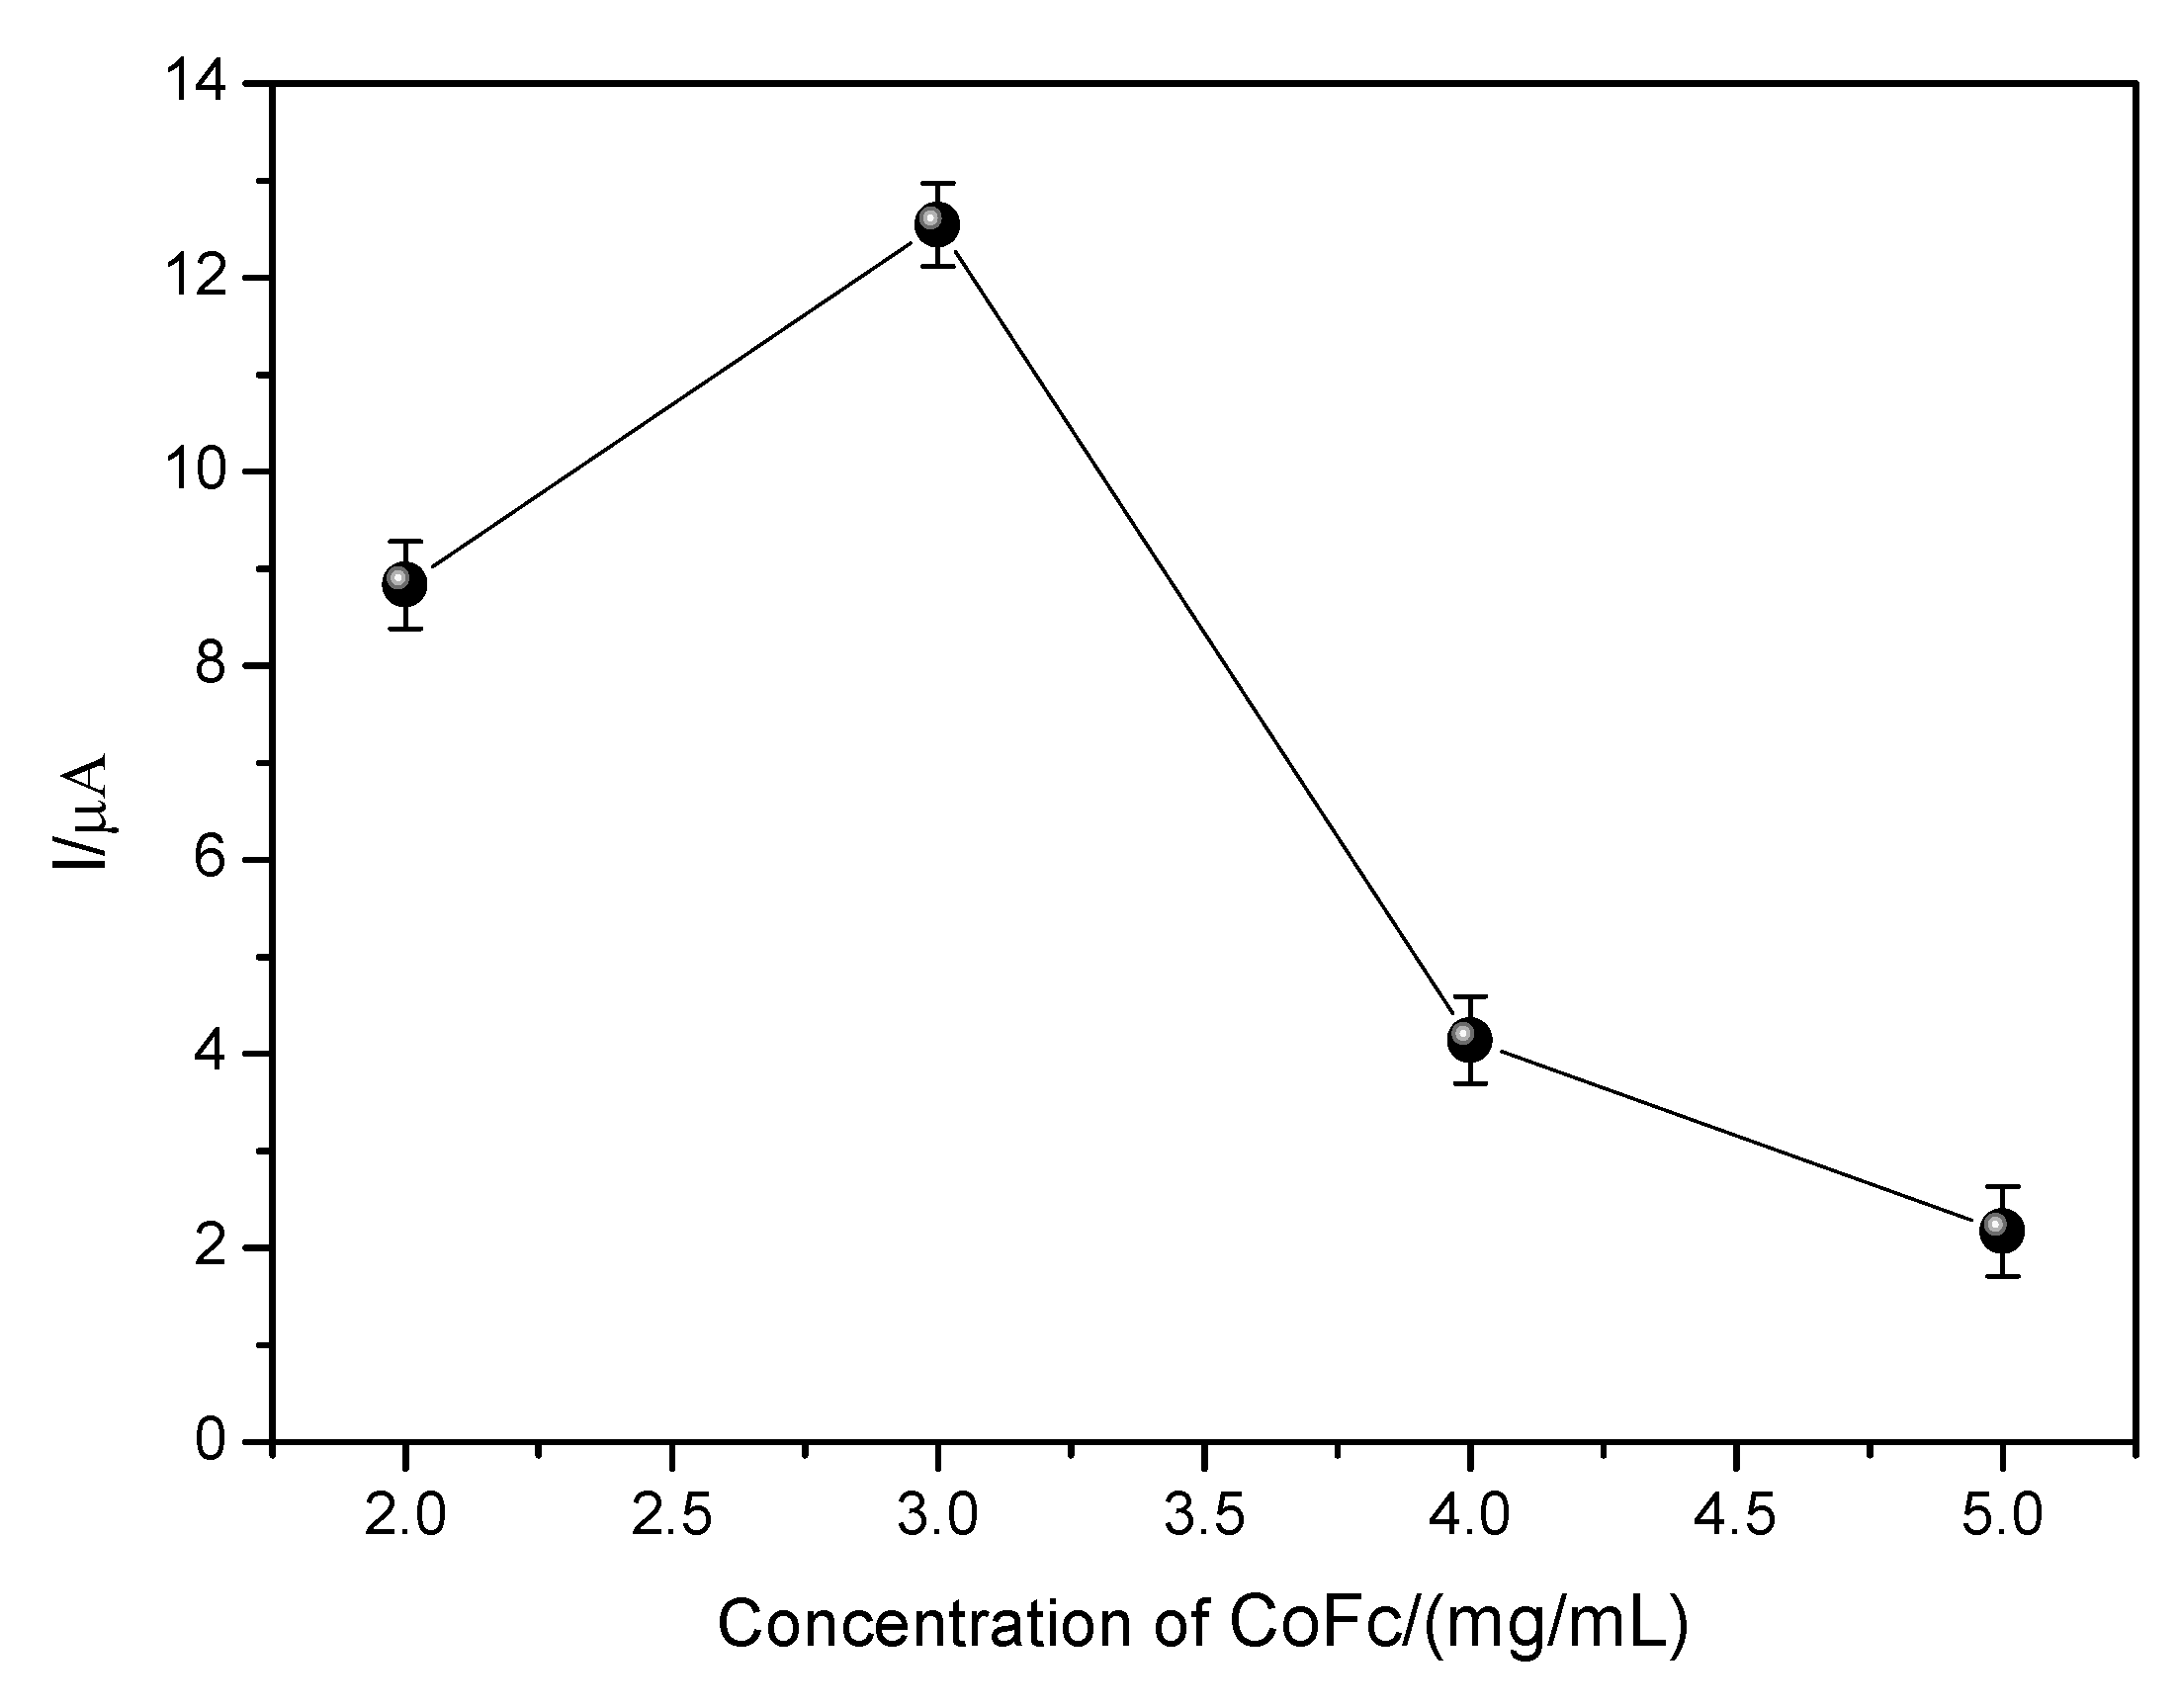
3.4.1. Evaluation of the Proportion of Cobalt II Phthalocyanine and MWCNT
In order to evaluate the influence of the amount of CoPc and MWCNT used in the modification of the working electrode for EE oxidation, the amount of MWCNT was maintained at 3.0 mg/mL and the amount of CoPc was varied. The data obtained are shown in
Figure 10.
As can be seen in
Figure 10, there was an increase in current variation (ΔI) to the concentration of 3.0 mg/mL followed by a drop in current variation to higher concentrations. Such behavior is expected since phthalocyanine probably promotes the catalysis of the EE oxidation process. The concentration that led to the best current variation (ΔI) of the EE was 3.0 mg/mL, so it was maintained in the following stages. For concentrations lower than this, the lower current value can be explained due to the fact that the amount of CoPc is insufficient to carry out the catalysis of the EE oxidation process. On the other hand, for concentrations above 3.0 mg/mL, a decrease in current variation (ΔI) can be observed, and this may be related to an increase in the film thickness formed on the electrode surface by CoPc, leading to a thicker film that may be hampering mass transport, or a loss of CoPc may be occurring through leaching.
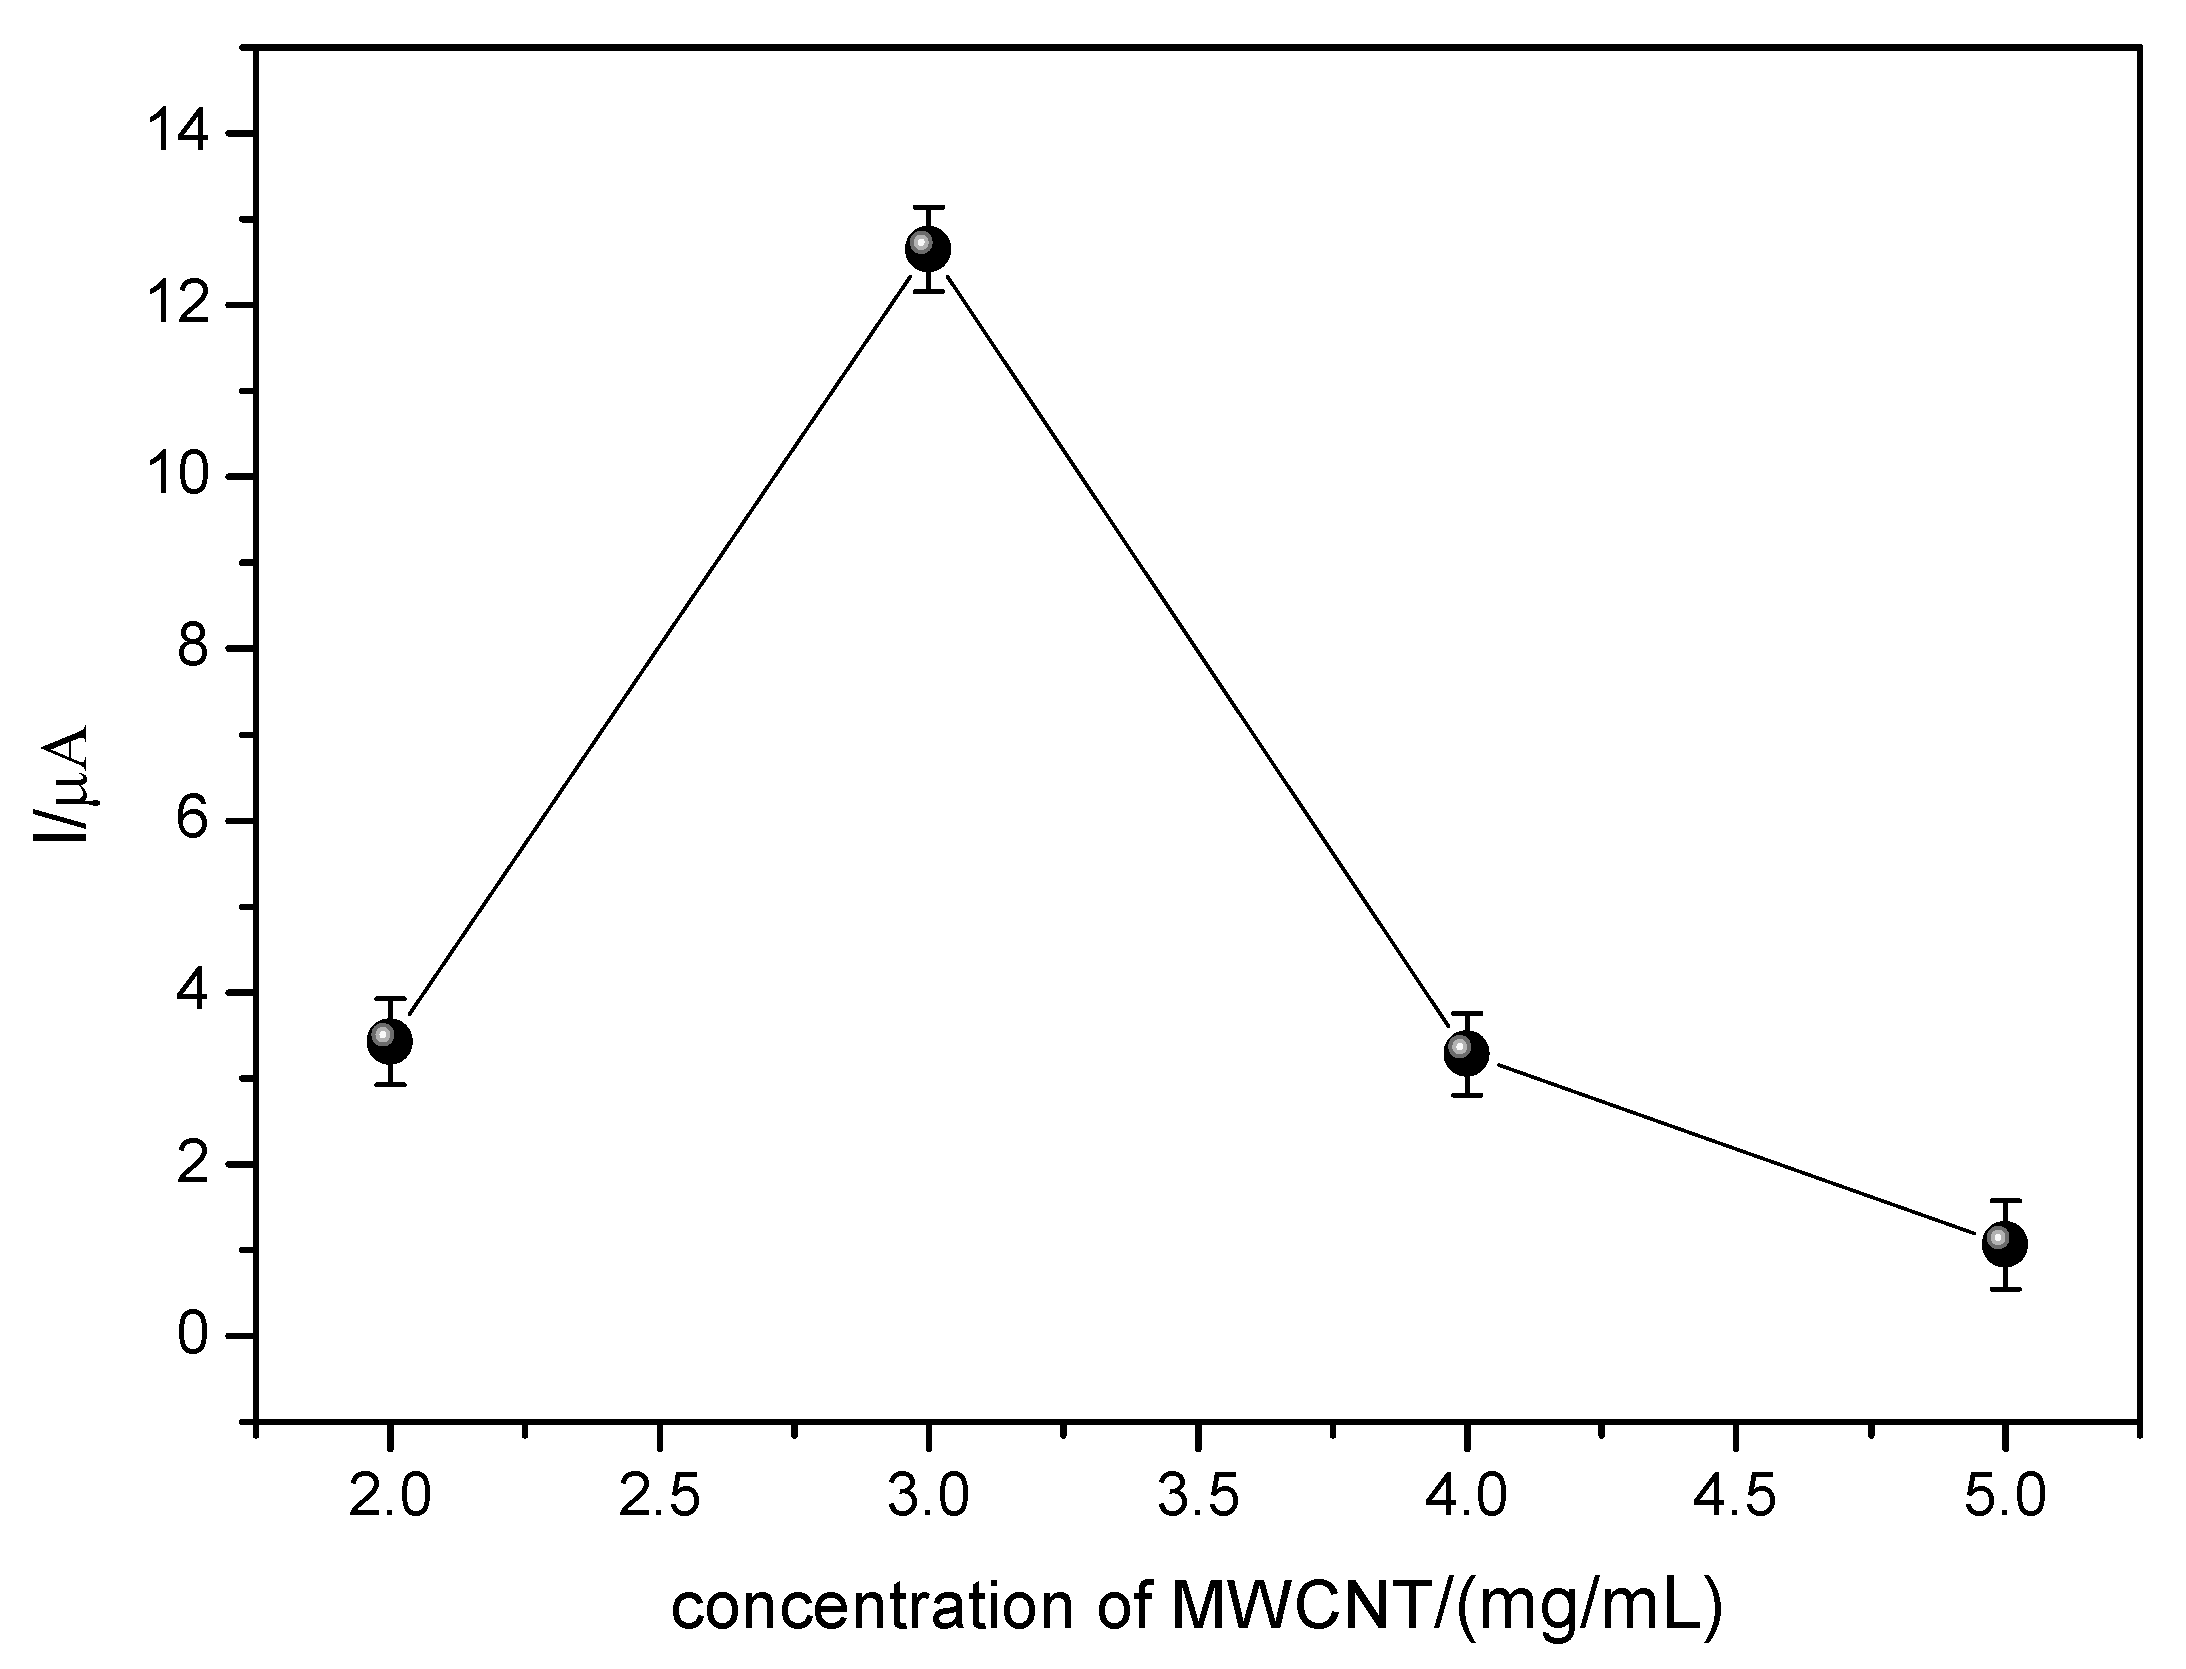
With the amount of CoPc optimized, the amount of MWCNT was varied. The results are shown in
Figure 11.
As previously discussed, the presence of carbonaceous material in the modification contributes to the increase of the electrical conductivity of the sensor as well as to facilitate the oxidation of the EE, since the MWCNT provides an increase of the surface area of the sensor, allowing a greater area of contact between the sensor and the analyte. In
Figure 11, it can be observed that the sensor presented greater variation of anodic peak current (ΔI) for the concentration of 3.0 mg/mL of MWCNT. Lower concentrations of MWCNT results in a lower current variation (ΔI), probably due to the fact that this concentration is insufficient to adequately immobilize the catalyst (CoPc), whereas in concentrations higher than 3.0 mg/mL there is a significant loss in the anodic peak current variation (ΔI), probably due to the excess of MWCNT causing the blockade of the catalytic sites of cobalt phthalocyanine, as well as increasing the barrier to mass transport.
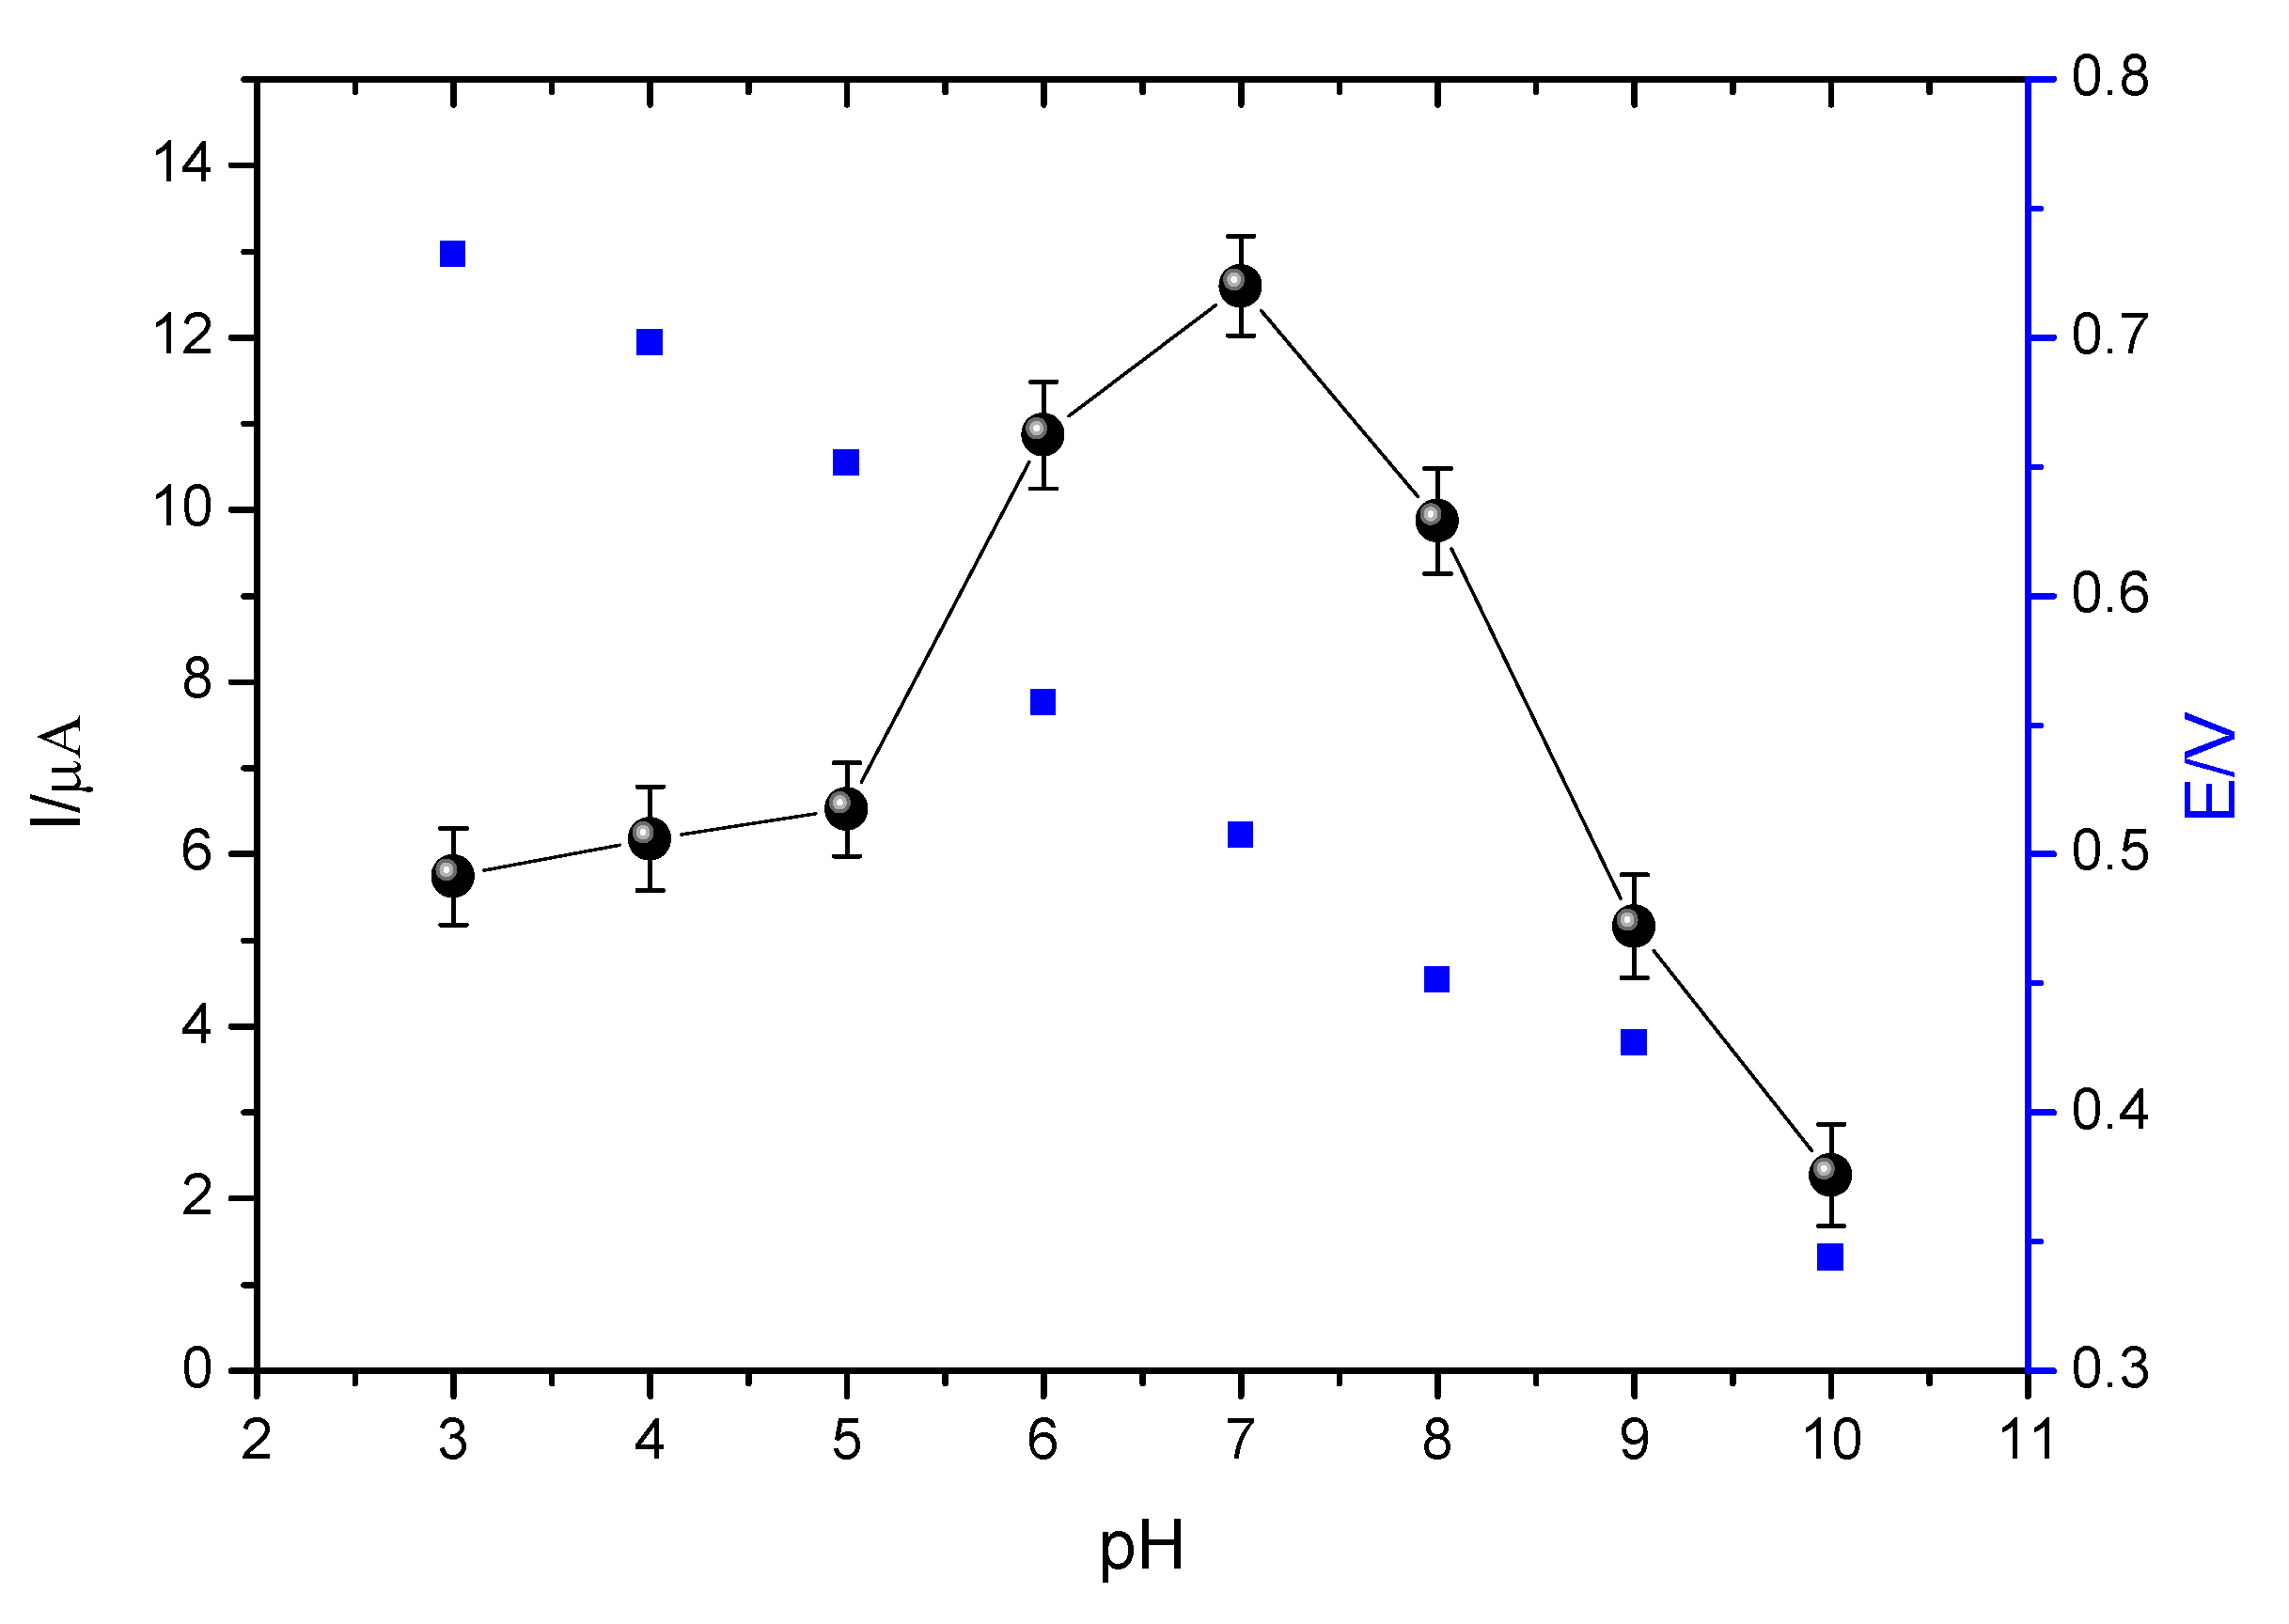
3.4.2. Influence of pH on EE Oxidation
The influence of the pH of the buffer solution on the electrochemical response of the EE oxidation on the sensor surface was performed using 0.1 mol L
−1 phosphate buffer solution at pH values of 3.0–10.0. The analytical responses were evaluated in terms of the variation of the anodic peak current, as can be seen in
Figure 12.
Analyzing
Figure 12, it is observed that the current variation becomes larger with the increase of the pH of the buffer solution in the pH range between 3.0–7.0. Thus, pH 7.0 was fixed because it presented the greatest current variation.
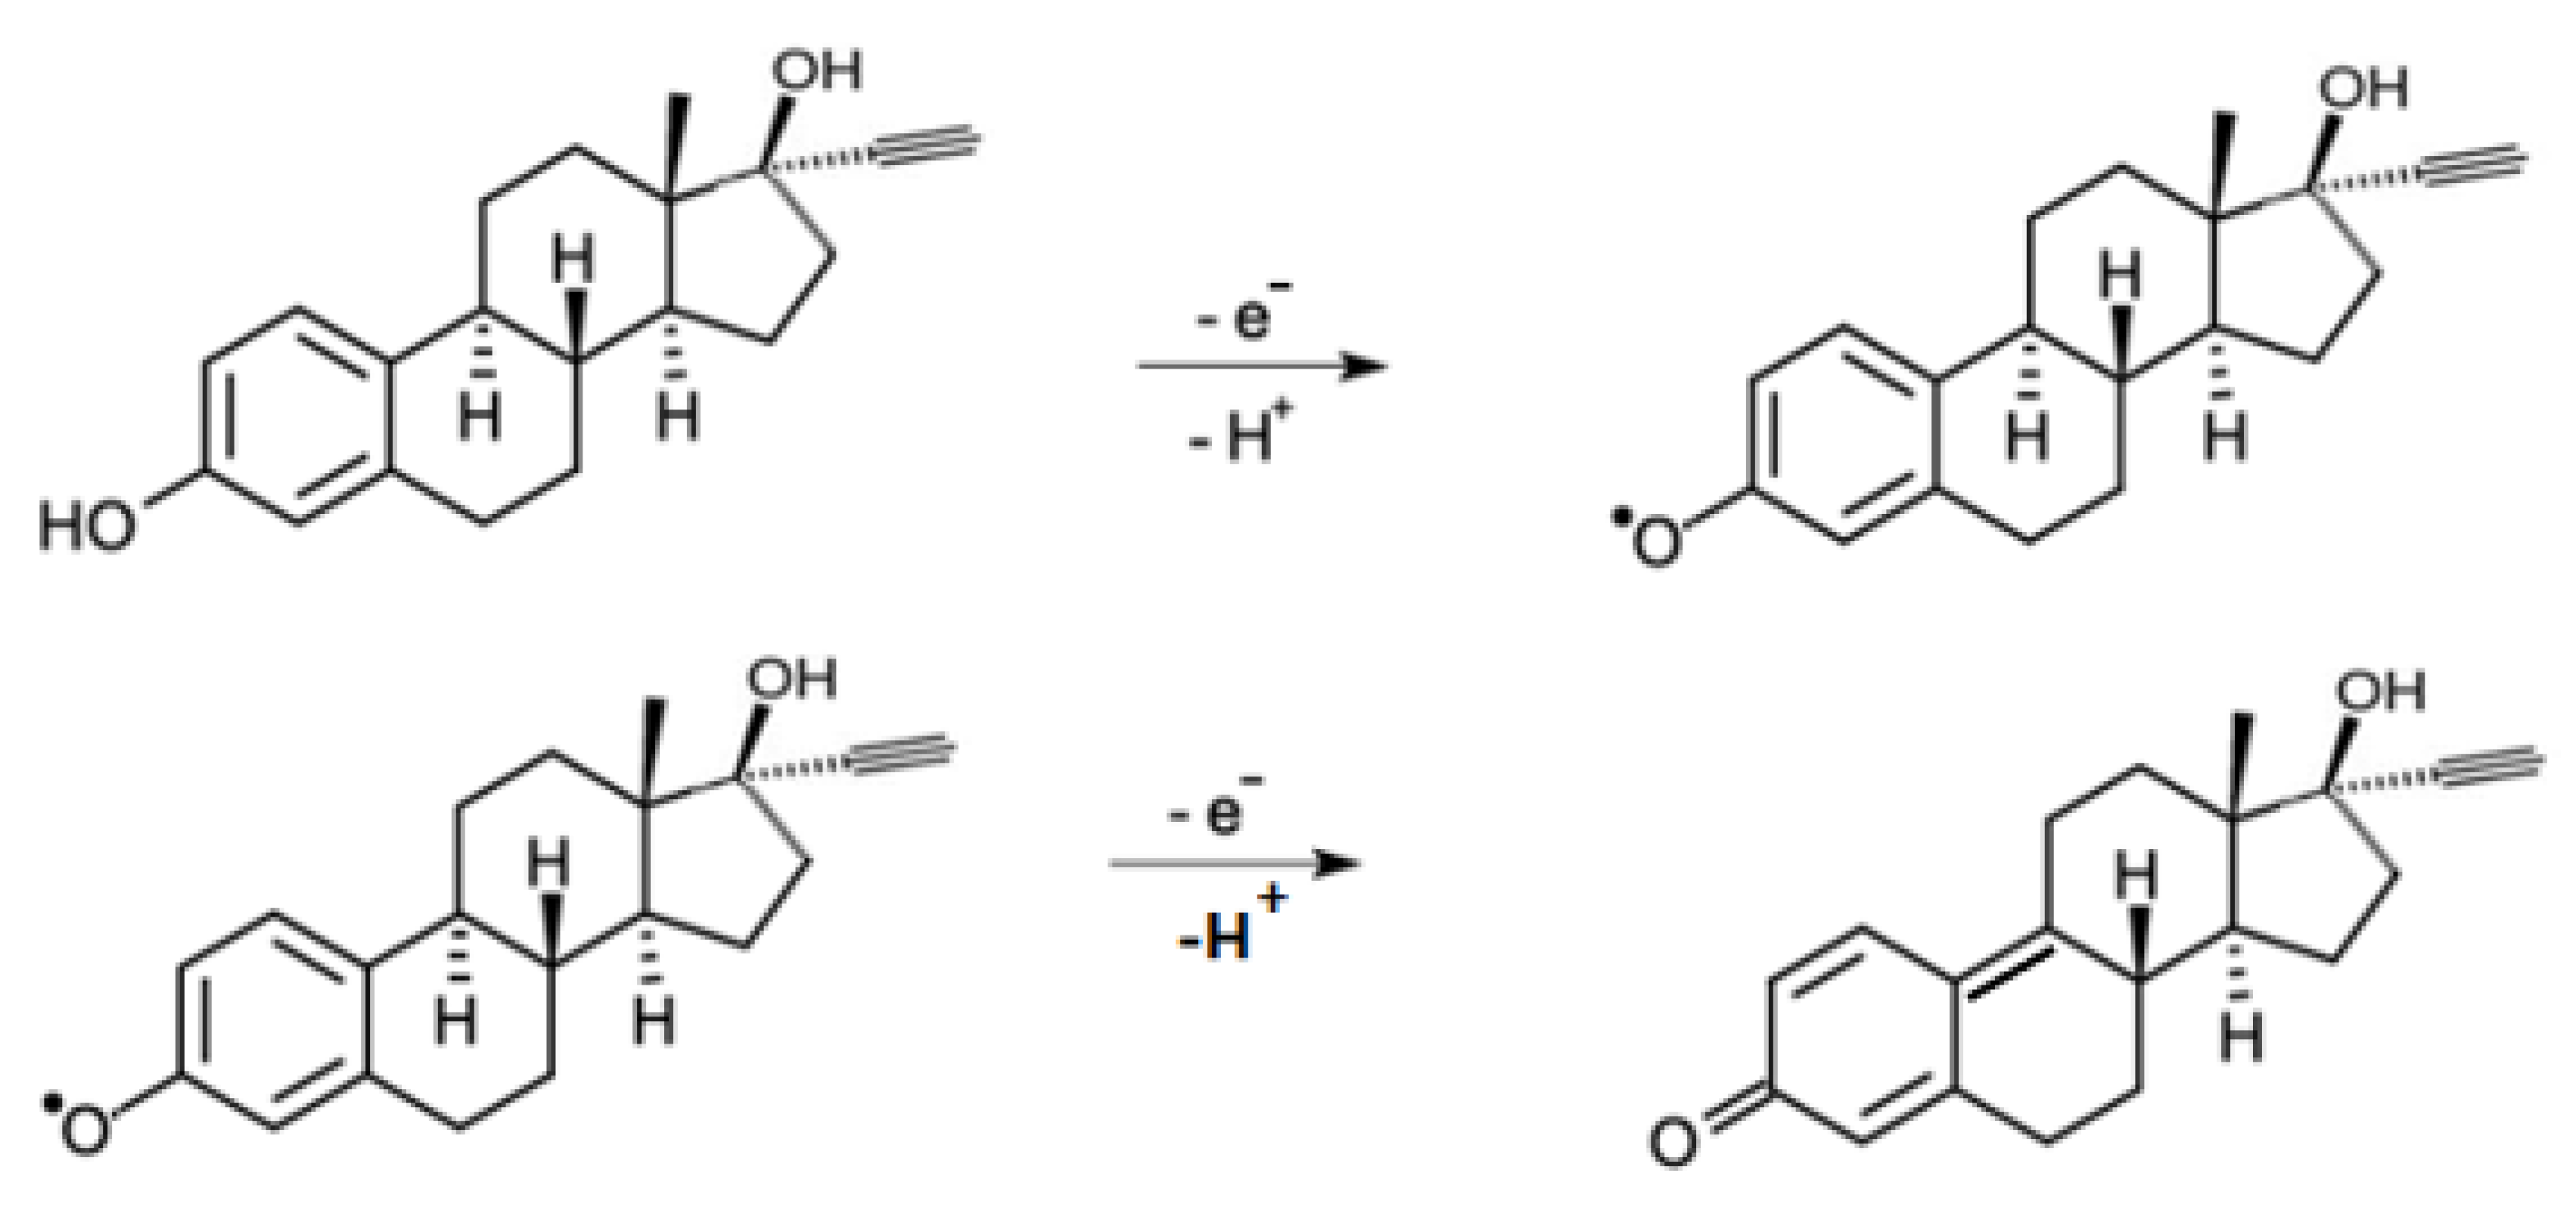
It is also observed that the potential and the intensity of the anodic peak current are shown to be dependent on the pH of the medium, that is, peak potentials move towards negative values with an increasing pH. In this way, it is possible to observe that the value of the coefficient of the curve of oxidation potential vs. pH (0.0560) is considerably close to 0.0590, associating such behavior to a Nerstian system, in which it is suggested that the number of electrons involved in the oxidation reaction is equal to the number of protons (H
+) [
42]. This is confirmed by the oxidation mechanism proposed in the literature (
Figure 13), which suggests that EE oxidizes in a 1:1 ratio of electrons and protons, an event occurring in the hydroxyl of the EE molecule bound to carbon 1 [
5,
43].
3.4.3. Evaluation of the Effect of the Buffer Solution
Next, different compositions of buffer solution, such as Hepes, Pipes, Britton-Robinson, and Phosphate, all in the same concentration, 0.1 mol L
−1 and pH 7.0, were evaluated in order to evaluate the effect on the sensor response.
Table 3 presents the results obtained.
It can be seen from the
Table 3 that the greatest current variation (ΔI) was reached when the phosphate buffer solution was used to perform the electrochemical measurements. This can be related to the greater mobility of phosphate ions, caused by the smaller size of this ion, when compared to the others, allowing an easier transfer of charge between the surface of the electrode and the solution, resulting in a larger ΔI.
The Hepes, Pipes, and Britton-Robsson buffers are more voluminous when compared to the phosphate buffer, making it difficult to transfer electrons between the surface of the electrode and the analyte, leading to a lower current variation.
3.4.4. Evaluation of the Ionic Strength in the Response of the Sensor to the EE Redox Process
The solutions containing pH under optimized conditions of buffer (phosphate) and pH (7.0) in different concentrations (0.05, 0.10, 0.15, 0.20, and 0.25 mol L
−1) were evaluated with the intention to verify the influence of the ionic force of the support electrolyte on the sensor response. Since the electrolyte support has to carry the charges of the electroactive species in order to maintain as constant the number of charges in the solution, it is necessary to make constant the number of opposing charges around the electroactive species during the oxidation and/or reduction process, and consequently to make the ionic interactions constant through the directed movement of cations and anions [
44]. The results are presented in
Figure 14.
From
Figure 14, it is observed that the concentration that presented the greatest current variation for the determination of EE was 0.1 mol L
−1. It can also be observed that the current variation increases to 0.1 mol L
−1 and then decreases. This is probably because the concentration of phosphate ions is insufficient to carry the charges present in the solution and above 0.1 mol L
−1 it is possible that there is a competition between the analyte and the phosphate ions up to the surface of the electrode, which justifies the lower intensity in the current variation.
3.5. Optimization of Operational Parameters
Three different electroanalytical techniques were evaluated, namely cyclic voltammetry (CV), square wave voltammetry (SWV), and differential pulse voltammetry (DPV), with the objective of ascertaining which technique presented the highest sensitivity for the determination of EE using GCE-MWCNT-CoPc. The optimized operating parameters of each technique are indicated in the
Table 4.
After finishing the studies concerning the optimization of the operational parameters related to the voltammetric techniques studied and the construction of analytical curves referring to them, it was possible to compare the sensitivities obtained for the determination of the EE by the proposed sensor. According to the results presented in
Table 5, the technique that presented a higher sensitivity for ethinyl estradiol determination using the sensor under study was square wave voltammetry.
The SWV was chosen for the validation of the proposed methodology and application in real samples.
3.6. Proposed Method Validation
The validation of analytical methodologies is extremely important because it ensures that the analytical methodology is accurate, precise, linear, and stable over a specific range of analysis. The validation of the proposed method was performed according to ANVISA [
45] standards (RDC nº 899, 2003) for drug analysis, based on linearity, LD, LQ, accuracy, precision, and stability.
The construction of the analytical curve is very important in the development of an analytical methodology, since it establishes the response of the method to known concentrations of the analyte and considers the estimation of the standard deviation and the angular coefficient of the equation of the line. The analytical curve for EE determination was obtained from the minimum measured concentration to the maximum concentration since the concentration to be analyzed in some real samples (water and milk) is unknown. Therefore, the concentration range was 2.5–90.0 μmol L−1.
The results can be observed in
Figure 15, which shows the voltamograms obtained and the analytical curve. The GCE-MWCNT-CoPc sensor showed linearity in the concentration range of 2.5 to 90.0 μmol L
−1, with a linear correlation coefficient of 0.990 for
n = 8 and a sensitivity of 0.179 μA/μmolL
−1. The equation obtained was:
By means of the analytical curve it is possible to establish other important parameters (LD and LQ) for the validation of the proposed methodology.
Table 6 presents these results.
The validation of the methodology continued with the study of the parameters of accuracy and precision. ANVISA establishes that the precision evaluation is performed at two levels: repeatability (between-day analysis), that is, an agreement of results in a short period of time and intermediate precision (within-day), and concordance of results obtained on different days. The parameter accuracy is the proximity of the results obtained by the method under study in relation to the concentration of the analyte used.
The results of between-day precision and within-day levels of concentration of 5; 45 and 85 μmol L
−1 for EE are organized in
Table 7.
According to ANVISA, the method is considered precise and accurate when it presents a variation of less than 5% between the analyses performed. Therefore, the methodology proposed was precise and accurate.
The stability of the standard ethinyl estradiol solution was evaluated in terms of freezing and thawing time and temperature as can be seen in
Table 8. The EE solutions were analyzed at three different concentrations (5, 45, and 85 μmol L
−1).
As can be seen from the obtained values, there were small variations among samples with a DPR well below 5%, as recommended by ANVISA.
Study of Selectivity
Considering the importance and necessity of the determination of EE in complex real samples, studies were carried out on the selectivity of the proposed method investigating the behavior of possible interfering chemical species, which in the case of EE are other steroid hormones with a structure similar to EE, such as estrone (E1) and 17β-estradiol (E2), both present in water samples [
6]. This study was carried out with the aim of applying the method to water samples. With all optimized conditions, the voltammograms were obtained in solutions containing EE (25 μmol L
−1), E1 (1250 μmol L
−1) and E2 (1250 μmol L
−1).
According to Anvisa (2003) [
45] the selectivity of a method can be determined by the positive results containing the EE (analyte under study), compared to the negative result obtained in samples that do not contain EE but contain the possible interfering species.
According to the results obtained in
Table 9, the sensor underwent significant interference by Estrone and 17β-Estradiol. This was expected since estrone and estradiol have a similar molecular structure and the oxidation potential is close to the EE.
The chemical compounds found in pharmaceutical formulations that have EE as the active principle are not electrochemically active, so the study of interferents was performed only for water and milk samples.
In view of the presented results, it is possible to conclude that the methodology proposed for the determination of EE with the GCE-MWCNT-CoPc sensor was evaluated according to the requirements established by ANVISA.
3.7. Application of the Method Developed for EE Determination
3.7.1. Pharmaceutical Formulation
Under optimized conditions the proposed sensor was applied to the determination of EE in pharmaceutical samples (Fertnon-Mabra) prepared in triplicate.
Table 10 illustrates the comparison between the value of the label and the result obtained using the proposed sensor.
As can be seen in
Table 10 there is a good recovery of EE. In order to verify the statistical differences between the results, the Student’s t test with 95% confidence level was applied to the
t value of 4.25, which is lower than the critical value of 4.30, proving that there is no difference between the two values. This shows that the proposed sensor GCE-MWCNT-CoPc is a great alternative for the determination of ethinyl estradiol, in addition to presenting an easy and low-cost preparation.
3.7.2. Rio Water Sample
The developed sensor was applied to the determination of EE in river water samples. For this, the buffer solution was prepared with the water collected. The first study was performed in the absence of EE, that is, no addition of the analyte was performed in the electrochemical cell, proving that the water sample of the river did not contain EE. The EE additions were then performed in three distinct concentrations (in triplicate).
Table 11 illustrates the comparison between the added concentrations and the result obtained using the proposed sensor. As can be observed, there was a good EE recovery. This demonstrates that the proposed sensor (GCE-MWCNT-CoPc) is a great alternative for the determination of ethinyl estradiol in environmental samples.
In order to verify the statistical differences between the results, the Student t test with 95% confidence level was applied, presenting values below the critical value of 4.30, showing that there is no difference between the values.
3.7.3. Milk Sample
EE can be used as a steroid in animals, so it is important to perform the analysis in foods of animal origin, such as milk. Furthermore, there are reports that have suggested the occurrence of precocious puberty in children, prostate cancer, and uterine cancer might be related to the presence of estrogen residues in food [
12]. Thus, the proposed methodology was used to determine EE in milk samples. The sample was treated with ethanol to eliminate possible interferences (proteins, fats, and lactose).
The results obtained for quantification of EE in milk sample are presented in
Table 12. To verify the statistical differences between the results, the Student’s t test with 95% confidence level was applied, presenting values below the critical value of 4.30, showing that there is no difference between values.
As can be seen from
Table 12, this result suggests that the method is satisfactory for determination of EE in milk samples.
In order to compare the values obtained by the proposed method of LD and linear range of response, we searched the literature for current works which deal with the determination of EE by means of sensors, and these values can be observed from
Table 13. The value of LD used for such comparison was obtained on the first day of validation (2.20 μmol L
−1).
The proposed sensor presented detection limit close to the values reported in the literature.
The GCE-MWCNT-PcCo still presented good sensitivity and rapid EE detection. In addition to an easy and fast preparation of the sensor, the technique used (SWV) entails simple application and rapid response. The materials used as modifiers are easily commercially available and the amount used is very small, making this sensor economically viable. In addition, it presented a good recovery for three different samples (pharmaceutical, river water, and milk) proving that the proposed sensor is feasible for the quality control of pharmaceutical and food samples, as well as for environmental control.
4. Conclusions
In relation to the results obtained by the optimization of the experimental conditions, it was possible to conclude that the materials chosen for the modification of the sensor (MWCNT and CoFc) provided a higher current gain, thus improving the sensitivity of the sensor.
The electrochemical characterization of the sensor indicated that the oxidation process of the EE is irreversible and that the mass transport at the interface electrode/solution is controlled by adsorption of the electroactive species (EE) on the surface of the electrode.
The application of the sensor in real samples was feasible and adequate, presenting good EE recovery values, both in pharmaceutical samples, as well as in river and milk water samples. In addition, the proposed method is low cost and easy to execute.
In short, considering all the parameters presented, it can be said that the developed sensor represents a fast, easy-to-execute methodology with a high sensitivity and selectivity for ethinyl estradiol determination. Furthermore, it is also economically feasible since reagent expenditure is relatively small and the instrumentation used is of low cost when compared to the instrumental methods of analysis. These characteristics make the sensor an attractive alternative for application ito the analysis of environmental samples, for the quality control of pharmaceutical formulations, and in analyses of food samples.


