Article

Colorimetric Sensing of Pb2+ Ion by Using Ag Nanoparticles in the Presence of Dithizone

1
Department of Chemistry, Universitas Gadjah Mada, Sekip Utara, Yogyakarta 55281, Indonesia
2
Department of Chemical Analysis, Politeknik AKA Bogor, Bogor 16154, Indonesia
*
Author to whom correspondence should be addressed.
Chemosensors 2019, 7(3), 28; https://doi.org/10.3390/chemosensors7030028
Submission received: 20 May 2019 / Revised: 25 June 2019 / Accepted: 26 June 2019 / Published: 28 June 2019

Abstract

:
Colorimetric analysis of heavy metal ions can be realized by the aid of Ag nanoparticles to improve the analytical characteristics. The method is based on the localized surface plasmon resonance (LSPR) properties of the Ag nanoparticles (AgNPs). In this work, we applied the AgNPs with the addition of dithizone to further improve the selectivity and sensitivity of Pb2+ analysis. Colorimetric sensing of Pb2+ ions based on the polyvinyl alcohol (PVA)-stabilized-colloidal AgNPs in the presence of dithizone is reported. A linear decrease in the AgNPs LSPR absorbance at 421 nm was observed along with the increase in the Pb2+ concentration in the range of 0.50–10 µg/L. The other ions give a minor change in the LSPR absorbance of colloidal AgNPs. The Pb2+ limit of detection, the limit of quantification, and sensitivity were found to be 0.64 ± 0.04 µg/L, 2.1 ± 0.15 µg/L, 0.0282 ± 0.0040 L/µg (n = 5), respectively. The obtained sensitivity is comparable with that of the immunosensing method. The proposed method could offer a good alternative for colorimetric analysis of Pb2+ ions by using nanoparticles in the presence of ligands, which can improve selectivity.

1. Introduction

Colorimetric sensing based on the nanoparticles’ localized surface plasmon resonance (LSPR) for rapid detection of the analytes with high sensitivity and selectivity have been progressing well with the aid of the development of nanoscience and nanotechnology. A complete review on the LSPR spectroscopy of metallic nanoparticles for chemical and biological sensing is available [1]. The inert metallic nanoparticles have been widely studied for an improved sensitive and selective response towards various analytes, especially for heavy metal ions and organic compounds. Heavy metals such as lead, mercury, chromium, and cadmium [2] are of interest to researchers due to their negative impact on the environment.
Among toxic heavy metals in the environment, lead (Pb) is the most abundant in the atmosphere [3]. It is also among the top five heavy metals present in water [4], which are Hg, Pb, As, Cr, and Cd. Car batteries still employ lead for both anodes and cathodes and lead has been used for many decades in paint production. In some countries, lead smelters are still in use for recycling lead metal electrodes [5]. Therefore, lead concentration in soil and water in some regions keeps increasing along with the increase in car battery reprocessing and paint degradation. Lead is one of the toxic metals, and its presence in the environment always poses a threat to aquatic lives. For a human being, the high level of Pb2+ in the blood can cause severe health problems, especially for children. In a certain area, the Pb2+ content in children’s blood serum is alarmingly high [6], and is exceeding the safe limit of 1.00 μg/L. Therefore, sensitive detection of Pb2+ in environmental and biological samples is essential. The limit of detection of Pb2+ analysis by UV-Vis spectrophotometry is still worse than that of atomic absorption spectrometry, and Inductively Coupled Plasma-Mass Spectrometry-Optical Emission Spectrometry (ICP-OES) or Inductively Coupled Plasma-Mass Spectrometry (ICP-MS). The limit of detection by Inductively Coupled Plasma-Mass Spectrometry (ICP-MS) method is 0.10 µg/L [7]. Meanwhile, the UV-Vis spectrophotometry offers a limit of detection in the range of a few mg/L.
Nanoparticles like Au, Ag, and Cu have been extensively used in colorimetric detection owing to their superior optical property known as LSPR. LSPR is the phenomenon where the collective oscillation of free electrons in the conduction band occurs due to resonance with incident light in the visible region. Silver nanoparticles (AgNPs) are also studied mainly for a wide array of antibacterial [8] and colorimetric sensing applications [9]. AgNPs have unique and size-dependent optical and electronic properties. In the colorimetric sensing application, starch-stabilized colloidal AgNPs show a linear decrease in the LSPR with the increase in the concentration of hydrogen peroxide [10]. Many reports also show that gold nanoparticles (AuNPs) are essential for LSPR-based sensing of Hg2+ in aqueous media in the presence of quaternary ammonium salt. The Hg2+ limit of detection is about 30 nM [11]. Glutathione conjugated gold nanoparticle-based colorimetric assay can also be used for selective detection of Pb2+ from plastic toys, paints, and water samples [12]. The N-acetyl-L-cysteine-stabilized silver nanoparticles have also been used for Fe3+ detection [13]. Starch-stabilized AgNPs were used for a colorimetric method for the detection of Hg2+ [14]. Pyridyl-appended calix[4]arene has been employed to modify AgNPs that show high selectivity for sensing of Fe3+ [15].
The uses of metal nanoparticles, especially Au and Ag in the colorimetric sensing of heavy metal ions based on localized surface plasmon resonance (LPSR) have been reviewed [16], including Hg2+ [17] with a number of ligands. The origin of this sensing mechanism is due to the metal nanoparticles’ aggregation upon contact with specific ligands or molecules [16]. A new analytical reagent cetyltrimethylammonium bromide (CTAB) and dithizone product-modified gold nanoparticle dispersion were developed for colorimetric sensing of 10 types of heavy metal ions that are Cr(VI), Cr3+, Mn2+, Co2+, Ni2+, Cu2+, Zn2+, Cd2+, Hg2+, and Pb2+. Dithizone was hydrolyzed first by use of NaOH solution before reaction with the targeted ions [18].
Dithizone has been used in the analysis of Pb2+ by UV-Vis spectrophotometry. Zargoosh et al. reported the use of dithizone immobilized on agarose membrane in the sensing of Hg2+ and Pb2+ that showed a very low limit of detection (LOD) of 2 nM (0.40 µg/L) and 4 nM (0.83 µ/L), respectively [19]. The agarose membrane improved the sensitivity and selectivity of UV-Vis spectrophotometry method of both ions. However, the solution pH had to be adjusted to either 2.5 or 5.2, to selectively analyze Hg2+ and Pb2+, respectively.
In this work, we report on the application of AgNPs for sensitive and selective sensing of aqueous Pb2+ ions after they form a complex with dithizone. Dithizone is a ligand known to be more selective to form a complex with Pb2+ than other ions at pH 5–6. It also has a sulfide group that can form a covalent bond with metallic AgNPs. The AgNPs were added to the solution after the Pb(II)-dithizone complex was formed. The LSPR absorbance of AgNPs, instead of the Pb(II)-dithizone, was measured at 421 nm. AgNPs start to aggregate when they come into contact with Pb(II)-dithizone complex and their LSPR absorbance decreases, which can be used to detect Pb2+ ions indirectly. It could be a solution for rapid, selective, and sensitive analysis of Pb2+ in the environment and clinical samples.

2. Materials and Methods

Silver nitrate, ascorbic acid, dithizone, polyvinyl alcohol (PVA) with an estimated molecular weight of 145,000 g/mol, sodium hydroxide, ethanol, ammonia, potassium cyanide, and nitric acid were purchased from Merck, Germany. The standard solutions of 1000 mg/L cations were also supplied by Merck. A JEOL JEM-1400 transmission electron microscope (TEM) (JEOL, Tachikawa, Japan) was used for microscopic imaging of produced AgNPs. A Rigaku XRD machine (Rigaku, Tokyo, Japan) was used to record the XRD pattern of AgNPs. The LSPR spectra were recorded by using a UV-1700 Shimadzu spectrophotometer (Shimadzu, Kyoto, Japan). Double distilled water was used throughout the work.

2.1. Preparation and Characterization of Ag Nanoparticles

AgNPs were prepared in 0.25% polyvinyl alcohol (PVA) solution. The PVA solution was prepared by dissolving 0.25 g of its powder in the doubly distilled water and was diluted to mark using a 100 mL volumetric flask. The Ag+ initial concentration was set at 1.0 × 10⁻² M. The ascorbic acid concentration was predetermined at 5.0 × 10⁻³ M. A 100 mL solution containing 0.25% PVA, 1.0 × 10⁻² M Ag+, and 5.0 × 10⁻³ M ascorbic acid was stirred using a hot plate magnetic stirrer while being heated. The solution pH was maintained at 8 by adding a few drops of 0.10 M NaOH solution. The temperature was kept at 80–90 °C. The process took about 1 h. When the solution color changed from colorless to yellow, the heating and stirring were terminated. The colloidal AgNPs in 0.25% PVA solution had a yellow color. The LSPR absorbance was measured using a UV-Vis spectrophotometer. The colloid was stable up to 2 months as indicated by a small decrease in the LSPR absorbance. The produced colloidal AgNPs were diluted with double distilled water to prepare the required concentrations. The microscopic image of the colloidal AgNPs was recorded by using TEM with an accelerating voltage of 120 kV. For XRD measurement, the colloidal AgNPs were first separated by a centrifuge with the spinning rate of 17,000 rpm and air-dried before measurement.

2.2. LSPR Absorbance Measurement of Colloidal AgNPs in the Presence of Pb2+ Ions

A series of Pb(II)-dithizone solutions with different Pb2+ concentrations were prepared in 25 mL volumetric flasks. The dithizone solution was prepared according to the procedure in the literature [20]. The dithizone concentration was adjusted so that the Pb2+ to dithizone final molar ratio was approximately 1:2. Please note that a Pb2+ to dithizone molar ratio of 1:3 is also possible, meaning that the concentration of dithizone should be twice or more of the Pb2+ concentration. Colloidal AgNPs were added to each solution to make a final Ag concentration of 5.2 mg/L. Each mixture was stirred and allowed to settle for 15 min before recording its LSPR spectrum. The solution pH was controlled by using NaOH or HNO3 solution to be about 6–7.
The calibration curve was prepared using Pb2+ final concentrations of 0.50, 0.75, 1.0, 2.0, 3.0, 4.0, 5.0, 6.0, 7.0, 8.0, 9.0, and 10.0 µg/L. Samples with different alkali, alkali earth and transition metal ions were prepared in the same way. The colloid color change was instant, and photographs were taken using a digital camera. A controlled experiment was done without the addition of dithizone.
In another experiment, a series of separate solutions containing other ions that are Li+, Na+, K+, Mg2+, Ca2+, Sr2+, Ba2+, Ti4+, Cr3+, Mn2+, Fe3+, Co2+, Ni2+, Cu2+, Zn2+, Cd2+, Hg2+, Al3+, Sn4+, and As3+ with a concentration of 250 µg/L were prepared. The colloidal AgNPs were added to the solution to make up an Ag concentration of 5.2 mg/L. The dithizone solution was also added to the solution to obtain a final concentration of 1.0 mM. The LSPR spectrum for each solution was recorded in the range of 300–700 nm. The experiment was repeated five times (n = 5).

3. Results

The color of the synthesized AgNPs colloid in aqueous PVA solution is yellow. The colloid has an LSPR spectrum with peak absorbance observed at 421 nm. It has been known that the color of AgNPs depends on the size and the shape of the particle. Earlier reports indicated that the colloid of AgNPs with the particle size of 35–50 nm had peak absorbance around 420–438 nm and yellow color. AgNPs with the diameter of 1–10 nm and a spherical shape will have an LSPR peak absorbance at low wavelengths. Also, the AgNPs obtained in starch had an LSPR peak absorbance of 408 nm and a size of about 14 nm [10]. Small AgNPs were obtained when the colloid was stabilized by secondary amines [21]. The shape and size of AgNPs can be controlled by the solvent, capping, and reducing agents. Reduction of hydrogen gas in organic media gave AgNPs with a size as small as 14 nm [22]. The AgNPs with a spherical shape and a diameter of about 30 nm were also produced by the reducing agent sodium borohydride and capping agent polyvinylpyrrolidone [21]. Since the color is yellow with the peak of the LSPR spectrum at 421 nm, it is believed that the AgNPs prepared has a spherical shape and diameter of about 10–20 nm.
Figure 1a shows the TEM image of the AgNPs prepared in this work. As predicted from the LSPR spectra, the shape of the nanoparticles is spherical with quasi-uniform size. The estimated average diameter of the AgNPs is about 25 nm. The colloids of AgNPs with a particle size around 30 nm have an LSPR absorbance peak of about 420 nm. The colloid of AgNPs has a very similar LSPR spectrum to the data reported earlier [22]. It is known that the smaller size Ag nanoparticles will have a spherical shape. The TEM images confirm that the form of the AgNPs produced in work in the PVA solution using ascorbic acid is spherical, they also had a yellow color.
Figure 1b displays the powder XRD pattern of AgNPs. The diffraction peaks are observed at 2θ of 38.36°, 44.45°, 64.75°, 77.60°, 81.75° that corresponds to hkl of (1, 1, 1), (2, 0, 0), (2, 2, 0), (3, 1, 1), (2, 2, 2) of face centered cubic (fcc) crystal system. An XRD analytical software known as Unit Cell was applied to obtain the unit cell of the AgNPs. This software was developed based on the reported paper [23]. The calculated unit cell of the AgNPs crystal was 4.08 Å. The AgNPs with an fcc crystal system commonly has the unit cell of about 4.086 Å as reported elsewhere.
β = K λ D cos θ
The XRD data were also used to estimate the average particle size of the particles. The average particle size calculated using the Debye–Scherrer equation (Equation (1)) was found to be 10 nm. Noting that in Equation (1), β is the measured width at half intensity of the diffraction peak (in radian), D is the average particle size diameter (in nanometers), K is dimensionless constant (0.9), λ is the wavelength of the x-ray (in nanometers), θ is the Bragg diffraction angle (in degrees) [24]. The calculated value is usually lower than the actual value obtained by the electron microscopic imaging systems of either SEM or TEM.
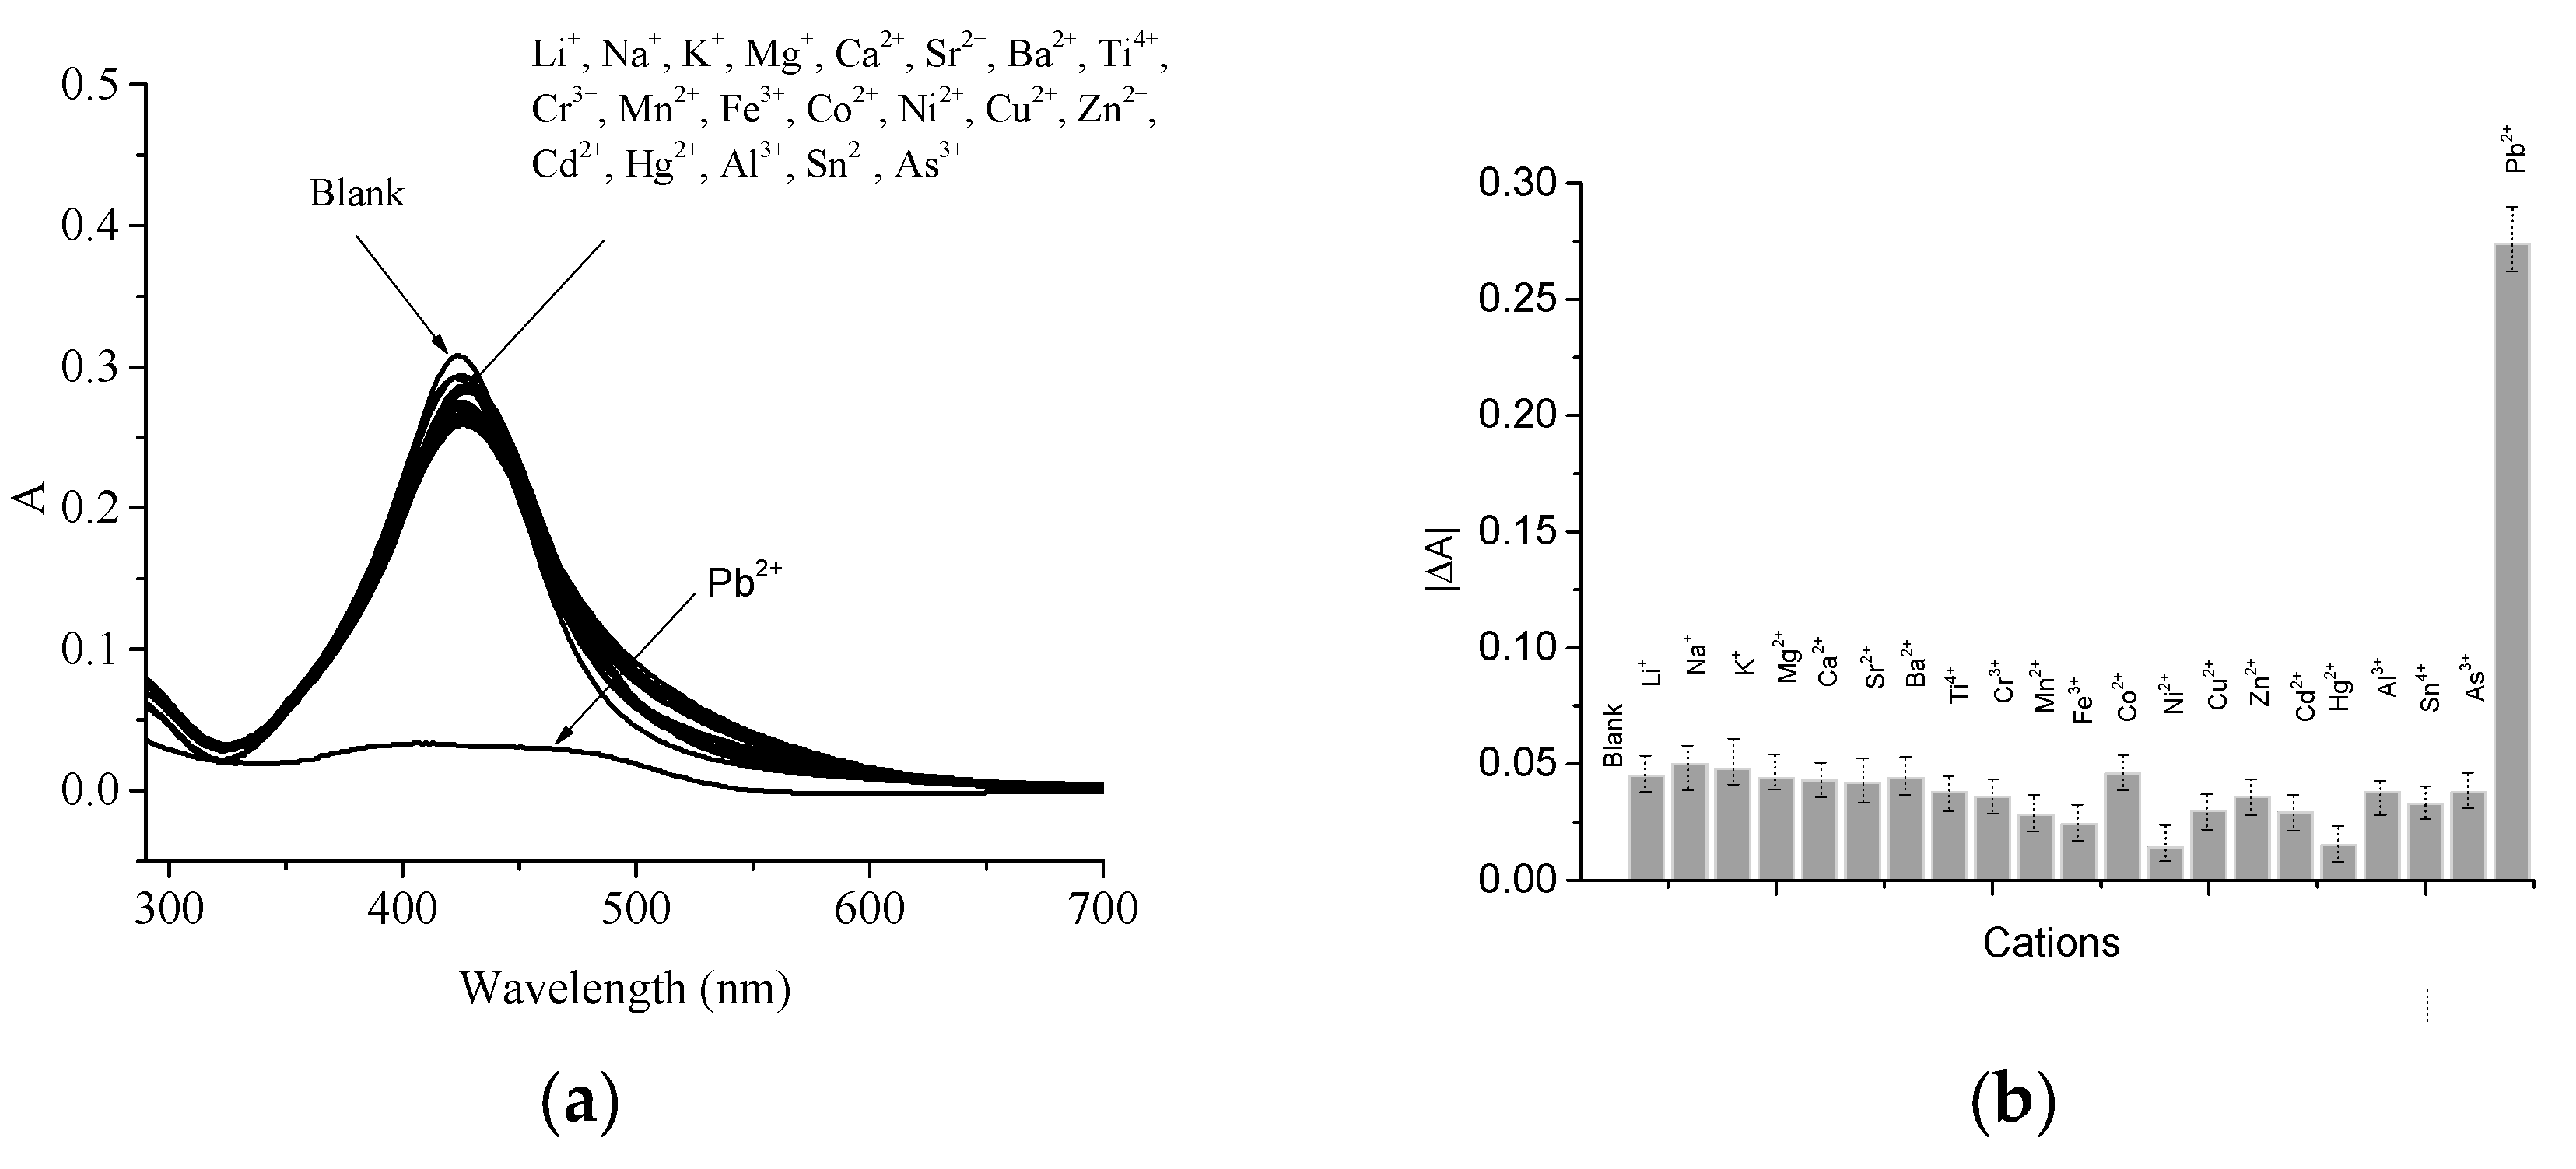
The collected LSPR spectra of 5.2 mg/L colloidal AgNPs upon addition of different ions and dithizone are shown in Figure 2a. The LSPR peak absorbance at 421 nm of the AgNPs was greatly diminished after the addition of Pb2+. The LSPR peak absorbance decreased from 0.308 to 0.033. The molar concentration of dithizone is kept constant at a molar ratio of 1:2. No other peak absorbance was detected upon addition of the Pb(II)-dithizone complex. The drop in LSPR absorbance of AgNPs was also observed in the Fe3+ in the presence of the capping agent N-acetyl-L-cysteine [13]. A large change in absorbance was also observed when Hg2+ ions were added to the colloidal AgNPs prepared with a solution of trisodium citrate, in which the citrate acted as complexing agent [25].
The addition of different cations with a concentration of 250 µg/L causes a slight change in the LSPR spectra of the colloidal AgNPs. There was no further change when the much higher concentration of the ions was added. Also, LSPR peak absorbance does not shift to a higher or lower wavelength. The collated decreases in LSPR peak absorbance (ΔA) at 421 nm of the colloidal AgNPs are presented in Figure 2b.
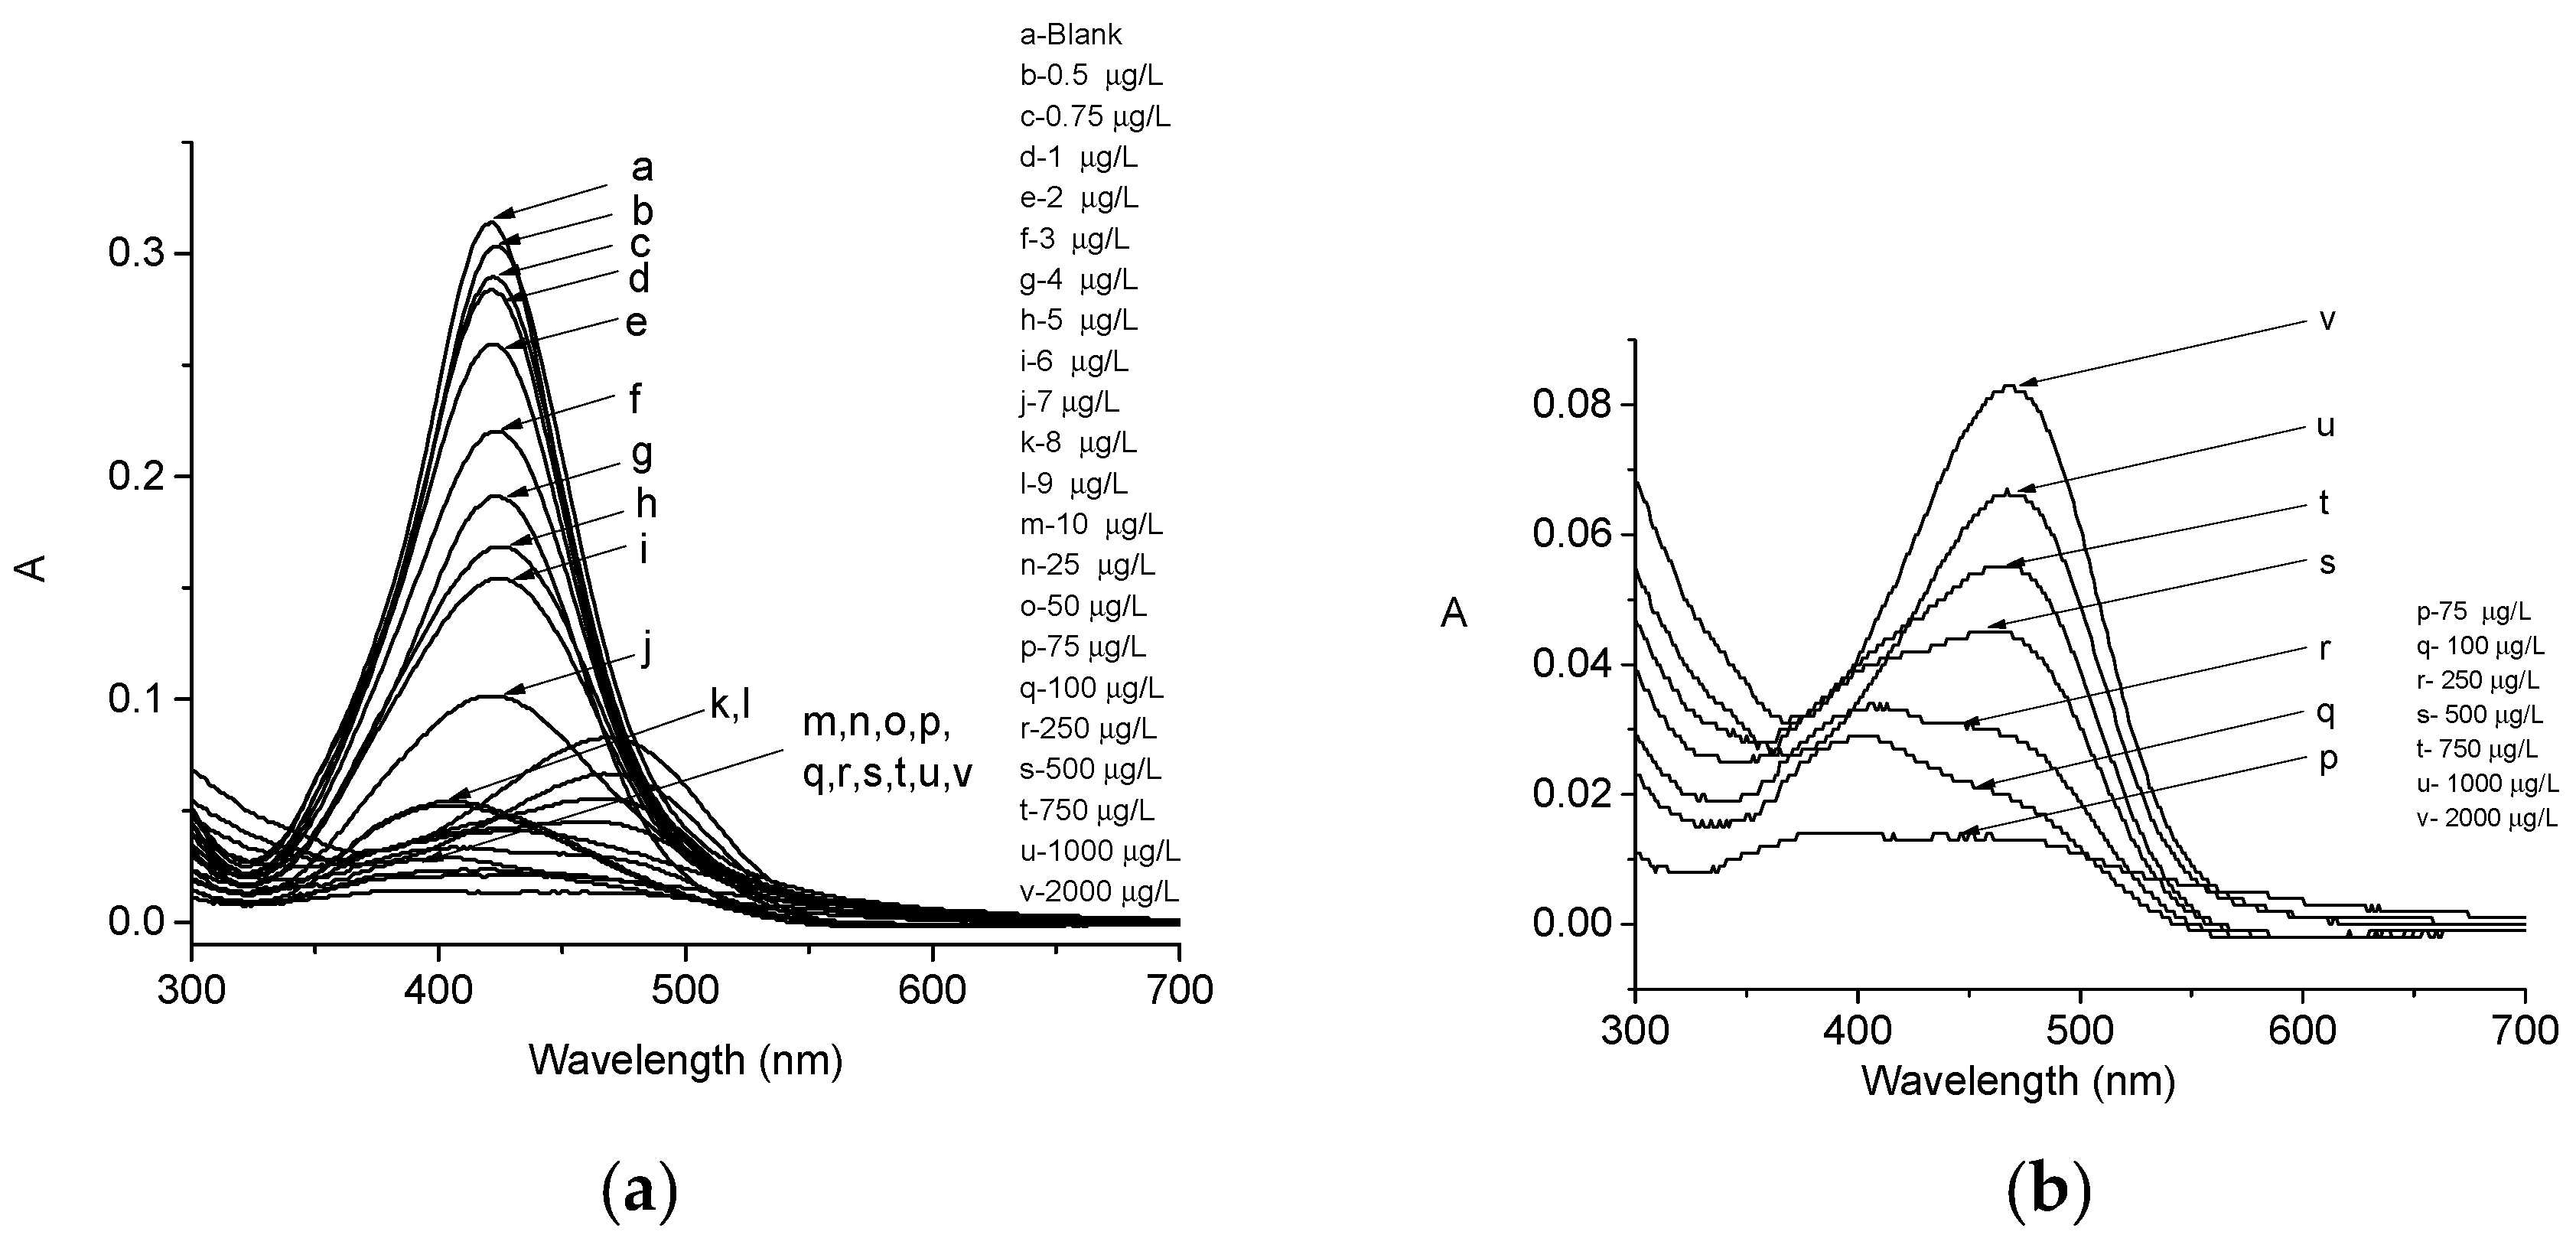
The combined LSPR spectra of colloidal AgNPs after addition of dithizone and Pb2+ ions with various concentrations (0.50–10 µg/L) are presented in Figure 3a. It shows that the peak absorbance at 421 nm continues to decrease along with the increase in the cation concentrations. The LSPR peak absorbance shifted to a lower wavelength when a high concentration of ions was added. Other work shows that the linear range for detection of Fe3+ using the capping agent N-acetyl-L-cysteine is from 0–4 mg/L [13], which is comparable to the present report.
At a high concentration Pb2+ ions of >75 µg/L, the new spectra are observed with a peak at 470 nm as shown in Figure 3b. It is an interesting phenomenon since it can only be seen when a high concentration of Pb(II)-dithizone of >75 µg/L is present. The detected peak at 470 nm could be attributed to the trace of remaining Pb(II)-dithizone. The appearance of the peak at 470 nm indicates that at high concentrations of Pb2+ ions, the Pb(II)-dithizone complex is favorable [26]. Some suggest that the peak at the high wavelength is due to the aggregation of AgNPs. In this case, it could be due to the Pb(II)-dithizone, since the peaks increase along with an increase in Pb(II)-dithizone concentration. The colloid of AuNPs can be stabilized by dithizone, which has the absorbance peak at 470 nm [27].
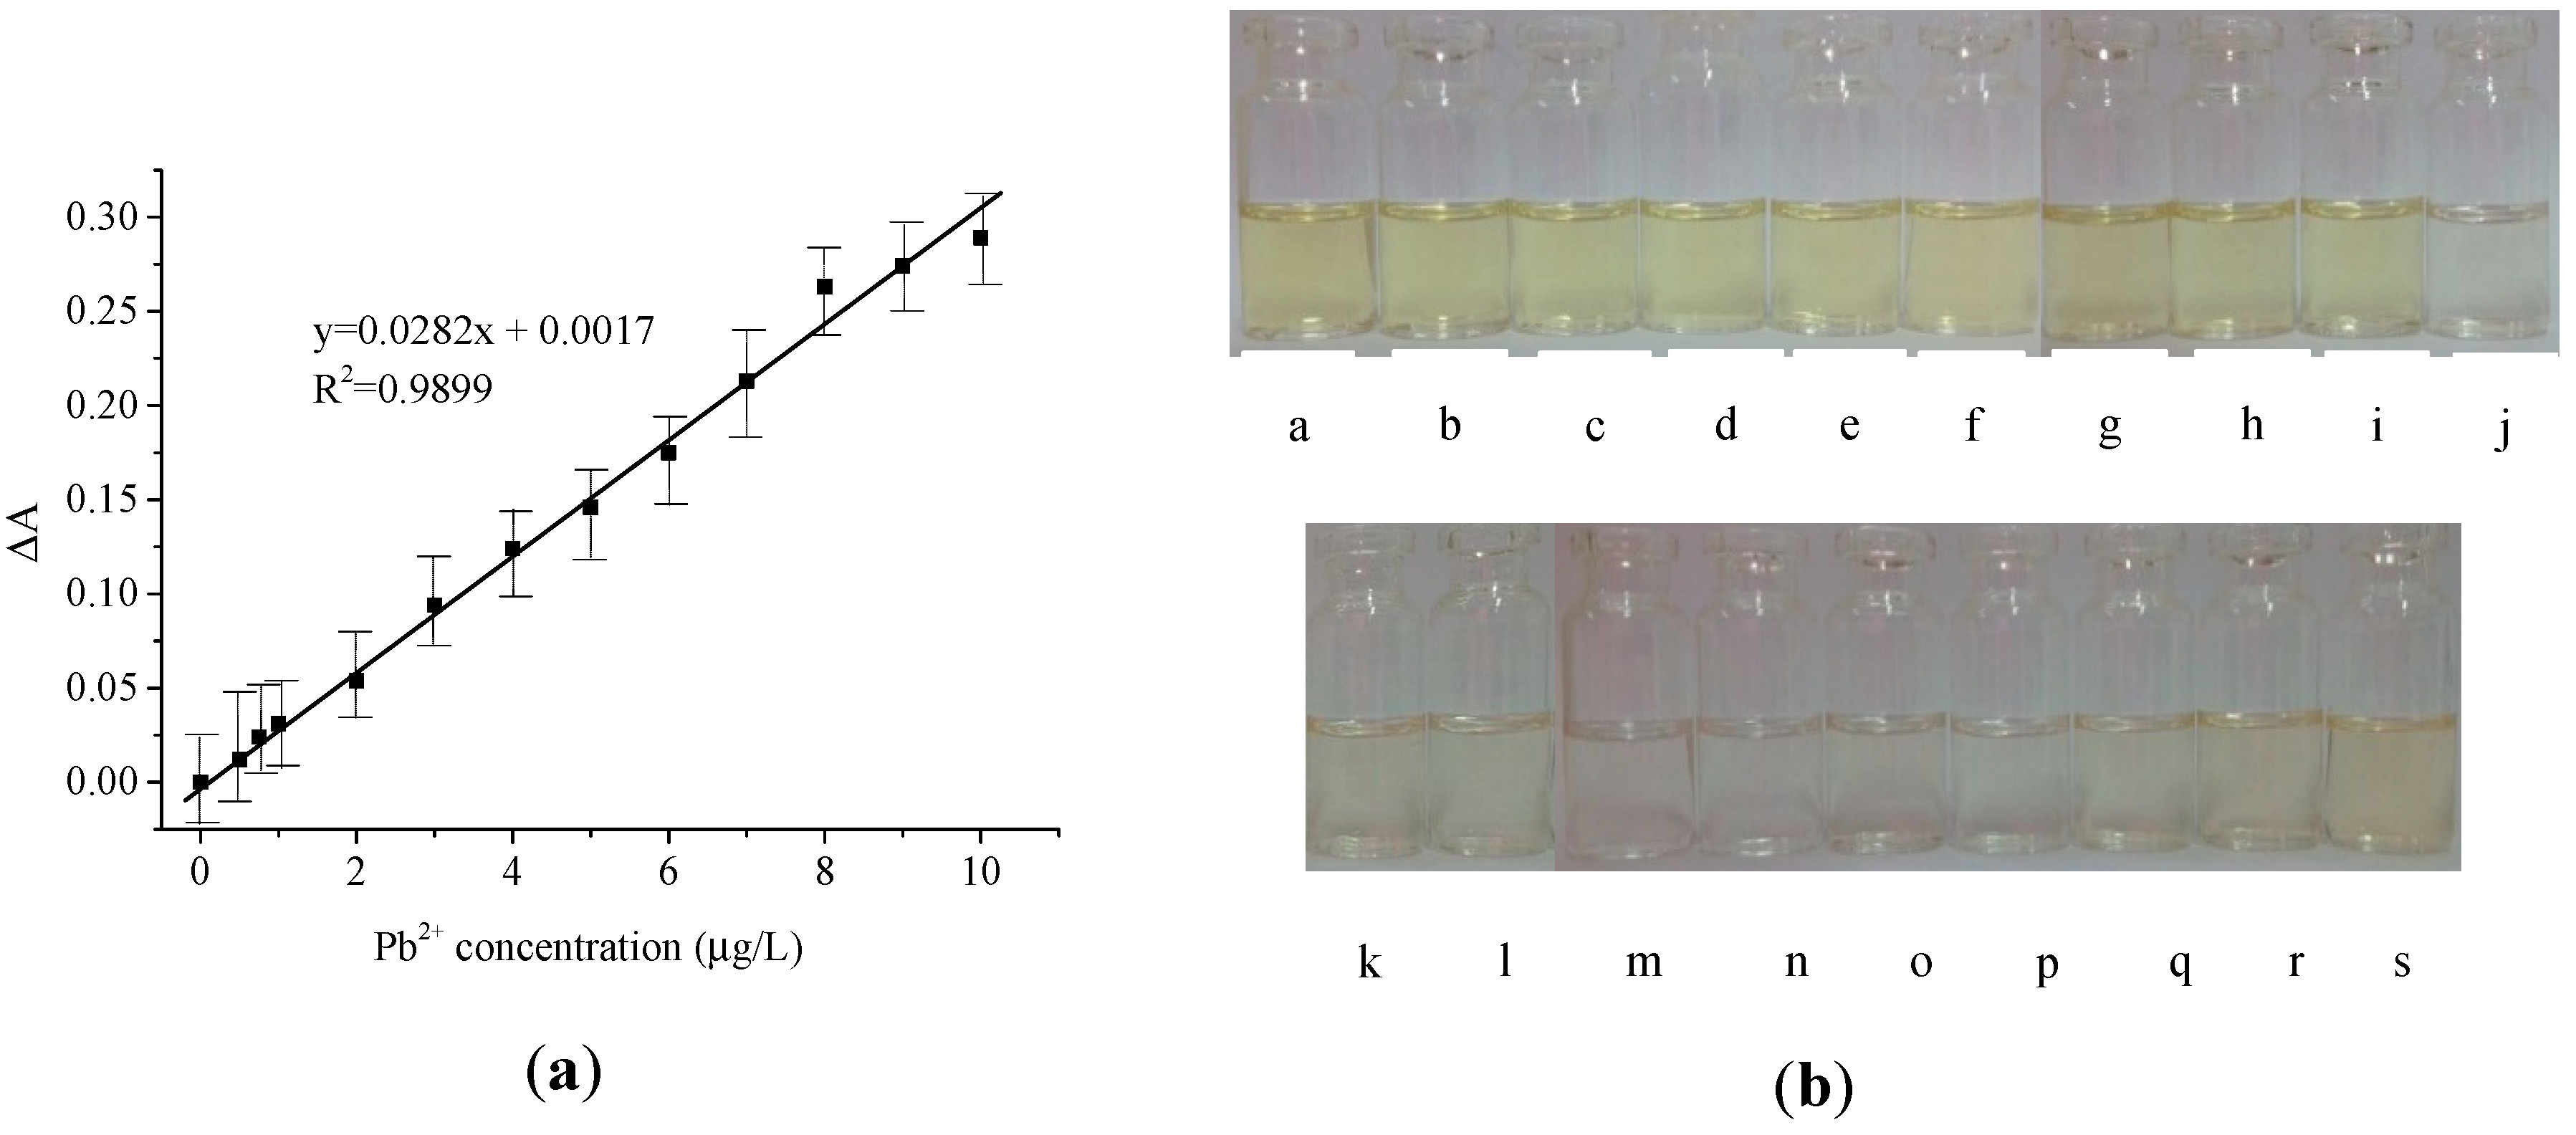
The calibration curve for colorimetric analysis of Pb2+ in the presence of AgNPs and dithizone is presented in Figure 4a. The plot of Pb2+ concentration versus absorbance is linear in the concentration range from 0.50–10 µg/L. We also found that at a Pb2+ concentration >15 µg/L, the calibration curve was not linear anymore. Using the slope of the calibration curve (a) and standard deviation of blank (σ) [28], the estimated limit of detection and limit of quantification for the Pb2+ colorimetric analysis as obtained from the calibration curve are found to be 0.64 ± 0.04 µg/L and 2.1 ± 0.15 µg/L (n = 5), respectively. Its linear range and sensitivity are 0.50–10 mg/L and 0.030 ± 0.0040 L/µg (n = 5), respectively. Also, it shows a linear calibration curve. The calculated correlation coefficient for the plot (R2) is 0.9899. The linear range of Pb2+ is even smaller than the reported analysis of lead using L-glutathione [12]. The photograph of the colloids shows the progress of the color change upon addition of Pb2+, Figure 4b.
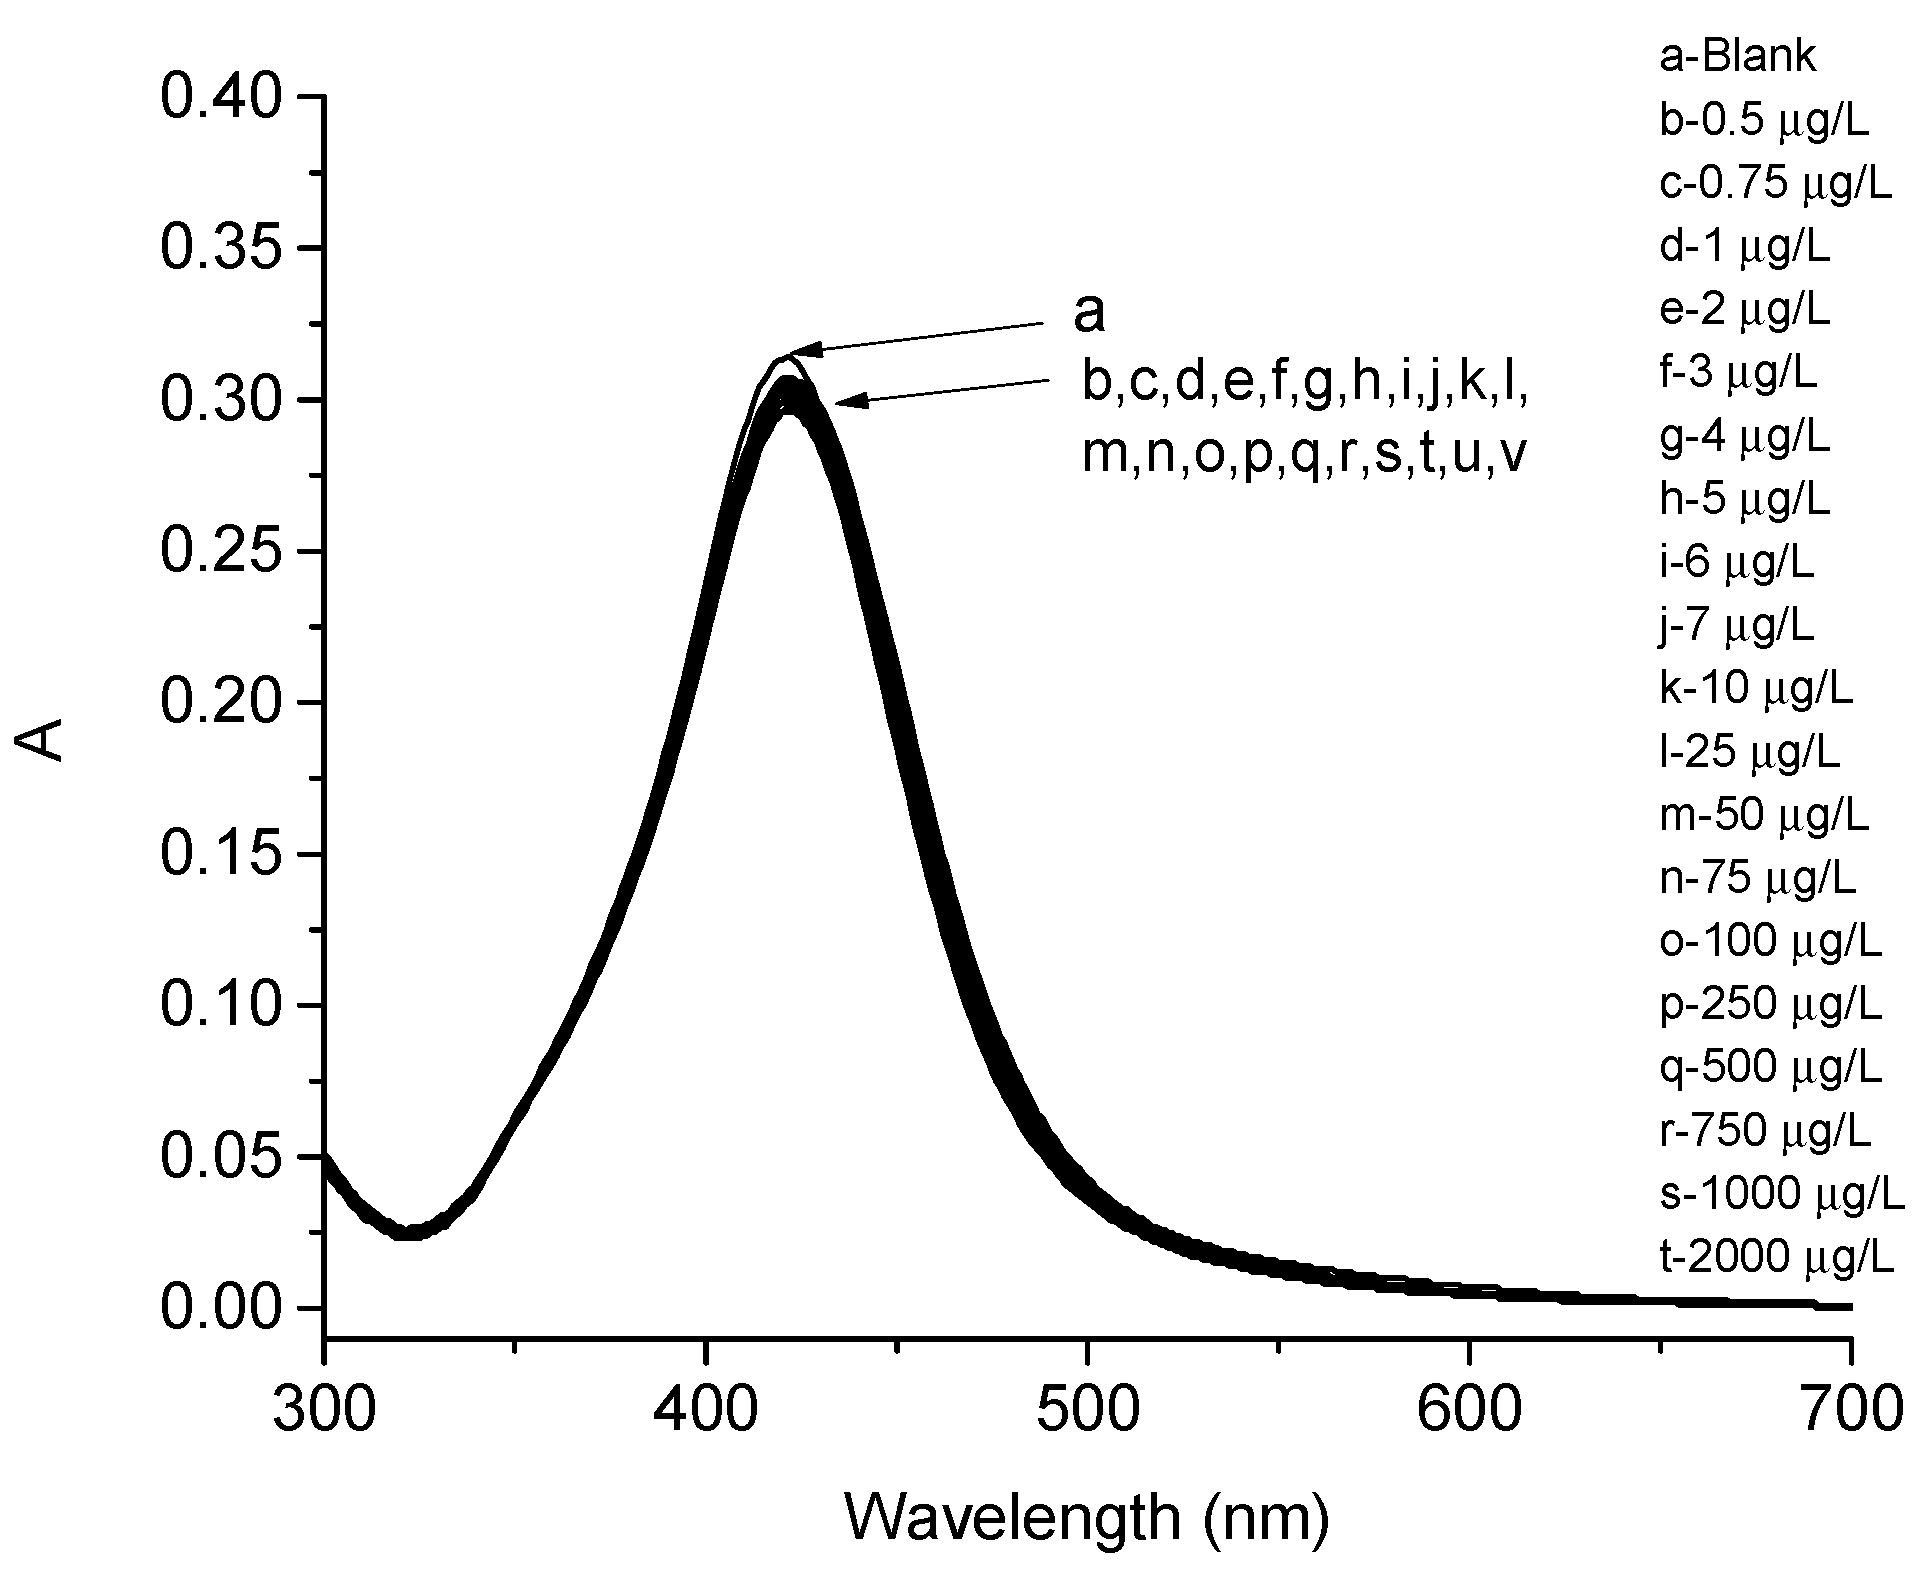
Figure 5 shows the LSPR spectra of 5.2 mg/L colloidal AgNPs in the presence of Pb2+, in which the concentration of Pb2+ was also varied. The absorbance of the colloidal Ag nanoparticle did not change appreciably upon addition of Pb2+, even when Pb2+ was as high as 10 mg/L. Previous reports showed that colloidal AuNPs capped with L-glutathione [27] did not change the absorbance significantly when a solution of transition metal ions other than Pb2+ ions was added [12].

4. Discussion

Upon addition of Pb2+ to the colloidal AgNPs in the presence of dithizone, the LSPR absorbance decreases. The decrease in the absorbance peak can be attributed to the reaction of AgNPs with the thiourea from Pb(II)-dithizone complex ion. Thiol compounds such as L-cysteine, L-dithiothreitol, 11-mercaptoundecanoic acid, glutathione (GSH), oxidized glutathione (GSSG), and N-acetyl-L-cysteine have a strong effect on the localized surface plasmon resonance of AgNPs, and all decrease the LSPR absorbance of the AgNPs [29]. The observed shift in the wavelength of the LSPR peak absorbance of AgNPs indicates that the sulfur atom of the dithizone interacts with metallic Ag to form an Ag–S covalent bond. It is known that thiol and disulfide groups react with metallic Ag to produce a strong covalent bond of Ag–S [30]. Moreover, it causes the surface electrons in the conduction band of the metallic Ag to diminish. Also, the shift in the AgNPs peak absorbance upon addition of Pb(II)-dithizone could be due to the aggregation of the AgNPs. It is well-accepted that nanoparticle aggregation will lead to the shift in the LSPR peak absorbance to the high wavelength (red shift). Dithizone can form a colorful complex ion with Pb2+ only, which improves selectivity over other cations.
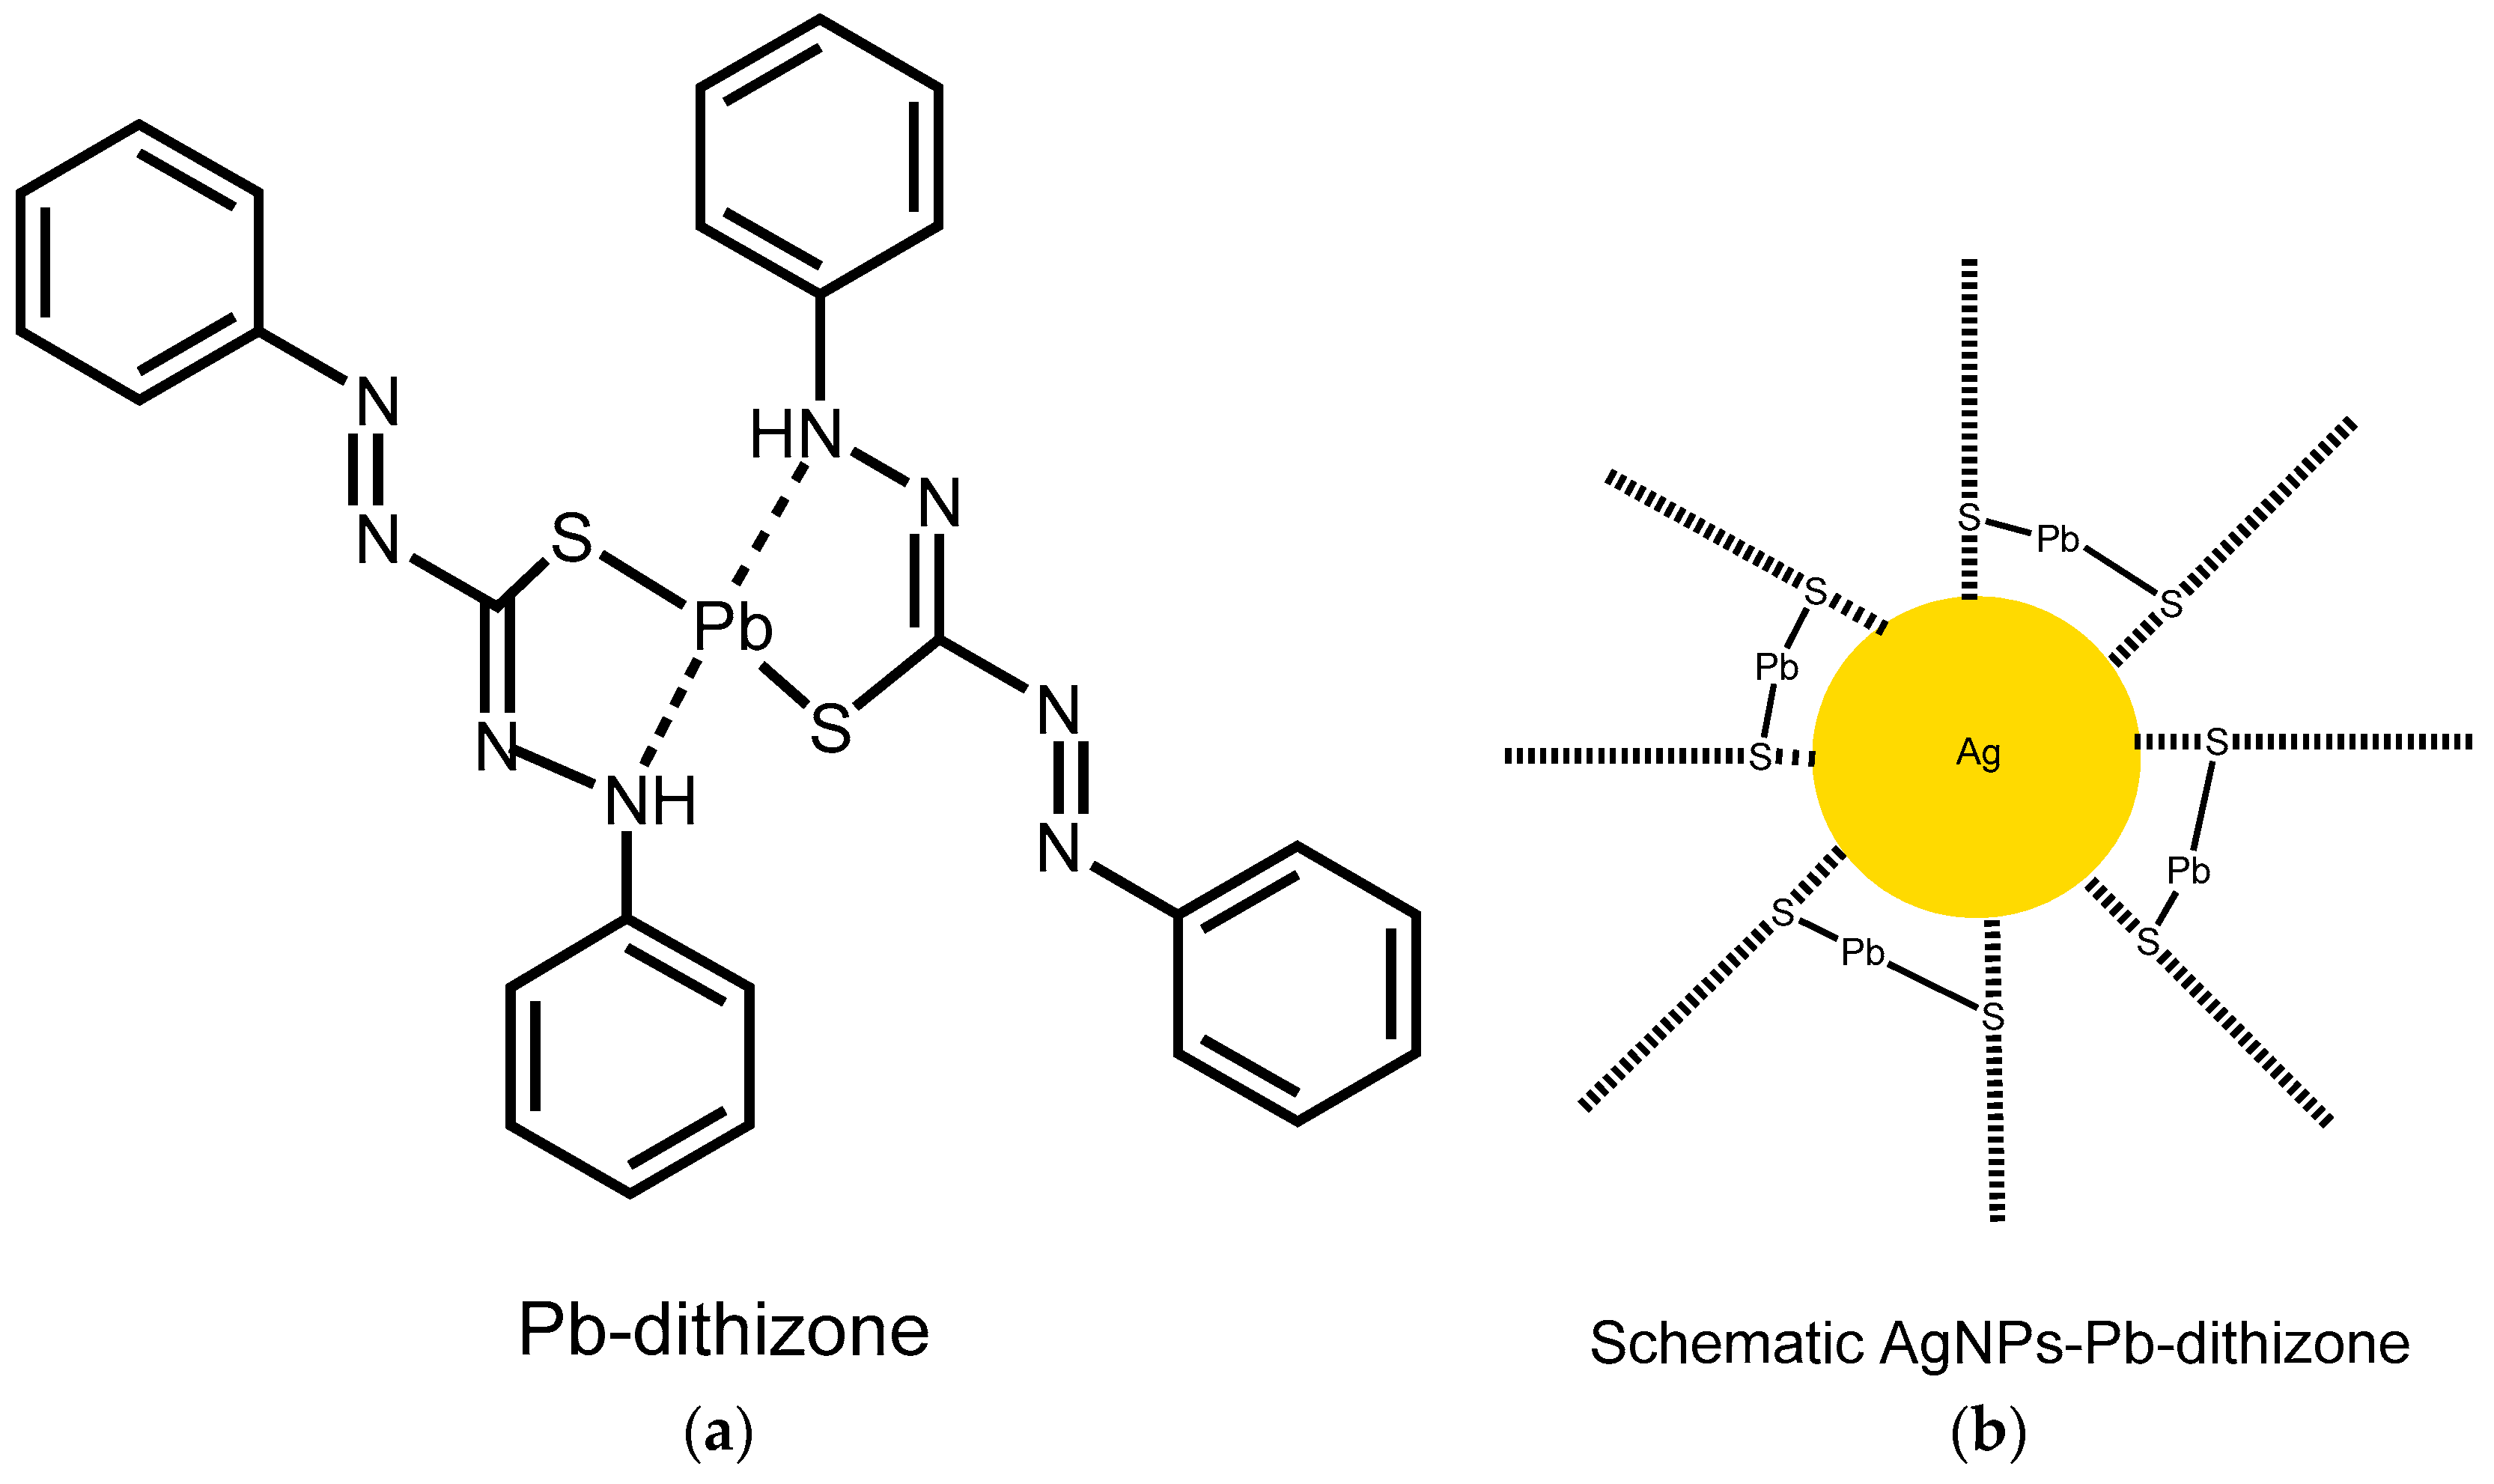
Figure 6a shows the structure of the Pb(II)-dithizone complex ion. A schematic representation of the interaction of AgNPs and Pb(II)-dithizone is shown in Figure 6b. A similar mechanism of interaction between silver nanoparticles and dodecanethiol for the sensing of Hg2+ has also been reported [22]. Further, as reported earlier, the Fe3+-pyridyl-appended calix[4]arene complex may induce aggregation of AgNPs, which causes significant changes in color and absorption properties, making it a rapid qualitative analytical method for Fe3+ [15].
The TEM image of colloidal Ag nanoparticles after the addition of the complex of Pb2+ and dithizone is presented in Figure 7. It confirms the aggregation of colloidal Ag nanoparticles upon addition of Pb(II)-dithizone, which led to diminishing their LSPR absorbance. Freshly prepared Ag nanoparticles are well spread with a diameter of around 30 nm, as shown in Figure 1a. The aggregation is thought to be due to the formation of a covalent bond between atomic Ag and the sulfur atom of dithizone. It will eventually reduce the absorbance of the colloid of Ag nanoparticles. The diameter of the nanoparticles even can reach >100 nm. Note that dithizone can form a complex ion with Pb2+ selectively at a pH above 5, while Hg2+ forms a complex ion at pH 2.5 [19]. In this experiment, the system pH was around 6. Takahashi et al. used a system pH of 2.7 to selectively form Hg(II)-dithizone complex [31].
Table 1. Representative analytical characteristics of the Pb2+ analytical methods.
Method (System)Limit of Detection (LOD)Limit of Quantification (LOQ)Linear Range Sensitivity Ref.
Atomic Absortion Spectrometry (AAS, graphite furnace)0.25 mg/L0.83 mg/L1.0–8.0 mg/L0.0408 L/mg[32]
Inductively Coupled Plasma-Optical Emission Spectrometry (ICP-OES)0.36 mg/L1.2 mg/L0.10–2.0 mg/L0.303 L/mg[33]
Strip immunosensor (AuNPs)0.19 µg/L0.60 µg/L 0.25–2.0 µg/LN/A[34]
Colorimetry (AuNPs, thiosulfate/4-mercaptobutanol)0.04 µg/L0.12 µg/L0.10–2.07 µg/LN/A[35]
Colorimetry (AuNPs, thiosulfate, 2-mercaptoethanol)0.10 µg/L0.31 µg/L0.52–2000 µg/LN/A[36]
Colorimetry (AgNPs, 1-(2-mercaptoethyl)-1,3,5-triazinane-2,4,6-trione)20 µg/L60 µg/L100–600 µg/LN/A[37]
Colorimetry (AuNPs, thiosulfate)4.1 µg/L12.4 µg/L5.18–62.2 µg/L0.003 L/µg[38]
Colorimetry (AuNPs, gallic acid)5.2 µg/L15.5 µg/L10.4–200 µg/LN/A[39]
Colorimetry (AuNPs, maleic acid)0.50 µg/L1.5 µg/L1.0–10.0 µg/L0.059 L/µg[40]
Colorimetry (AgNPs, dithizone)0.64 µg/L2.1 µg/L0.5–10 µg/L0.0282 L/µgThis work
We compare the analytical characteristics of this AgNPs-based colorimetric method of Pb2+ ion with that of established methods, which are Atomic Absorption Spectrometry (AAS) (by graphite furnace technique), Inductively Coupled Plasma-Optical Emission Spectrometry (ICP-OES), immunosensor [34], and recent colorimetric methods using either gold or silver nanoparticles. Table 1 shows the values of the limit of detection (LOD), the limit of quantification (LOQ), linear range, and sensitivity of Pb from the above mentioned methods with respective references. As is shown, the AAS and ICP-OES have a LOD and LOQ in the level of mg/L. The strip immunosensing and colorimetric methods have in general a very low LOD, LOQ, and linear range which are in the µg/L level. The analytical figures of merit for Pb2+ of this colorimetric method is very close to the other reported results. So far, the best method for Pb2+ detection has been by colorimtery, with a LOD of about 0.10 µg/L. The linear range of this method is also close to that of published literature. It means that this method could be applicable for routine analysis of Pb2+ in groundwater, which usually contains Pb2+ at µg/L level.
The practical use of this method could be in the monitoring of Pb2+ content in groundwater, which is not a complicated matrix. Groundwater that is utilized as a source of tap water must be continuously checked for heavy metals, especially Pb2+. It is worth noting that in some developing countries, there are many acid battery recycling industries in operation. Also, the prolonged use of leaded gasoline in some developing countries, before it was phased out, could potentially enhance the Pb2+ content in the groundwater. In the long run, it is possible that acid battery reprocessing industries, as well as the use of leaded gasoline, could release Pb2+ ions into the groundwater. The use of AgNPs in groundwater Pb2+ screening offers a fast, cheap, and sensitive alternative solution to established methods such as atomic absorption spectrometry (AAS) and Inductively Coupled Plasma-Mass Spectrometry (ICP-MS).

5. Conclusions

Sensitive and selective colorimetric sensing of aqueous Pb2+ ions based on the decrease in the localized surface plasmon resonance (LSPR) of AgNPs. The AgNPs was added to the solution containing Pb2+ that had formed a complex ion with dithizone. The linear decrease in the AgNPs LSPR peak absorbance at 421 nm is proportional to the Pb2+ concentration. The calibration graph for Pb2+ for this method is linear in the concentration range of 0.50–10 µg/L. Also, the pH of the system helps improve the selectivity of colorimetric sensing of aqueous Pb2+ ions over other ions, especially Hg2+. The calculated limit of detection (LOD) and limit of quantification (LOQ) are found to be 0.64 ± 0.04 µg/mL and 2.1 ± 0.15 µg/mL (n = 5), respectively. Its linear range and sensitivity are 0.5–10 µg/mL and 0.0282 ± 0.0040 L/mg (n = 5), respectively. The LOD and LOQ values are comparable to the strip immunosensor method and are better than those of the AAS and ICP-OES methods. The developed method could be of significance for Pb2+ detection in the environment as well as in clinical samples. The obtained method could be prospective for the detection of Pb2+ ions in groundwater and even in tap water. Metal nanoparticles and suitable complexing agents could be prospective for devising new metal nanoparticle LSPR-based analytical methods for heavy metal ions in the future.

Author Contributions

R.R. designed the experimental and wrote an initial draft of the manuscript. B.M. synthesized and characterized Ag nanoparticles as well as data acquisition. A.K. contributed to the data analysis. M.M. and A.S. reviewed and edited the manuscript.

Funding

This research was funded by The Ministry Research, Technology, and Higher Education of Indonesia under the name of PTUPT Project grant number 923/UN1-P.III/LT/DIT-LIT/2016.

Acknowledgments

The authors are also indebted to the Department of Chemistry Universitas Gadjah Mada for providing main research facilities of XRD and TEM machines.

Conflicts of Interest

The authors declare no conflict of interest.

References

  1. Willets, K.A.; van Duyne, R.P. Localized Surface Plasmon Resonance Spectroscopy and Sensing. Annu. Rev. Phys. Chem. 2007, 58, 267–297. [Google Scholar] [CrossRef] [PubMed] [Green Version]
  2. Petryayeva, E.; Krull, U.J. Localized surface plasmon resonance: Nanostructures, bioassays and biosensing—A review. Anal. Chim. Acta 2011, 706, 8–24. [Google Scholar] [CrossRef] [PubMed]
  3. Tang, Y.; Han, G. Characteristics of major elements and heavy metals in atmospheric dust in Beijing, China. J. Geochem. Explor. 2017, 176, 114–119. [Google Scholar] [CrossRef]
  4. Kim, H.T.; Lee, T.G. A simultaneous stabilization and solidification of the top five most toxic heavy metals (Hg, Pb, As, Cr, and Cd). Chemosphere 2017, 178, 479–485. [Google Scholar] [CrossRef] [PubMed]
  5. Kim, E.; Horckmans, L.; Spooren, J.; Vrancken, K.C.; Quaghebeur, M.; Broos, K. Selective leaching of Pb, Cu, Ni and Zn from secondary lead smelting residues. Hydrometallurgy 2017, 169, 372–381. [Google Scholar] [CrossRef]
  6. Zhang, B.; Huo, X.; Xu, L.; Cheng, Z.; Cong, X.; Lu, X.; Xu, X. Elevated lead levels from e-waste exposure are linked to decreased olfactory memory in children. Environ. Pollut. 2017, 231, 1112–1121. [Google Scholar] [CrossRef] [PubMed]
  7. Jones, D.R.; Jarrett, J.M.; Tevis, D.S.; Franklin, M.; Mullinix, N.J.; Wallon, K.L.; Quarles, D., Jr.; Caldwella, K.L.; Jonesa, R.L. Analysis of whole human blood for Pb, Cd, Hg, Se, and Mn by ICP-DRC-MS for biomonitoring and acute exposures. Talanta 2017, 162, 114–122. [Google Scholar] [CrossRef] [PubMed]
  8. Pallavicini, P.; Taglietti, A.; Dacarro, G.; Diaz-Fernandez, Y.A.; Galli, M.; Grisoli, P.; Patrini, M.; De Magistris, G.S.; Zanon, R. Self-assembled monolayers of silver nanoparticles firmly grafted on glass surfaces: Low Ag+ release for an efficient antibacterial activity. J. Colloid Interface Sci. 2010, 350, 110–116. [Google Scholar] [CrossRef]
  9. Chen, L.; Wang, Y.; Fu, X.; Chen, L. Novel Optical Nanoprobes for Chemical and Biological Analysis; Springer: Berlin, Germany, 2014. [Google Scholar]
  10. Vasileva, P.; Donkova, B.; Karadjova, I.; Dushkin, C. Synthesis of starch-stabilized silver nanoparticles and their application as a surface plasmon resonance-based sensor of hydrogen peroxide. Colloids Surf. A Physicochem. Eng. Asp. 2011, 382, 203–210. [Google Scholar] [CrossRef]
  11. Liu, D.; Qu, W.; Chen, W.; Zhang, W.; Wang, Z.; Jiang, X. Highly Sensitive, Colorimetric Detection of Mercury (II) in Aqueous Media by Quaternary Ammonium Group-Capped Gold Nanoparticles at Room Temperature. Anal. Chem. 2010, 82, 9606–9610. [Google Scholar] [CrossRef]
  12. Beqa, L.; Singh, A.K.; Khan, S.A.; Senapati, D.; Arumugam, S.R.; Ray, P.C. Gold nanoparticle-based simple colorimetric and ultrasensitive dynamic light scattering assay for the selective detection of Pb(II) from paints, plastics, and water samples. ACS Appl. Mater. Interfaces 2011, 3, 668–673. [Google Scholar] [CrossRef] [PubMed]
  13. Gao, X.; Lu, Y.; He, S.; Li, X.; Chen, W. Colorimetric Detection of Iron Ions (III) Based on the Highly Sensitive Plasmonic Response of the N-acetyl-L-cysteine-Stabilized Silver Nanoparticles. Anal. Chim. Acta 2015, 879, 118–125. [Google Scholar] [CrossRef] [PubMed]
  14. Fan, Y.; Liu, Z.; Wang, L.; Zhan, J. Synthesis of starch-stabilized Ag nanoparticles and Hg2+ recognition in aqueous media. Nanoscale Res. Lett. 2009, 4, 1230–1235. [Google Scholar] [CrossRef] [PubMed]
  15. Zhan, J.; Wen, L.; Miao, F.; Tian, D.; Zhu, X.; Li, H. Synthesis of a pyridyl-appended calix[4]arene and its application to the modification of silver nanoparticles as an Fe3+ colorimetric sensor. New J. Chem. 2012, 36, 656–661. [Google Scholar] [CrossRef]
  16. Vilela, D.; González, M.C.; Escarpa, A. Analytica Chimica Acta Sensing colorimetric approaches based on gold and silver nanoparticles aggregation: Chemical creativity behind the assay. A review. Anal. Chim. Acta 2012, 751, 24–43. [Google Scholar] [CrossRef] [PubMed]
  17. Zarlaida, F.; Adlim, M. Gold and silver nanoparticles and indicator dyes as active agents in colorimetric spot and strip tests for mercury (II) ions: A review. Microchim. Acta 2016, 184, 45–48. [Google Scholar] [CrossRef]
  18. Leng, Y.; Gong, A.; Shen, Z.; Chen, L.; Wu, A. Colorimetric Response of Dithizone Product and He×adecyl Trimethyl Ammonium Bromide Modi fi ed Gold Nanoparticle Dispersion to 10 Types of Heavy Metal Ions: Understanding the Involved Molecules from Experiment to Simulation. Langmuir 2013, 29, 7591–7599. [Google Scholar] [CrossRef] [PubMed]
  19. Zargoosh, K.; Babadi, F.F. Highly selective and sensitive optical sensor for determination of Pb2+ and Hg2+ ions based on the covalent immobilization of dithizone on agarose membrane. Spectrochim. Acta A Mol. Biomol. Spectrosc. 2014, 137, 105–110. [Google Scholar] [CrossRef] [PubMed]
  20. Dawson, V.M.; Lyle, S.J. Spectrophotometric Determination of Iron and Cobalt with Ferrozine and Dithizone. Talanta 1990, 37, 1189–1191. [Google Scholar] [CrossRef]
  21. Sung, H.K.; Oh, S.Y.; Park, C.; Kim, Y. Colorimetric detection of Co2+ ion using silver nanoparticles with spherical, plate, and rod shapes. Langmuir 2013, 29, 8978–8982. [Google Scholar] [CrossRef] [PubMed]
  22. Chen, L.; Chan, L.; Fu, X.; Lu, W. Highly sensitive and selective colorimetric sensing of Hg2+ based on the morphology transition of silver nanoprisms. ACS Appl. Mater. Interfaces 2013, 5, 284–290. [Google Scholar] [CrossRef] [PubMed]
  23. Holland, T.J.B.; Redfern, S.A.T. Unit cell refinement from powder diffraction data: The use of regression diagnostics. Miner. Mag. 1997, 61, 65–77. [Google Scholar] [CrossRef]
  24. Burton, A.W.; Ong, K.; Rea, T.; Chan, I.Y. On the estimation of average crystallite size of zeolites from the Scherrer equation: A critical evaluation of its application to zeolites with one-dimensional pore systems. Microporous Mesoporous Mater. 2009, 117, 75–90. [Google Scholar] [CrossRef]
  25. Jarujamrus, P.; Amatatongchai, M.; Thima, A.; Khongrangdee, T.; Mongkontong, C. Selective colorimetric sensors based on the monitoring of an unmodified silver nanoparticles (AgNPs) reduction for a simple and rapid determination of mercury. Spectrochim. Acta A Mol. Biomol. Spectrosc. 2015, 142, 86–93. [Google Scholar] [CrossRef] [PubMed]
  26. Khan, H.; Ahmed, M.J.; Bhanger, M.I. A simple spectrophotometric method for the determination of trace level lead in biological samples in the presence of aqueous micellar solutions. Spectroscopy 2006, 20, 285–297. [Google Scholar] [CrossRef] [Green Version]
  27. Zhong, G.; Liu, J.; Liu, X. A fast colourimetric assay for lead detection using label-free gold nanoparticles (AuNPs). Micromachines 2015, 6, 462–472. [Google Scholar] [CrossRef]
  28. Uhrovčík, J. Strategy for determination of LOD and LOQ values—Some basic aspects. Talanta 2014, 119, 178–180. [Google Scholar] [CrossRef]
  29. Zhao, L.; Zhao, L.; Miao, Y.; Liu, C.; Zhang, C. A Colorimetric Sensor for the Highly Selective Detection of Sulfide and 1,4-Dithiothreitol Based on the In Situ Formation of Silver Nanoparticles Using Dopamine. Sensors 2017, 17, 626. [Google Scholar] [CrossRef]
  30. Cohen-Atiya, M.; Mandler, D. Studying thiol adsorption on Au, Ag and Hg surfaces by potentiometric measurements. J. Electroanal. Chem. 2003, 550–551, 267–276. [Google Scholar] [CrossRef]
  31. Takahashi, Y.; Danwittayakul, S.; Suzuki, T.M. Dithizone nanofiber-coated membrane for filtration-enrichment and colorimetric detection of trace Hg(ii) ion. Analyst 2009, 134, 1380–1385. [Google Scholar] [CrossRef]
  32. Bakırdere, S.; Yaroğlu, T.; Tırık, N.; Demiröz, M.; Fidan, A.K.; Maruldalı, O.; Karaca, A. Determination of As, Cd, and Pb in tap water and bottled water samples by using optimized GFAAS system with Pd-Mg and Ni as matrix modifiers. J. Spectrosc. 2013, 2013. [Google Scholar] [CrossRef]
  33. Feist, B.; Mikula, B.; Pytlakowska, K.; Puzio, B.; Buhl, F. Determination of heavy metals by ICP-OES and F-AAS after preconcentration with 2,2′-bipyridyl and erythrosine. J. Hazard. Mater. 2008, 152, 1122–1129. [Google Scholar] [CrossRef] [PubMed]
  34. Kuang, H.; Xing, C.; Hao, C.; Liu, L.; Wang, L.; Xu, C. Rapid and highly sensitive detection of lead ions in drinking water based on a strip immunosensor. Sensors 2013, 13, 4214–4224. [Google Scholar] [CrossRef] [PubMed]
  35. Hung, Y.L.; Hsiung, T.M.; Chen, Y.Y.; Huang, C.C. A label-free colorimetric detection of lead ions by controlling the ligand shells of gold nanoparticles. Talanta 2010, 82, 516–522. [Google Scholar] [CrossRef] [PubMed]
  36. Yi-You, C.; Huan-Tsung, C.; Yen-Chun, S.; Yu-Lun, H.; Cheng-Kang, C.; Chih-Ching, H. Colorimetric Assay for Lead Ions Based on the Leaching of Gold Nanoparticles. Anal. Chem. 2009, 81, 9433–9439. [Google Scholar]
  37. Noh, K.C.; Nam, Y.S.; Lee, H.J.; Lee, K.B. A colorimetric probe to determine Pb2+ using functionalized silver nanoparticles. Analyst 2015, 140, 8209–8216. [Google Scholar] [CrossRef] [PubMed]
  38. Zhu, J.; Yu, Y.Q.; Li, J.J.; Zhao, J.W. Colorimetric detection of lead(ii) ions based on accelerating surface etching of gold nanorods to nanospheres: The effect of sodium thiosulfate. RSC Adv. 2016, 6, 25611–25619. [Google Scholar] [CrossRef]
  39. Ding, N.; Cao, Q.; Zhao, H.; Yang, Y.; Zeng, L.; He, Y.; Xiang, K.; Wang, G. Colorimetric assay for determination of lead (II) based on its incorporation into gold nanoparticles during their synthesis. Sensors 2010, 10, 11144–11155. [Google Scholar] [CrossRef]
  40. Ratnarathorn, N.; Chailapakul, O.; Dungchai, W. Highly sensitive colorimetric detection of lead using maleic acid functionalized gold nanoparticles. Talanta 2015, 132, 613–618. [Google Scholar] [CrossRef]
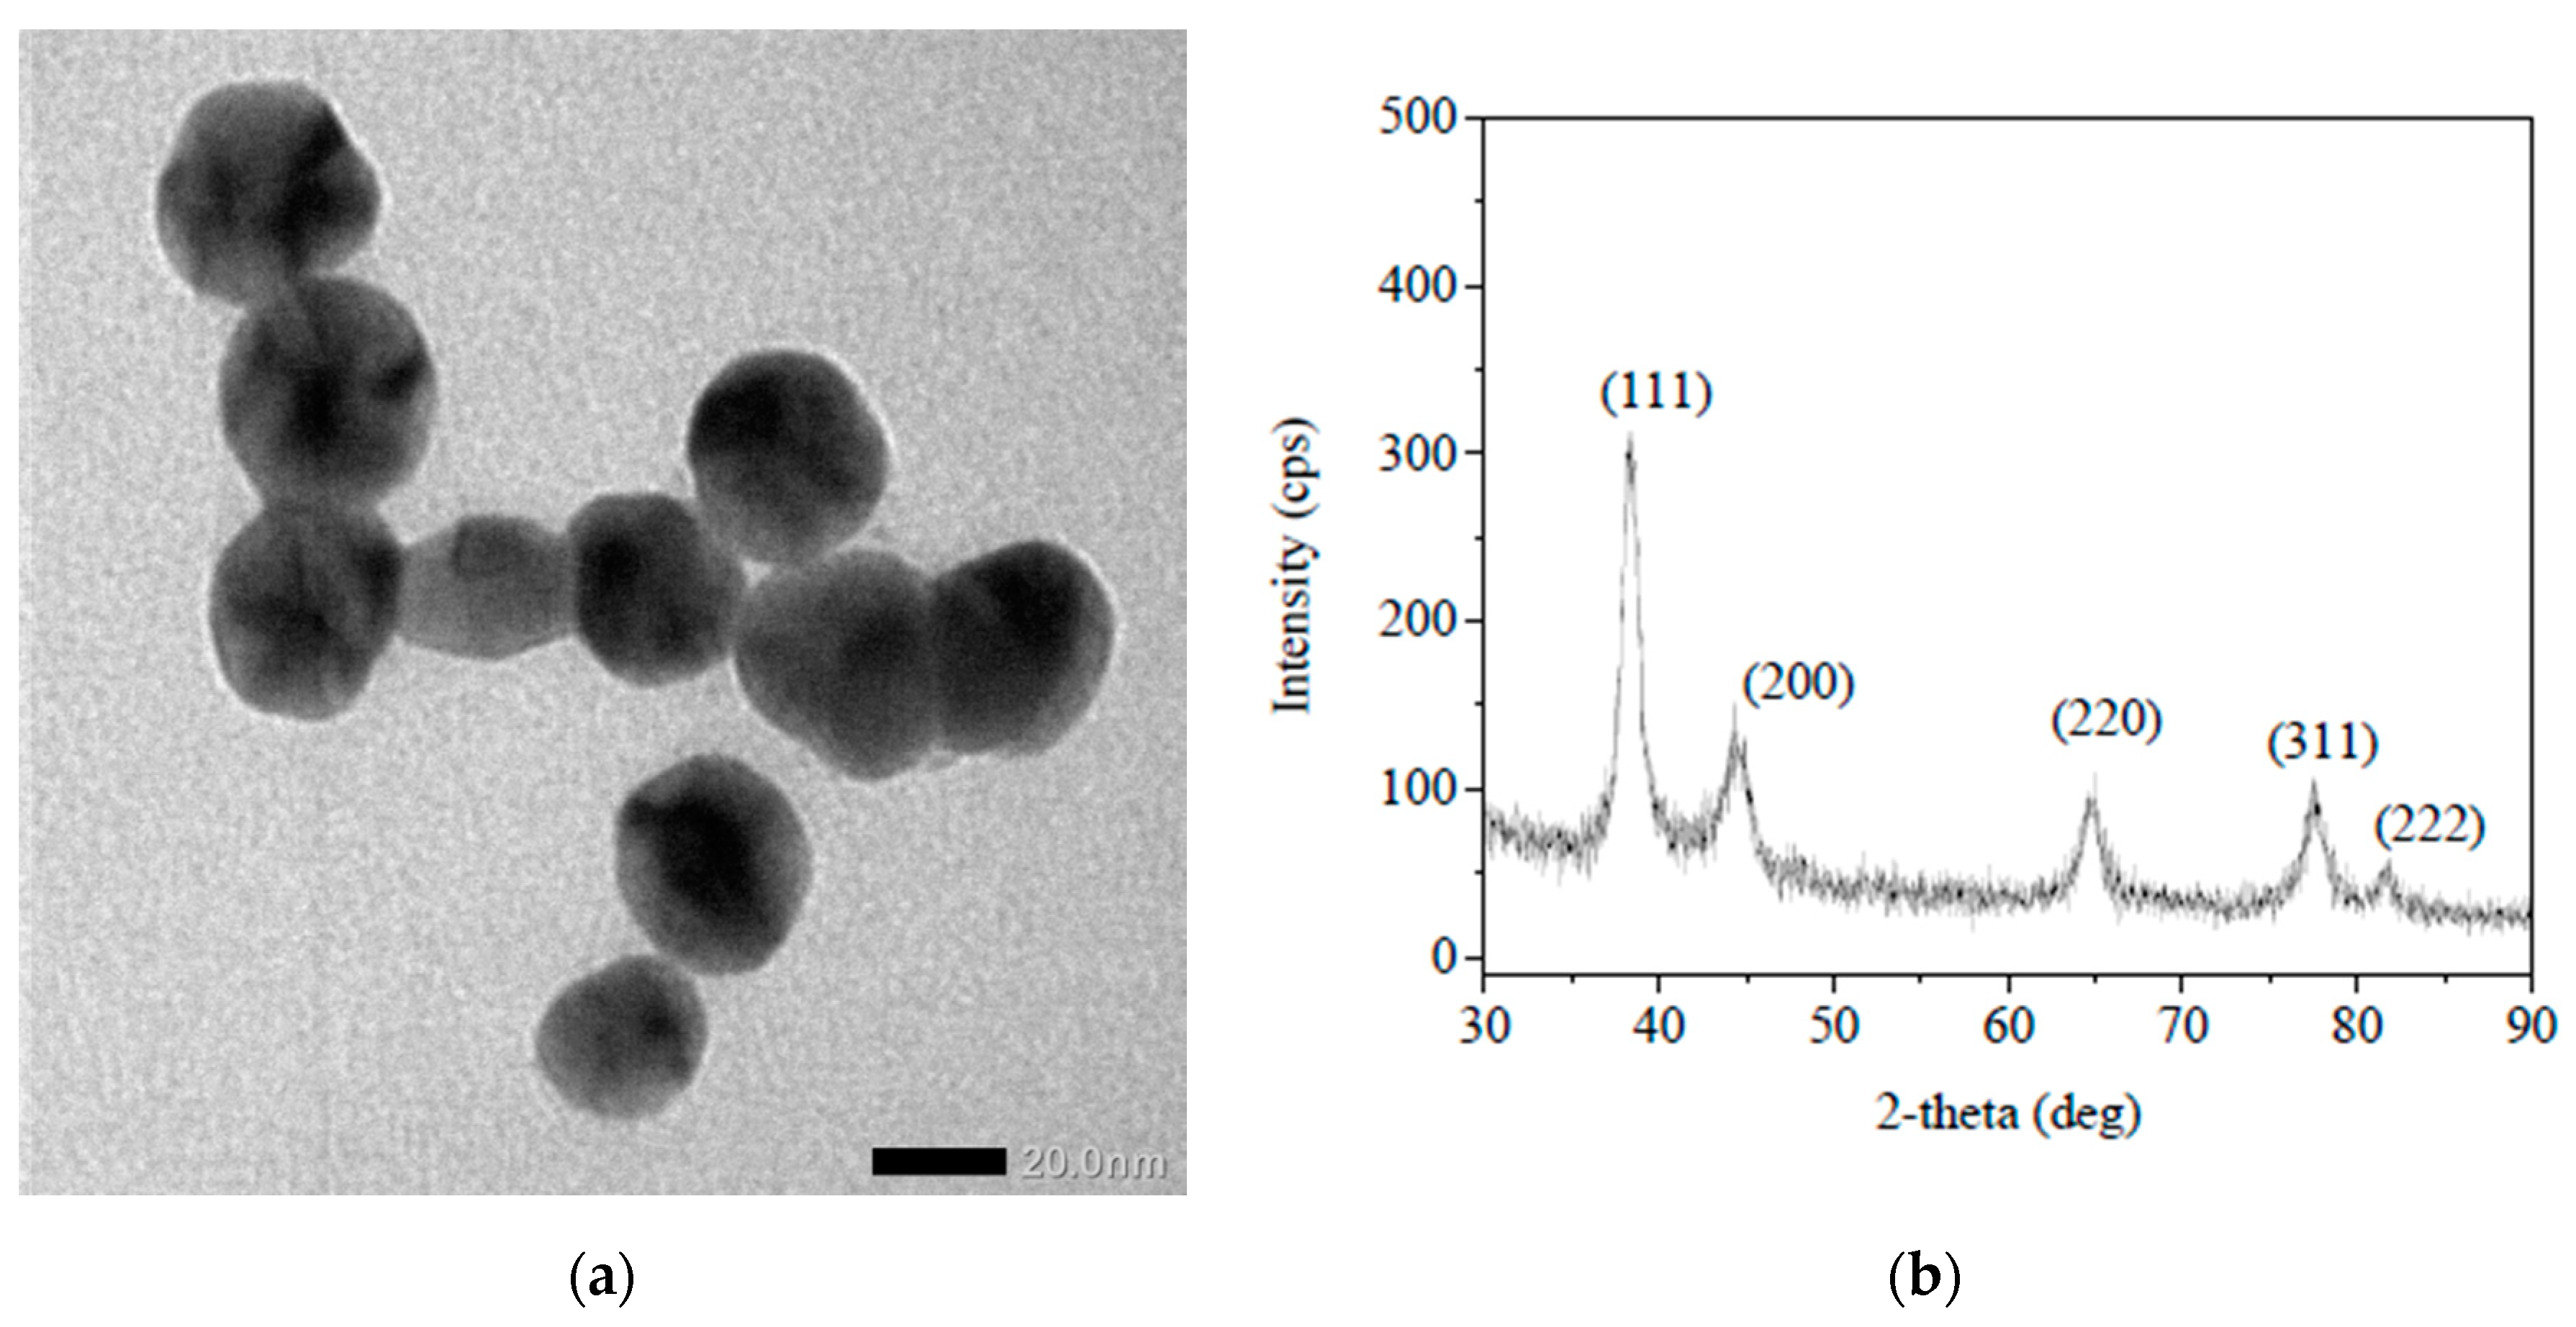
Figure 1. (a) TEM image of colloidal Ag nanoparticles (AgNPs) prepared in polyvinyl alcohol (PVA) solution by use of ascorbic as a reducing agent, (b) XRD pattern of AgNPs recorded after separation by centrifuge and drying.
Chemosensors 07 00028 g001
Figure 2. (a) Localized surface plasmon resonance (LSPR) absorbance spectra of colloidal AgNPs after addition of various cations at a concentration of 250 µg/mL, (b) calculated LSPR absorbance decrease after addition of the cations. The error bars were included as the measurement was repeated (n = 5).
Chemosensors 07 00028 g002
Figure 3. (a) LSPR spectra of colloidal AgNPs after addition of Pb2+ at different concentrations in the presence of dithizone, (b) Zoomed area with selected concentrations of Pb2+.
Chemosensors 07 00028 g003
Figure 4. (a) Calibration curve of colorimetric sensing of Pb2+ in the concentration range of 0–10.0 µg/L, (b) Color of the AgNPs colloid with Pb2+ concentration of (a) 0, (b) 0.500, (c) 0.750, (d) 1.00, (e) 2.00, (f) 3.00, (g) 4.00, (h) 5.00, (i) 6.00, (j) 7.00, (k) 10.0, (l) 25.0, (m) 50.0, (n) 75.0, (o) 100, (p) 250, (q) 500, (r) 750, and (s) 1000 µg/L.
Chemosensors 07 00028 g004
Figure 5. LSPR spectra of colloidal AgNPs after addition of Pb2+ at different concentrations in the absence of dithizone.
Chemosensors 07 00028 g005
Figure 6. (a) Complex of Pb2+ and dithizone; (b) Interaction between AgNPs and disulfide of dithizone in Pb(II)-dithizone.
Chemosensors 07 00028 g006
Figure 7. The TEM image of colloidal Ag nanoparticles after addition of the complex of Pb(II)-dithizone.
Chemosensors 07 00028 g007