Article

Effect of Cholesterol Anchoring Group on the Properties of G-Quadruplex-Based FRET Probes for Potassium Ion

by
Angelika Swiatkowska
and
Bernard Juskowiak
*
Faculty of Chemistry, Adam Mickiewicz University, Poznan 61-614, Poland
*
Author to whom correspondence should be addressed.
Chemosensors 2014, 2(4), 267-286; https://doi.org/10.3390/chemosensors2040267
Submission received: 31 August 2014 / Revised: 13 October 2014 / Accepted: 15 October 2014 / Published: 21 November 2014
(This article belongs to the Special Issue Nucleic Acid Probes)

Abstract

:
In this study we report on the spectral properties and G-quadruplex folding ability of fluorescent oligonucleotide probes modified by the attachment of a cholesterol moiety. These probes were designed and studied in order to verify their potential as potassium-sensing devices that can be incorporated into the cellular membrane. The 19-meric guanine-rich deoxyoligonucleotide was labeled with reporter fluorescent FRET groups (FAM and TAMRA) and a cholesterol anchor was attached using different approaches. The probes exhibited abilities to fold into a quadruplex structure and to bind metal cations (Na+ and K+). In an unbound state, both termini of the oligonucleotide are separated, thus fluorophores do not interact with each other and the probe exhibits an unperturbed fluorescence spectrum. In the presence of K+, the quadruplex structure is developed such that it enables fluorophores to be arranged in close proximity, causing generation of a different fluorescence spectrum (FRET signal). Folding properties of probes and their spectral behavior were examined by recording the UV-Vis, fluorescence emission, and excitation spectra (FRET efficiency), and the temperature stability of G-quadruplex structures adopted by probes (melting profiles). Fluorescence energy transfer efficiency increased with increases in sodium or potassium ion concentrations in an aqueous solution, which indicated that the probes retained their cation-binding properties and could be promising candidates for potassium sensing at the cell membrane interface.

Graphical Abstract

1. Introduction

The self-assembly of guanylic acid derivatives has been known for more than a century [1] and the structural basis for this phenomenon was elucidated in the 1960s [2]. G-quadruplex (G4 DNA) structures are generated by a core of two or more π–π stacked G-quartets, which are stable planar arrangements of four guanine residues that are hydrogen-bonded via Hoogsteen pairings. G4 DNA structures may form under physiological conditions and show different topologies, the complexity of which depends on six variable parameters: (i) the oligonucleotide sequence; (ii) the number of oligonucleotide strands (e.g., unimolecular, bimolecular, or tetramolecular); (iii) the directionality of strands (e.g., parallel, antiparallel, or mixed); (iv) the angles of the glycosidic bonds (e.g., syn or anti); (v) the size and type of intervening loops (e.g., diagonal loops, lateral loops, and double chain reversal loops), and (vi) environmental factors, such as interacting alkali metal ions, molecular crowding, and the presence of binding ligands [3,4]. Many nucleic acid sequences rich in guanosines are capable of forming G-quadruplexes within cells. These include telomeric DNA, promoter regions of some oncogenes, and the thrombin-binding aptamer [5,6,7,8].
Cations play a critical role in stabilizing G-quadruplex structures by occupying the central cavity and neutralizing the electrostatic repulsion of inwardly pointing guanine O6 oxygens. It was recognized early on that the ability to stabilize guanosine gels differed greatly between cations [9], suggesting that the ionic radius is important for complex stability. In the alkali series, K+ promotes the most stable G-quadruplexes, K+ >> Na+ > Rb+ > Cs+ >> Li+. Electrostatic effects and hydration energy are also likely to affect the relative ability of cations to stabilize G-quadruplexes [10,11,12,13]. The stability of G-quadruplexes depends not only on the identity of the stabilizing cation, but also on the DNA length and sequence, the length of intervening loops, and the strand stoichiometry and alignment [14,15,16].
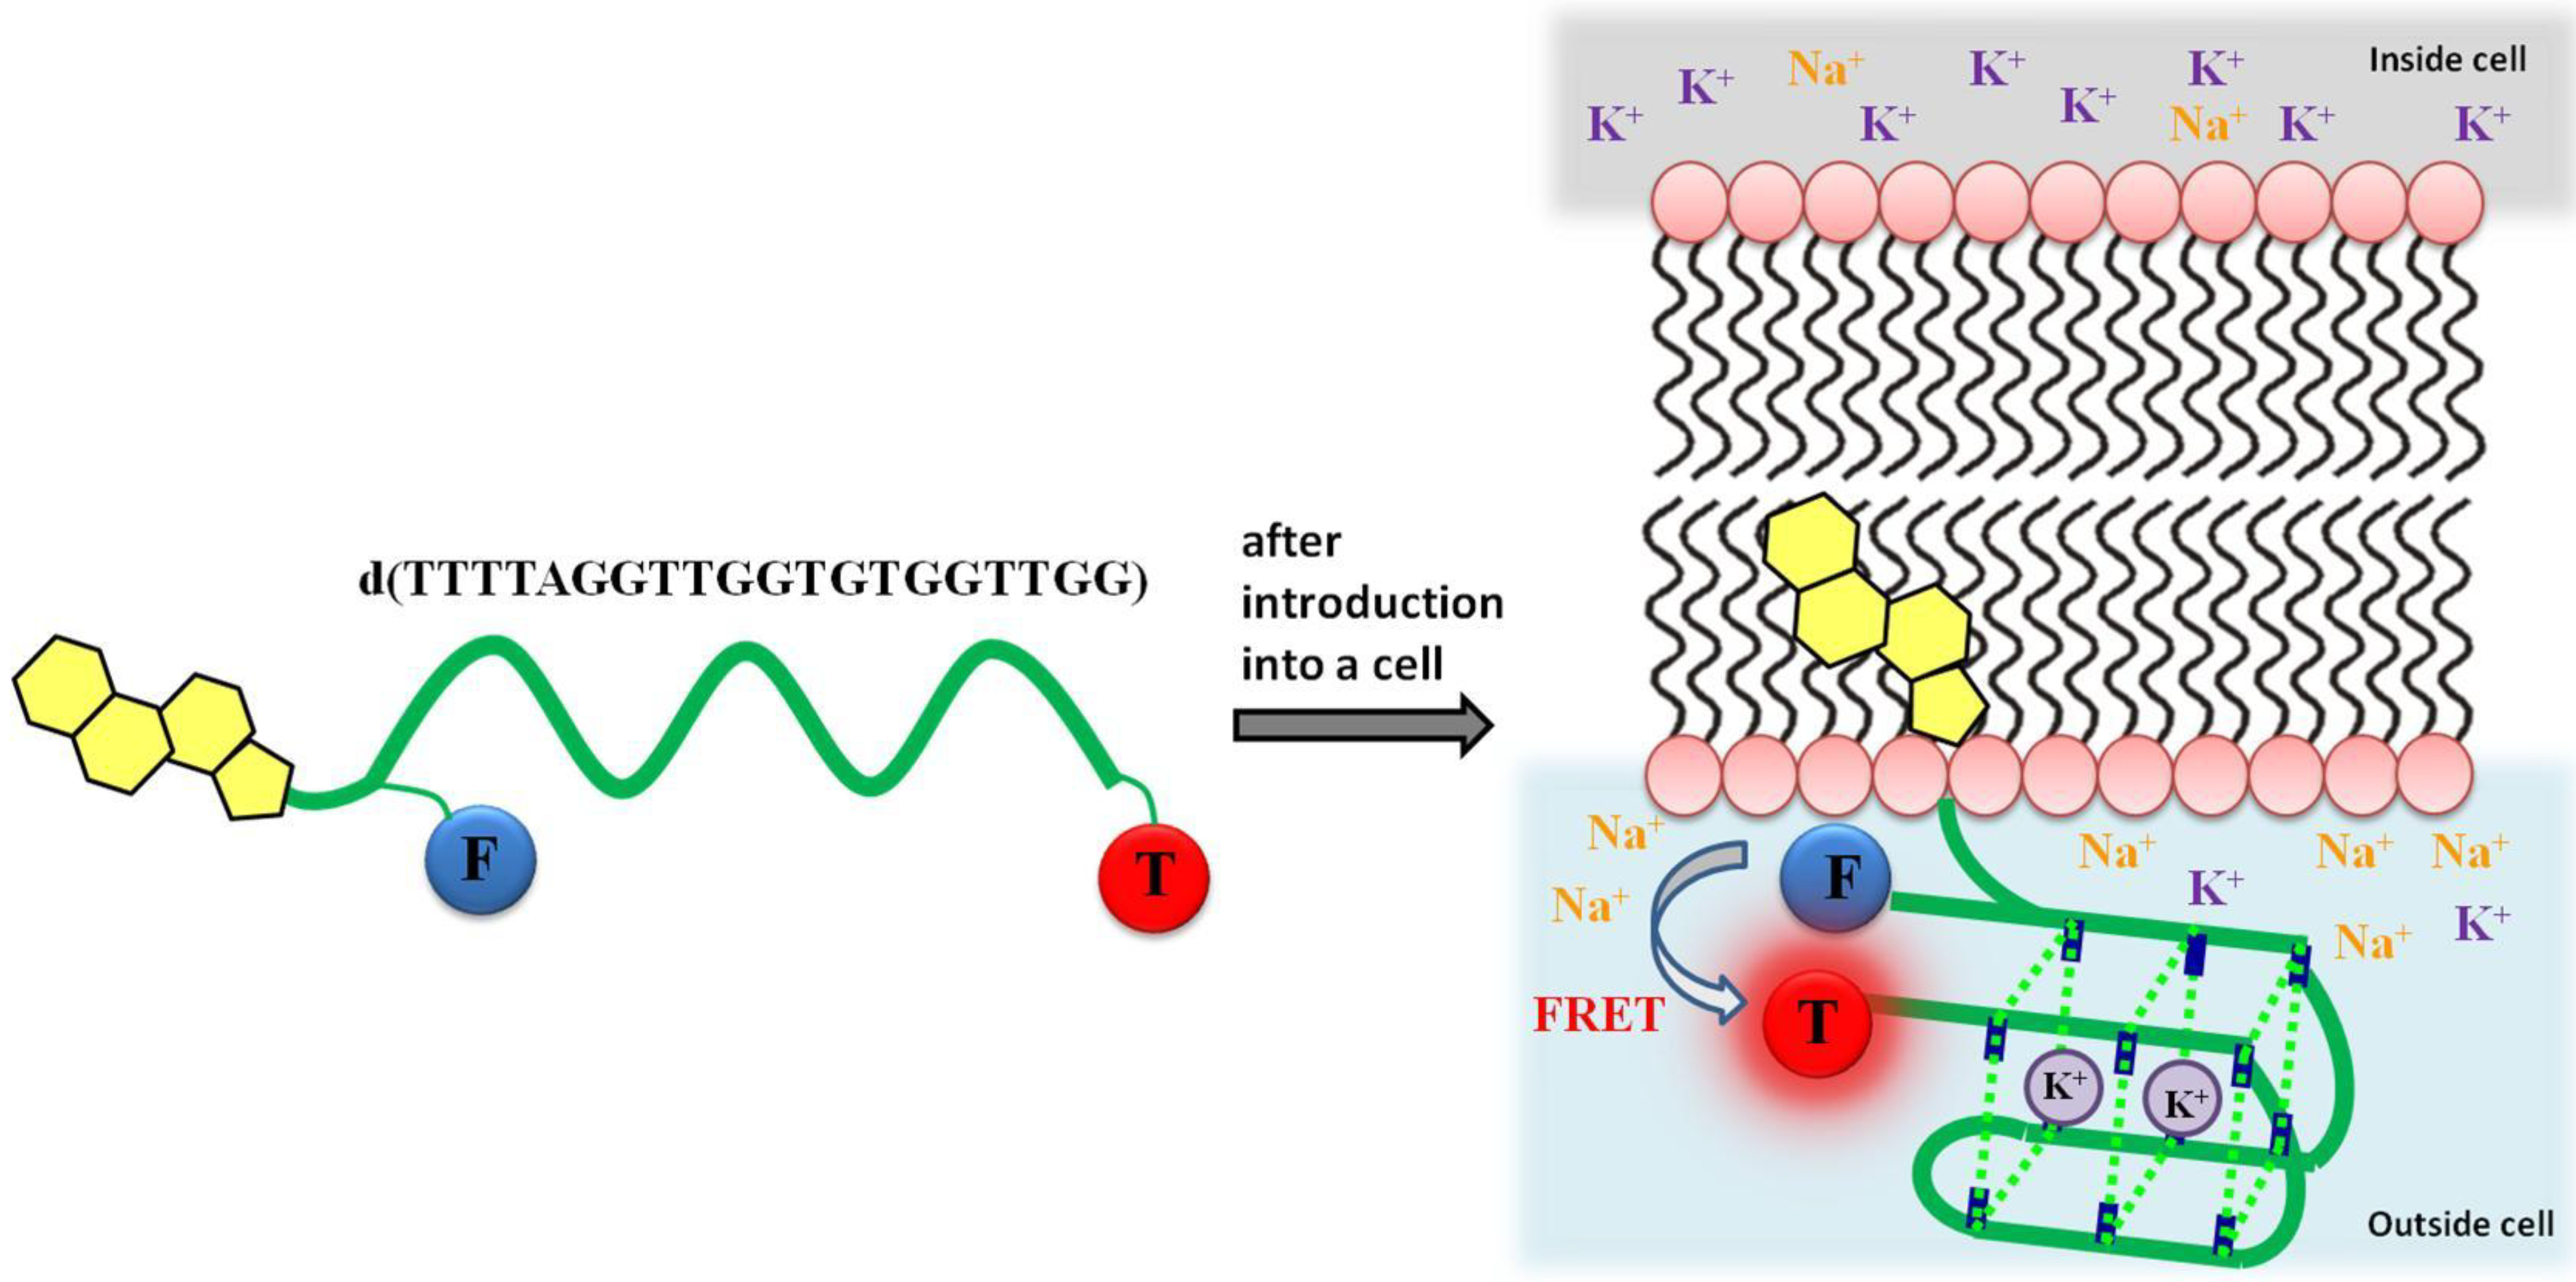
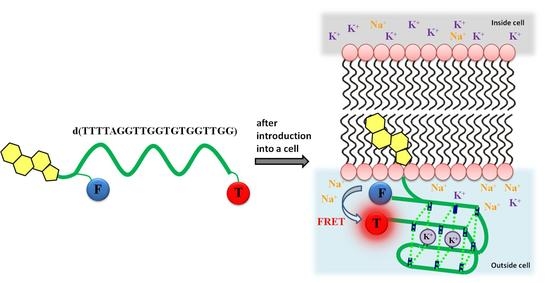
Studies by Sen and Gilbert, and by others [17,18,19], showed that these cation-dependent G-quadruplex structures are thermodynamically stable under physiological conditions. K+ and other alkali metal (Na+, Mg2+, Ca2+) ions play an important role in biological systems. For example, potassium participates in the regulation of cell membrane potentials, affects the physiological function of nerves, and influences cell apoptosis [20,21]. Since abnormal K+ concentration in the blood has been correlated with several diseases (e.g., cardiac arrest, congenital hemiplegia, and diabetic acidosis), the monitoring of K+ in blood has become a very important challenge [22]. The detection of K+ in blood is carried out using a potassium-selective electrode [23], but the detection of K+ in a cell is also very important. K+ exists in cells at the highest concentration, and together with the Na+ ion, controls the osmotic pressure in each cell and maintains homeostasis of the cell volume. The difficulty in monitoring K+ in extracellular conditions comes from the coexistence of an excess of sodium ions (Na+); small variations in K+ concentration (around 5 mM K+) should be monitored in the presence of 100 mM Na+ concentration. We and other groups [11,24,25,26] reported on very selective and sensitive K+ probes based on quadruplex-forming oligonucleotides, but they have not been designed to be incorporated into the cellular membrane for interfacial K+ monitoring. Scheme 1 shows the model fluorescent oligonucleotide probe modified by attachment of a cholesterol moiety for potassium sensing at the cell membrane interface.
Scheme 1. Concept showing the model of fluorescent oligonucleotide probes modified by the attachment of a cholesterol moiety for potassium sensing at the cell membrane interface.
Chemosensors 02 00267 g009
Incorporating such a probe into the cell membrane is possible in cases where oligonucleotides comprise hydrophobic cholesterol-anchoring moieties. Patolsky et al. [27] made use of cholesterol-modified ssDNA for spontaneous anchoring into the hydrophobic interior of lipid membranes. This means of anchoring DNA is fast (tens of minutes), does not require chemically modified lipids to be introduced, and makes use of a naturally occurring membrane constituent, thus eliminating the risk for side effects induced by chemically reactive lipid head groups on incorporated membrane constituents. Pfeifer and Hooke [28,29] showed that the hydrophobic anchor enables a practically irreversible coupling of the oligonucleotide to the membrane, and that the binding efficiency of DNA coupled to a lipid membrane with two cholesterol moieties gave better results.
A routine identification process of G-quadruplexes usually requires such techniques as: circular dichroism (CD), nuclear magnetic resonance (NMR), X-ray diffraction, mass spectrometry, and UV-Vis spectroscopy [30]. Fluorescence spectroscopy, particularly the resonance energy transfer technique (FRET), has been recognized as a powerful tool to study G-quadruplexes due to its high sensitivity and multidimensionality. Fluorescence resonance energy transfer (FRET) is a distance-dependent interaction between the electronic excited states of two dye molecules in which excitation is transferred from a donor molecule to an acceptor molecule without emission of a photon. The efficiency of FRET is dependent on the inverse sixth power of the intermolecular separation, making it useful over distances comparable with the dimensions of biological macromolecules. Thus, FRET is an important technique for investigating a variety of biological phenomena that produce changes in molecular proximity. Due to its high sensitivity to molecular distances, FRET has been extensively used in biomedical research to determine molecular interactions. Recently, FRET has been successfully applied to study stability and structural rearrangement of quadruplexes and to explore molecular mechanisms of quadruplex interactions with other molecules or ions. [31]. Intramolecular folding of a flexible single-stranded DNA molecule into a compact G-quadruplex is a structural transition leading to closer proximity of its 5’ and 3’ ends. Thus, labeling both ends of a DNA strand with donor and acceptor fluorophores enables monitoring of the quadruplex formation process by means of the FRET signal [32,33]. The application of G-quadruplex-based FRET sensors for real time K+ monitoring under physiological conditions appeared not to be an easy task because of saturation of the probe response at submillimolar concentration of K+ and lower FRET efficiency in the presence of K+ compared with that for Na+ [34,35,36].
Taking into account all the issues discussed above, we have designed new probes that could be useful for monitoring the potassium gradient at the cell surface or for measuring changes in membrane potential as they occur in cardiac tissue during hyperpolarization. Other applications may include use of the probes to evaluate the effect of cardiotonic steroids on sodium-potassium pump activity. The new oligonucleotide-based fluorescent probes carry two fluorophores (FAM and TAMRA) and are further modified by the attachment of a cholesterol moiety. These probes were designed and studied in order to verify their potential as potassium-sensing devices that could be incorporated into the cellular membrane. One should consider that incorporation of the probe into the membrane may affect spectral characteristics of fluorescent labels and/or can influence the cation-binding affinity of the probe and FRET efficiency. The 19-meric oligonucleotide with the thrombin-binding aptamer (TBA) sequence of d(GGTTGGTGTGGTTGG) as potassium recognition element was chosen. The TBA forms the quadruplex structure when potassium is present at the physiological range (low millimolar concentration). On the other hand, the feasibility of the probe to adsorb on the cell membrane is a crucial factor in considering the suitability of the probe for biological applications. A cholesterol anchor was attached using different approaches in order to identify factors affecting performance of probes and select the best candidate for cellular application. Four different fluorescent dual-labeled (FAM/TAMRA) oligonucleotides with or without a cholesterol anchor were investigated (Table 1): (i) F19T probe without cholesterol moiety; (ii) ChF19T probe with cholesterol moiety attached to the 5’-end of the oligonucleotide; (iii) Ch16F19T probe with cholesterol moiety attached to the additional 16-meric oligonucleotide spacer that is able to hybridize with the Ch16’ complementary strand (16 nucleobases equipped with a cholesterol anchor); and (iv) 16F19T probe without cholesterol moiety but with the additional spacer (16 nucleobases) also capable of duplex formation with the complementary Ch16’.
We present here the spectral properties and G-quadruplex folding ability of these fluorescent oligonucleotide probes. The UV-Vis, fluorescence emission, and excitation spectra (FRET efficiency) are reported, and the temperature stability of G-quadruplex structures adopted by probes (melting profiles) is discussed. Binding affinities of K+/Na+ complexes have also been evaluated.

2. Experimental Section

2.1. Materials

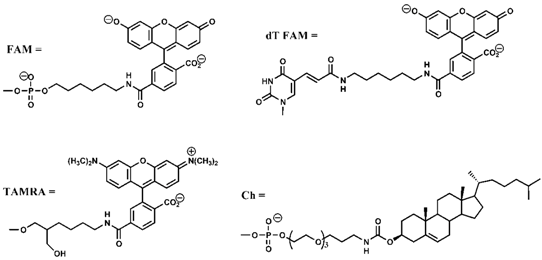
Four oligodeoxyribonucleotide-based FRET probes (F19T, ChF19T, Ch16F19T, and 16F19T) with 6-carboxyfluorescein (FAM) and 6-carboxytetramethylrhodamine (TAMRA) labels and a cholesterol moiety as well as a complementary DNA strand equipped with a cholesterol “anchor” (Ch16’) were synthesized and HPLC-purified by Eurogentec (Belgium). All concentrations were estimated by UV absorption and expressed in strand molarity. FAM acts as a donor of energy in the system (λex = 494 nm, λem = 520 nm), while TAMRA is the energy acceptor (λex = 560 nm, λem = 583 nm). The 19-meric thrombin-binding aptamer (TBA) with a d(TTTTAGGTTGGTGTGGTTGG) sequence was chosen to allow for quadruplex formation in the presence of K+ or Na+. In order to form a suitably flexible structure with an optimum ability to associate with the hydrophobic part of the lipid membrane, and to form G-quadruplex, the oligonucleotide has the cholesterol-anchoring moiety, which is linked to the deoxyribose via a triethyleneglycol (TEG) spacer (Table 1). In the case of probe F19T (without cholesterol group), FAM and TAMRA labels were attached at the 5'- and 3'-termini of the oligonucleotide, respectively, using six-carbon linkers as described elsewhere [26]. The ChF19T probe comprises a cholesterol moiety attached to the 5' end of the oligonucleotide, TAMRA is attached to the 3' end, and FAM is placed internally via dT modification. The Ch16F19T probe with a cholesterol moiety attached to the oligonucleotide chain by an additional sequence (16 bases: CATCGAGCGTACGTTA) is capable of hybridizing to a complementary DNA strand equipped with a cholesterol “anchor” (16Ch’). Similarly, the 16F19T probe without a cholesterol moiety possesses the same additional sequence (16 bases) able to hybridize with 16Ch’. The primary sequences and names of the fluorescent oligonucleotides are given in Table 1.
Table 1. Oligonucleotide probes used in this study.
Abbreviation Sequence and Structure
F19TFAM-5’GGTTGGTGTGGTTGGATTT3’-TAMRA
16F19T5’CATCGAGCGTACGTTA (dT FAM) TTTAGGTTGGTGTGGTTGGATTT3’-TAMRA
ChF19TCh-5’(dT FAM)TTTAGGTTGGTGTGGTTGGATTT3’-TAMRA
Ch16F19TCh-5’CATCGAGCGTACGTTA(dT FAM) TTTAGGTTGGTGTGGTTGGATTT3’-TAMRA
Ch16’5’TAACGTACGCTCGATG3’-Ch
Chemosensors 02 00267 i001
Potassium chloride and sodium chloride (Sigma Aldrich, extra pure quality) were used as received, and acetonitrile (HPLC grade) and triethylamine (99.5%) were used in the HPLC studies. In these investigations, ultrapure water (Polwater, Poland) was used (electrical resistivity of 18 MΩ cm) and the sample pH was adjusted to 7.5 by adding 10 mM Tris-CH3COOH buffer or 10 mM cacodylate buffer.

2.2. Methods

2.2.1. UV-Vis Absorption Studies

UV-Vis spectra and thermal denaturation profiles were obtained with a Cary 100 UV-Vis spectrophotometer with temperature controlled (Agilent Technologies, Australia). All experiments were performed in a 10 mM cacodylate buffer, 0.1 M KCl, pH 7.5, at 1 μM oligonucleotide strand concentration. The sample solutions were vortexed and placed in 1 cm quartz optical cells. For the hybridization experiment, the total strand concentration of Ch16’ titrant was 2 μM (1 μΜ of fluorescent probe). Absorption spectra of the oligonucleotide probes were recorded in the spectral range of 200–800 nm by increasing the temperature by 5 degrees every 5 min (10–90 °C). Thermal denaturation profiles were measured at a heating rate of 1 °C/min with absorbance monitoring at 260 nm and 295 nm. The experiment was conducted in two stages: pre-heating of the sample at 90 °C for 5 min (this process was used to dissociate any intermolecular G-quartet-mediated structures that may have formed), followed by cooling (in the range of 90–10 °C) to lead to the formation of G-quadruplex (cooling profile), and subsequent heating in the range of 10–90 °C (heating profile).

2.2.2. Fluorescence Studies

All measurements were performed on a Cary Eclipse spectrofluorimeter (Agilent Technologies, Australia) with 5 nm excitation and 5 nm emission slits and were carried out using 0.4 × 1 cm quartz cuvettes, containing 1 mL of solution. Excitation spectra were recorded in the 200–550 nm range with the emission wavelength of 520 nm for FAM and 583 nm for TAMRA. Fluorescence emission spectra were recorded in the 500–800 nm spectral range with the excitation wavelength of 490 nm for FAM and 560 nm for TAMRA. A sample solution (1 mL) containing 0.2 μM of fluorescent oligonucleotide in 10 mM Tris-EDTA buffer (pH 7.5) was stirred and equilibrated in a quartz cell at 25 °C for 10 min; the spectra were not corrected. A typical investigation of metal cation effect in the concentration range of 0–0.1 M consisted of successive additions of small portions (0.1–33 μl) of a concentrated solution of 3 M KCl or 3 M NaCl salt, followed by stirring and thermal equilibration. Fluorescence spectra of probes were also recorded as a function of temperature (10–90 °C), using a Cary Peltier accessory in order to record the melting profiles of the probes. FRET efficiency that depended on G-quadruplex formation was evaluated using the ratio of the fluorescence intensity of the TAMRA acceptor excited by FRET to that for the FAM donor: (ratio) = F583/F520. The (ratio) calculation was carried out using the following equation: (ratio) = F583/F520 = (Fapp,583 − kxF520)/ F520 = Fapp,583/F520 − k, where Fapp,583 is the apparent TAMRA emission intensity read directly from the probe spectrum and k = F583/F520 is the correction factor for FAM contribution (calculated for spectrum of probe recorded at 95 °C (no G-quadruplex structure present)).

3. Results and Discussion

3.1. Spectral Properties of the Fluorescent Probes with Cholesterol Moiety
We have used HPLC with fluorescence and spectrophotometric detection to verify the analytical quality and purity of received probes (SI).
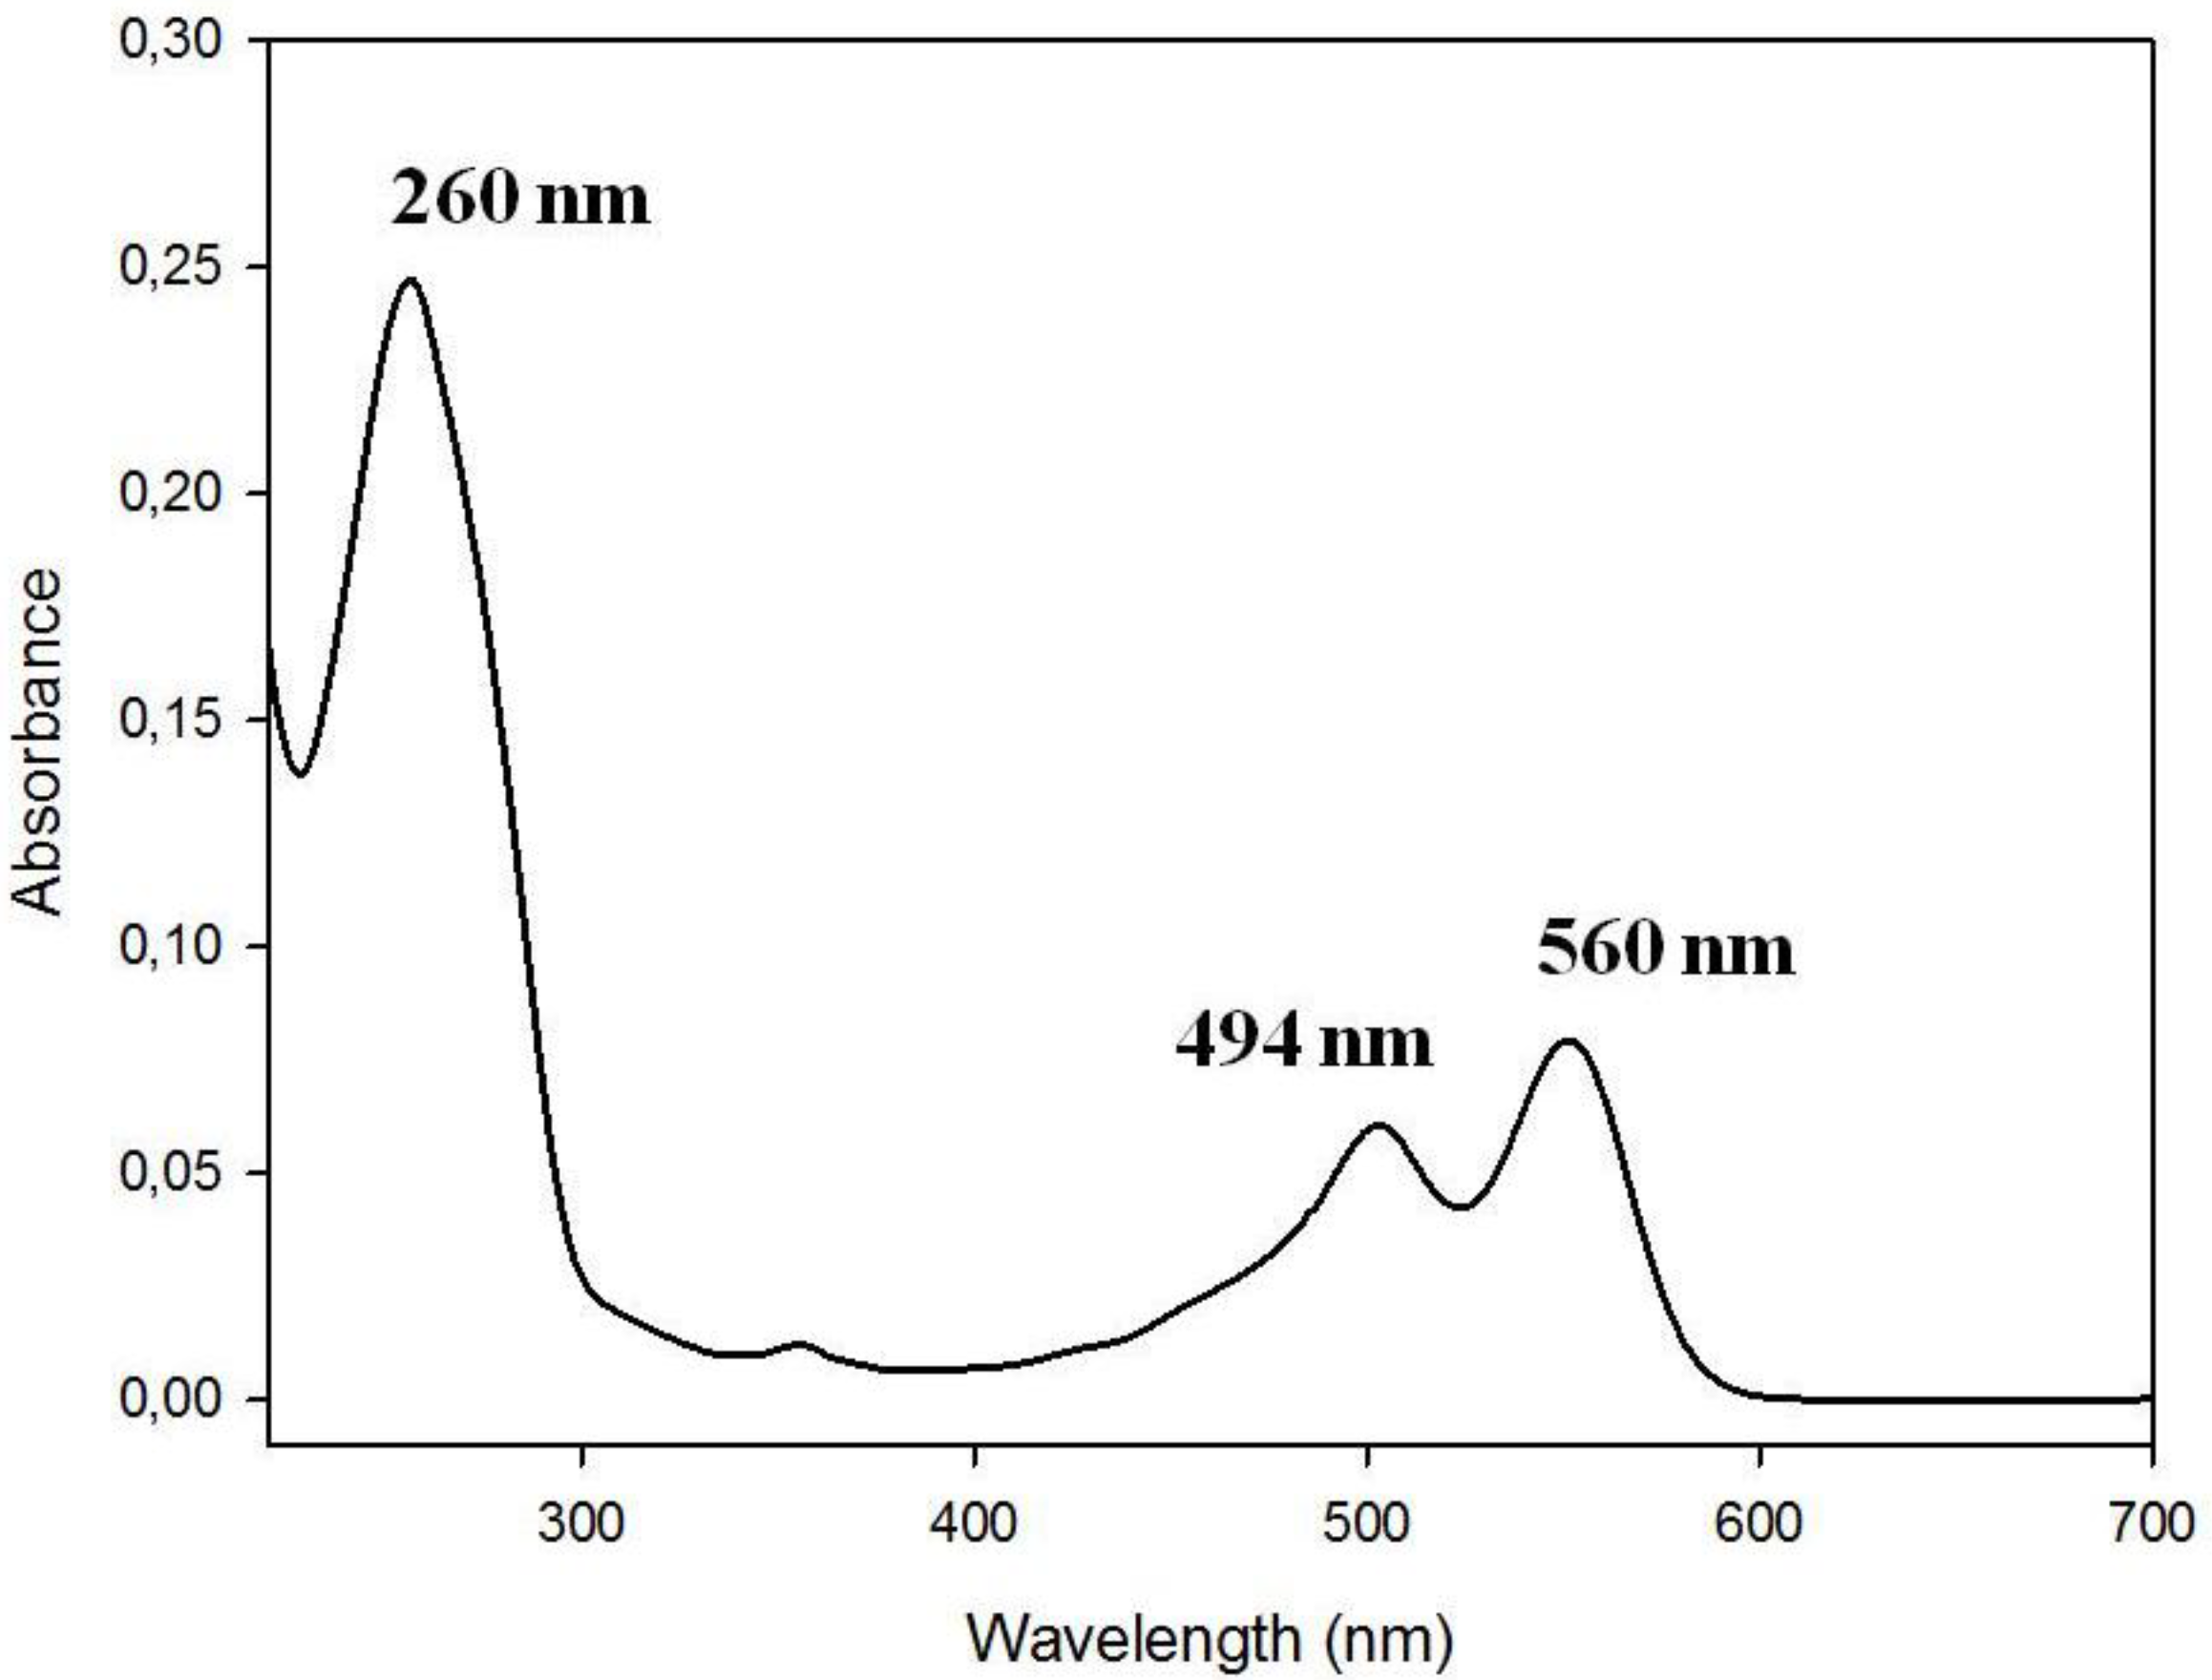
Figure 1. Absorbance spectra of 1 μM ChF19T in cacodylate buffer (10 mM, pH 7.5).
Chemosensors 02 00267 g001
All fluorescent probes exhibited absorption bands at 260 nm, 494 nm, and 560 nm, as expected for dual-labeled oligonucleotides with FAM and TAMRA (Figure 1). The long-wavelength absorption bands are characteristic of FAM and TAMRA (494 nm and 560 nm, respectively), but the band at 260 nm should be ascribed mainly to the absorption of nucleobases, as contribution from FAM and TAMRA fluorophores at this wavelength is less pronounced. It should be noted that very similar spectra were obtained for all probes studied, irrespective of whether they contained a cholesterol moiety or not. This is not surprising since cholesterol only has low molar absorptivity at 260 nm (ε~100 [37]).
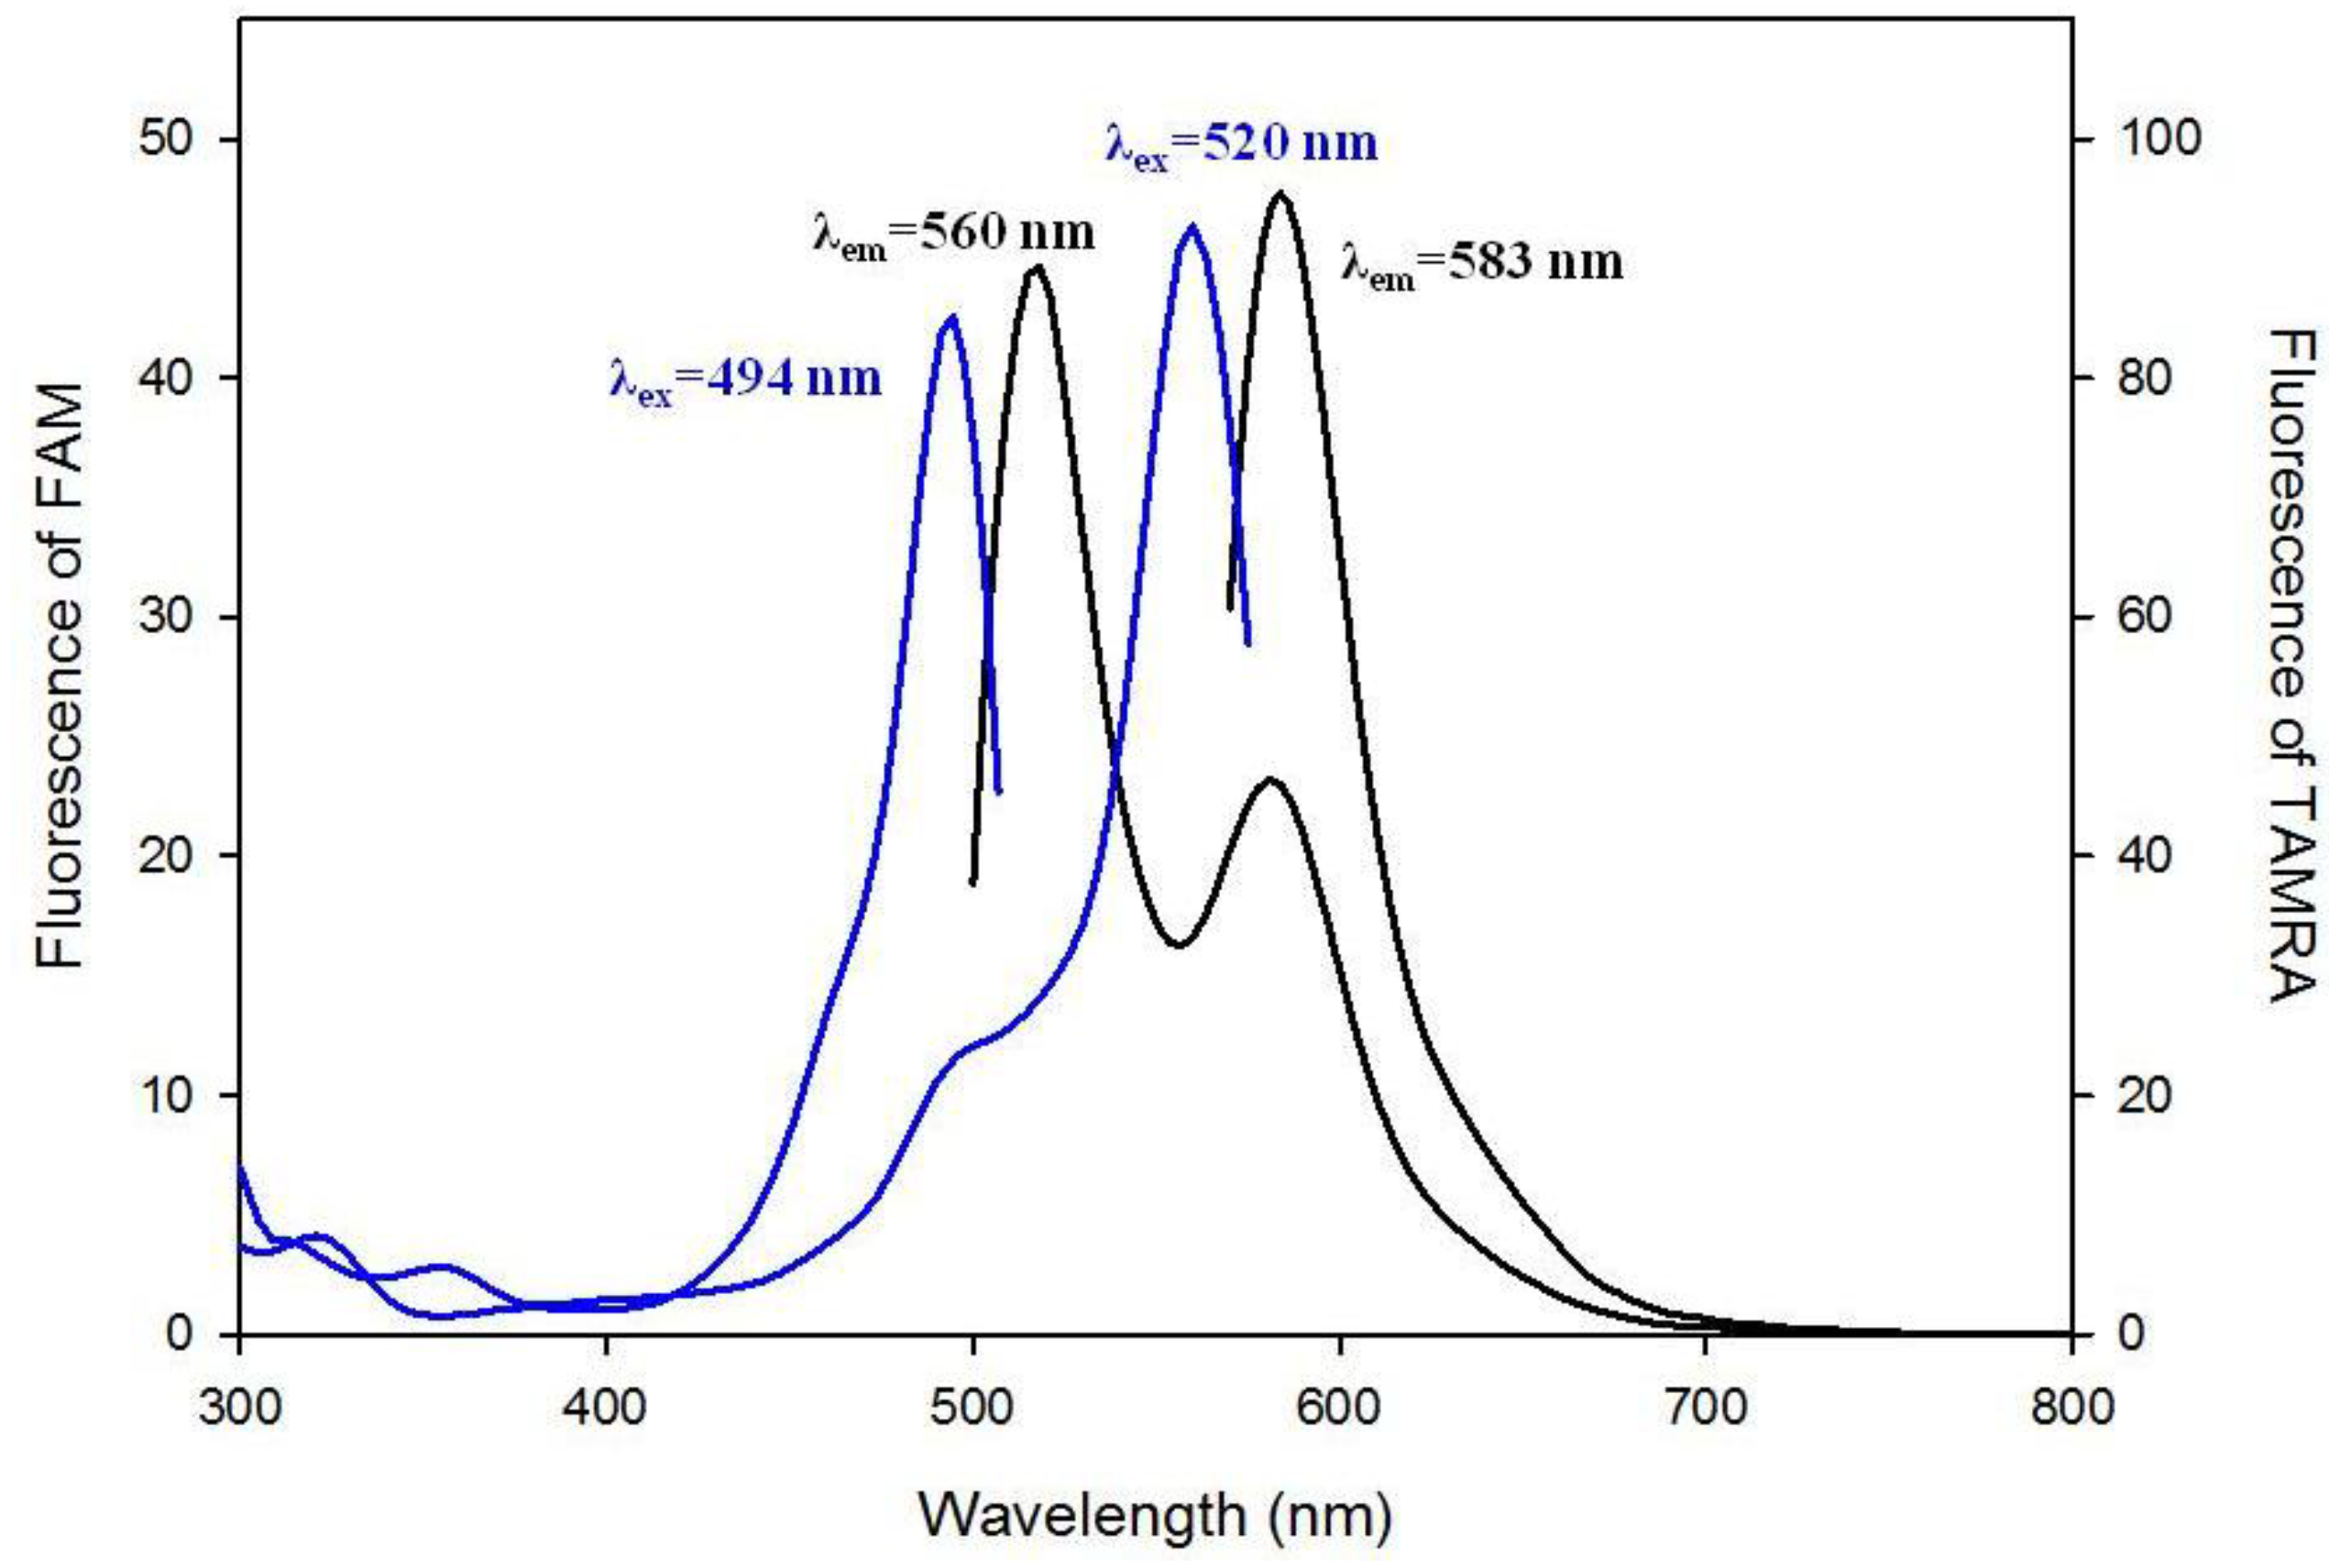
Excitation and emission spectra were acquired with the wavelength range for excitation from 300 to 550 nm and for emission from 500 to 800 nm. Spectral characteristics for all probes were similar and a spectrum for F19T probe is shown in Figure 2. Excitation of fluorescent probes at the FAM absorption band (490 nm) gave two fluorescence bands at 520 and 583 nm (FAM and TAMRA emission, respectively). Excitation at the TAMRA absorption band (560 nm) gave one band at 583 nm. Excitation spectra monitored at 520 nm (FAM emission band) exhibited one band at 494 nm. In turn, the excitation spectra monitored at 583 nm (TAMRA emission band) exhibited two bands: the main band at 560 nm and a very small band at 494 nm. These additional small bands observed for emission spectrum excited at the FAM absorption band and for excitation spectrum of TAMRA may indicate a residual FRET signal since the distance between fluorophores in a 19-meric oligonucleotide (ca. 80 Å) is comparable to the expected Förster radius (R0~65.0 Å) [24].
Figure 2. Fluorescence spectra for 0.2 μM F19T in cacodylate buffer (10 mM, pH 7.5).
Chemosensors 02 00267 g002

3.2. Stability of G-Quadruplex Structures

3.2.1. UV-Vis Melting Profiles
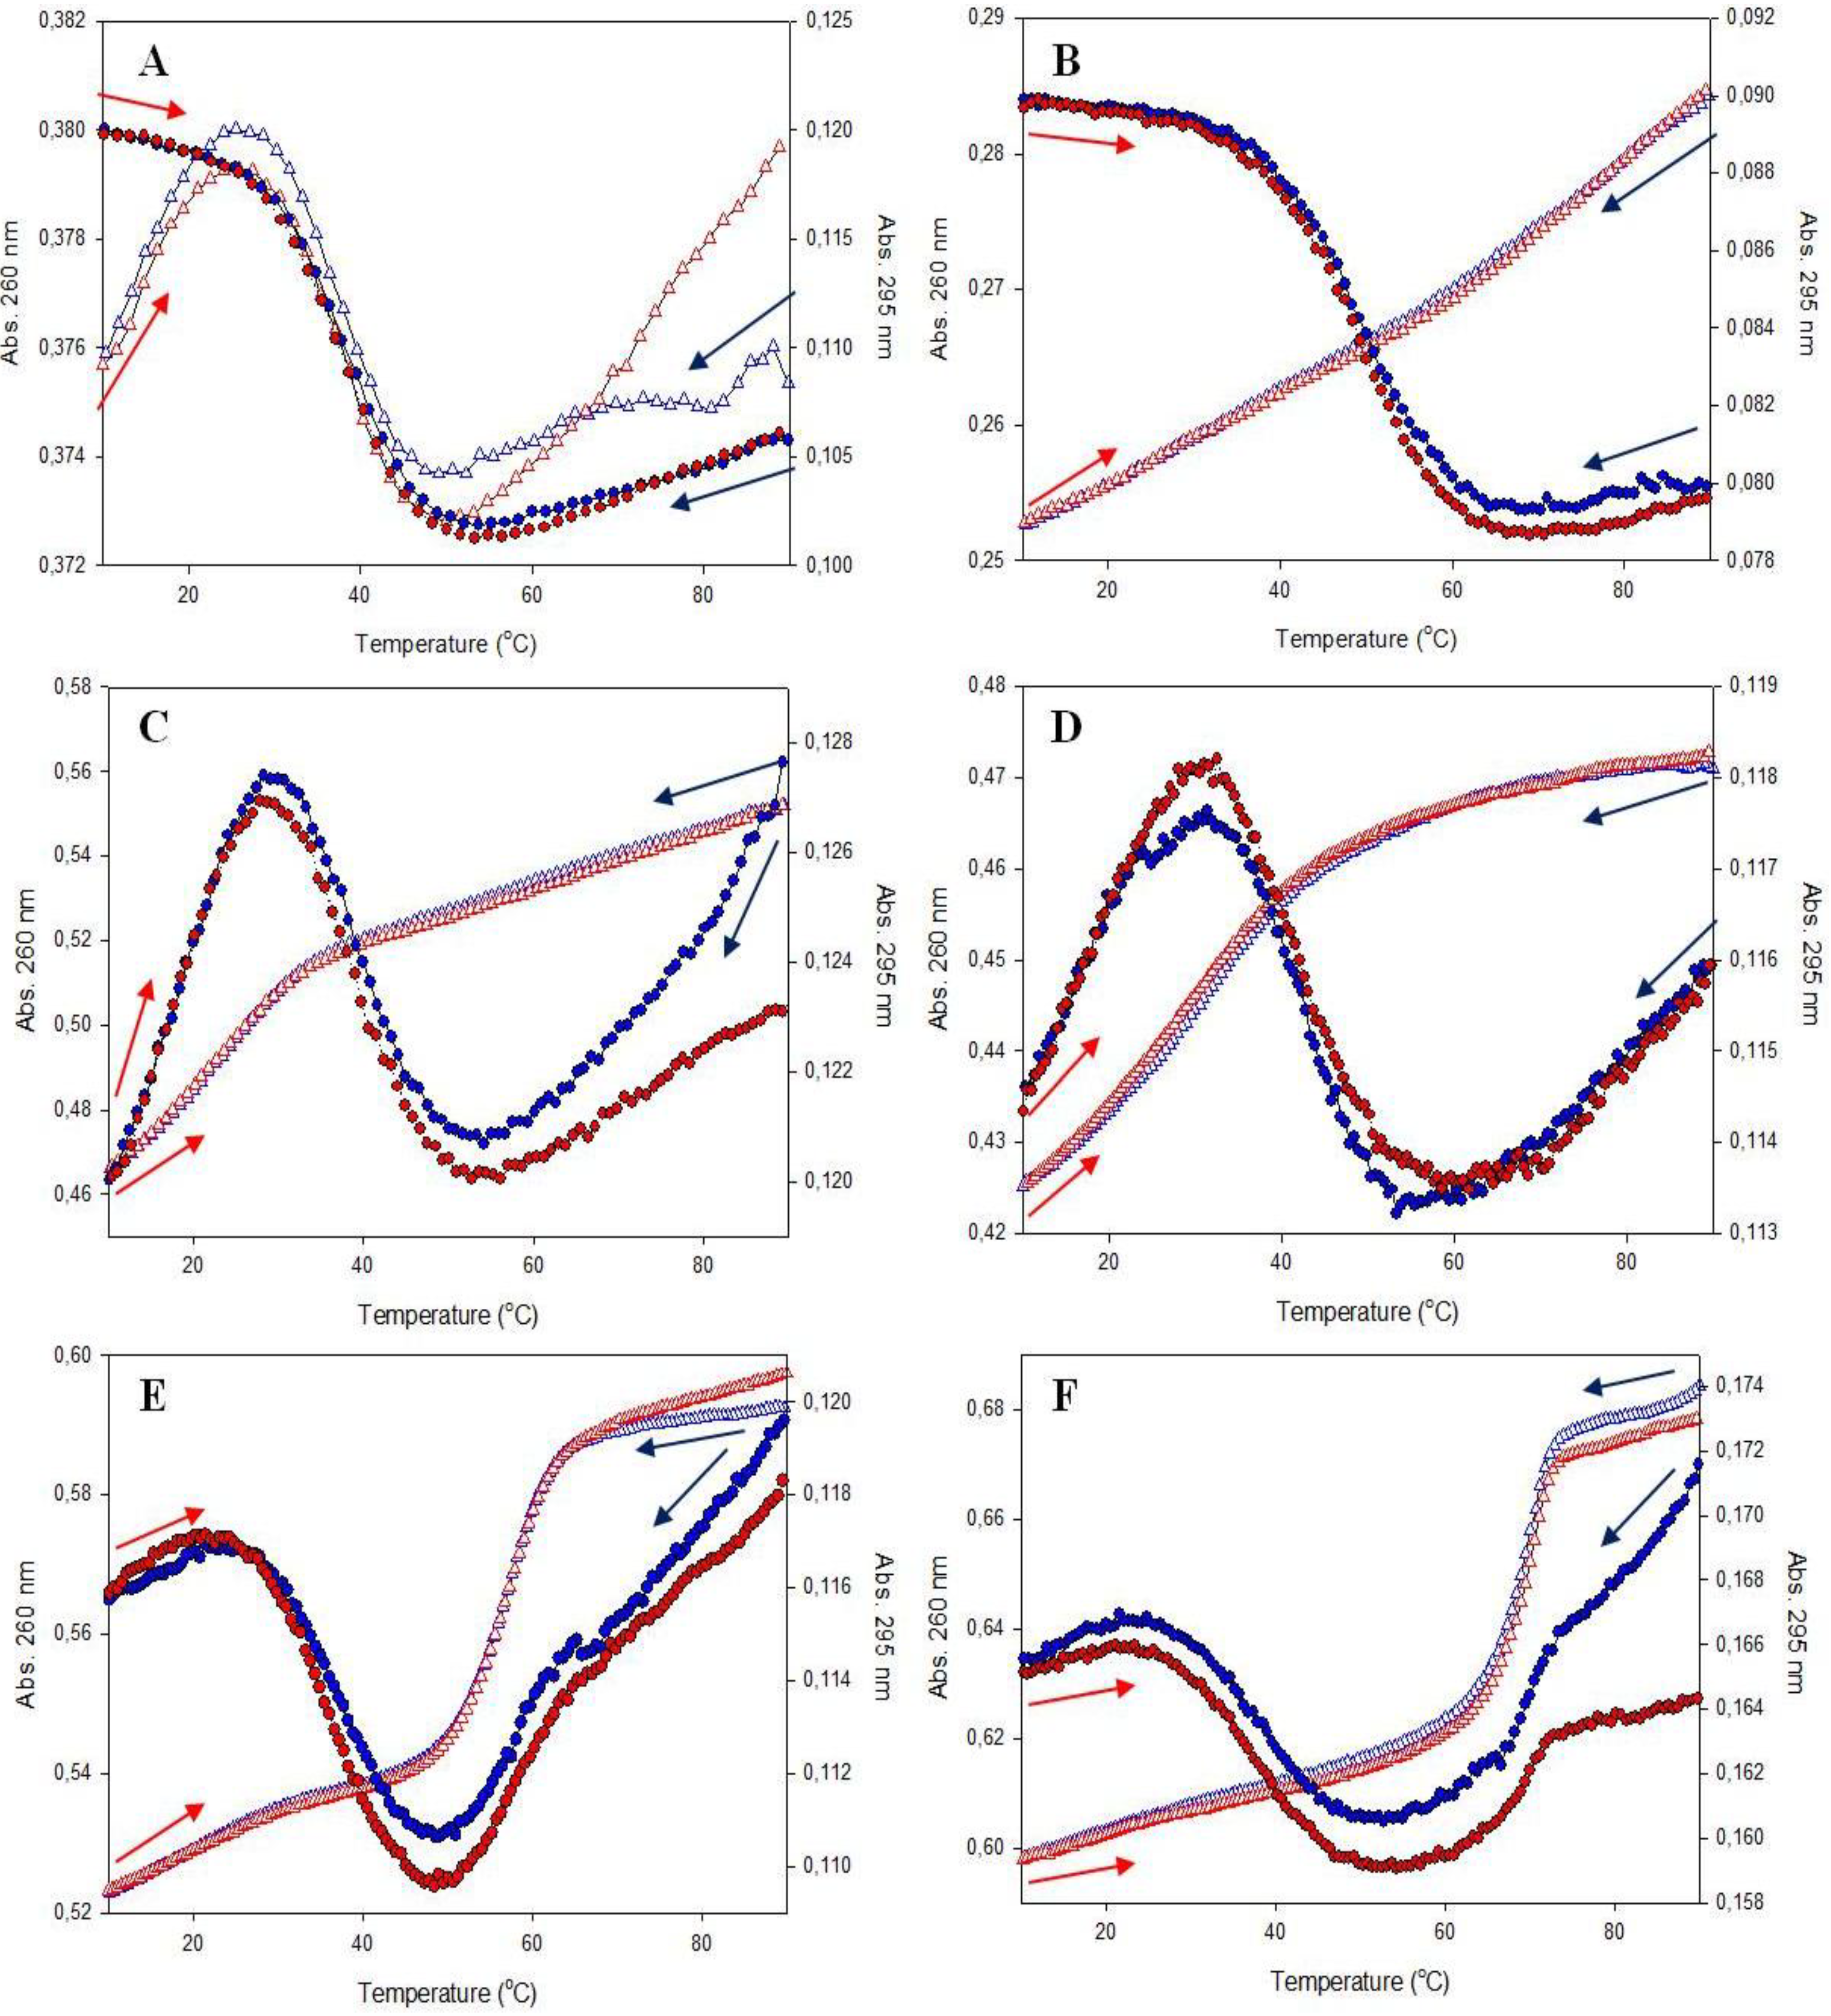
Changes in the absorbance or fluorescence of appropriately labeled oligonucleotides can be used to measure the stability and kinetics of G-quadruplex folding. We recorded the dependences of absorbance for fluorescent oligonucleotide probes vs. temperature. As previously noted by Scaria and colleagues [38], the difference spectrum exhibits an isosbestic point around 280 nm, whereas a net hyperchromism is observed upon G-quartet formation at 285 nm or higher wavelengths. For these reasons, we investigated whether the formation of the G-quadruplex structure could be followed at 295 nm for the investigated probes. Simultaneously, we recorded the melting curves at 260 nm (full circles) and 295 nm (open triangles); the results are shown in Figure 3 for the F19T (Figure 3A), ChF19T (Figure 3B), 16F19T (Figure 3C), and Ch16F19T (Figure 3D) probes. The temperature was lowered from 90 to 10 °C (blue lines) and then increased from 10 to 90 °C (red lines) at a heating/cooling rate of 1 °C/min. These changes provided a convenient means for monitoring the denaturation and hybridization processes of the probes.
Sigmoidal type curves were obtained at 295 nm for all probes in a 0.1 M KCl, 10 mM cacodylate buffer. The profiles were reversible (cooling and heating curves were almost superimposed) and reproducible (two cooling profiles were also superimposed). These melting profiles indicate that most typical problems (e.g., bubbles, evaporation, and sample degradation) were avoided, although some evaporation is visible above 80 °C. A small hysteresis, mainly for the melting profiles recorded at 295 nm, is associated with this process. In the absence of KCl, no melting transition could be seen at 295 nm (data not shown). Intramolecular G-quartet formation was fast, as proved by reversible denaturation profiles (temperature changes, 1 °C/min). The determined melting temperatures (Tm) for the fluorescent probes are presented in Table 2. The Tm represents the mid-point of a melting curve at which the K+/G4 DNA complex is 50% dissociated. This can be estimated either from the temperature at which the absorbance is midway between the initial and final values or, more accurately, from the maximum in the first derivative of the melting profile [39].
Figure 3. Denaturation profiles obtained for the (A) F19T, (B) ChF19T, (C) 16 F19T, (D) Ch16F19T, (E) 16F19T/Ch16’, and (F) Ch16F19T/Ch16’ systems at two different wavelengths: 295 nm (full circles) and 260 nm (open triangles). Left vertical axis: absorbance values at 260 nm; right vertical axis: absorbance values at 295 nm. Experimental conditions: 1 μM strand concentration (A–D), 2 uM total strand concentration (E,F), 50 mM cacodylate buffer (pH = 7.5), 0.1 M KCl. The discrepancy at high temperatures between the heating and cooling curves is the result of evaporation: the experiment started with a cooling cycle (i.e., starting at a high temperature and slowly cooling) (blue profiles) followed by a heating cycle (red profiles). Note that the scales for the 260 nm and 295 nm readings are notably different.
Chemosensors 02 00267 g003
Table 2. Melting temperatures (Tm) for quadruplex-forming oligonucleotide probes determined from dependences of absorbance at 260 nm or 295 nm and from fluorescence of FAM at 520 nm.
Abbreviation of ProbesTm, A at 260 nm (°C)Tm, A at 295 nm (°C)Tm, F at 520 nm (°C )
F19T38.038.038.0
16F19T22.0 a38.037.5
Ch16F19T30.5 a41.541.0
ChF19T- a48.047.0
ChF19T/Ch16’68.037.737.5
16F19T/Ch16’56.537.037.0
a not reliable.
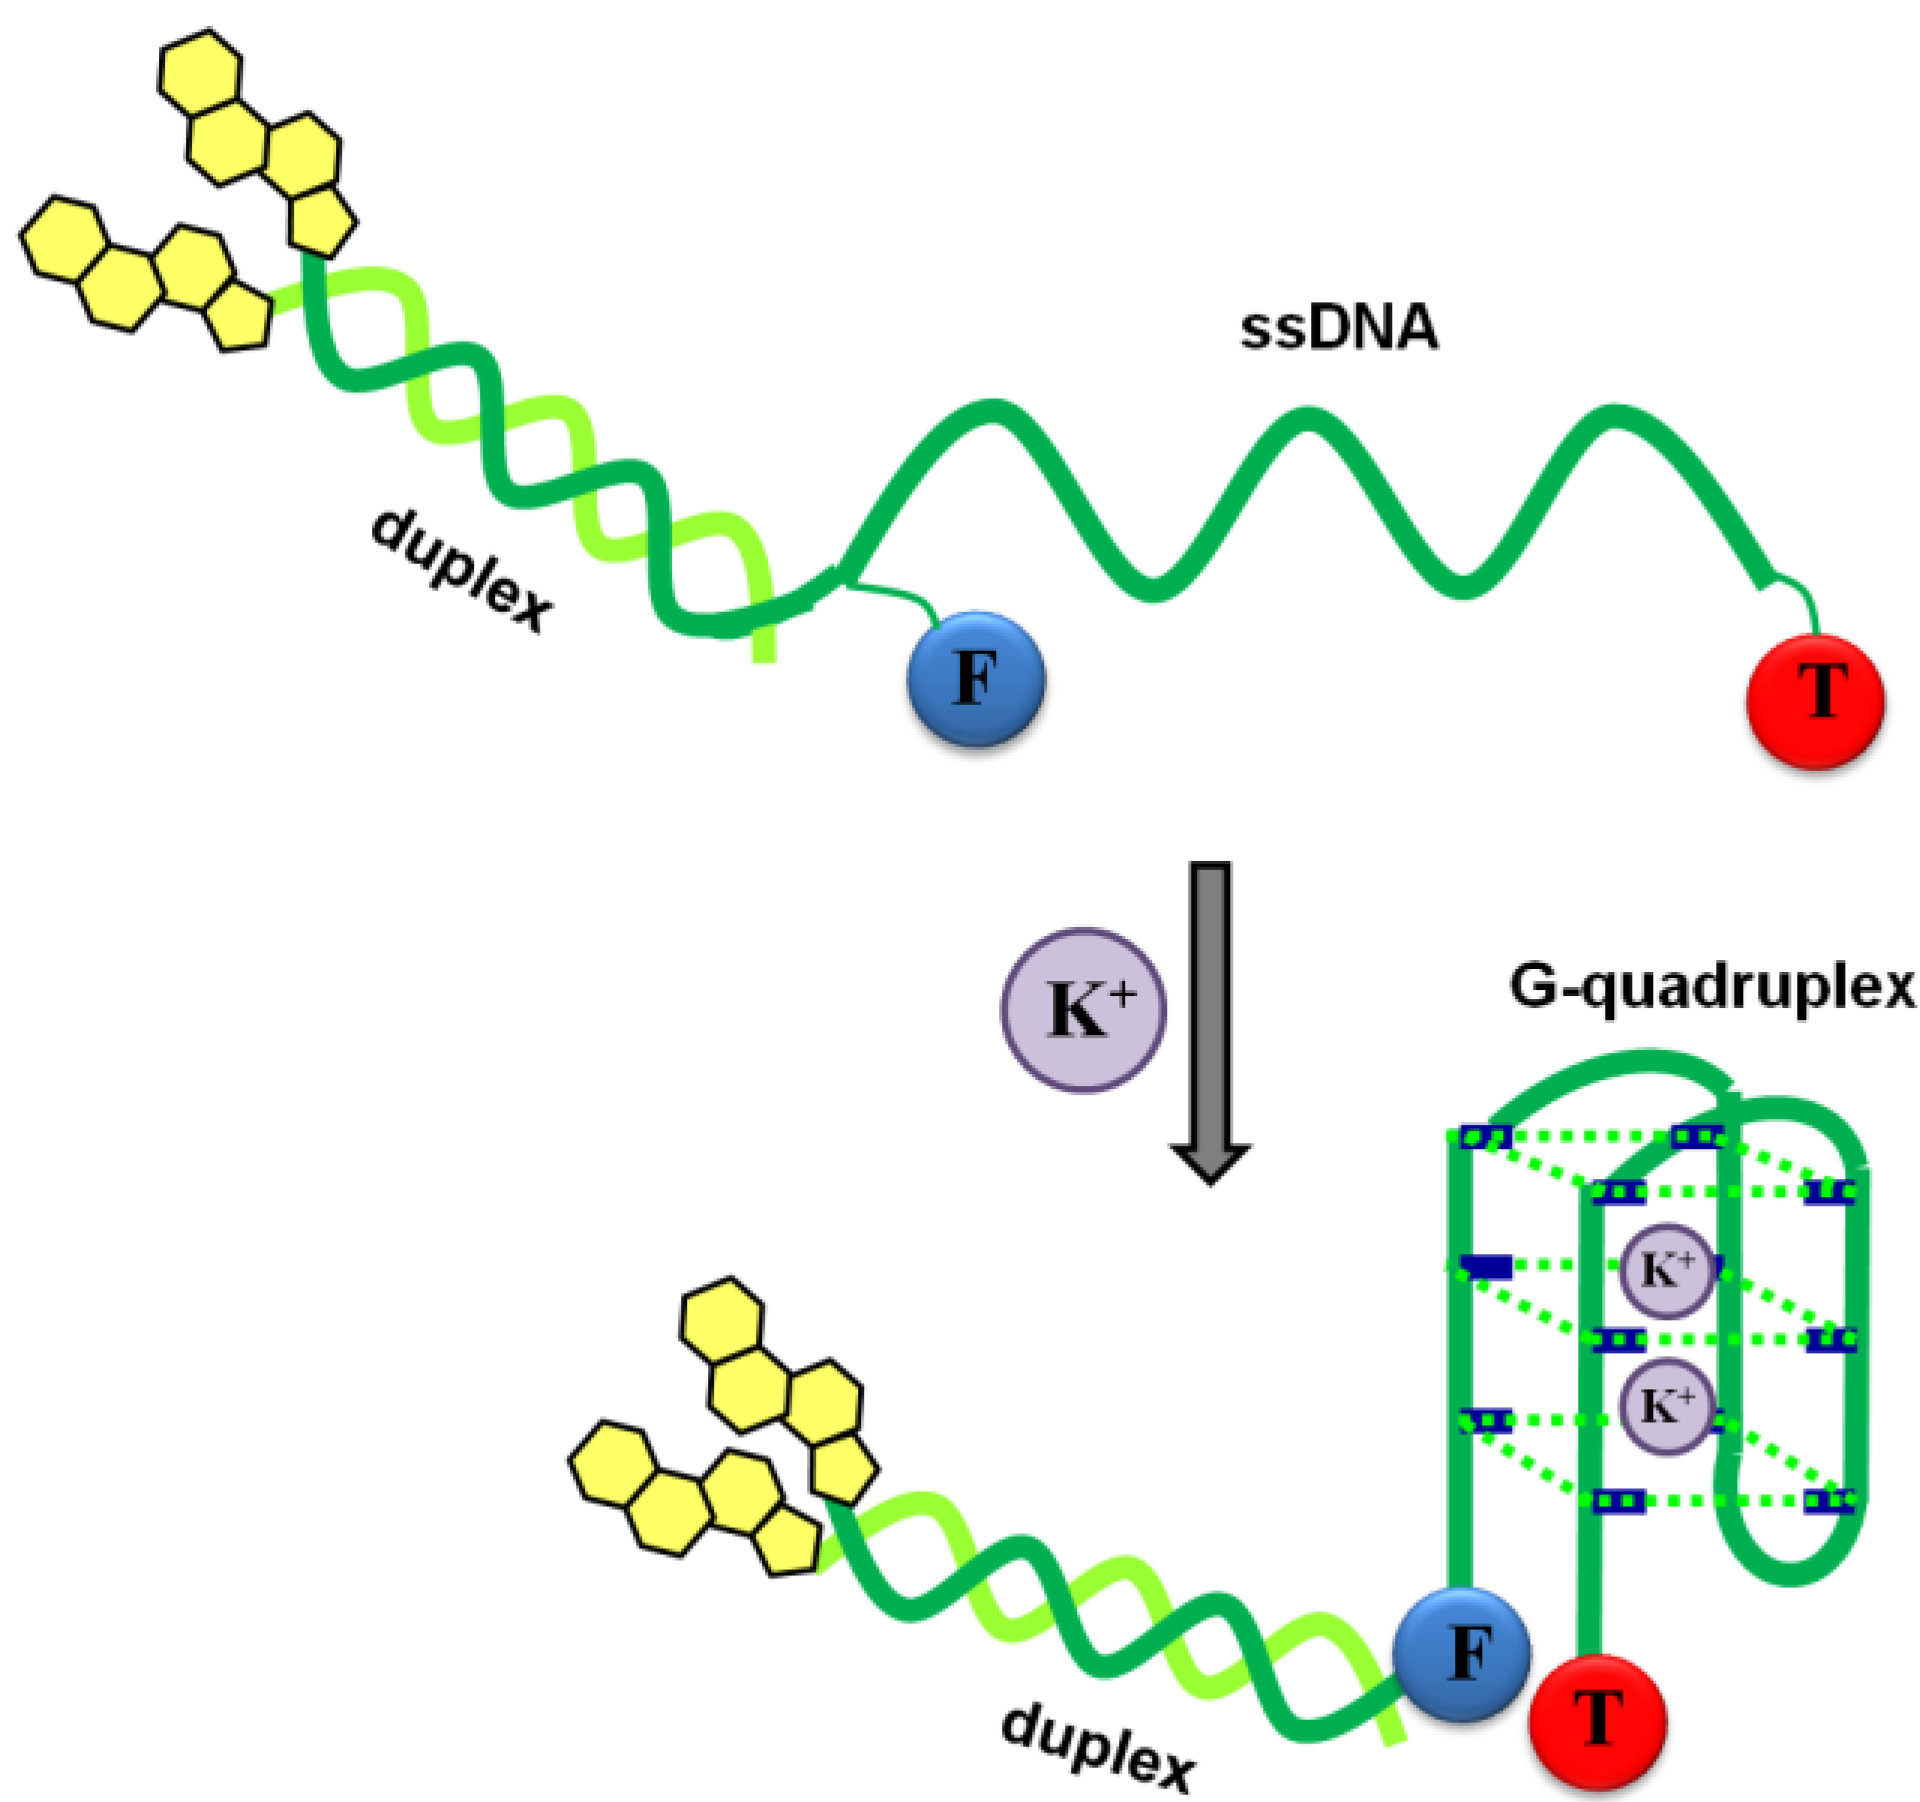
The melting curve recorded at 295 nm represents the formation/denaturation of an intramolecular G-quadruplex structure and the melting curve monitored at 260 nm may contain information on both the quadruplex transformation and the duplex formation by complementary sequences of the oligonucleotides. The decrease in absorbance for the 295-nm profile is a general phenomenon for G-quadruplex dissociation at higher temperatures. The most classical sigmoidal shape of melting profile, with flat regions at lower and higher temperatures, is observed for the F19T and ChF19T probes (Figure 3A and B, respectively). Other probes (16F19T and Ch16F19T) show distorted profiles, indicating interplay of additional processes (Figure 3C and D). It should be pointed out that all of these probes possess an additional spacer with 16 nucleotides that can be partially stacked. Therefore, the increase in temperature resulted in the reduction of such stacking interactions, causing an apparent hyperchromic effect (gradual increase in absorbance). This explanation is supported by the melting profiles for bimolecular systems shown in Figure 3E and F (16F19T/Ch16’ and Ch16F19T/Ch16’, respectively), for which the spacer is involved in duplex structure formation. It should be pointed out that attachment of the additional 16-meric spacer or even duplex formation did not seriously affect the thermal stability of the G-quadruplex (Tm ~ 37–38 °C). On the other hand, the presence of a cholesterol moiety, especially when attached directly to the quadruplex-forming sequence (ChF19T), significantly stabilized the G-quadruplex (Tm = 48 °C). Interestingly, the melting profiles recorded at 260 nm for the 16F19T/Ch16’ and Ch16F19T/Ch16’ systems (Figure 3E and F) showed very clear characteristics of duplex formation. The higher stability of the duplex region for the Ch16F19T/Ch16’ system (Tm = 68 °C) is reasonable if one considers the stabilizing effect of two cholesterol groups. Results of melting experiments provided evidence that hybridization of the fluorescent probe and the complementary strand with a cholesterol moiety is an alternative approach to designing a FRET probe with a hydrophobic anchor. To enhance the effect of anchoring, two cholesterol moieties can be present, which gives better binding efficiency for DNA coupled to lipid membranes [40,41]. The selected 16-meric sequence d(TAACGTACGCTCGATG) was long enough to allow the formation of a stable DNA duplex. In conclusion, temperature curves at 295 nm and 260 nm provide a good means for monitoring formation/dissociation processes for the system in which G-quadruplex and duplex regions occur. The schematic representation of the process of G-quadruplex formation for the Ch16F19T/Ch16’ system is shown in Scheme 2.
Scheme 2. The structure and mechanism of G-quadruplex formation for the Ch16F19T/Ch16’ probe.
Chemosensors 02 00267 g010

3.2.2. Fluorescence Melting Profiles

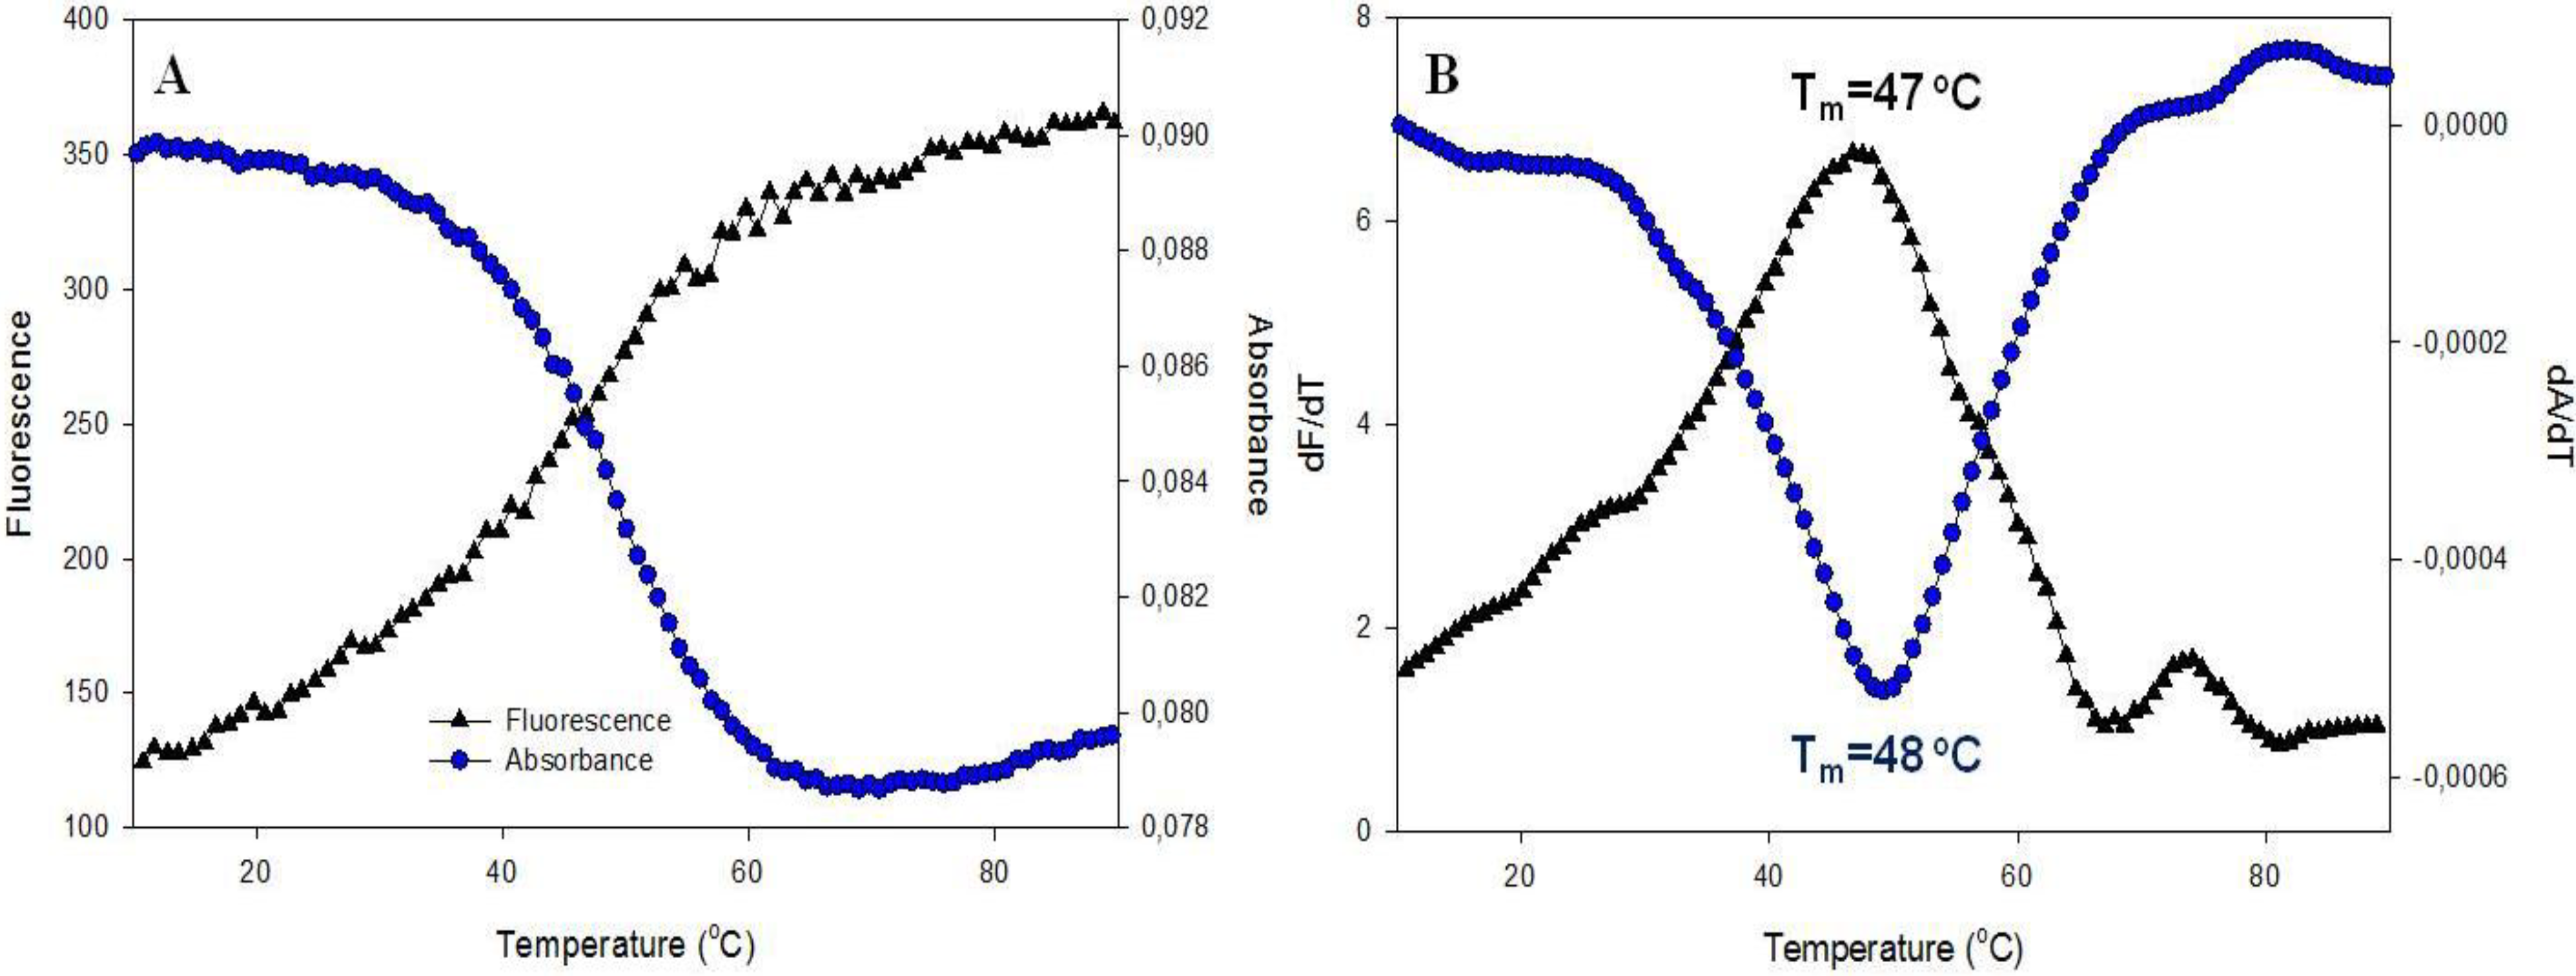
Labeling of G-quadruplex forming oligonucleotides with either fluorescent base analogs or with suitable acceptor-donor FRET pairs also allows for monitoring of the denaturation process by fluorescence spectroscopy. A fluorescent melting curve was obtained by monitoring the emission fluorescence changes at 520 nm from 10 to 90 °C, at a heating rate of 1 °C/min, using the excitation wavelength of 490 and 5 nm excitation/emission slits. Figure 4A and B show a comparison of the fluorescence melting profiles and UV melting data (at 295 nm) for the ChF19T probe. It can be seen that the two methods give very similar Tm values. Similar dependences were obtained for the other probes and the determined Tm values are collected in Table 2.
Figure 4. Comparison of melting curves (A) obtained for ChF19T by monitoring changes in absorbance at 295 nm (circles, blue line) and in fluorescence of FAM (triangles, black line), measured in 10 mM cacodylate buffer, pH 7.5 containing 100 mM KCl, 1 μM strand concentration. First derivatives of the melting data are shown in panel (B).
Chemosensors 02 00267 g004

3.2.3. Fluorescence Spectra

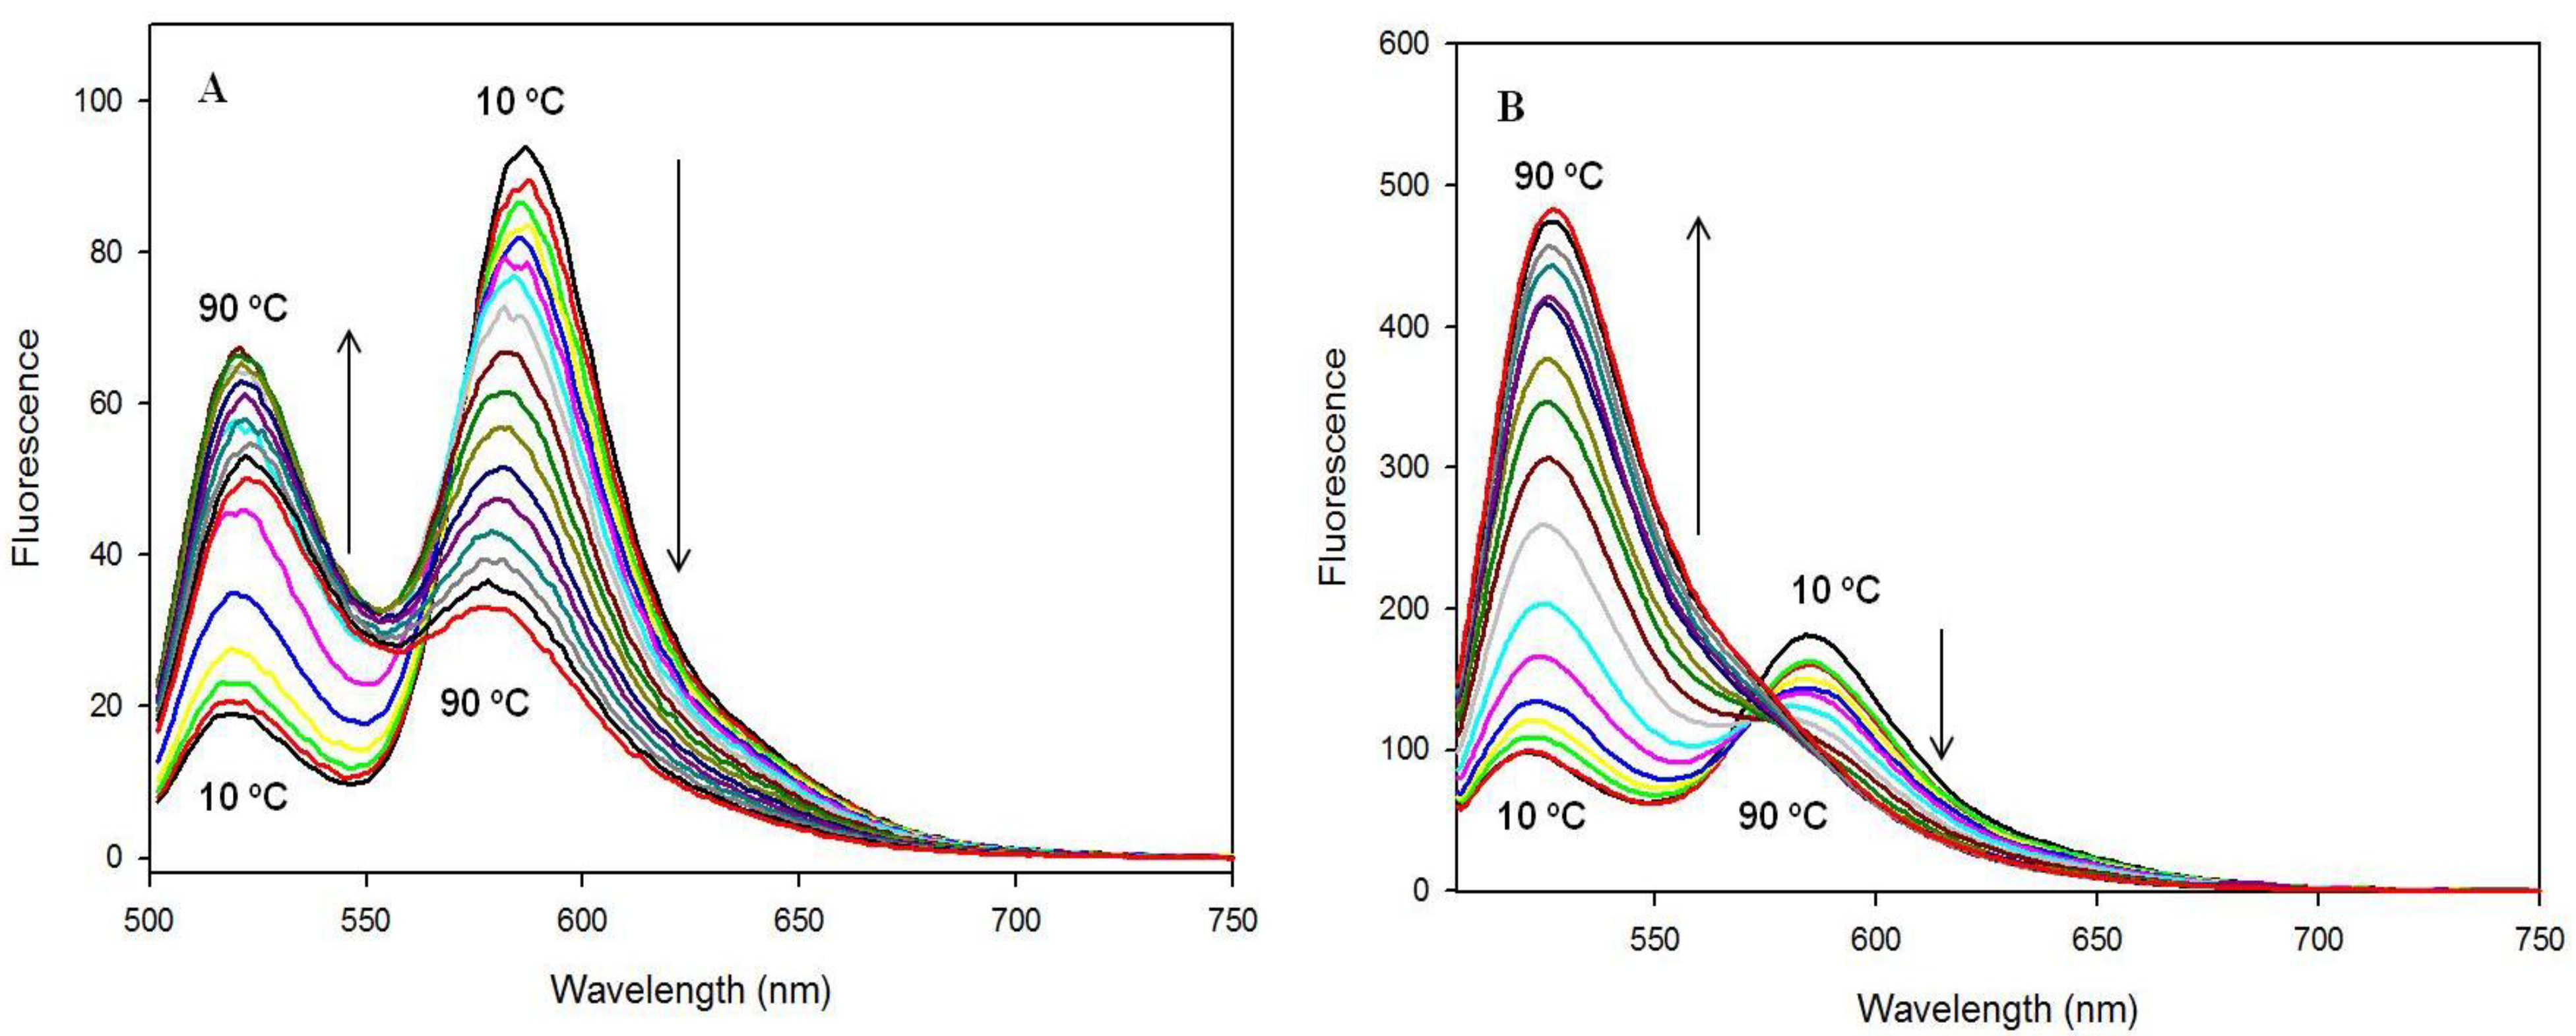
Figure 5A and B shows the fluorescence spectra of the F19T and ChF19T probes recorded at different temperatures (10→90 °C). The temperature effect was tested in a buffer containing 100 mM K+ ions with excitation at the wavelength of 490 nm (FAM absorption maximum). Two emission bands with intensities dependent on the temperature are observed, as expected. The band centered at ca. 520 nm corresponds to FAM emission and the other at ca. 580 nm is due to TAMRA fluorescence. In the case of the unsubstituted F19T probe (Figure 5A), FAM emission is slightly quenched at a low temperature range (10–40 °C) but gradually restored upon further heating (65–90 °C), which is consistent with the dissociation of the G-quadruplex structure at higher temperatures. For the probe with a cholesterol moiety, ChF19T (Figure 5B), FAM emission shows a similar dequenching effect, but the FAM emission increases much more. On the contrary, the TAMRA emission bands (583 nm) undergo significant quenching with increasing temperature; this effect is more pronounced for the F19T probe (Figure 5A). The observed temperature effect on the fluorescence bands of FAM and TAMRA strongly suggests that an energy transfer process (FRET) operates in these systems provided that temperature is kept below the Tm values of G-quadruplexes. An increase in temperature above melting point causes unfolding of the G-quadruplex structure, which results in dequenching of FAM emission and decreased sensitized fluorescence of TAMRA. Fluorescence spectra recorded between 10–90 °C fully supported the ability of all probes (data not shown) to form G-quadruplexes in the presence of K+ ions, resulting in energy transfer from the donor FAM to the acceptor TAMRA fluorophore.
Figure 5. Temperature dependence of the fluorescence spectra of F19T (A) and ChF19T (B) probes with λex = 490 nm. Conditions: 0.2 μM strand concentrations, 10 mM cacodylate buffer (pH 7.5), 100 mM KCl.
Chemosensors 02 00267 g005
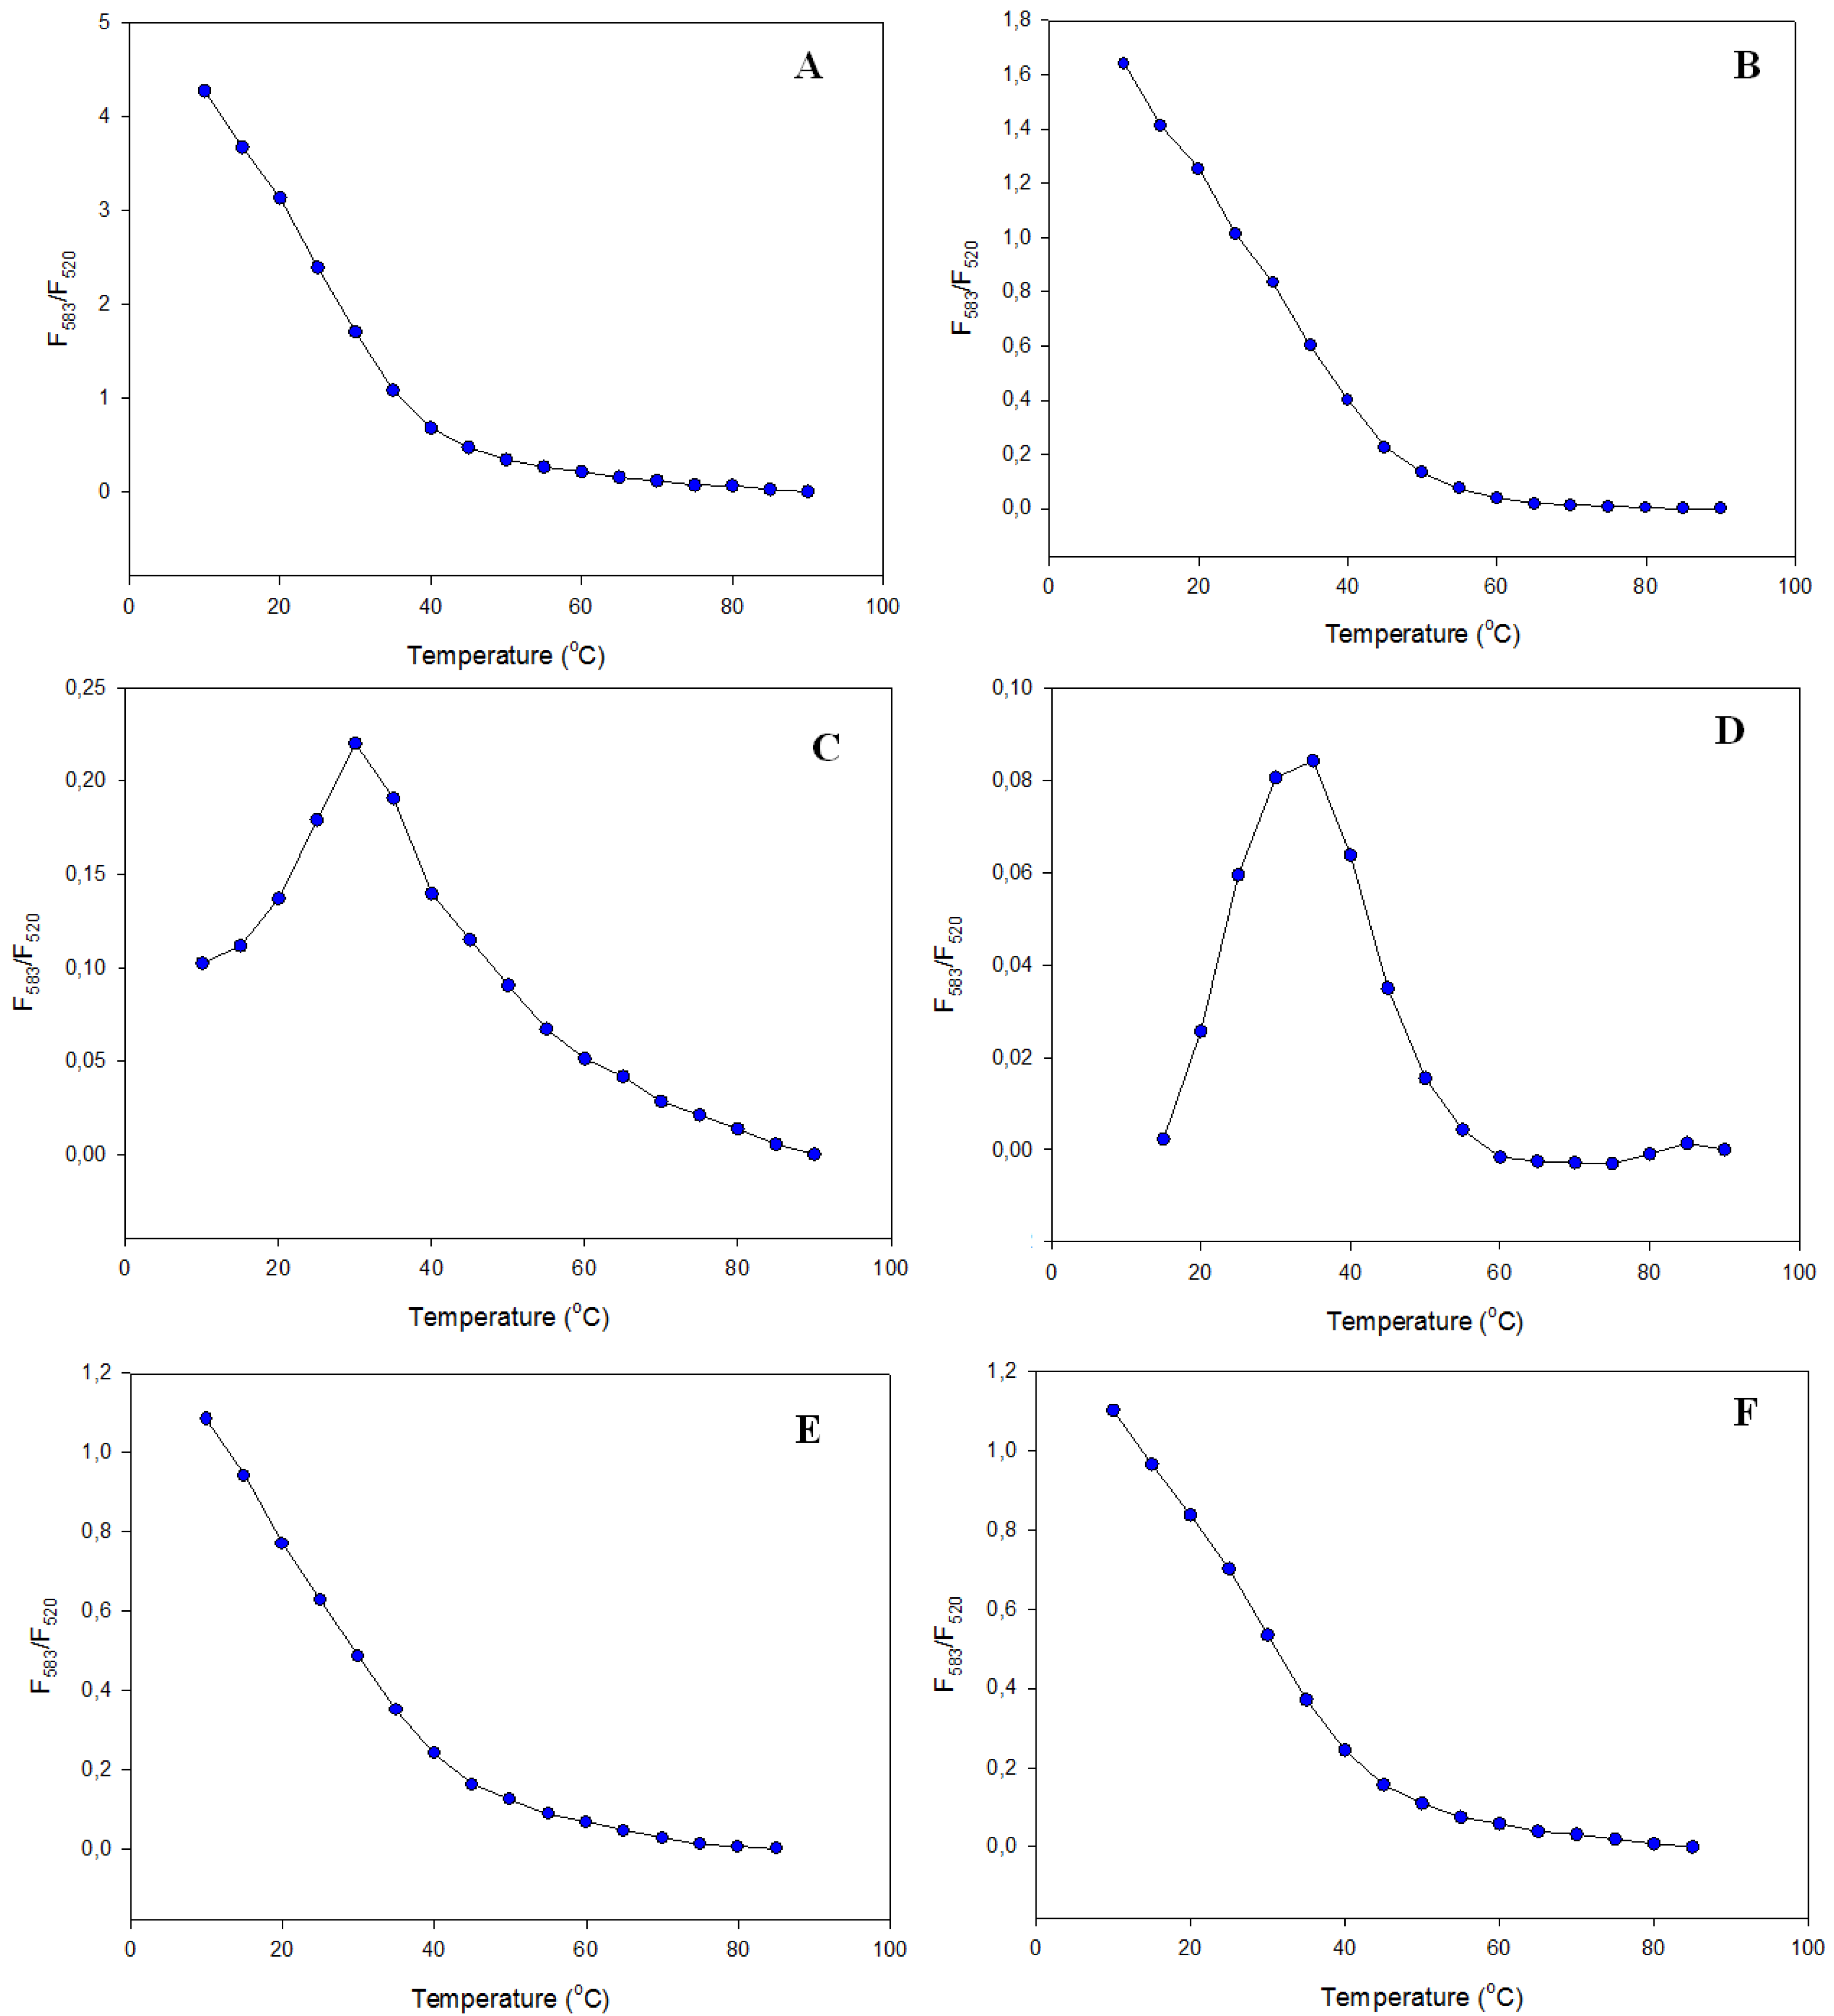
Figure 6 shows the effect of temperature on the efficiency of the FRET process, expressed as a (ratio), which was calculated from the emission spectra using the expression given in the experimental section:
(ratio) = F583/F520,
where F583 is the fluorescence of the acceptor (TAMRA) excited by FRET and F520 is the fluorescence of the donor (FAM), measured when the sample probe was excited at 490 nm.
Figure 6. The dependence of fluorescence intensity ratio (F583/F520) vs. temperature for (A) F19T, (B) ChF19T, (C) 16F19T, (D) Ch16F19T, (E) 16F19T/Ch16’, and (F) Ch16F19T/Ch16’ probes. Conditions: 0.2 μM strand concentrations, 10 mM cacodylate buffer (pH 7.5), 100 mM KCl, λex = 490 nm.
Chemosensors 02 00267 g006
The ratio plots in Figure 6 for (A) F19T and (B) ChF19T probes or for hybridized (E) 16F19T/Ch16’ and (F) Ch16F19T/Ch16’ systems exhibit a gradual decrease in FRET efficiency with increasing temperature. A characteristic change in the slope can be observed for each curve at temperatures close to the melting point of the quadruplex for that particular system. This is further evidence that the FRET process is related to the formation of the G-quadruplex structure by the probes. Two other probes, (C) 16F19T and (D) Ch16F19T, show more complex dependencies, which probably reflect the interplay of additional processes (cf. melting profiles in Figure 3).
Absorption spectra of FAM and TAMRA (at 494 and 560 nm, respectively) for all probes were also affected by the folding of the oligonucleotide in temperatures from 10 to 90 °C (data not shown). The FAM absorption band exhibited higher hypochromicity (ca. 40%) at room temperature than the TAMRA band (ca. 15%). In contrast, monotonous variations of FAM and TAMRA emission were observed in the same range of temperature, and no increase in the emission of FAM while quenching the emission of TAMRA was demonstrated, in agreement with an unfolded structure at all temperatures (data not shown).

3.3. Potassium and Sodium Cation Selectivity of the FRET Probes
Although the G4 DNA structure appears to be stabilized by a hydrogen-bonding network involving N7:N2H and O6:N1H, this is unlikely to be the source of the thermodynamic stability of such structures in the solution. The central core of the G-quartet produces a specific geometric arrangement of lone pairs of electrons from the four GO6, which can coordinate a monovalent ion of the proper size, such as Na+ or K+. The smaller Na+ ion can sit in the plane formed by these atoms, whereas the larger K+ requires a nonplanar location and in fact lies between two such G-quartets [42]. The thrombin-binding aptamer used in this study is known to form a chair-type intramolecular tetraplex structure irrespective of the nature of the metal cation complexed [43,44]. Although properties of FRET probes based on the G4 approach are well recognized [11,12,34], the cholesterol moiety introduced in our probes requires careful checking of its spectral behavior in the presence of metal ions (K+ and Na+).
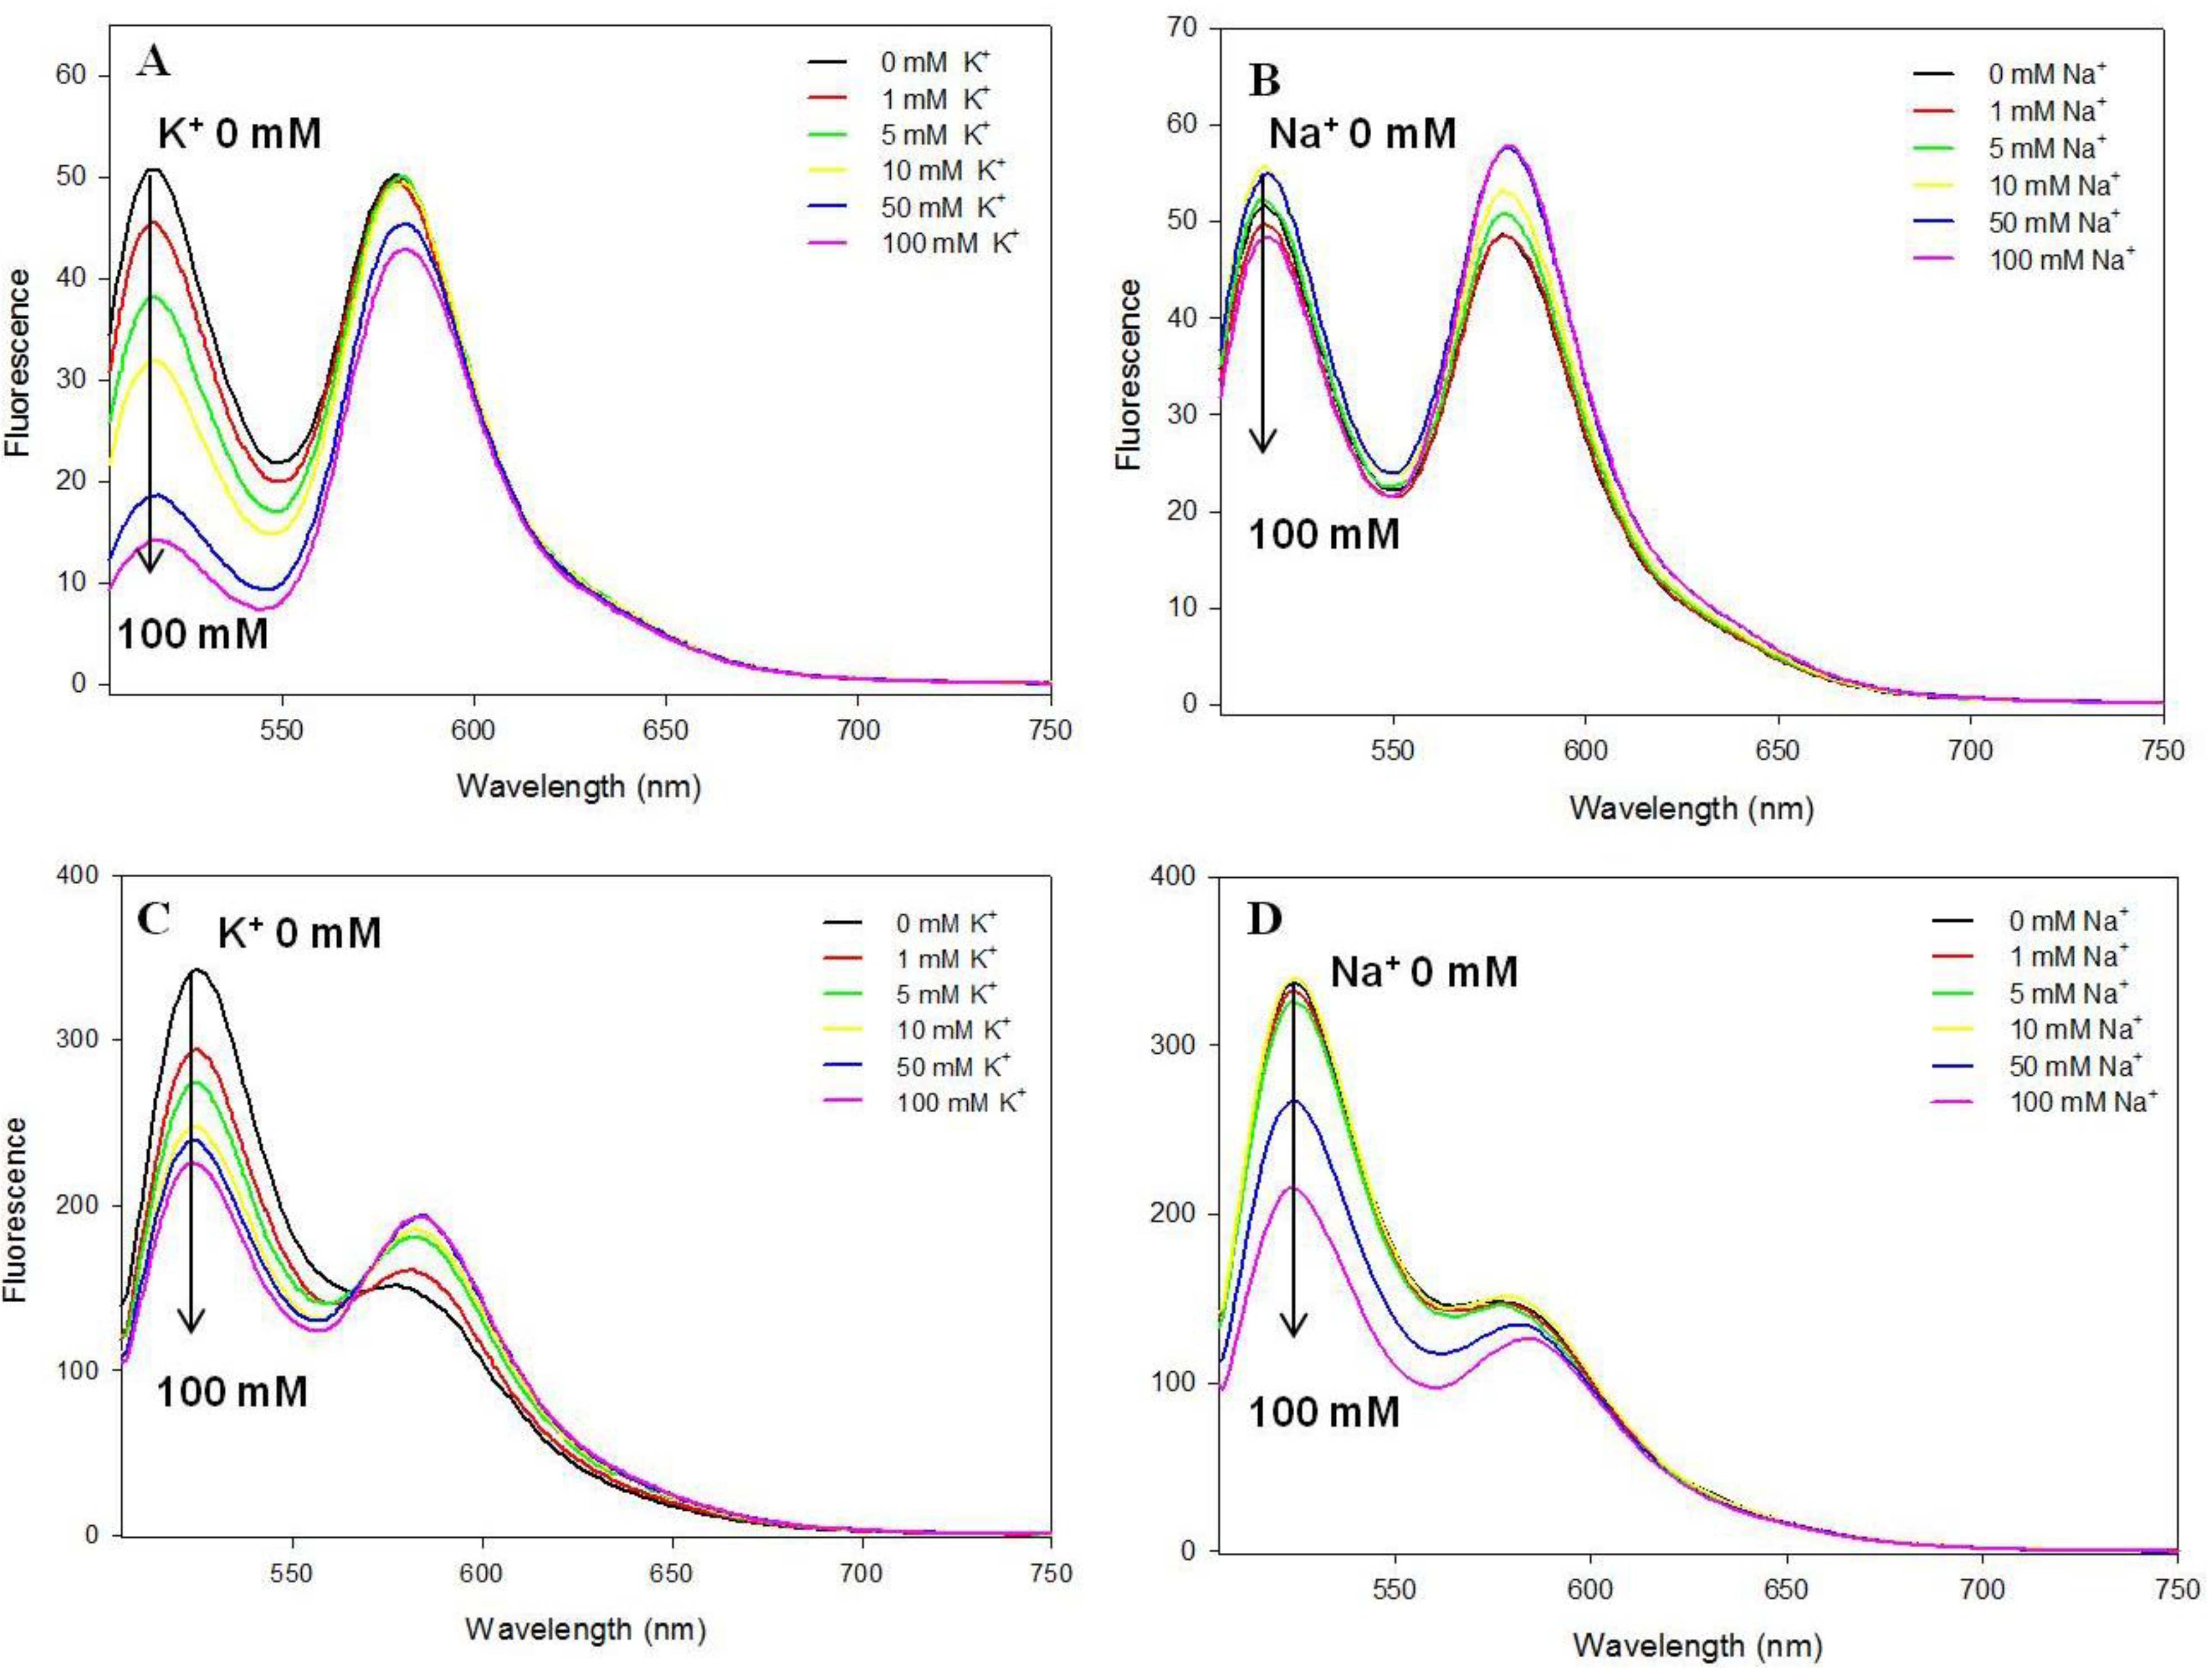
In the unfolded form of the oligonucleotide probes, little transfer is expected, as the average distance between the two chromophores should be larger than the Förster distance (calculated to be around 5.0 nm). Intramolecular folding of the G4 structure should bring the two chromophores into close enough proximity for energy transfer to be efficient. The fluorescence spectra of F19T and ChF19T (λex = 494 nm) in the presence of K+ (0–100 mM) are shown in Figure 7A and C, respectively; and those in the presence of Na+ ion are shown in Figure 7B and D, respectively. The first fluorescence band observed at λem = 520 nm is characteristic of the FAM emission and the second band at λem = 583 nm is typical for the TAMRA fluorophore.
In all cases an increase in K+ ion concentration caused considerable quenching of the FAM emission band at λem = 520 nm whereas the intensity of the TAMRA band λem = 583 nm slightly increased (ChF19T) or decreased (other probes). It should be noted that the FAM and TAMRA fluorescence bands for the F19T probe possess comparable intensity even in the absence of metal ions, but this is caused partially by the much lower intensity of the FAM band (already quenched). Contrary to potassium, sodium ions exerted much a smaller effect on the fluorescence spectra of the probes. Folding of the G-quartet oligonucleotides in the presence of sodium ions only led to some quenching of FAM emission, without a concomitant increase in rhodamine emission at longer wavelengths for all probes. It should be pointed out that all probes exhibited a substantial decrease in TAMRA fluorescence excited directly at 560 nm with an increase in cation concentration (data not shown). Observed spectral changes clearly indicate the G-quadruplex formation and show that a FRET process between FAM and TAMRA fluorophores takes place for potassium ions but is less pronounced for sodium cations. To verify which probe is more suitable for potassium sensing applications (better K+/Na+ selectivity), the fluorescence intensity ratio values (FRET signal) were calculated for all probes.
Figure 7. Potassium and sodium ions’ effect on the fluorescence spectra of 0.2 μM F19T (A,B, respectively) and ChF19T (C,D, respectively) with λex = 490 nm. Conditions: 10 mM Tris-EDTA buffer (pH 7.5), KCl and NaCl concentration: 0, 1, 5, 10, 50, 100 mM.
Chemosensors 02 00267 g007
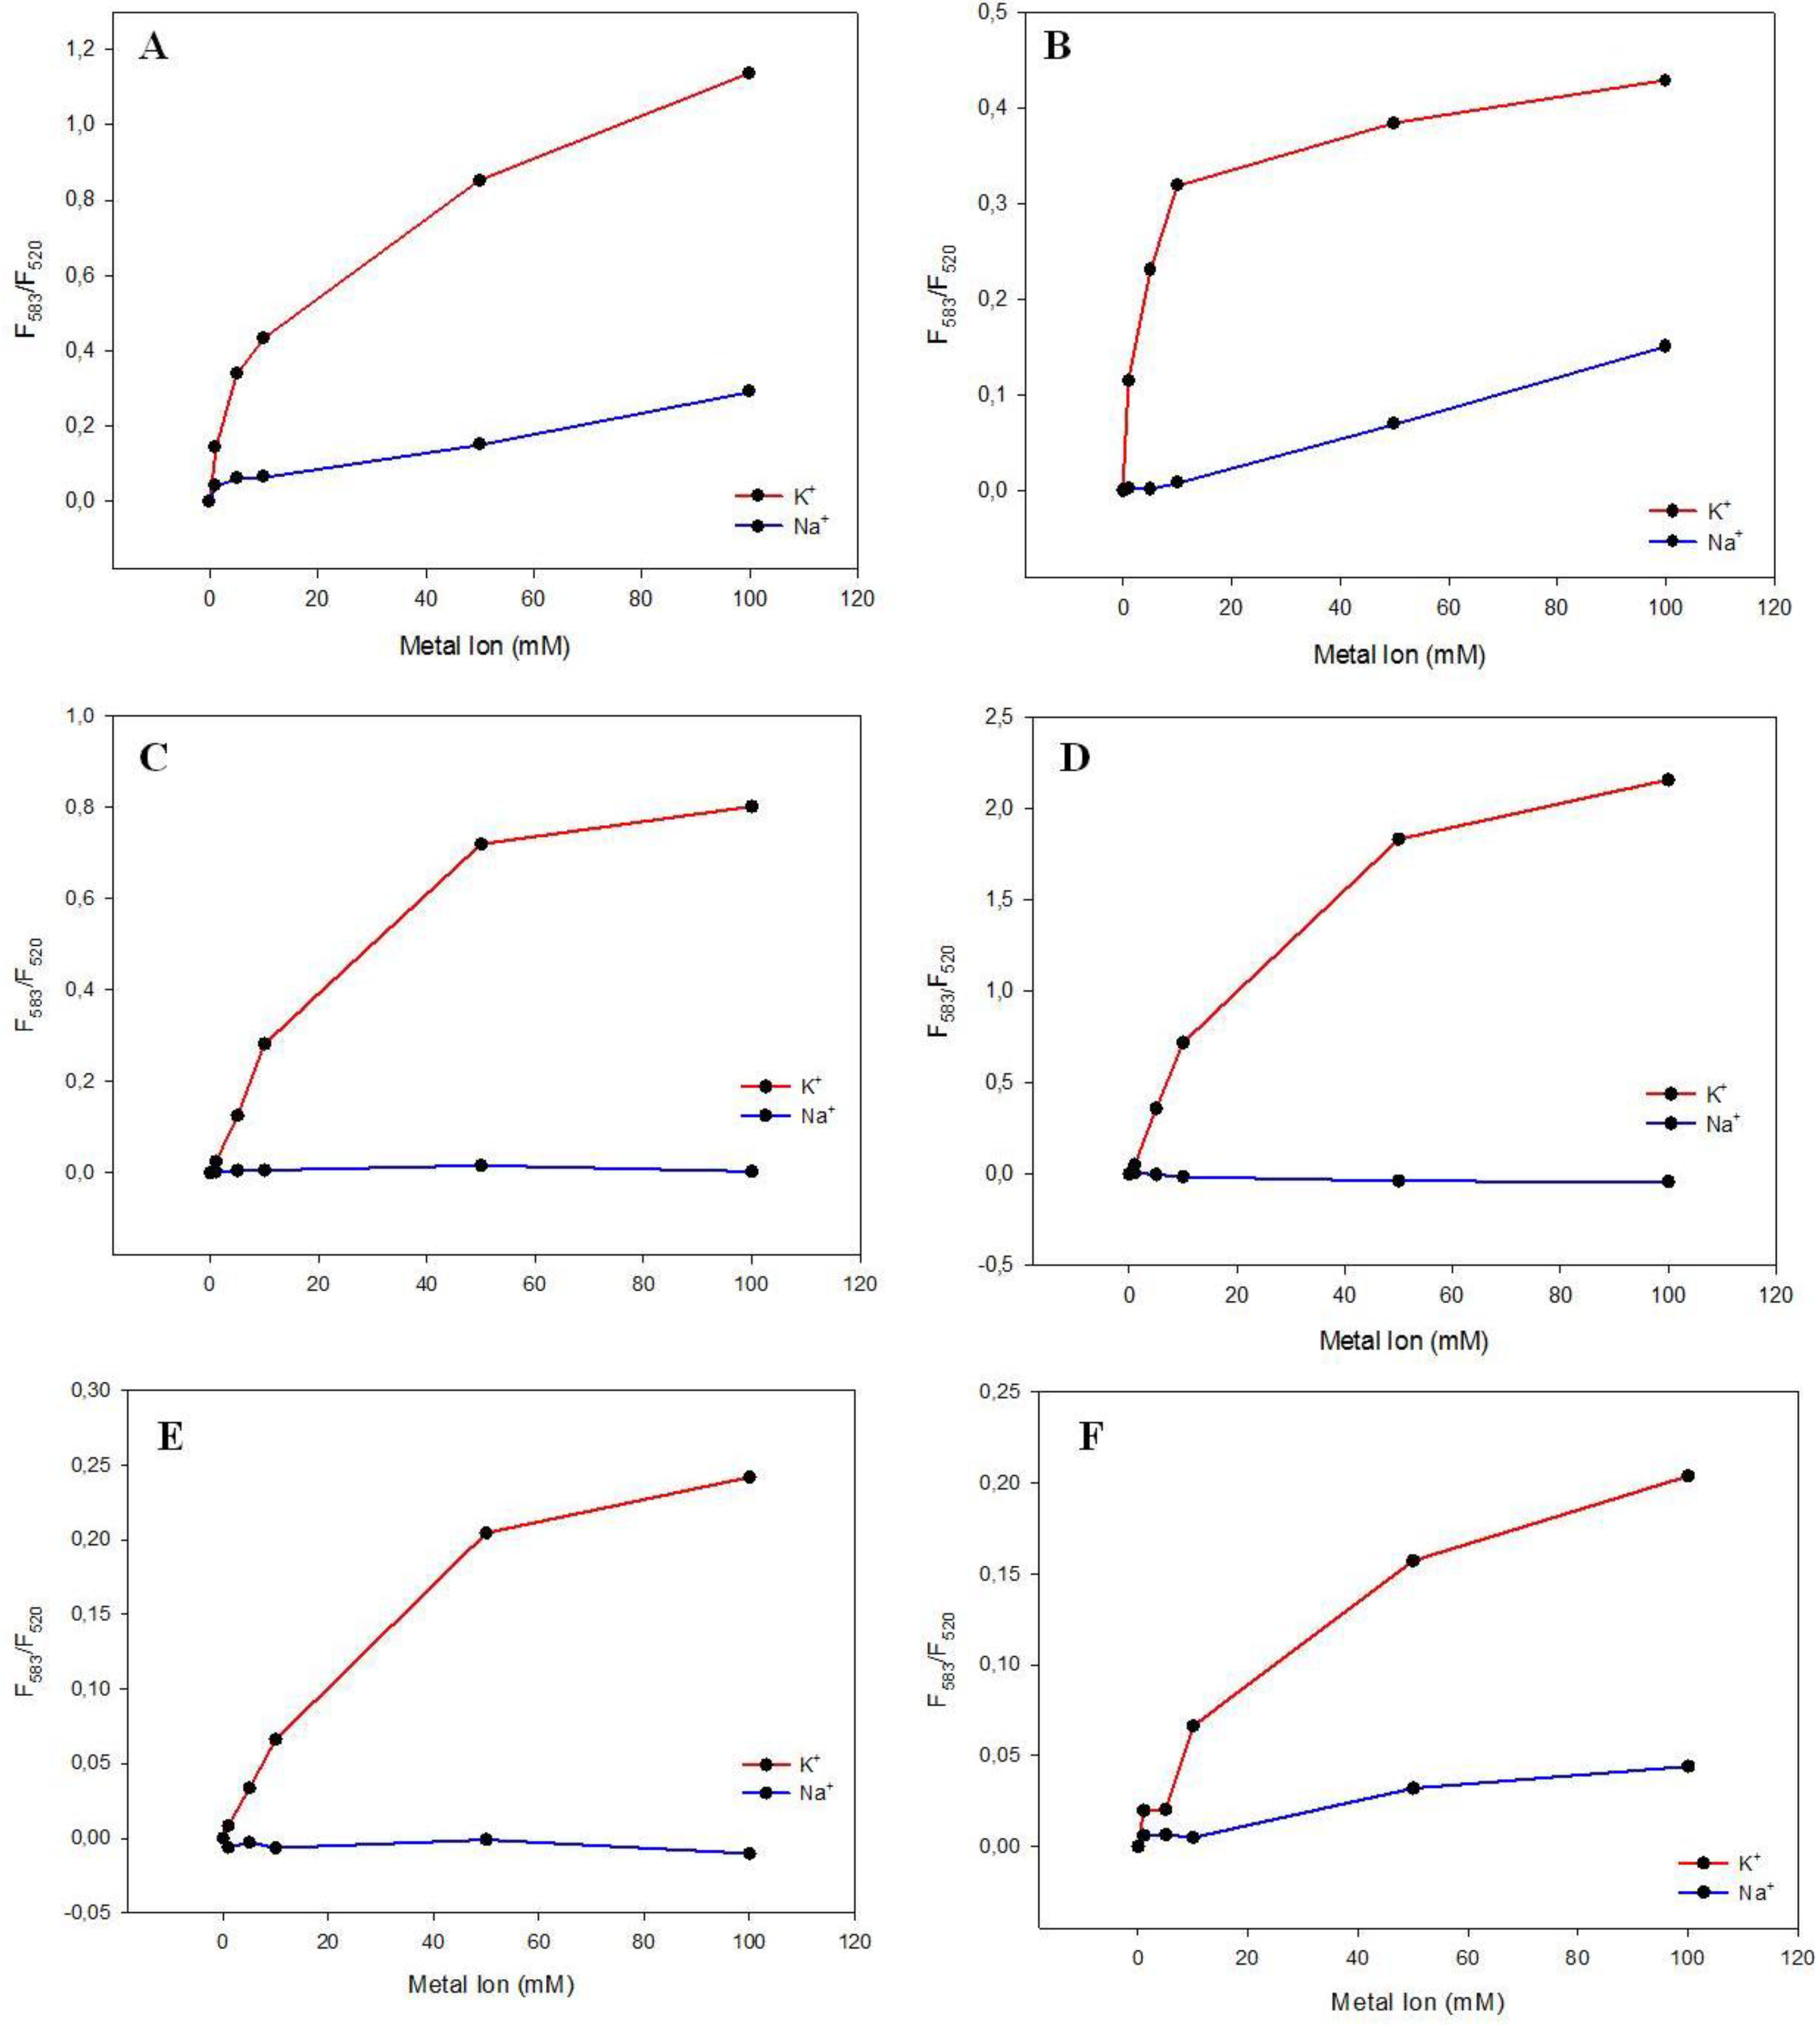
Figure 8 shows the variation of the FRET efficiency (ratio of F583/F520) for all fluorescence probes plotted against the concentration of K+ and Na+. An appreciable and almost linear increase in the FRET signal is observed for all probes with K+ ions in the range of 0–10 mM. Probes also respond with a small FRET signal to sodium ions at the higher concentration range of 10–100 mM, which is consistent with the binding affinities of these cations. Other reports have proved that the TBA sequence showed a high binding preference for K+ over Na+ [36].
In conclusion, all probes respond selectively to K+ ions with a FRET signal that is dependent on the metal ion concentration suitable for cellular applications.
Figure 8. Effect of K+ and Na+ ions on FRET efficiency, expressed as F583/F520 ratio, for (A) F19T, (B) ChF19T, (C) 16F19T, and (D) Ch16F19T probes; and (E) 16F19T/Ch16’ and (F) Ch16F19T/Ch16’ systems.
Chemosensors 02 00267 g008

4. Conclusions

The spectral properties and G-quadruplex folding ability of four FRET probes with a cholesterol anchoring group (ChF19T and Ch16F19T) or without cholesterol (F19T and 16F19T) were characterized in solution and tested as FRET probes for monitoring K+ ions.
Measurements of the melting points at 295 nm showed that the process of G4 DNA formation is reversible, and the melting curves monitored at 260 nm may provide information on both the quadruplex transformation and the duplex formation (depending on the probe structure). Labeling of G-quadruplex forming oligonucleotides with an acceptor-donor FRET pair (TAMRA-FAM) also allowed for monitoring of the denaturation process by fluorescence spectroscopy. Attachment of an additional 16-meric spacer, in the case of Ch16F19T and 16F19T probes, or even duplex formation in this spacer region did not markedly affect the thermal stability of the G-quadruplex structures. Fluorescence spectra recorded in the 10–90 °C temperature range fully supported the ability of all probes to form G-quadruplexes in the presence of K+ ions, resulting in energy transfer from the donor FAM to the acceptor TAMRA fluorophore. In contrast, monotonous variations in FAM and TAMRA emission were observed in the absence of K+ ions.
Folding of the fluorescent oligonucleotide probes in the presence of potassium (to a smaller extent for sodium ions) led to quenching of FAM emission with slight changes in TAMRA emission. Enhanced acceptor emission was only demonstrated in the presence of potassium ions for the ChF19T probe. One can conclude that G-quadruplex based probes exhibited higher potassium ion binding affinity and advantageous K+/Na+ selectivity.
Our studies have shown that labeling with fluorescent reporter groups (FAM and TAMRA) and a cholesterol moiety still allows oligonucleotides to fold into a quadruplex structure and interact with metal cations. Future studies will be focused on the examination of probe performance in membrane-mimicking conditions, e.g., lipid monolayers or Langmuir–Blodgett films.

Supporting Information

Results of HPLC analysis of FRET probes are available at https://www.mdpi.com/2227-9040/2/4/267/s1.

Acknowledgments

This work was supported by the National Science Centre (NCN) of Poland (Grant NCN No. 2011/01/B/ST4/01188).

Author Contributions

Both authors contributed to this work. Angelika Swiatkowska performed the experiments and wrote the main paper. Bernard Juskowiak supervised the project and edited the manuscript. Both authors contributed to the data analysis.

Conflicts of Interest

The authors declare no conflict of interest.

References

  1. Bang, I. Untersuchungen über die Guanylsäure. Biochem. Z 1910, 26, 293–311. [Google Scholar]
  2. Gellert, M.; Lipsett, M.N.; Davies, D.R. Helix formation by guanylic acid. Proc. Natl. Acad. Sci. USA 1962, 48, 2013–2018. [Google Scholar] [CrossRef] [PubMed]
  3. Bochman, M.L.; Paeschke, K.; Zakian, V.A. DNA secondary structures: Stability and function of G-quadruplex structures. Nat. Rev. Genet. 2012, 13, 770–780. [Google Scholar] [CrossRef] [PubMed]
  4. Du, Y.; Zhou, X. Targeting non-B-form DNA in living cells. Chem. Record 2013, 13, 371–384. [Google Scholar] [CrossRef]
  5. Williamson, J.R. G-tetrad structures in telomeric DNA. Ann. Rev. Biophys. Biomol. Struct. 1994, 23, 703–730. [Google Scholar] [CrossRef]
  6. Kelly, J.A.; Feigon, J.; Yeates, T.O. Reconciliation of the X-ray and NMR structures of the thrombin-binding aptamer d(GGTTGGTGTGGTTGG). J. Mol. Biol. 1996, 256, 417–422. [Google Scholar] [CrossRef] [PubMed]
  7. Huppert, J.L.; Balasubramanian, S. G-quadruplexes in promoters throughout the human genome. Nucleic Acids Res. 2007, 35, 406–413. [Google Scholar] [CrossRef] [PubMed]
  8. Wu, Y.; Brosh, R.M. G-quadruplex nucleic acids and human disease. FEBS J. 2010, 277, 3470–3488. [Google Scholar] [CrossRef] [PubMed]
  9. Chantot, J.; Guschlbauer, W. Physicochemical properties of nucleosides 3. Gel formation by 8-bromoguanosine. FEBS Lett. 1969, 4, 173–176. [Google Scholar] [CrossRef] [PubMed]
  10. Guschlbauer, W.; Chantotand, J.F.; Thiele, D. Four-stranded nucleic acid structures 25 years later: From guanosine gels to telomer DNA. J. Biomol. Struct. Dyn. 1990, 8, 491–511. [Google Scholar] [CrossRef] [PubMed]
  11. Ueyama, H.; Takagi, M.; Takenaka, S. A novel potassium sensing in aqueous media with a synthetic oligonucleotide derivative. Fluorescence resonance energy transfer associated with Guanine quartet-potassium ion complex formation. S. J. Am. Chem. Soc. 2002, 124, 14286–14287. [Google Scholar] [CrossRef]
  12. Takenaka, S.; Ueyama, H.; Nojima, T.; Takagi, M. Comparison of potassium ion preference of potassium-sensing oligonucleotides, PSO-1 and PSO-2, carrying the human and Oxytricha telomeric sequence, respectively. Anal. Bioanal. Chem. 2003, 375, 1006–1010. [Google Scholar] [PubMed]
  13. Kumar, N.; Maiti, S. Quadruplex to Watson-Crick duplex transition of the thrombin binding aptamer: A fluorescence resonance energy transfer study. Biochem. Biophys. Res. Commun. 2004, 319, 759–767. [Google Scholar] [CrossRef]
  14. Hardin, C.C.; Perry, A.G.; White, K. Thermodynamic and kinetic characterization of the dissociation and assembly of quadruplex nucleic acids. Biopolymers 2000, 56, 147–194. [Google Scholar] [CrossRef] [PubMed]
  15. Bugaut, A.; Balasubramanian, S. A sequence-independent study of the influence of short loop lengths on the stability and topology of intramolecular DNA G-quadruplexes. Biochemistry 2008, 47, 689–697. [Google Scholar] [CrossRef] [PubMed]
  16. Guedin, A.; Gros, J.; Alberti, P.; Mergny, J.L. How long is too long? Effects of loop size on G-quadruplex stability. Nucleic Acids Res. 2010, 38, 7858–7868. [Google Scholar] [CrossRef] [PubMed]
  17. Sen, D.; Gilbert, W. Formation of parallel four-stranded complexes by guanine-rich motifs in DNA and its implication for meiosis. Nature 1988, 334, 364–366. [Google Scholar] [CrossRef] [PubMed]
  18. Blackburn, E. Structure and function of telomeres. Nature 1991, 350, 569–573. [Google Scholar] [CrossRef] [PubMed]
  19. Sen, D.; Gilbert, W. A sodium-potassium switch in the formation of four-stranded G4-DNA. Nature 1990, 344, 410–414. [Google Scholar] [CrossRef] [PubMed]
  20. Kofuji, P.; Newman, E.A. Potassium buffering in the central nervous system. Neuroscience 2004, 129, 1045–1056. [Google Scholar] [CrossRef] [PubMed]
  21. Yu, S.P.; Canzoniero, L.M.T.; Choi, D.W. Ion homeostasis and apoptosis. Curr. Opin. Cell Biol. 2001, 13, 405–411. [Google Scholar] [CrossRef] [PubMed]
  22. Ng, F.; Mammene, O.K.; Wilting, I.; Sachsh, G.S.; Ferrier, I.N.; Cassidy, F.; Beaulieul, S.; Yathamn, L.N.; Berk, M. The International Society for Bipolar Disorders (ISBD) consensus guidelines for the safety monitoring of bipolar disorder treatments. Bipolar Disord. 2009, 11, 559–595. [Google Scholar] [CrossRef] [PubMed]
  23. Dimeski, G.; Badrick, T.; John, A.S. Ion Selective Electrodes (ISEs) and interferences-a review. Clin. Chim. Acta 2010, 411, 309–317. [Google Scholar] [CrossRef] [PubMed]
  24. He, F.; Tang, Y.; Wang, S.; Li, Y.; Zhu, D. Fluorescent amplifying recognition for DNA G-quadruplex folding with a cationic conjugated polymer: A platform for homogeneous potassium detection. J. Am. Chem. Soc. 2005, 127, 12343–12346. [Google Scholar] [CrossRef] [PubMed]
  25. Nagatoishi, S.; Nojima, T.; Galezowska, E.; Gluszynska, A.; Juskowiak, B.; Takenaka, S. Fluorescence energy transfer probes based on the guanine quadruplex formation for the fluorometric detection of potassium ion. Anal. Chim. Acta 2007, 581, 125–131. [Google Scholar] [CrossRef] [PubMed]
  26. Nagatoishi, S.; Nojima, T.; Juskowiak, B.; Takenaka, S. Pyrene-Labeled G-Quadruplex oligonucleotide as a fluorescent probe for potassium ion detection in biological applications. Angew. Chem. Int. 2005, 44, 5067–5070. [Google Scholar] [CrossRef]
  27. Patolsky, F.; Katz, E.; Bardea, A.; Willner, I. Enzyme-Linked amplified electrochemical sensing of oligonucleotide-dna interactions by means of impedance spectroscopy. Langmuir 1999, 15, 3703–3706. [Google Scholar] [CrossRef]
  28. Pfeiffer, I.; Höök, F. Bivalent cholesterol-based coupling of oligonucletides to lipid membrane assemblies. J. Am. Chem. Soc. 2004, 126, 10224–10225. [Google Scholar] [CrossRef] [PubMed]
  29. Pfeiffer, I.; Höök, F. Quantification of oligonucleotide modifications of small unilamellar lipid vesicles. Anal. Chem. 2006, 78, 7493–7498. [Google Scholar] [CrossRef] [PubMed]
  30. Jaumot, J.; Gargallo, R. Experimental methods for studying the interactions between Gquadruplex structures and ligands. Curr. Pharm. Des. 2012, 18, 1900–1916. [Google Scholar] [CrossRef] [PubMed]
  31. Simonsson, T.; Sjoback, R. DNA tetraplex formation studied with fluorescence resonance energy transfer. J. Biol. Chem. 1999, 274, 17379–17383. [Google Scholar] [CrossRef] [PubMed]
  32. Juskowiak, B. Analytical potential of the quadruplex DNA-based FRET probes. Anal. Chim. Acta 2006, 568, 171–180. [Google Scholar] [CrossRef] [PubMed]
  33. Müller, S.M.; Galliardt, H.; Schneider, J.; Barisas, B.G.; Seidel, T. Quantification of Förster resonance energy transfer by monitoring sensitized emission in living plant cells. Front. Plant. Sci. 2013, 4, 413–433. [Google Scholar] [PubMed]
  34. Juskowiak, B.; Galezowska, E.; Zawadzka, A.; Takenaka, S. Fluorescence anisotropy and FRET studies of G-quadruplex formation in presence of different cations. Spectrochim. Acta A 2006, 64, 835–843. [Google Scholar] [CrossRef]
  35. Juskowiak, B.; Takenaka, S. FRET in the studies of guanine-quadruplexes. In Fluorescent Energy Transfer Nucleic Acid Probes: Methods and Protocols; Didenko, V.V., Ed.; Humana Press: Totowa, NJ, USA, 2006; pp. 311–342. [Google Scholar]
  36. Takenaka, S.; Juskowiak, B. Fluorescence detection of potassium ion using G-quadruplex structure. Anal. Sci. 2011, 27, 1167–1172. [Google Scholar] [CrossRef] [PubMed]
  37. Venner, H. Molekülverbindungen einiger Sterine und Sterinester mit Nitroaromaten. Chem. Ber. 1956, 89, 1634–1641. [Google Scholar] [CrossRef]
  38. Scaria, P.V.; Shire, S.J.; Shafer, R.H. Quadruplex structure of d(G3T4G3) stabilized by K+ or Na+ is an asymmetric hairpin dimer. Proc. Natl. Acad. Sci. USA 1992, 89, 10336–10340. [Google Scholar] [CrossRef] [PubMed]
  39. Mergny, J.L.; de Cian, A.; Ghelab, A.; Sacca, B.; Lacroix, L. Kinetics of tetramolecular quadruplexes. Nucleic Acids Res. 2005, 33, 81–94. [Google Scholar] [CrossRef] [PubMed]
  40. Li, W.; Miyoshi, D.; Nakano, S.; Sugimoto, N. Structural competition involving G-quadruplex DNA and its complement. Biochemistry 2003, 42, 11736–11744. [Google Scholar] [CrossRef] [PubMed]
  41. Green, J.J.; Ying, L.M.; Klenerman, D.; Balasubramanian, S. Kinetics of unfolding the human telomeric DNA quadruplex using a PNA trap. J. Am. Chem. Soc. 2003, 125, 3763–3767. [Google Scholar] [CrossRef] [PubMed]
  42. Lane, A.N.; Chaires, J.B.; Gray, R.D.; Trent, J.O. Stability and kinetics of G-quadruplex structures. Nucleic Acids Res. Oct. 2008, 36, 5482–5515. [Google Scholar] [CrossRef]
  43. Macaya, R.F.; Schultze, P.; Smith, F.W.; Roe, J.A.; Feigon, J. Thrombin-binding DNA aptamer forms a unimolecular quadruplex structure in solution. J. A. Roe J. Feigon Proc. Natl. Acad. Sci. USA 1993, 90, 3745–3749. [Google Scholar] [CrossRef]
  44. Schultze, P.; Macaya, R.F.; Feigon, J. Three-Dimensional solution structure of the thrombin-binding DNA aptamer d(GGTTGGTGTGGTTGG). J. Mol. Biol. 1994, 235, 1532–1547. [Google Scholar] [CrossRef] [PubMed]