1. Introduction
Metal oxide-based conductometric gas sensors are widely utilized due to their high sensitivity, low cost, and ease of fabrication. A major drawback hindering their practical implementation is the requirement for elevated operating temperatures, essential for the surface adsorption and desorption reactions of gases. Reducing the operating temperature of the sensor is a critical area of development, as it leads to decreased energy consumption and extended operational lifespan for sensor devices [
1].
Sensor materials based on metal oxides are synthesized through various methods, such as spray pyrolysis [
2], template [
3] and impregnation [
4] techniques, sol–gel technology [
5], and hydrothermal and solid-state synthesis [
6,
7]. Mechanical milling is an effective method for reducing particle size, decreasing agglomeration, and homogenizing materials [
8,
9]. It relies on high-intensity grinding, resulting in particle size reduction, increased specific surface area, and the formation of lattice defects [
10].
All of these factors activate surface-active sites, influence the energy band structure during sensor fabrication, and consequently affect the diffusion of the target gas [
9,
11,
12,
13]. There are some studies of nanostructured metal oxide materials synthesized using the ball milling technique for use in gas sensors. For example, this method has yielded the optimal formulations of SnO
2-α-Fe
2O
3 to determine the ethanol content, and α-Fe
2O
3-ZrO
2 is promising for low-temperature determination of oxygen in nitrogen [
14]. SnO
2 powders with the addition of 1 mol% CuO and 3 mol% ZnO obtained by the ball milling method demonstrated high selectivity to CO gas at relatively low temperatures [
15]. Nanoparticles of 3 at% La-doped SnO
2 prepared by the ball-milling solid chemical reaction method exhibited the highest response to 31.5–50 ppm formaldehyde vapor, with the response and recovery time being 5 and 26 s, respectively [
16]. By varying the shredding parameters such as speed, time and solvent used, the structure of ZnO nanoparticles was optimized to effectively detect gases such as dry air/oxygen, argon, nitrogen, hydrogen and methane and atmospheric humidity [
17]. An electrochemical sensor based on Fe-TiO
2, obtained by high-energy ball grinding, demonstrated the ability to quickly determine paracetamol in pharmaceutical samples [
18].
Increasing the ball milling time of Co
3O
4 (0.5 wt.%) composites with SnO
2 led to an increase in pore volume within the 20–35 nm size range. This leads to a significant increase in the response to CO, while such an effective reaction is not observed for H
2, which is attributed to the higher diffusion coefficient of hydrogen [
19]. For instance, high-energy ball milling of the perovskite LaCoO
3 reduces crystallite sizes by a factor of 4 and increases sensitivity to carbon monoxide by a factor of 10 compared to perovskites obtained via the sol–gel method or solid-state reaction, respectively [
20]. It is also shown that the oxygen sensitivity of sensors based on SrTiO
3 obtained by the high-energy ball milling technique is much higher than commercial sensors [
21].
Indium oxide (In
2O
3) is promising for the detection of various toxic or flammable gases due to its chemical and thermal stability, high concentration of electrons and their mobility [
22,
23,
24]. Ball milling of indium oxide enhances the powder crystallinity and causes agglomeration of both precursor and indium oxide particles [
25]. It has been shown that high-energy ball milling of indium oxide powder can influence particle morphology and dispersion, and also produce polymorphic transformations [
26,
27]. Under ambient conditions, ball milling facilitated the transformation of cubic indium oxide into the hexagonal phase, which is typically observed only at elevated temperatures and pressures [
28]. The synthesized mechanoactivated h-In
2O
3 served as an anode material for lithium-ion batteries, exhibiting an enhanced and stable capacity compared to c-In
2O
3. It was demonstrated in another study that, after 40 h of mechanical milling, In
2O
3 became fully ferromagnetic with a hysteresis loop at room temperature. This phenomenon was attributed to intrinsic defects, specifically microstrain, generated during the milling process.
Furthermore, this study found no evidence of iron impurities or secondary phases that could be responsible for the observed ferromagnetism [
29]. The reduction in particle size, an increase in defect density and phase transformations of indium oxide are expected to influence its sensing properties. For example, the phase transformations of indium oxide in the In
2O
3/graphene nanocomposite obtained by the hydrothermal method resulted in a 20-fold increase in response at 5 ppm NO
2, achieving ultra-high sensitivity with minimal energy consumption compared to In
2O
3 [
30]. It should be emphasized that the primary method used in recent years for In
2O
3 synthesis and hydrogen-sensing research has been hydrothermal or its variants (
Table 1). The response of hydrothermal oxide obtained from indium to different concentrations of hydrogen has been found to be low. Therefore, various strategies are used to improve its sensory properties, such as creating homo-/heterotransitions, alloying different ions and modifying it with precious metals [
30,
31,
32,
33,
34,
35,
36].
The above information shows that the use of mechanoactivation to enhance the sensory properties of indium oxide has not been investigated, although the method has been used to improve optical, electrochemical and magnetic properties [
25,
28,
29]. Therefore, in the present work, the mesoactivation of In
2O
3 and its influence on gas-sensing properties were investigated for the detection of hydrogen, carbon monoxide, and ammonia. By varying the mechanical grinding time from 5 to 20 min, the structure and morphology of the nanoparticles of indium oxide can be adjusted to produce improved sensory characteristics of the obtained samples.
2. Materials and Methods
Commercial indium oxide from LANHIT (purity: 99.999%) was utilized for sample preparation. The grinding was performed using a high-energy Aronov mill operating at a frequency of 50 Hz and an amplitude of 50 mm. The volume of the grinding vessel was 108 mL, the mass of the hardened steel balls was 272 g, and the oxide mixture loading was 10 g. To prevent the overheating of the mixture and the mill, the process was carried out in single grinding cycles, each lasting 1 min, followed by 10 min breaks. Material samples were sequentially extracted after 5, 10, 15, and 20 min of milling to analyze changes in structural and functional characteristics. The powders of commercial indium oxide and those obtained after grinding for 5, 10, 15, and 20 min were designated as In2O3 (0 min), In2O3 (5 min), In2O3 (10 min), In2O3 (15 min), and In2O3 (20 min), respectively.
The structure of the powders obtained was investigated using X-ray diffraction analysis on a Rigaku SmartLab X-Ray Diffractometer (Rigaku, Tokyo, Japan) with monochromatic Cu Kα radiation with a wavelength of 1.5406 Å. The scanning range for the 2θ angle was 15° to 80° at a speed of 5°/min. The average nanoparticle size was determined from the XRD data according to the Debye–Scherrer formula, i.e., D = 0.9λ/(β·cosθ), where β is the peak full width at half maximum, and θ is the diffraction angle corresponding to the given peak.
The specific surface area was determined by the Brunauer–Emmett–Teller (BET) method at a relative pressure of P/P0 = 0.30 using an AMI-400 TPx (Altamira Instruments, Pittsburgh, PA, USA). Temperature-programmed reduction by hydrogen (H2-TPR) was carried out on the same instrument. Before measurements, the samples were pretreated in an argon stream at 300 °C for 10 min, then cooled to 50 °C. Reduction was carried out in a gas mixture of 10% H2 in Ar at a flow rate of 30 mL/min. The temperature was raised to 500 °C at a heating rate of 15 °C/min. The morphology and structure of the particles were determined by scanning electron microscopy using a Prisma E instrument (Thermo Fisher Scientific, Waltham, MA, USA). The local structure of the samples was investigated by Raman spectroscopy using the Raman microscope–spectrometer SENTERRA (Bruker, Ettlingen, Germany) with excitation at a wavelength of 785 nm.
To form the sensitive layers, the powders were mixed with terpineol, and then the homogeneous paste was applied to commercial polycor plates equipped with a platinum heater and contacts for resistance measurement [
37]. Then, the plate with the applied layer was gradually heated to 550 °C to achieve the constant resistance of the resulting film. Three sensors were made for each of the obtained samples and used for the measurements.
The conductivity and sensory characteristics were investigated on a device that we developed [
37]. Measurements were performed in the temperature range of 300–550 °C at a relative humidity (RH) of 30%. The temperature control accuracy was 1 °C. Certified ready-made gas mixtures containing 900 ppm H
2, CO, and NH
3 in air were used to determine sensor characteristics. Clean air or certified gas mixture was pumped at a rate of 200 cm/min through a measuring chamber of approximately 1 cm
3 volume equipped with a sensor. The gas flow was regulated by electromagnetic valves. As a result, the filling of the measuring chamber with a mixture of gases and its subsequent air purge took only a fraction of a second, allowing for high-precision kinetics to be tracked when the concentration of analyzed gas in the air changes.
The change in sensor resistance was recorded with the Keithley 34465A multimeter (Keysight, Santa Rosa, CA, USA). The signal from the multimeter was transmitted to a computer, where a special program provided the kinetic curve of change in resistance, reflecting the variation over time during the supply of the gas mixture being analyzed. Also, the response time τresp and the relaxation time τrelax of the sensor are defined as the time needed to achieve 90% change in sensor resistance during the introducion and removal of the analyzed gas, respectively.
3. Results and Discussion
Mechanical action on the material can influence its phase composition, particle size, and the number of crystal lattice defects [
9]. Phase and structural changes in the mechanically treated samples were investigated using X-ray diffraction analysis.
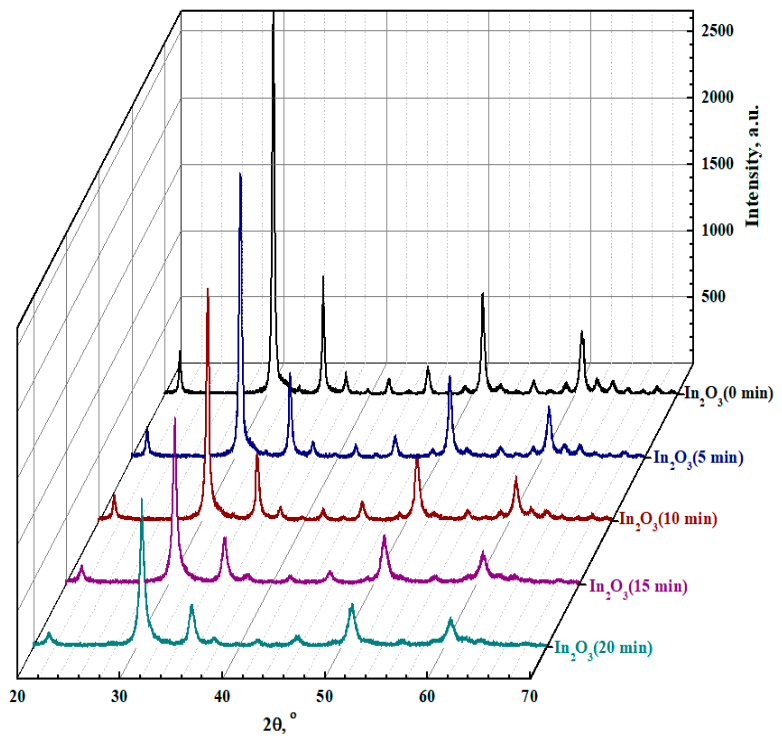
Figure 1 displays the evolution of XRD spectra for commercial In
2O
3 (0 min) powder and powders milled for 5, 10, 15, and 20 min.
The diffraction peaks at 2θ ≈ 21.5°, 30.6°, 35.5°, 45.69°, and 51.03° correspond to the (211), (222), (400), (431), and (440) crystallographic planes of the cubic In
2O
3 structure (JCPDS Card No. 71-2194). This result indicates the presence of the indium oxide crystalline phase in all samples. It has been shown that prolonged milling exceeding 96 h can lead to phase transformations in indium oxide due to plastic deformation and the formation of large defects during the milling process [
28,
38]. Our results show that, irrespective of the milling time, the absence of any extra peaks confirms that the samples contain neither impurities nor secondary phases. However, milling leads to the broadening of diffraction peaks and a decrease in their intensity (
Figure 1). These changes can be attributed to a reduction in both nanoparticle size and strain in the crystal lattice due to defects introduced during the grinding process.
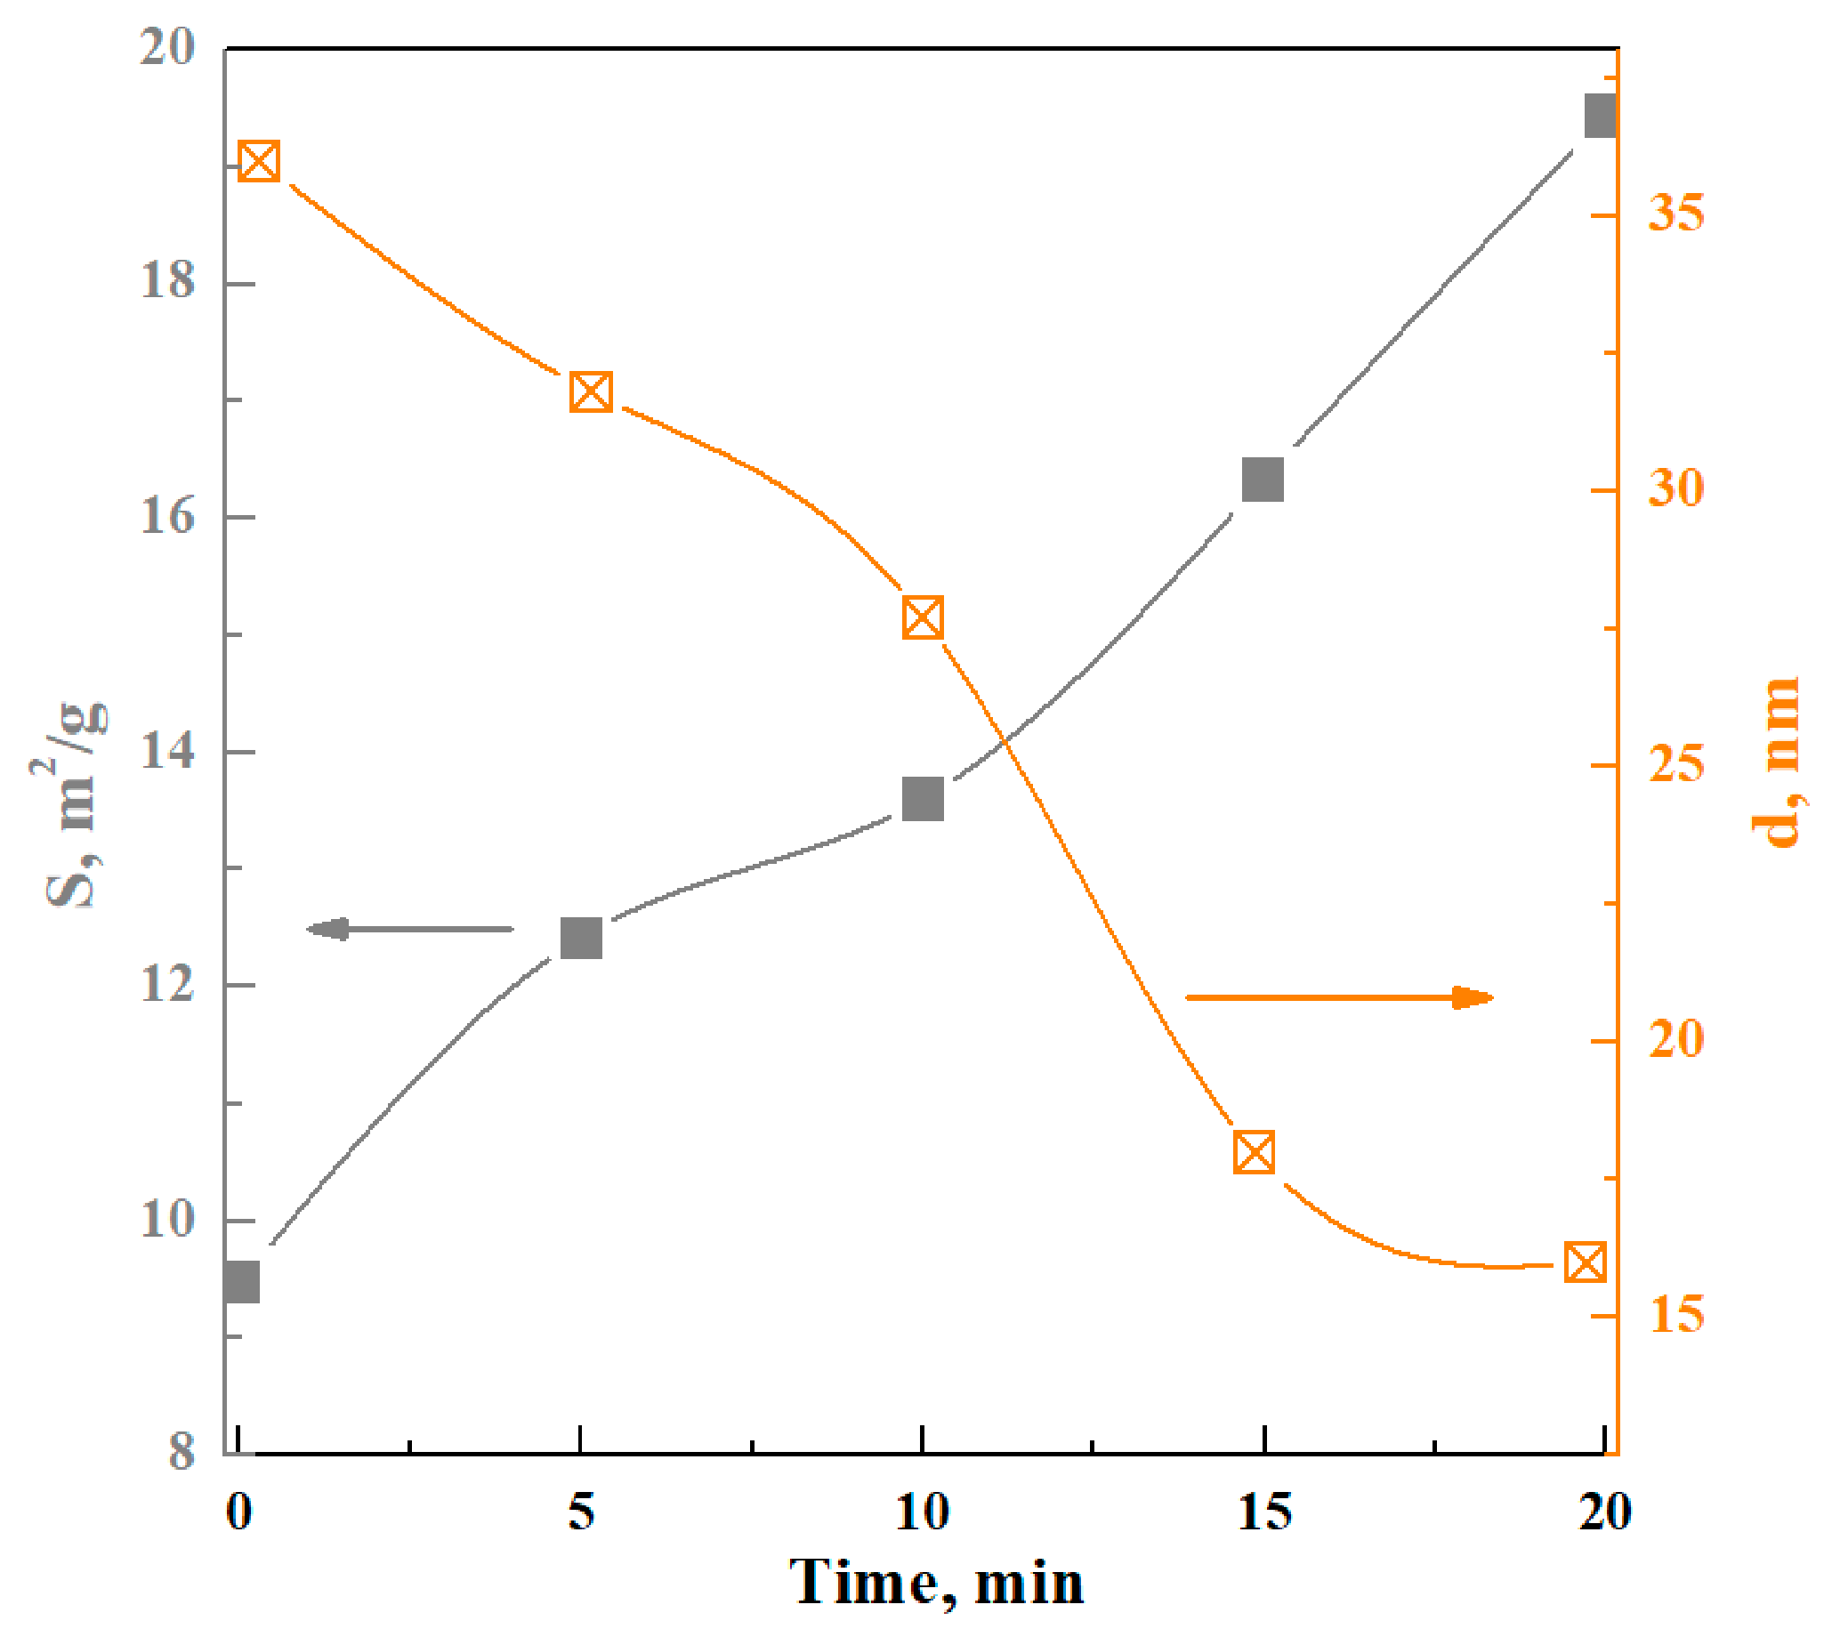
The size of the indium oxide nanoparticles, calculated using the Debye–Scherrer method from the XRD data, was 36 nm for the initial sample (
Figure 2). During the first 15 min of milling, there is a rapid decrease in particle size of 50%. The particle size decreases from 18 nm to 16 nm, as the milling time is extended to 20 min, which is not as intense as the result for the 15 min of grinding. Conversely, the specific surface area of the particles steadily increases with grinding time, rising from 9.5 m
2/g for the initial indium oxide to 19.4 m
2/g after 20 min of grinding. Thus, it can be assumed that, during the grinding of indium oxide, there is initially an active reduction in the size of nanoparticles, accompanied by an increase in specific surface area. Then, with a prolonged grinding time from 15 min to 20 min, an increase in particle porosity occurs, which enhances the specific surface area.
The structural parameters calculated from the XRD data are presented in
Table 2. The lattice parameter of the ground samples is higher than that of the commercial indium oxide, a trend observed independently of the processing time (
Table 2). The competition between defect accumulation and microstrain, resulting in local lattice expansion, could be responsible for this phenomenon. Mechanical activation has been shown to induce microdistortions in crystallites [
9].
Therefore, the Williamson–Hall method was used to separate the contributions of dispersion and microstrain to the broadening of the In
2O
3 reflections [
39]. It is observed that the crystallite size decreases, similar to the estimation by the Debye–Scherrer method, while the lattice strains increase with the extended grinding time (
Table 2). The differences in particle sizes measured by the different methods (
Figure 2 and
Table 2) are attributed to the fact that the Debye–Scherrer method accounts for peak size shrinkage only, while the Holder–Wagner method allows for the separation of size contributions and microshapes [
27,
40]. A similar behavior was observed in mechanochemically activated ZnO samples [
41,
42]. Analysis of the diffraction parameters reveals a reduction in crystallite size and an increase in internal microstrains, causing the partial disordering of the In
2O
3 structure upon mechanical treatment.
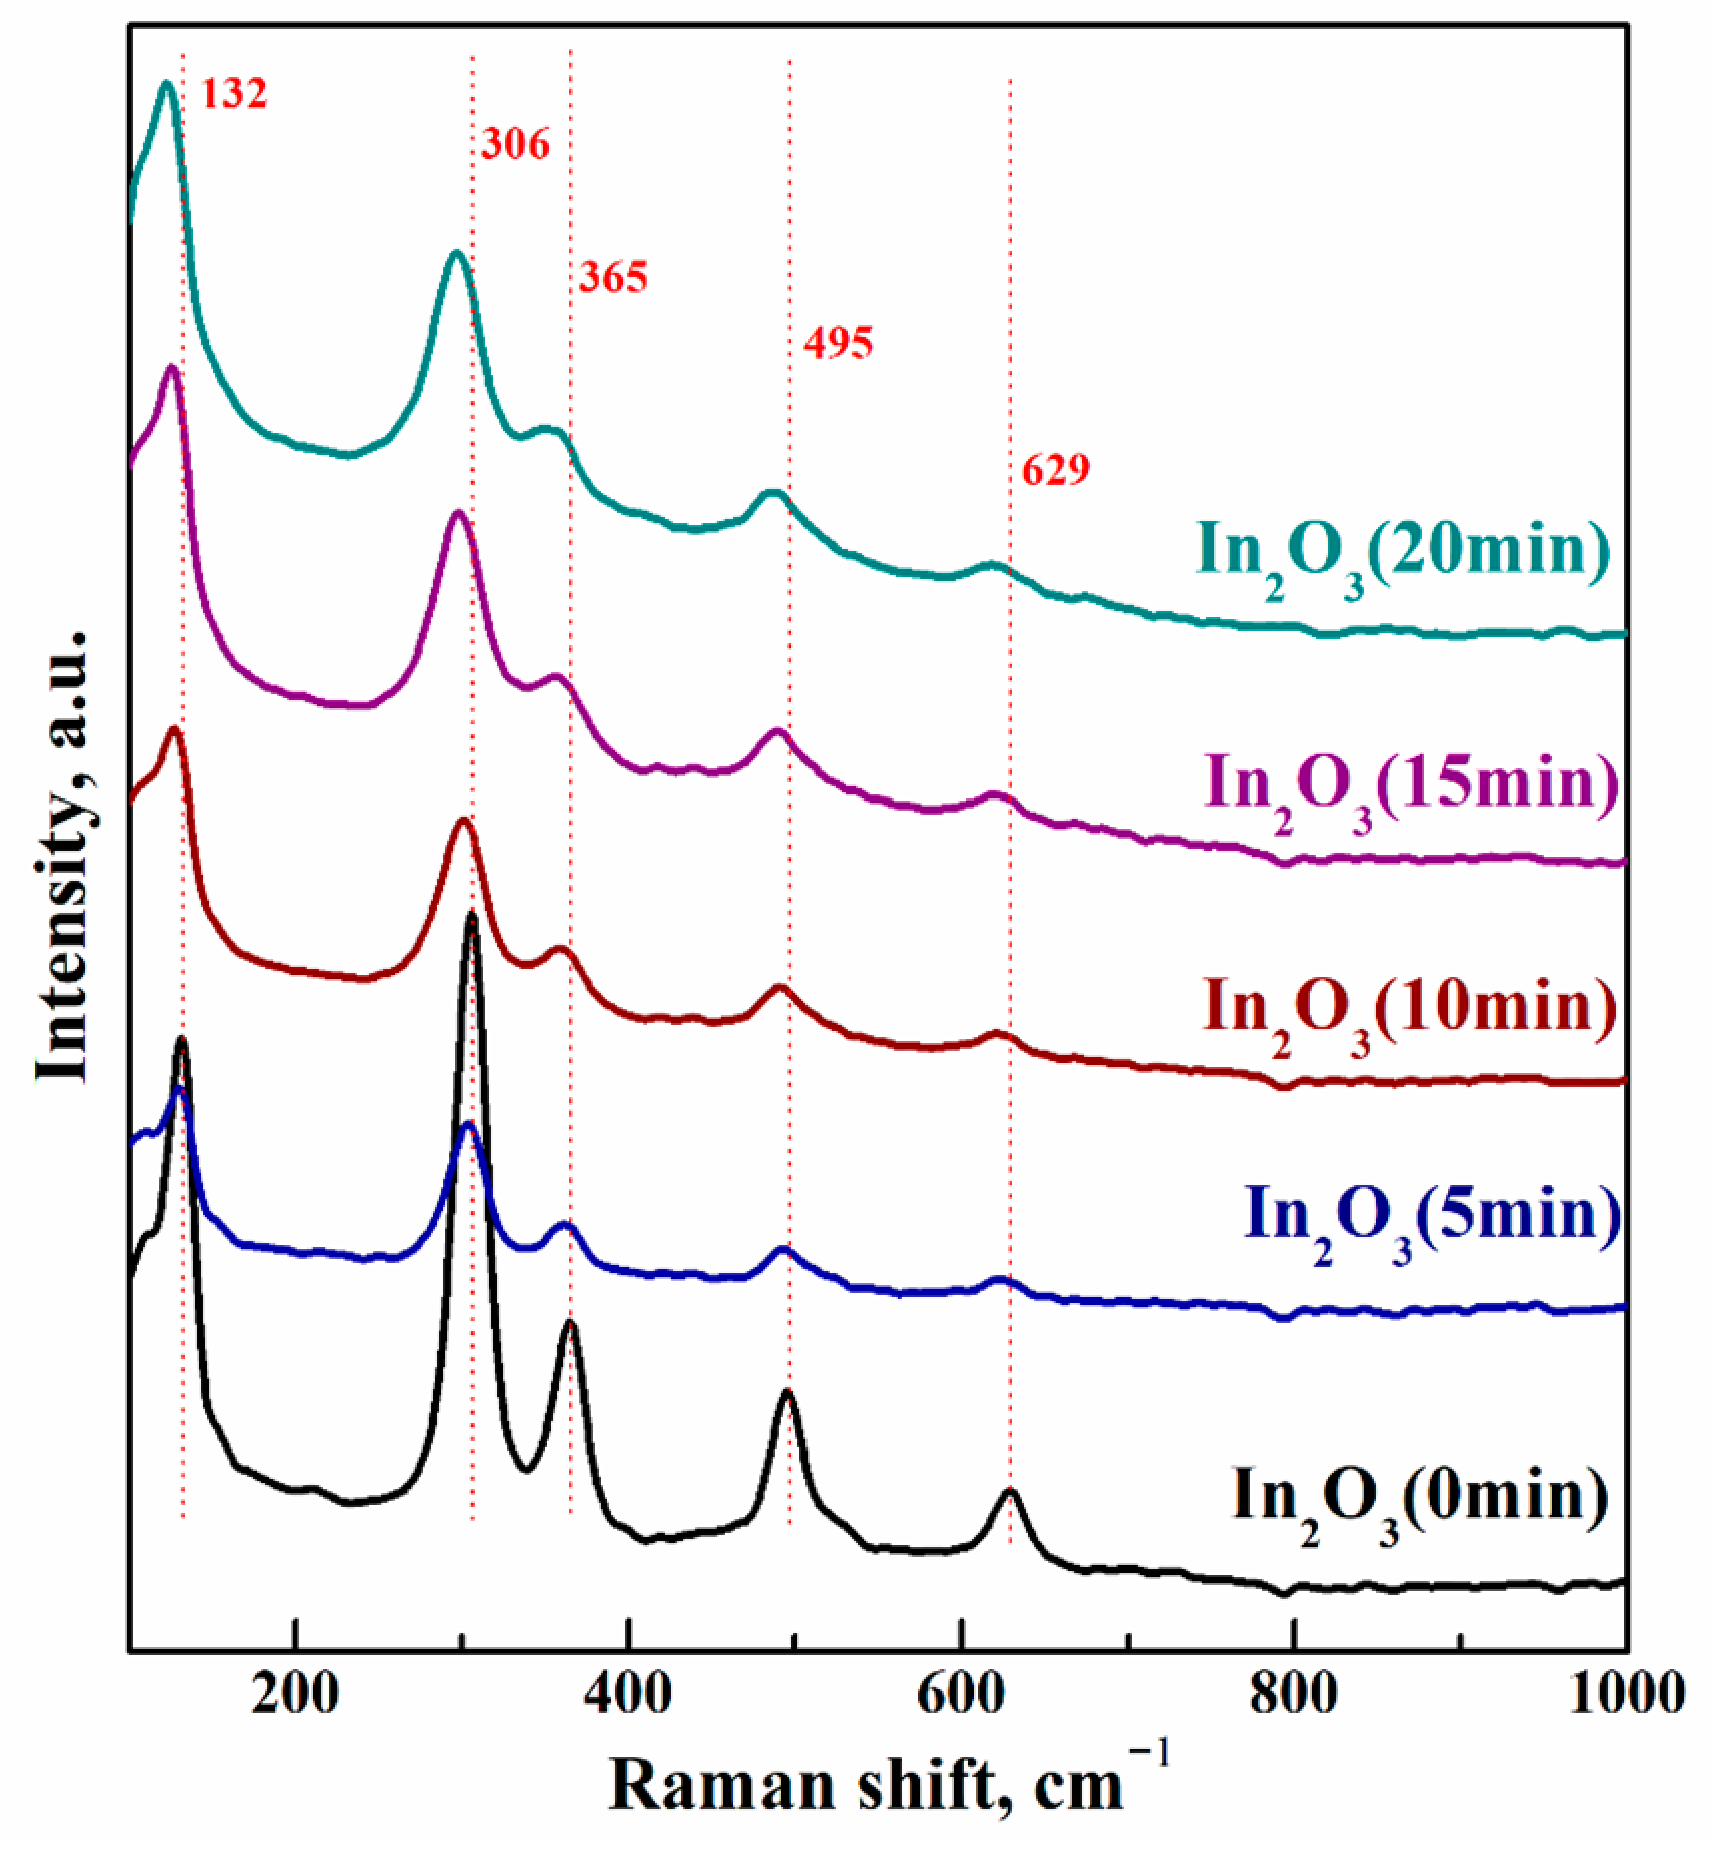
Furthermore, the Raman spectroscopy data corroborate the changes observed in the crystalline structure of indium oxide.
Figure 3 displays the Raman scattering spectra for indium oxide powders produced under different grinding times. The peaks with the highest intensity are located at 132, 306, 365, 495, and 629 cm
−1. All the modes correspond to the cubic bixbyite (c-In
2O
3) crystal structure, and the absence of new peak formation during grinding is further corroborated by the X-ray diffraction results. However, with prolonged mechanical exposure over 96 h, the Raman spectra exhibit a new peak at 161 cm
−1, indicative of the formation of the hexagonal phase of indium oxide [
38]. Moreover, after grinding for 5 min, supplementary peaks emerge between 1200 and 2000 cm
−1, but these peaks are transient and disappear with prolonged grinding. These peaks are indicative of luminescence originating from the In
2O
3 (5 min) powder and its subsequent quenching due to concentration effects. The luminescence observed in indium oxide In
2O
3 (5 min) probably stems from a confluence of structural and electronic factors.
Increasing the grinding time leads to peak broadening and reduced intensity, providing evidence for enhanced disorder within the crystal structure and the creation of defects. Beyond this, a red shift is noted. This shift increases with extended grinding times, reaching 10 cm−1 for the Raman peak near 132 cm−1 after 20 min of milling.
It has been demonstrated that reducing the crystallite size can induce a red shift in Raman peaks within the 1–10 cm
−1 range. This phenomenon is attributed to the spatial confinement of phonons and alterations in phonon mode frequencies stemming from sample strains or defects [
43,
44].
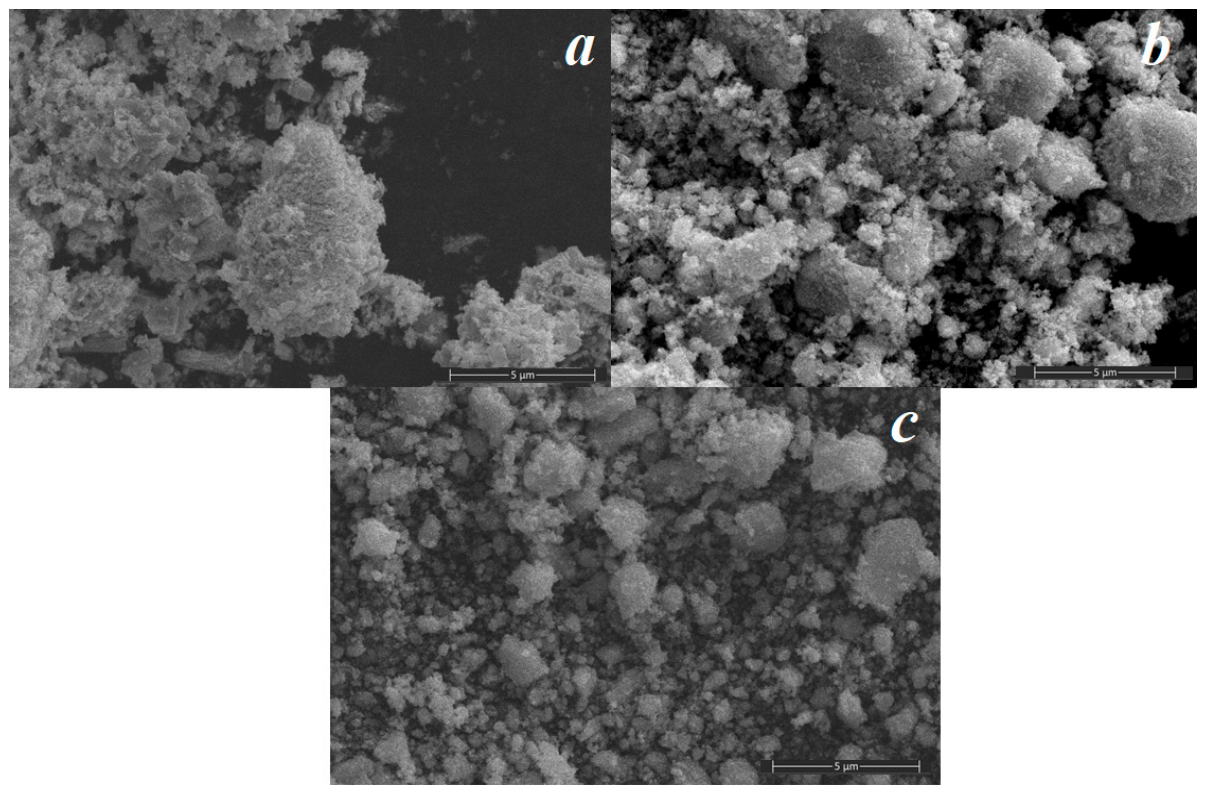
The grinding process in the Aronova mill affects not only the structural but also the morphological characteristics of the indium oxide nanopowder particles. This is corroborated by the scanning electron microscopy data (
Figure 4).
The as-received In
2O
3 powder is therefore highly inhomogeneous. It comprises particles with elongated shapes and sharp facets, 365 ± 100 nm long and with a characteristic aspect ratio of ~4, as well as cubic particles measuring 0.92 ± 0.17 µm (
Figure 4a). Furthermore, large, irregularly shaped agglomerates are present, with dimensions of 7.7 ± 1.9 µm. These agglomerates exhibit variations, including those with rough surfaces and others that are denser and possess smooth surfaces.
Mechanoactivation leads to the gradual homogenization of the powder with increasing grinding time. Thus, after 5 min of grinding, three types of particles can be distinguished (
Figure 4b). The smallest individual particles become more spherical, and their size decreases to 247 ± 160 nm. The larger particle aggregates also become more rounded in shape, their maximum dimensions decrease to 5 µm, and their surfaces are uniformly rough. Additionally, single particles of the order of 40 µm composed of large particle aggregates are observed.
As the grinding time increases, such particles are encountered less frequently, and they disappear entirely after 20 min of grinding. The number of large aggregates decreases, while individual particles, conversely, are encountered more frequently, with their size being approximately 25 ± 10 nm after 15 min of grinding and remaining unchanged with further increases in grinding time (
Figure 4c). Consequently, extending the mechanochemical processing time of indium oxide powder induces morphological and structural alterations. These modifications may influence the quantity of active gas interaction sites, thereby impacting the sensing properties of the resultant powders.
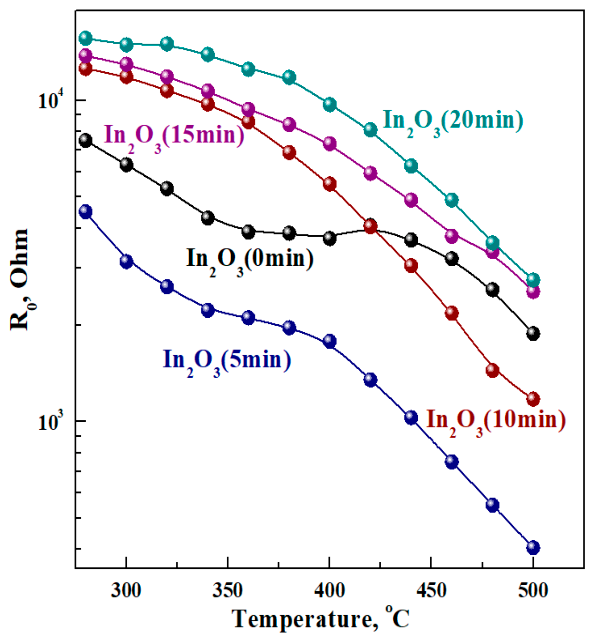
The study of the conductive properties of mechanically activated indium oxide powders shows that the resistance of all investigated samples decreases in the temperature range of 280–500 °C (
Figure 5).
The mechanism of charge transport in indium oxide involves electrons that are generated by oxygen vacancies. Elevated temperatures increase the degree of ionization and the mobility of charge carriers, leading to a reduction in resistance, thereby substantiating the electronic nature of conductivity in all specimens.
Grinding for five minutes in an Aronov mill results in a reduction in the sensor film’s resistance relative to the commercial sample (
Figure 5).
High-energy ball milling is known to introduce structural disorder, strain, and point defects into metal oxide powders, including In
2O
3. We hypothesize that mechanochemical activation in the early stages of milling may generate donor-type point defects (possibly oxygen vacancies and/or interstitial defects), which can introduce additional electronic states within the band gap. Such states could increase the free carrier concentration in the conduction band, thereby decreasing the overall resistance of the material. At the same time, prolonged milling reduces the crystallite size (
Figure 2 and
Table 2), which increases the total area of grain boundaries and impedes charge carrier transport, eventually leading to higher resistance. Notably, Raman spectra recorded with 785 nm excitation reveal a strong luminescence background in the 1000–2250 cm
−1 range for the sample milled for 5 min (
Figure S1). This finding corresponds to near-infrared emission approximately in the 865–965 nm region (maximum ~900 nm). We tentatively attribute the appearance and subsequent quenching of this luminescence to the formation and further evolution of optically active defects at short milling times. However, concentration quenching or additional structural changes cannot be excluded (see
Supplementary Materials).
The electrons are capable of readily moving into the conduction band, thereby augmenting the concentration of free charge carriers and consequently reducing the resistance of the sample. In contrast, an increase in milling time from 10 to 20 min results in a rise in resistance. This is accompanied by an increase in the number of individual particles and a decrease in their size, thereby causing an increase in resistance by impeding charge transport at the intercrystalline boundaries.
The nature of conductivity in the obtained samples determines the specifics of the sensor effects during hydrogen detection.
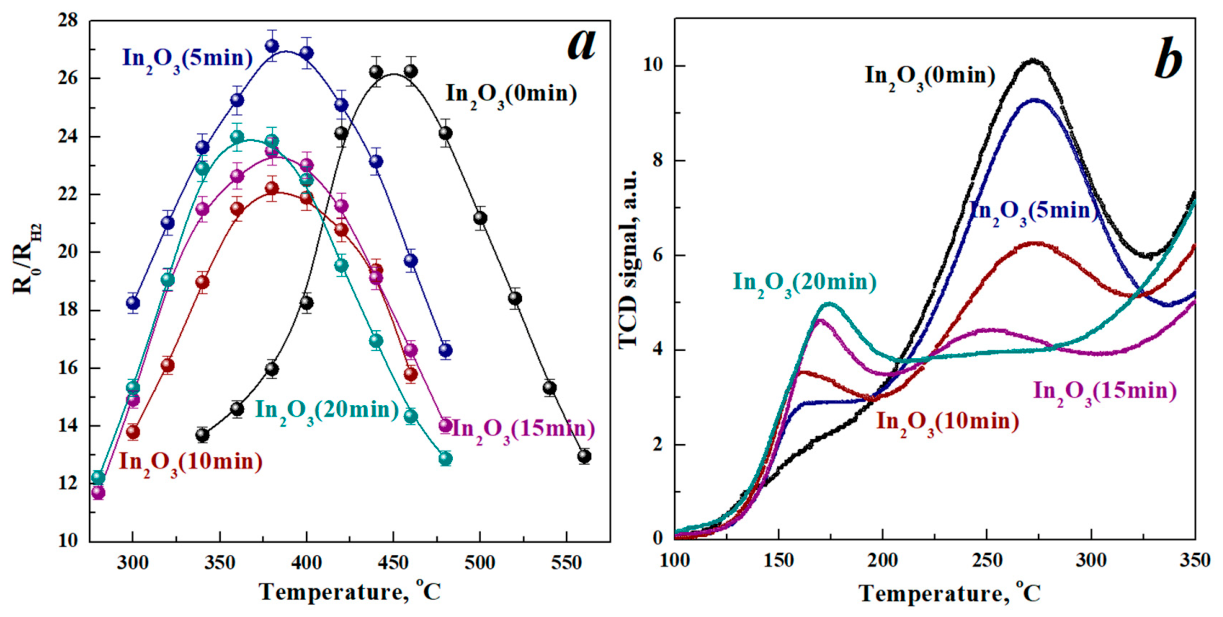
Figure 6a illustrates the temperature dependence of the sensor response observed in films fabricated from mechanoactivated indium oxide nanopowders when detecting 900 ppm of H
2.
The resulting profiles exhibit a maximum, denoted as S
max, at defined operating temperatures (T
max). The emergence of the maximum can be explained by two competing processes: the reaction of adsorbed hydrogen with oxygen centers and the desorption of gas from the sensor surface. Increasing the temperature promotes an increase in the rate of the sensor reaction, but at the same time leads to a decrease in the concentration of adsorbed gas. Notably, the optimal operating temperature (T
max) for the mechanoactivated samples, irrespective of the milling duration, is approximately 100 °C lower than the commercial counterpart (
Figure 6a). The reduction in the operating temperature of the sensitive element is important both for increasing the energy efficiency of resistive gas sensors and for expanding their application scope.
For the interpretation of the results, the catalytic activity of the sample surfaces was studied via temperature-programmed hydrogenation (TPR-H
2) (
Figure 6b). Increasing the temperature first leads to the reduction in various forms of chemisorbed oxygen, and subsequently, at temperatures above 300 °C, bulk reduction to metallic indium occurs [
45].
Figure 6b displays the TPR-H
2 profiles within the temperature range of 100–350 °C. The commercial indium oxide powder exhibits a prominent peak centered at approximately 280 °C, along with a less pronounced peak in the region of 160–170 °C.
During powder grinding, the high-temperature peak becomes progressively less intense, while the intensity of the low-temperature peak increases. These peaks correspond to oxidative–regenerative reactions of H
2 with the chemorbic oxygen ions on the surface of the samples. It has been shown that peaks of hydrogen recovery on the In
2O
3 surface with three different morphologies occur at different temperatures [
46]. According to the SAM, commercial indium oxide is highly heterogeneous and contains particles with different morphologies. The process of grinding leads to an increase in the population of smaller, smoother, and more defective particles. Thus, it can be assumed that the two-peak appearance of the TPR curve is due to the oxygen rebound associated with the particle surface as well as the oxygen located in less accessible areas, for example, pores and interparticle contacts within agglomerates. For the sample subjected to 20 min of shredding, only one maximum is observed in the TPR profile, which can be explained by the deeper destruction of agglomerates and the presence of more defects. Thus, oxygen is restored from a more homogeneous surface in terms of energy characteristics.
A similar pattern was previously observed during the hydrogen reduction in hydrothermally synthesized In
2O
3 powder with varying morphologies. Thus, cubic indium oxide particles showed a peak at 250 °C, while smaller and spherical particles displayed a peak at 160 °C [
37]. Both the commercial indium oxide and the powder consumed an equal amount of hydrogen (5.4 mmol/g) after 5 min of grinding. In contrast, powders subjected to 10, 15, and 20 min of grinding showed a decrease in H
2 consumption, falling within the range of 3.8–4.4 mmol/g. The hydrogen sensory data (
Figure 6a) is well correlated with the H
2-TPR profiles of the samples (
Figure 6b). Using time-resistance dependence, the kinetics of hydrogen reaction with charged oxygen forms was investigated in two temperature ranges of 360–400 °C and 440–480 °C. These ranges correspond to the maximum sensory response temperatures of mechanoactivated and commercial oxides, respectively. The dependence of ln(dR/dt) on 1/T was constructed for each temperature range.
The activation energies of these reactions were calculated using the Arrhenius relation. Thus, in the original powder, the activation energy decreases as the temperature increases from 1.07 ± 0.14 eV (360–400 °C) to 0.48 ± 0.01 eV (440–480 °C). Conversely it increases from 0.95 ± 0.18 eV to 1.71 ± 0.16 eV in the sample obtained with 20 min of shredding. This result implies that it is energetically better to react the original commercial indium oxide with hydrogen at higher temperatures. Notably, on the H
2-TPR curves, there is a predominance of the high-temperature peak reaction (
Figure 6b). At the same time, the 20 min sample shows the opposite pattern when activation energy is lower at 360–400 °C and low temperature peaks prevail on the H
2-TPR curves. The operating temperature of such sensors is also reduced (
Figure 6).
The results from the temperature-programmed reduction in mechanically activated indium oxide nanopowders correlate well with their sensor properties for hydrogen detection. Thus, when detecting 900 ppm of hydrogen, sensors based on In
2O
3 (0 min) and In
2O
3 (5 min) powders demonstrate a maximum response of approximately 26, but at different operating temperatures. Samples subjected to 10, 15, and 20 min of grinding exhibit a lower maximum response to hydrogen (see
Figure 6a). However, it is worth noting that, at temperatures below 450 °C, the response to hydrogen from the mechanically activated samples is nearly twice as large as that of the commercial sample. This implies that, with equivalent sensor power consumption, the mechanically treated indium oxide demonstrates enhanced sensitivity to hydrogen, a significant factor for their practical implementation.
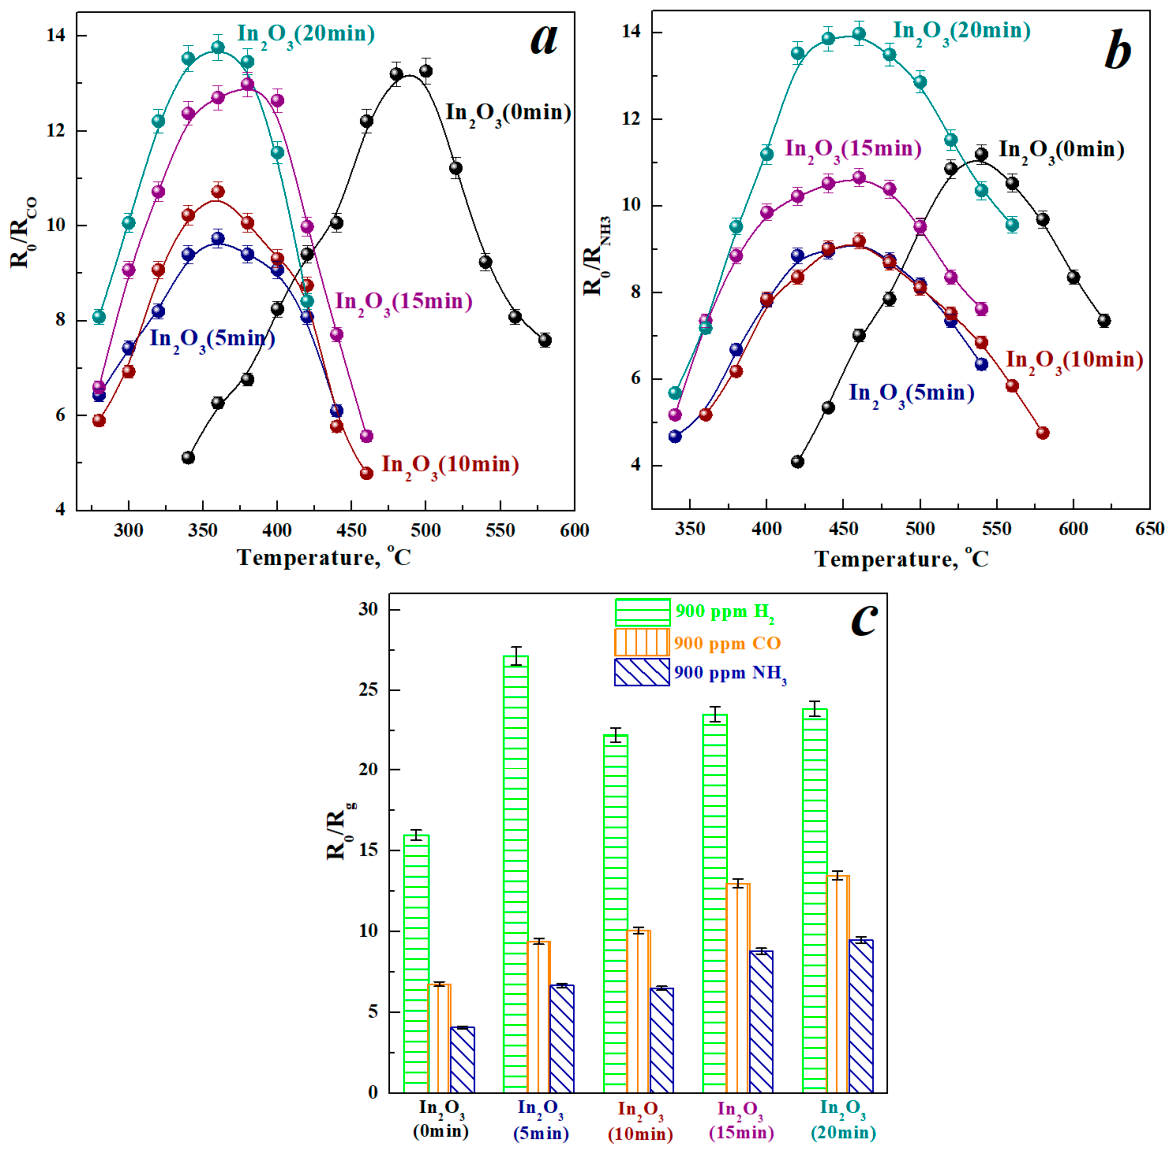
The sensing properties of the sensitive layers based on the mechanically activated indium oxide nanopowders were also investigated for the detection of 900 ppm carbon monoxide and ammonia (
Figure 7). It should be noted that grinding has a stronger influence on the temperature of the maximum sensor response to these gases compared to hydrogen.
In the context of carbon monoxide detection, commercial indium oxide exhibits an operating temperature of approximately 500 °C. Similar to the case with hydrogen, mechanoactivation regardless of grinding time leads to a significant reduction in operating temperature by approximately 150 °C (
Figure 7a). For ammonia detection, a similar trend is observed, although the temperature reduction is somewhat less, from 550 °C for the commercial sample to 450 °C for the mechanoactivated samples (
Figure 7b).
However, the impact of mechanoactivation on the signal amplitude shows a degree of difference. The maximum sensor response to carbon monoxide correlates positively with the mechanochemical treatment time, increasing from 9.5 for the In2O3 (5 min) sample to 13.5 for the In2O3 (20 min) sample. The trend observed during ammonia detection also shows an increase in the maximum sensor response corresponding to an increase in mechanochemical treatment time, from 5 to 20 min. The difference compared to carbon monoxide detection is that, after 15 min of indium oxide treatment, there is no effect of further mechanoactivation on CO detection plateaus, while sensor activity continues to increase with grinding time for ammonia detection.
Thus, mechanoactivation leads to a reduction in the operating temperature for the detection of all investigated gases, regardless of the grinding time. Thus, at a temperature of 380 °C, the sensory response of mechanically activated samples is 1.7–2.3 times higher than that for commercial indium oxide, depending on the gas being analyzed (
Figure 7c). These data correlate well with the more than two-fold increase in the specific surface area of the samples upon mechanical stimulation (see
Figure 2 and
Figure 7c). It can be seen that the sensitivity of all samples to CO and NH
3 is much lower than that to H
2, which indicates high selectivity towards hydrogen. Thus, the S
H2/S
CO values for the In
2O
3 (0 min), In
2O
3 (5 min), In
2O
3 (10 min), In
2O
3 (15 min), and In
2O
3 (20 min) samples are 2.4, 2.9, 2.2, 1.8, and 1.8, while the S
H2/S
NH3 values are 3.9, 4.1, 3.4, 2.7, and 2.5, respectively. Notably, the In
2O
3 (5 min) sample not only exhibits the highest hydrogen response but also superior selectivity. Furthermore, the detection limit of In
2O
3 (5 min) is 223 ppb, which is lower than that of commercial indium oxide (541 ppb), indicating the higher sensitivity of the mechanically activated sample in detecting hydrogen.
The detection limit was calculated using the formula LOD = 3σ/S, where σ and S are the standard deviations of the sensor resistance and the slope. The corresponding data are presented in
Figure S2. The response/recovery characteristics of the In
2O
3 (5 min) sample were repeated over five cycles using 900 ppm H
2 at 360 °C, demonstrating good reproducibility of the results for hydrogen detection. To study long-term stability, the resistance to hydrogen exposure and the response to it were tested every five days for three months. The results are shown in
Figure S3. The In
2O
3 (5 min) sample shows a virtually constant response with a maximum deviation of less than 5% over the course of a month. Thus, mechanical activation not only increases the response, sensitivity, and selectivity of the samples, but also provides excellent reproducibility and stability.
Nevertheless, its influence on the detection efficiency of H2, CO, and NH3 varies. The sensor response magnitude is determined by the abundance and accessibility of defects, which function as the active centers for gas-phase reactions.
As previously demonstrated, the grinding process leads to an increase in the number of defects in indium oxide. However, their accessibility depends on the structural and morphological characteristics of In
2O
3 and on the properties of the detected gas, particularly on the size and shape of the detected gas molecule. Thus, hydrogen and carbon monoxide molecules are linear, while the ammonia molecule has a trigonal pyramidal shape [
47]. The H
2 and CO sensor responses are higher than NH
3 responses due to the differences in the reactivity of these molecules on the indium oxide surface, although the small kinetic diameter of NH
3 (0.26 nm) may facilitate its diffusion to the active sites compared to H
2 (0.289 nm) or CO (0.376 nm).
The determining factor in the sensory process is how effectively a gas molecule reacts with the chemisorbed oxygen ions on the surface, as a result of which electrons are returned to the semiconductor’s conductivity zone. The interaction of NH
3 with oxygen ions occurs and forms intermediate nitrosin groups or ammonium ions. Such a reaction is less effective in releasing charge carriers than reactions with H
2 and CO, which easily enter oxidative–regenerative oxygen reactions. The response/recovery time values also confirm this. Their values for In
2O
3 (5 min) in hydrogen detection are 0.7c/56c, in carbon monoxide detection are 1.5c/80.1c and in ammonia detection are 1.8c/117c (
Figure S4).
The maximum response magnitude is enhanced by increasing the grinding time of indium oxide, when considering the operating temperature of the mechanoactivated samples. This is related to the decrease in their particle size and the increase in their specific surface area and porosity. The only exception is the sensor response to hydrogen of the In2O3 (5 min) sample. As demonstrated earlier, this particular sample is unique in its luminescence and, therefore, possesses additional lattice defects. Yet, hydrogen has the greatest access to these defects because of the molecule’s smallest size, which facilitates its diffusion in indium oxide.



 ,
,