Abstract
This innovative study introduces an eco-conscious and cost-effective approach to synthesizing gelatin-based carbon dots (CDs) via two distinctive methods: hydrothermal processing in a muffle furnace (CDs-MF) and domestic microwave (CDs-MW). Both strategies harness natural, low-cost materials and prioritize simplicity, sustainability, and environmental friendliness, culminating in effective fluorescent sensing of the pesticide thiamethoxam (TMX). For the hydrothermal route, the investigation explores two purification approaches—ultracentrifugation (CDs-MF-C) and 0.22 µm syringe filtration (CDs-MF-F)—while the microwave-derived CDs (CDs-MW) undergo dialysis alone. This study aims to investigate how synthesis and purification impact the CDs structural, morphological, and photophysical characteristics. The difference in size was obtained from transmission electron microscopy (TEM): 30–40 nm for CDs-MF-C, 12–15 nm for CDs-MF-F, and 3–6 nm for CDs-MW. Fluorescence emission performance reveals that CDs-MF-F performs a fluorescence quantum yield of 27%, CDs-MF-C at 23%, and CDs-MW at a modest 3%. All variants exhibit TMX detection via fluorescence quenching through the inner filter effect (IFE). Analytically, CDs-MF-C stands out with the lowest detection limit (LOD = 0.396 ppm) and quantification limit (LOQ = 1.317 ppm), followed by CDs-MF-F (LOD = 0.475 ppm; LOQ = 1.585 ppm) and CDs-MW (LOD = 0.549 ppm; LOQ = 1.831 ppm). These findings emphasize the unique interplay between the synthesis pathway, purification strategy, and functional performance, demonstrating the critical importance of tuning structural properties for optimizing carbon-dot sensors.
1. Introduction
Since their discovery by Xu and collaborators in 2004 [1], the carbon dots (CDs) have attracted increasing attention from the scientific community due to their optical properties, biocompatibility, economically accessible carbonaceous sources, and ease of synthesis [2]. Due to their intrinsic properties, CDs are being widely explored in various areas of application, including biomedicine [3], catalysis [4], photoelectronic devices [5], bioimaging [6], and, especially, analyte sensing [7,8,9].
Many studies have been dedicated to investigating the structure, morphology, and luminescence mechanisms of these carbon nanoparticles. The CDs can be obtained from a wide variety of natural sources, such as grass [10], lemon juice [11], and orange peel [12], or specific organic precursors, including o-phenylenediamine [13], graphene [14], and 3,4-diaminebenzoic acid [15]. In addition to the diversity of carbonaceous materials available, various synthesis methodologies can also be employed. Most CDs are produced using bottom-up approaches, which include the use of muffles, domestic microwave irradiation, pyrolysis/carbonization, and hydrothermal/solvatothermal [16,17,18]. In general, CDs are classified according to the graphitization in their core that can form different domains in their structure, the functional groups or polymer structure formed during synthesis, as well as their luminescence mechanism [19,20,21,22].
The evaluated structural and optical properties of CDs from citric acid and urea were obtained from three different synthesis routes (hydrothermal, microwave-assisted, and calcination) [23]. This study revealed that CDs obtained via the hydrothermal route exhibited predominant emission associated with surface states. In contrast, those synthesized by microwaves and calcination displayed emission related to core states, highlighting the relationship between the synthesis method and the luminescence mechanism. CDs obtained from 3,4-diaminobenzoic acid (3,4-DABA) using a domestic microwave procedure and varying the solvents [15] produced two types of CDs: one using a 50% solution of water and ethanol, and the other using a 50% 1 mol L−1 NaOH solution and ethanol. The authors demonstrated that the choice of solvent also has a significant influence on the optical and structural properties of the CDs.
The choice of precursors and synthesis methods significantly impacts the final properties of CDs. Biomass precursors (e.g., leaves, fruit, food waste) yield CDs with important photoluminescence and low toxicity, ideal for sensing applications [24]. The use of renewable resources not only reduces environmental impact but also enhances the economic feasibility of large-scale applications. Biomass-derived CDs typically possess abundant surface groups (e.g., –OH, –COOH, –NH2), which can facilitate interactions with pesticide molecules through hydrogen bonding, π–π stacking, or electrostatic attractions, making them ideal for analytical sensing [8,25,26]. Common for producing CDs from various biomasses—lemon peel; grass; bamboo leaves; tea—resulting in small; spherical; water-soluble CDs; though often lower QYs (<5% in water) [27]. Aromatic small molecules produced CDs with higher and red-shifted emission (QY ~50–86%) [28]. Natural polymers are essential sources in the production of CDs because they are biocompatible materials and facilitate nanoparticle functionalization reactions [29]. However, because they are large molecules, the mechanisms for obtaining CDs are essential because they can form carbon dots (CDs) and polymer carbon dots (PCDs) [30].
Recent studies have shown that the purification processes are equally decisive for the final characteristics, since during the process of forming CDs, it is common to generate by-products from incomplete carbonization of the precursor or the presence of small organic molecules of low molecular weight [31,32,33,34]. These residues can remain in the final solution and directly influence the optical properties of the CDs, leading to misinterpretations of the fluorescence origin, which are factors that directly impact the effectiveness of analytical applications, particularly in fluorescence-based sensing.
The investigation is based on a sequential purification protocol using membranes with different molecular cut-off weights for CDs obtained from orange peel by the microwave-assisted hydrothermal method [33], demonstrating that the various types of membranes allowed for the efficient separation of different by-products with distinct sizes that were formed during synthesis. Consequently, it was revealed that different molecular size ranges resulted in CDs with distinct optical and morphological properties. These results highlight the importance and difficulty of the purification process for CDs obtained from natural sources, particularly in controlling their final properties.
Another relevant study on the difficulty of purifying these carbon nanoparticles emphasizes the importance of the purification steps and the characterization of CDs, showing that, depending on the structure obtained at the end of the synthesis, only purification by dialysis membrane is not efficient in removing the secondary products formed [32].
While numerous studies have investigated the influence of synthesis and purification methods on the properties of carbon dots (CDs) and addressed the challenges inherent in these processes, as well as strategies for evaluating process efficiency, there remains a distinct lack of research exploring how these factors impact pesticide sensing applications. Few studies have examined how variations in synthesis (e.g., muffle vs. microwave methods) and purification procedures specifically affect the performance of CDs in detecting pesticides. In this work, we address this gap by evaluating gelatin-derived CDs synthesized through both muffle and microwave methods, followed by purification treatments. As a case study, we focus on thiamethoxam (TMX), a widely used agricultural pesticide of high environmental concern due to its toxicity and extensive application, for which the development of accurate and sensitive detection methods is essential [35]. Consequently, the novelty of this study lies not only in comparing different synthesis routes but also in exploring how purification methods can directly influence the analytical properties and detection mechanism of CDs for pesticide sensing, offering a more comprehensive understanding of their potential in environmental monitoring.
2. Materials and Methods
2.1. Chemical
Solid bovine gelatin type B was obtained from the Homergarvil drugstore (Ituiutaba, Brazil) and used without further purification. Quinine sulfate (SQ, solid, purity 99%) and atrazine (ATR, solid, purity 98.5%) were purchased from Sigma Aldrich (St. Louis, MO, USA). Ultrapure water (DI water, 18.2 MΩ cm−1) was used throughout the experimental course. Thiamethoxam (TMX, solid, purity 98.2%) is manufactured by Avilive Chemical (Lianyungang, China). For selectivity studies, the following pesticides were used: carbendazim (CBZ, solid, purity 98.39%), manufactured by Ningxia Winca (Yinchuan, China); acetamiprid (ACE, solid, 93%), manufactured by Shandong Hailir Chemical (Qingdao, China); and imidacloprid (IMI, solid, 97%), manufactured by Shandong Hailir Chemical (Qingdao, China). TMX, CBZ, ACE, and IMI reagents are distributed from Ourofino AgroSciences (Cravihos, Brazil). Acephate (ACP, solid, 98%) was obtained from Fluka Analytical (Buchs, Switzerland).
2.2. Synthesis of CDs
The following section describes in detail all the carbon dots studied in this work.
| CDs-MF | Gelatin carbon dots prepared in a muffle furnace |
| CDs-MF-C | Gelatin carbon dots prepared in a muffle furnace + ultracentrifugation purification |
| CDs-MF-F | Gelatin carbon dots prepared in a muffle furnace + ultracentrifugation purification + syringe filter |
| CDs-MW | Gelatin carbon dots prepared in a domestic microwave |
2.2.1. Synthesis Methodology
CDs gelatin by Muffle (CDs-MF): The CDs-MF were synthesized using a bottom-up approach via hydrothermal carbonization in a muffle furnace [36,37,38]. For the synthesis, 1 g of gelatin, used as the carbon source, was resuspended in 40 mL of a 50% (v/v) water/ethanol solution. The suspension was transferred to a stainless-steel autoclave (without Teflon coating) and heated at 200 °C for 3 h. After the heating time, the stainless steel was cooled to room temperature, and a brown solid was obtained (Figure 1).
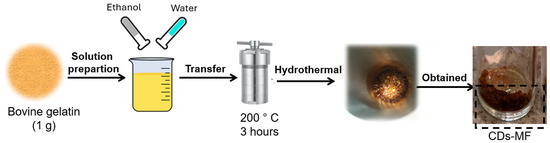
Figure 1.
Scheme of CDs-MF obtention from the muffle furnace.
CDs gelatin by microwave (CDs-MW): The CDs-microwave was synthesized previously in our research group, following the methodology described by Astolfi et al. [39]. A total of 0.25 g of gelatin was resuspended in 20 mL of 50:50 (v/v) 1 mol L−1 NaOH and ethanol solution. Then, the suspension was irradiated using a domestic microwave (Midea, 700 W, 2450 MHz) for 8 min. The resulting clear yellow dispersion solution was dialyzed against pure water through membrane dialysis (Fisher brand Regenerated Cellulose Dialysis Tubing; 12,000 to 14,000 Dalton) for 48 h (~5 cycles of fresh deionized water change) until the pH = 7.0 (Figure 2). The temperature and humidity conditions in the laboratory were ~30 °C and ~40%, respectively.
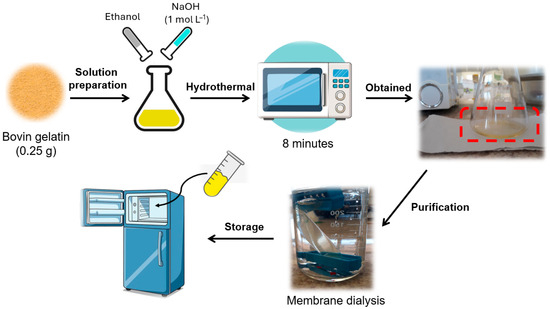
Figure 2.
Scheme for obtaining CDs-MW from domestic microwave irradiation.
2.2.2. Purification Procedure
The CDs-MW were utilized in sensing studies only after dialysis bag purification as described by Astolfi et al. [39]. While the CDs-MF was evaluated using two different purification processes, as described below (Figure 3):
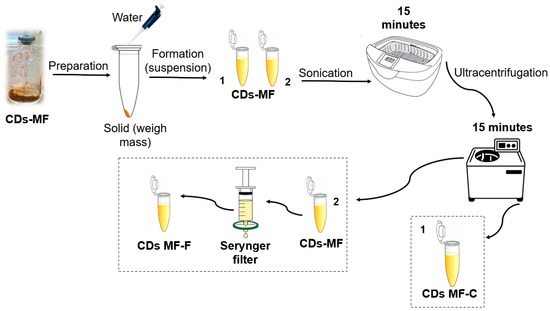
Figure 3.
Schematic representation of the purification methods: (1) CDs-MFC obtained by ultracentrifugation and (2) CDs-MF-F obtained by syringe filtration.
Centrifugation only (CDs-MF-C): The CDs-MF were initially obtained in solid form after synthesis. An aqueous suspension was prepared by dissolving 2 mg of CDs-MF in 2 mL of ultrapure water, followed by sonication (40 KHz) for 15 min. After sonication, the solution was subjected to ultracentrifugation at 12,500 rpm for 15 min to remove large aggregates and impurities. The resulting solution was used for subsequent analyses.
Centrifugation followed by syringe filtration (CDs-MF-F): After the sonication and ultracentrifugation steps described above, the CDs-MF suspension was further purified by filtration using a 0.22 µm PES syringe filter (NEST®) to remove remaining impurities.
2.3. CDs Characterization
FTIR-ATR spectra were acquired with a Cary 630 spectrometer equipped with an attenuated total reflectance (ATR) diamond crystal (Agilent Technologies, Barueri, Brazil), in the range 4000–950 cm−1. A German Bruker D8 Focus XRD (Bruker, Billerica, MA, USA) performed powder XRD with a graphite monochromatized Cu Kα radiation source (k = 1.54056 Å). Scanning electron microscopy (SEM) with energy-dispersive X-ray spectroscopy (EDS) was used to evaluate the raw material of the CDs-MF. The SEM is from Tescan, model(Tescan, Brno, Czech Republic). The size of CDs was obtained by a transmission electron microscope (TEM) operated at 100 kV (Hitachi HT-7700, Hitachi High-Tech, Tokyo, Japan)The aqueous suspension sample was deposited on a carbon-coated copper grid. Thermogravimetric analyses (TGA) of the CDs were carried out in a Thermal Analyzer TGA 55 (TA Instruments, New Castle, DE, USA). In the tests, about 100 μL of an aqueous suspension of CDs was heated in an alumina sample holder, between 30 °C and 900 °C, at a heating rate of 5 °C min−1, under a nitrogen atmosphere at a flow rate of 60 mL min−1. The zeta potential analysis was acquired on a Zetasizer Nano ZS90) (Malvern Panalytical, Malvern, UK). The samples were prepared according to their respective purification methods, all at the same concentration (1 mg mL−1). UV-Vis-NIR absorption spectra were measured on a Cary 5000 spectrometer (Agilent Technologies, Santa Clara, CA, USA). Fluorescence emission spectra and excitation spectra were recorded on Cary Eclipse (Agilent Technologies, Santa Clara, CA, USA)Time-resolved fluorescence measurements were performed using a Tsunami laser system (Spectra-Physics, Santa Clara, CA, USA), employing the time-correlated single photon counting (TCSPC) method with an excitation wavelength of 280 nm and emission of 420 nm, CDs diluted in water (pH ~5), and analysis temperature at 298.15 K. Data were analyzed by using commercial software (Edinburgh Instruments, Livingston, UK) based on a non-linear least-squares method. For the detection of CDs in onion and emission, an inverted fluorescence microscope analysis was used, utilizing a Nikon Eclipse Ti microscope at 200× optical zoom.
2.4. Fluorescence Quantum Yield Measurements (ΦF)
Fluorescence quantum yield (ΦF) is defined as the ratio of the number of photons emitted to the number of photons absorbed, representing the efficiency of converting absorbed light into emitted light, typically in the form of fluorescence [40]. The ΦF values were determined using a relative method [23]. The reference standard used was quinine sulfate (QS) (ΦF = 0.54) in 0.10 mol L−1 of H2SO4 solution [39]. The CDs-MF were determined in an aqueous solution. To calculate ΦF values, the following equation was used (Equation (1)):
where the subscript “FR” refers to quinine sulfate, “CDs” refers to sample solutions of CDs, ΦFCDs is the fluorescence quantum yield, “I” is the area of integrated fluorescence emission spectra, and n is the refractive index of the solvent (n = 1.33).
ΦFCDs = ΦFR (ICDs/IR) (n2R/n2CDs)
2.5. Fluorescence Emissions of the CDs at Different pH Values
A series of pH Britton–Robson (BR) buffer solutions was prepared from an equal mixture of 0.1 mol L−1 acetic acid, 0.1 mol L−1 boric acid, and 0.1 mol L−1 phosphoric acid [13,15,41]. The CDs pH values (2–12) were adjusted with the addition of 2 mol L−1 NaOH. The samples were analyzed using UV-Vis absorption and fluorescence emission spectroscopy (λexc = 250 nm and λem = 320 nm).
2.6. CDs Fluorescence Sensing TMX
Fluorescence quenching emission behavior of the CDs in the presence of thiamethoxam (TMX) was investigated using CD solutions. The aqueous stock solution of TMX was at a 0.2 mg mL−1 concentration. The CD suspensions were prepared in BR buffer solution (pH = 7.0) and adjusted to an absorbance of approximately 0.3 at the excitation wavelength (λexc = 250 nm). All solutions, CDs-MF, were freshly prepared. A range of TMX concentrations (0–7.00 ppm) was tested. For lower concentrations (0–1.40 ppm), 2 μL aliquots of the TMX solution were added, and for higher concentrations (2.00–7.00 ppm), 10 μL aliquots were used. After each addition, the solutions were gently agitated and equilibrated for 5 min before fluorescence emission measurements. The fluorescence emission spectra were recorded using an excitation wavelength of 250 nm with excitation and emission slit widths set to 10 nm. The quenching efficiency was monitored by comparing the fluorescence intensity of the CDs in the absence (F0) and presence (F) of increasing TMX concentrations.
2.7. Obtaining Analytical Parameters
The calibration curves were obtained using linear regression with the Origin program. From these curves, the analytical parameters, including linearity, limit of detection (LOD), and limit of quantification (LOQ), were determined. The slope (S) and the standard deviation of the intercept (σ) were used in the calculations, with LOD and LOQ estimated according to the equations LOD = 3σ/S and LOQ = 10σ/S [42]. In addition, non-segmented regression (Picewase) was performed using Python 3.13 codes (Supplementary Material–Code S1).
2.8. Selectivity
The selectivity studies were conducted using a standard solution of TMX at a concentration of 0.2 mg mL−1 in BR buffer solution (pH = 7.0). Possible interfering pesticides, including imidacloprid (IMI), atrazine (ATR), acetamiprid (ACE), and acephate (ACP), were tested under the same conditions to evaluate their potential interference with the THX detection. Aqueous solutions were prepared by mixing TMX with each potential interfering compound at equal concentrations (1.384 ppm). After preparation, the mixtures were gently agitated and allowed to equilibrate for 5 min before fluorescence emission measurements. The fluorescence response was recorded at excitation and emission wavelengths of 250 nm and 420 nm, respectively.
2.9. Fluorescence Microscopy of CDs on Onion Endothelial Cells
Onion endothelial cells were used as a plant research model in this pesticide quenching. The monolayer onion endothelial cells were incubated with CD-MF-F aqueous solution (20 mg mL−1) for 1 h, then washed twice with ultrapure water and imaged with the inverted fluorescence microscope. The intensity of the CDMF-F on onion cells was analyzed using Image J (Fiji, version 1.54f), which yielded the histogram profile.
3. Results and Discussion
The carbonization mechanism of gelatin is directly related to the pyrolysis temperature [43], where from room temperature to 200 °C, the polypeptide chains and peptide bonds in gelatin were cleaved, and from 200 to 500 °C, the carbon structure began to form. The linear polypeptide chains decomposed and became cross-linked, forming aromatic ring structures by cyclization, whilst large amounts of NH3, CH4, CO2, and O-containing organics were released as byproducts. Surface O as well as N atoms were converted into carbon structures, doped with C=O to C-O, O-C=O, and N. In the microwave procedure, it is essential to note that sodium hydroxide can effectively accelerate the carbonization process in the carbon dot synthesis [44]. The size of the synthesized carbon dots increases when the sodium hydroxide concentration is reduced [45], because the sodium hydroxide influences the isotropic growth and transformation of colored CDs.
3.1. Characterization of CDs
The versatility of CDs in analytical sensing is primarily attributed to their photoluminescence properties. However, fluorescence emissions can sometimes arise from synthesis by-products, potentially leading to misinterpretation of results. The correlation between different CD purification procedures and the identification of the fluorescence quenching mechanisms from CDs and analytes aims to contribute critically to the applications of carbon dot nanoparticles in analytical sensing [31,46,47].
Experimentally, it was observed that different synthesis methodologies for gelatin-derived CDs—muffle furnace and microwave irradiation—resulted in a solid material and an aqueous suspension; respectively (Figure S1, Supplementary Material). The carbonized solids derived from the CDs-MF synthesis were processed following the methodology described in Section 2.2.2 (Purification Procedure). As illustrated in Figure 3, this treatment resulted in the formation of a brown solid. The solid dispersed in H2O resulted in a yellow aqueous suspension accompanied by a solid polymeric residue (pellet). The yellow aqueous suspension presents fluorescence emission under UV light, like a microwave aqueous solution.
The synthesis of CDs-MF was conducted at least four times to assess the repeatability. The reproducibility was assessed using spectroscopic characterization, specifically UV-vis spectra and fluorescence emission profiles. Where bandwidth and height were compared to each sample batch. The CDs-MW were obtained from the domestic microwave, which was previously produced by our group [39].
Initially, the solid material obtained from CDs-MF was analyzed using SEM, EDS, and fluorescence microscopy. SEM images revealed a brittle, glass-like texture (Figure 4a). EDS indicated the presence of elements like carbon, oxygen, and traces of sulfur (Figure 4b). The sulfur-containing groups were also evidenced by a strong characteristic odor detected at the end of the synthesis. Under fluorescence microscopy (Figure 4c,d), in the bright field, the brittle and glassy appearance was further confirmed (Figure 4c). Upon UV excitation, a more intense emission was observed in the blue and green regions of the spectrum, confirming that the solid formed exhibits both brittleness and strong fluorescence emission (Figure 4d).
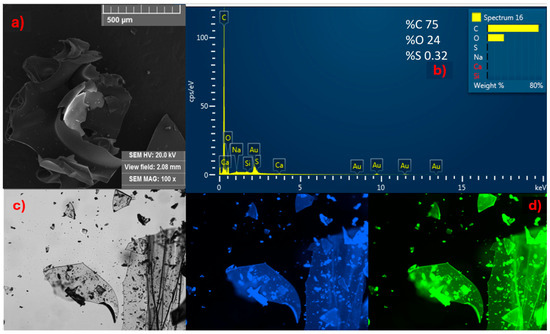
Figure 4.
All data presented in this figure refer to solid CDs-MF: (a) SEM images at 100×; (b) EDS spectrum; (c) bright-field fluorescence microscopy image; and (d) fluorescence under blue and green excitation.
FTIR-ATR analysis of solid-state CDs-MF, both before and after purification (Figure 5a), revealed a broad peak at 3.304 cm−1, corresponding to the stretching vibrations of hydroxyl (O–H) and primary amine (–NH2) groups [48,49]. In addition, in the region between 1.600 and 1.400 cm−1, a peak at 1.632 cm−1 is attributed to C=N stretching vibrations, possibly indicating the presence of imine or related nitrogenous structures [13]. The peaks at 1.532 cm−1 and 1.441 cm−1 are assigned to C=C stretching in aromatic conjugated systems and N–H bending vibrations, respectively, suggesting the formation of conjugated aromatic domains during the synthesis process. Furthermore, as reported by Liang et al., the peak observed at 550 cm−1 can be attributed to S–C stretching vibrations, indicating the possible presence of sulfur-containing functional groups as observed in the EDS analysis [36]. For CDs-MW, the intense peaks at 1620 and 1046 cm−1 confirm the presence of C=O and C–O stretching, respectively, characteristic of carboxylic groups [39]. While the peaks around 1.532 cm−1 and 1.441 cm−1 as well as 550 cm−1 were not observed.
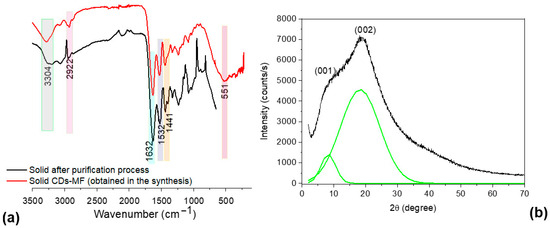
Figure 5.
(a) FTIR-ATR spectra of CDs-MF before and after purification, and (b) powder XRD pattern of the solid CDs-MF.
The XRD pattern of solid CDs-MF (Figure 5b) revealed peaks at 10.21° and 19.98° through Gaussian deconvolution (green line), making it possible to visualize these peaks better. According to Bigi’s study about gelatin, the peak at 2θ around 8° is related to the diameter of the triple helix, and its intensity would be associated with the triple-helix content [50]. The broad peak at a 2θ value of approximately 20° corresponds to the amorphous nature of gelatin [51]. Mintz et al., found that peaks appearing in the range of 10–12° (d ≈ 0.86 nm) can be associated with the presence of oxygenated functional groups and distorted lattice planes [52], while the peak around 19° (d ≈ 0.44 nm) indicates a disordered structure, which is ascribed to the existence of abundant functional groups compared to graphitic carbon (0.34 nm) [53]. While the gelatin CDs-MW, obtained using microwave irradiation, exhibited a typical amorphous peak at 2θ ≈ 21.07° (d ≈ 0.42 nm) [39]
Following the characterization of the solid materials, transmission electron microscopy (TEM) was employed to complement the morphological analysis and provide further insight into the nanostructure of the aqueous suspensions. The TEM (Figure 6) analysis revealed morphological and size differences between CDs-MF-C (Figure 6a) and CDs-MF-F (Figure 6c), indicating that the purification procedure significantly influences the final morphology of the CDs. CDs-MF-C appeared as agglomerated nanoparticles, while CDs-MF-F were well-dispersed and exhibited an almost spherical morphology. The particle size distribution was measured using ImageJ software (Fiji) (version 1.54f), based on statistical analysis of approximately 30 nanoparticles for CDs-MF-C (Figure 6b) and 50 nanoparticles for CDs-MF-F (Figure 6d). The histogram, a graphical representation of the distribution of particle sizes, indicated that the average size of CDs-MF-C was approximately 30–40 nm, while the CDs-MF-F had a smaller average size of 12–15 nm. The frequency of particles of that size for sample CDs-MF-C is greater than for sample CDs-MF-F. Compared to CDs-MW, these samples exhibited notable morphological differences, as the size of CDs-MW was significantly smaller, ranging from 3 to 6 nm [39]. These findings suggest that both the synthesis and purification methods influence the size and morphology of gelatin CDs.
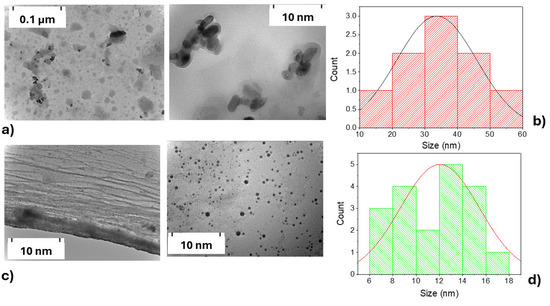
Figure 6.
TEM images and corresponding size distribution histograms of the suspensions CDs-MF: (a) TEM of CDs-MF-C; (b) size distribution histogram of CDs-MF-C; (c) TEM of CDs-MF-F; and (d) size distribution histogram of CDs-MF-F.
Recently, the syntheses of gelation CDs [38]. In a similar hydrothermal procedure described in this work, the zeta potential value was obtained to be −32 mV. This value is close to that obtained for CDs-MW (−20.8 mV) prepared under microwave irradiation [39]. It is important to note that the CDs-MF-C and CDs-MF-F present values of −4.70 mV and −7.46 mV, respectively (Figure S2, Supplementary Material). The lower zeta potential values for CDs-MF-C and CDs-MF-F are consistent with the FTIR-ATR results, which indicate fewer oxygenated surface groups compared to CDs-MW. The FTIR-ATR obtained for gelatin carbon dots by Asyl & Narayan [38] and Astolf et al. [39] showed carboxylic acid and other oxygen-rich functional groups differently from CDs-MF-C and CDs-MF-F. It is worth noting that the C-S stretch characteristic of gelatin is not seen in gelatin CDs obtained by microwave irradiation [39] as it is in CDs-MF-C and CDs-MF-F.
To investigate the composition of the CDs, thermogravimetric analysis (TGA) was performed (Figure S3, Supplementary Material). The TGA analysis shows the degradation profile and total weight loss of the suspension CDs-MF sample. Two distinct decomposition events were observed in both CDs-MF. The first weight loss step, occurring between 150 and 244 °C, is associated with the degradation of surface functional groups or polymeric structures formed during the synthesis. The final decomposition step, occurring between 375–647 °C for CDs-MF-C and 365–612 °C for CDs-MF-F, corresponds to the degradation of the carbonaceous main framework. Above 660 °C, no residual mass was observed, indicating that the CDs-MF were completely decomposed [54]. The TGA of the CDs-MW showed similar events were observed [39].
3.2. Optical Properties of the CDs
UV-Vis absorption and fluorescence emission spectroscopy were employed to assess the impact of the purification procedure on the optical properties of CDs-MF. All samples were prepared at the same concentration (1 mg mL−1). CDs-MF samples exhibited similar absorption profiles, featuring a maximum absorption at ~280 nm with a pronounced shoulder at ~380 nm in the visible range (Figure 7a). The absorption bands at ~250 nm and ~280 nm correspond to π–π* transitions of aromatic sp2-hybridized carbon domains, and 280 nm beyond the π–π* transitions can be attributed to the n–π* transition of the C=O [55,56,57], while the broad absorption between 300 and 500 nm corresponds to surface functionalities n–π* transitions [13,15,57].
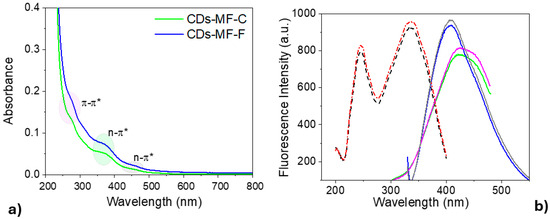
Figure 7.
(a) UV-visible spectra of CDs-MF suspension in water (1 mg mL−1). (b) Fluorescence spectra of gelatin CDs: excitation profiles (dashed red line—CDs-MF-F; dashed black line—CDs-MF-C) and emission spectra (CDs-MF-F: solid gray and pink lines at λexc = 320 nm and 250 nm, respectively; CDs-MF-C: solid blue and green lines at λexc = 320 nm and 250 nm, respectively). In both cases, the CDs were dispersed in water at 1 mg mL−1, with excitation/emission slit widths of 10/10 nm.
The fluorescence emission from CDs-MF in this work exhibits excitation at two wavelengths (250 or 320 nm) (Figure 7b). CDs-MF, when excited at 250 nm, exhibits a broad emission centered at 420 nm, while an emission at 407 nm is observed when excited at 320 nm.
Like the UV-Vis. absorption data, CDs-MF-F showed higher fluorescence intensity than CDs-MF-C. These findings are further supported by the quantum yield (ΦF) values measured at 280 nm excitation: 27% for CDs-MF-F and 23% for CDs-MF-C (Figure S4, Supplementary Material). The differences in the quantum yield (ΦF) values observed for the CDs-MF samples indicate that syringe filtration facilitated the removal of interfering by-products and promoted a more efficient fluorophore population, improving the luminescence properties [46,58].
Studies were conducted on CDs, varying the excitation wavelengths from 230 nm to 420 nm in increments of 10 nm. It was observed that both CDs-MF (Figure 8) samples exhibited similar emission profiles, further confirming that the purification process does not significantly influence the composition or structure of the CDs but rather increases the ΦF. When the CDs-MF were excited at lower wavelengths (230–290 nm) (Figure 8a–c), excitation-independent emissions were observed, characterized by dual emission bands around 312 nm (attributed to the core emission) and 420 nm (surface state emission) [59,60]. In contrast, for excitation wavelengths in the range of 300–420 nm (Figure 8b–d), the CDs exhibited excitation-dependent behavior, evidenced by a bathochromic shift in the emission from 402 nm to 470 nm, along with a decrease in fluorescence intensity as the excitation wavelength increased. These behaviors can be attributed to the presence of multiple emissive centers, including both carbon core states and surface-related states [61,62,63]. According to the literature, excitation-dependent photoluminescence is often associated with particle size, size distribution, and various surface states that contribute to distinct electronic recombinant pathways [42,64]. Additionally, excitation-independent emissions are frequently related to surface fluorophores, well-defined [65,66]. The same behavior was also observed for the CDs-MW [39]. Based on these results, it is likely that both CDs-MF and CDs-MW exhibit emission contributions from both core-related and surface-related states. As a result, the CDs show a combination of excitation-dependence and excitation-independence.
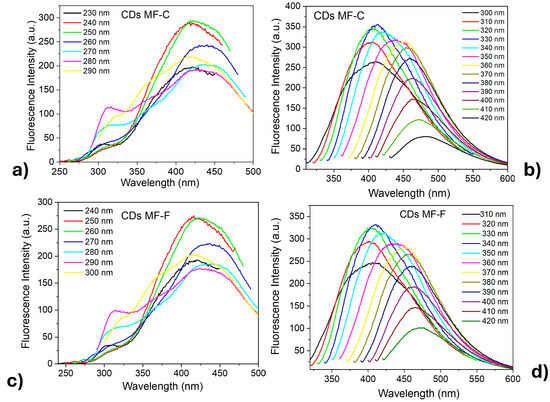
Figure 8.
Fluorescence emission spectra of CDs-MF aqueous suspensions at different excitation wavelengths. (a,b) correspond to CDs-MF-C in the 230–290 nm and 300–420 nm excitation, respectively; (c,d) correspond to CDs-MF-F in the same regions of excitation. Both CDs were (excitation/emission window 5/10).
The fluorescence lifetime (τ) obtained from TCSPC measurements was investigated to determine the energy states of the CDs. In Table 1, the τ values showed triexponential decay and a higher average lifetime (τAVE) for CDs-MF-C compared to CDs-MW. The long-lifetime excited states for CDs-MF are directly associated with molecular emissive states [67]. Based on the fluorescence quantum yield (ΦF) and lifetime values (τ), the radiative rate constants (kR) and nonradiative rate constant (kNR) were calculated using Equations (2) and (3) [13,68], respectively.
kR = ΦF/⟨τ⟩
kNR = (1 − ΦF)/⟨τ⟩

Table 1.
Fluorescence lifetime for CDs-MF and CDs-MW in aqueous solution at 298 K.
The order of magnitude of kNR for CDs-MW was 10 times higher than for CDs-MF. The lower non-radiative rate constant for CDs-MF can be justified in CDs by efficient recombination. Where the recombination processes are suggested by the strong coupling of the excited core states with the surface state [68]
The fluorescent spectra were recorded under excitation at 250 nm and 320 nm across different pH values to better understand the pH-dependent phenomenon in CDs-MF and CDs-MW. pH modification plays a crucial role in modulating the emission wavelength and intensity of CDs due to the presence of various functional groups on their surface [69,70,71]. Liu et al. reported that the most widely accepted mechanism for the pH-dependent changes in CDs involves the protonation and deprotonation of surface functional groups bearing electron-donating or -withdrawing capabilities. These processes can alter the electronic energy levels, thereby affecting the fluorescent intensity and, in some cases, the emission wavelength [72].
CDs-MF and CDs-MW have various surface functional groups, including carboxyl and amine; they are sensitive to changing pH environments. pH-dependent fluorescence is presented for CDs-MF-C, CDs-MF-F, and CDs-MW at pH 2–12 under excitation at 250 nm and 320 nm. As shown in Figure 9a–c, fluorescence increased from acidic to basic media.
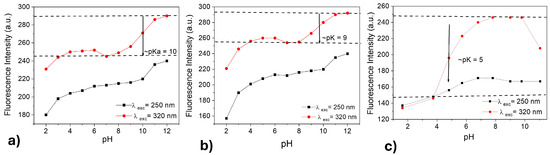
Figure 9.
Fluorescence emission intensity vs. pH plots for CDs-MF-C (a), CDs-MF-F (b), and CDs-MW (c). Under λexc = 250 nm and (b) λexc = 320 nm and excitation/emission window 5/10.
CDs-MW exhibited a distinct trend of increased fluorescence intensity from acidic to basic media (Figure 9c), in comparison to CDs-MF (Figure 9a,b), indicating a higher sensitivity to pH variations. This behavior may be attributed to the abundance of carboxylic groups (NH2-R-COO−) on the surface of CDs-MW, which are more prone to protonation and deprotonation compared to the amino groups (NH3+R-COO−) predominant in CDs-MF. As discussed by Abu et al. [73] and Wang et al. [74], carboxyl groups ionize more readily in alkaline media (pKa in the range 4–5), making them more sensitive to changes in pH. The phenolate group OH (pKa in the range 8–10) and NH2 group (pKa in the range 9.5–11) [69,75].
The prototropic transformation of CDs-MF and CDs-MW is readily identified by following the pH-dependent fluorescence emission at a selected wavelength. Figure 9a,b show one minimum that corresponds to the isoelectric point pH = 7. From the inflection point of the sigmoidal curve, the pKa values for the prototropic equilibria of CDs-MF-C, CDs-MF-F, and CDs-MW are determined to be 10, 9, and 5, respectively. pH 7 was selected as the working condition for subsequent TMX sensing experiments, considering that at this pH all CDs in this work present higher fluorescence intensity. Based on Figure 9, it is expected that the CDs-MF in pH = 7 are in neutral form, while the CDs-MW are in deprotonated form. In addition, it represents a neutral environment and avoids potential hydrolysis of the TMX molecule under more acidic or basic conditions [76,77].
The pH-induced effects are also reflected in the fluorescence emission spectra of CDs-MF-C, CDs-MF-F, and CDs-MW (Figure S5, Supplementary Material). The fluorescence spectra (Figure S5a–c) have been obtained by exciting samples at 250 nm, where the change in absorbance with pH is not. It is observed that the emission intensities of CD gradually increase with an increase in the basicity. The solution up to pH 9 shows a decrease, followed by an increase again at higher pH for CDs-MW, along with a significant blue (430 nm → 416 nm) shift in the emission spectra. At 320 nm, both CDs-MF-C and CDs-MF-F observed the emission intensities gradually increase with an increase in the pH. However, for CDs-MW, the solution up to pH 7 shows a decrease again at higher pH, and after a red shift occurs until pH 12. Pal et al. proposed that the blue or red shift in the fluorescence emission during the pH studies can be associated with the formation of new species in the medium that absorb and emit at longer or shorter wavelengths [69].
3.3. Fluorescent Sensing of TMX in Solution CDs
Figure 10a–c shows the fluorescence intensity response of both CDs-MF and CDs-MW (λexc = 250 nm) upon the addition of thiamethoxam (TMX). The experiments were conducted at a pH = 7 and an incubation time of 5 min after each addition of TMX. A gradual fluorescence quenching was observed with increasing TMX concentrations (0.133, 0.267, 0.400, 0.533, 0.667, 0.800, 0.933, 1.067, 1.200, 1.333, 2.000, 2.667, 3.333, 4.000, 4.667, 5.333, 6.000, 6.667 ppm). Concurrently, as shown in Figure 10d–f, an increase in absorbance at 250 nm was observed upon the addition of TMX.
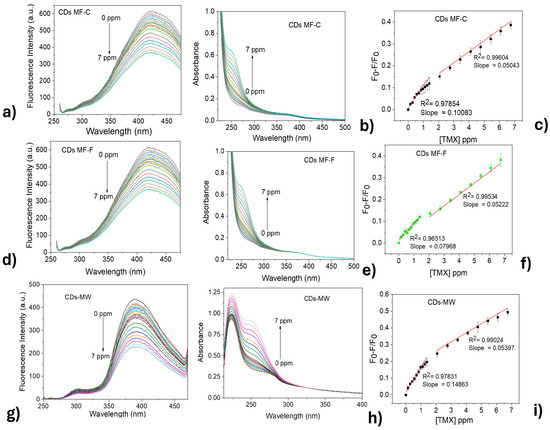
Figure 10.
Fluorescence emissions of CDs upon addition of TMX: (a) CDs-MF-C, (b) CDs-MF-F, and (c) CDs-MW. (d–f) UV–Vis. absorption spectra of the same CDs, respectively, after TMX addition. (g–i) Graph the TMX concentration vs. (F0 − F)/F0 for each corresponding sample.
To obtain additional analytical parameters, a linear relationship between the fluorescence quenching ratio (F0 − F/F0) and the concentration of TMX was established for all CDs, as shown in the images in Figure 10g–i. Both CDs showed a better linear relationship at higher TMX concentration ranges (from 2.069 to 6.740 ppm), with correlation coefficients of 0.99604 and 0.99534 for CDs-MF-C and CDs-MF-F, respectively. While CDs-MW exhibited a correlation coefficient of 0.99024.
Our results agree with the study by Rishabh et al., who synthesized CDs using a household microwave and Citrus sinensis as the carbon source. In their work, the authors also reported good linearity for TMX detection at 50 ppm [78].
The limit of detection (LOD) and the limit of quantification (LOQ) are essential analytical parameters used to evaluate the sensitivity of a sensing system. LOD The LOD represents the lowest analyte concentration that can be detected with a certain level of certainty [79]. At the same time, the LOQ corresponds to the lowest concentration that can be quantitatively determined with acceptable precision and accuracy [80]. The results are summarized in Table 2.
Table 2.
LOD and LOQ values of the CDs studied, determined at two distinct TMX concentration ranges.
Piecewise regression was used in comparison to linear regression since it fits a separate line through each one (Figure S6, Supplementary Material) [81]. Using the Piecewise equation, the LOD values were found to be 0.048, 0.066, and 0.45 ppm for CDs-MF-C, CDs-MF-F, and CDs-MW, respectively. The LOQ values for CDs-MF-C, CDs-MF-F, and CDs-MW were 0.16, 0.22, and 1.5 ppm. Using the segmented regression for the analytical curves involving CDs-MF-C and CDs-MF-F guaranteed better LOD and LOQ values compared to linear regression. For CDs-MW, no difference was observed in the LOD and LOQ values in the mathematical treatment for obtaining the analytical curves.
It was observed that, despite morphological and structural differences among the CDs, they exhibited similar behavior when interacting with TMX, leading to a decrease in fluorescence intensity. However, it is notable that the analytical parameters obtained for each type of CD showed some differences. Comparatively, it is noteworthy that the LOD results for carbon dots obtained in this work through fluorescence detection are similar to those in the literature (Table S1, Supplementary Material).
It was observed that, despite morphological and structural differences among the CDs, they exhibited similar behavior when interacting with TMX, leading to a decrease in fluorescence intensity. At lower concentrations, where TMX was added in 2 µL (0–1.384 ppm) increments, all CDs exhibited moderate linearity and similar LOD and LOQ values. In contrast, at higher concentrations, with 10 µL (2.069–6.740 ppm) additions of TMX, the CDs presented good linearity, with correlation coefficients close to 1.
At higher concentrations, the LOD and LOQ values varied significantly among the samples, with CDs-MW showing the highest values, followed by CDs-MF-F, and the lowest values observed for CDs-MF-C. Interestingly, although CDs-MF-C have larger particle sizes, they showed the best analytical performance for TMX detection, achieving the lowest LOD and LOQ values among all samples. This suggests that nanoparticle size alone is not the determining factor for detection limits, as also noted in [82]
A possible explanation for this behavior lies in the surface chemistry of the CDs. While CDs-MW are mainly functionalized with carboxylic acid groups (–COOH), the CDs-MF samples—especially CDs-MF-C—are richer in nitrogen-containing groups such as amines (–NH2); as indicated by the IFTR-ATR results. These differences in surface functional groups can significantly affect the interaction with TMX, a neonicotinoid pesticide that contains several electronegative atoms (for example, nitrogen and oxygen) [78]. Nitrogen-rich surfaces may favor stronger binding with TMX through hydrogen bonding and electrostatic interactions, leading to more efficient fluorescence quenching and, consequently, lower LOD and LOQ values. Supporting this, zeta potential measurements showed a more pronounced decrease in surface charge upon TMX addition for CDs-MF: from −7.46 mV (CDs-MF-F) to −5.97 mV (CDs-MF-F + TMX) and from −4.70 mV (CDs-MF-C) to −8.41 mV (CDs-MF-C + TMX), indicating changes in stability and surface interactions upon pesticide addition.
The selectivity of the CDs (Figure S7, Supplementary Material) toward different pesticides was evaluated by analyzing the fluorescence quenching behavior in the presence of TMX and other commonly used pesticides in the same concentration (2.069 ppm). It was observed that the presence of IMI, ACE, and CBZ in the solution had a minimal effect on fluorescence intensity. Similarly, ATRZ and ACP did not induce significant quenching, indicating that the CDs exhibit high selectivity toward TMX under the tested conditions.
3.4. Fluorescence Quenching Mechanism of CDs by TMX
The mechanism of fluorescence quenching reported in the literature includes static quenching, dynamic quenching, energy transfer, the inner filter effect (IFE), photo-induced electron transfer (PET), and fluorescence resonance energy transfer (FRET) [83].
In Figure 11a, the absorption spectrum of TMX shows a significant overlap with the excitation spectrum of the CDs. This suggests that the fluorescence quenching observed may be attributed to the inner filter effect (IFE) [84,85]. To further support this hypothesis, two control experiments were conducted. First, water was added instead of TMX, and the CDs were excited at 250 nm (Figure 11b). Second, TMX was added to the CDs while excitation was performed at 320 nm (Figure 11c). In both cases, no noticeable fluorescence quenching was observed, reinforcing the idea that the quenching mechanism is likely due to IFE.
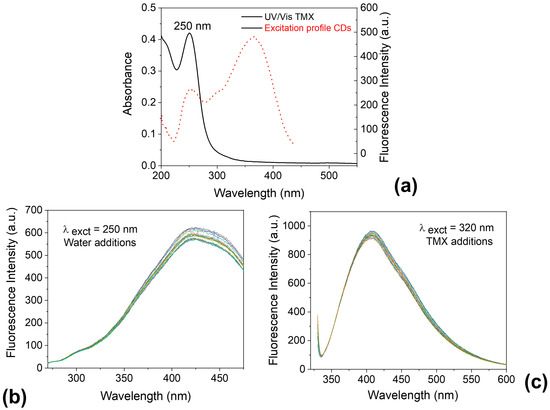
Figure 11.
(a) Overlapped UV/Vis absorption spectrum of thiamethoxam (TMX) and excitation profile of carbon dots (CDs); (b) Fluorescence emission of CDs excited at 250 nm with successive additions of water (control) at the same concentrations used for TMX; (c) Fluorescence emission of CDs in the presence of increasing concentrations of TMX, excited at 320 nm.
In addition, the Parker equation 4 can further investigate the IFE process [86]
Fobs = fluorescence intensity; Fcor = corrected fluorescence intensity; Aex = absorbance at the λex = 250 nm and Aem = absorbance at the λem = 420 nm; s = thickness of excitation beam (0.10 cm); g = distance between the edge of the excitation beam and the cuvette (0.40 cm); and d = width of the cuvette (1.00 cm).
To confirm the contribution of the IFE, the suppression efficiency (%E = 1 − F/F0) was calculated before applying the Parker equation using the corrected fluorescence values [86].
Figure 12 clearly demonstrates that the observed quenching effect primarily originates from the IFE caused by TMX, which absorbs the excitation wavelength of the CDs. After correcting for the IFE, almost no fluorescence quenching was observed in the linear concentration range. Therefore, it can be concluded that nearly all the quenching effect arises from the inner filter effect of TMX.
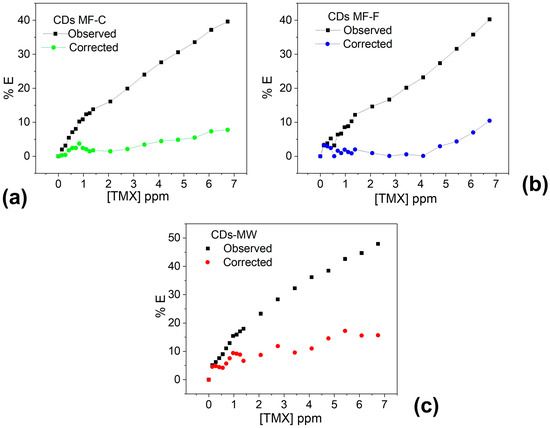
Figure 12.
Suppression efficiency (E%) of observed and corrected measurements for CDs-MF-C (a), CDs-MF-F (b), and CDs-MW (c) after each addition of TMX.
The fluorescence lifetime of CDs in the presence of TMX remained constant at 298 K (Table S2, Supplementary Material) when compared with values in Table 1 in Section 3.2, only for the CDs. We conclude that, in static quenching, the presence of TMX leads to the formation of a non-fluorescent ground-state complex with CD-MF, which reduces fluorescence without altering the excited state dynamics [87,88].
3.5. Fluorescence Microscopy of CDs on Onion Epidermal Cells
Considering that there were no significant changes in the sensing of the pesticide TMX, this study was conducted with CDs-MF-F, which presented the highest fluorescence quantum yield. Onion epidermal cells were used to demonstrate the ability of the gelatin CDs to stain plant cells and sense TMX pesticide in vegetative models [89].
In fluorescence microscopy images of onion epidermis, no fluorescence signal was observed in the control onion cells (Figure 13A1–A4), confirming the absence of natural autofluorescence under the excitation conditions used (blue, green, and yellow). In contrast, Figure 13B1–B4 shows that after incubation with CDs-MF-F, strong fluorescence emission was observed in the onion epidermis cells under all excitation using UV (300–400 nm), green (507–510 nm), and yellow (550–580 nm) filters, demonstrating the efficient fluorescence behavior of the gelatin carbon dots in this vegetative model.
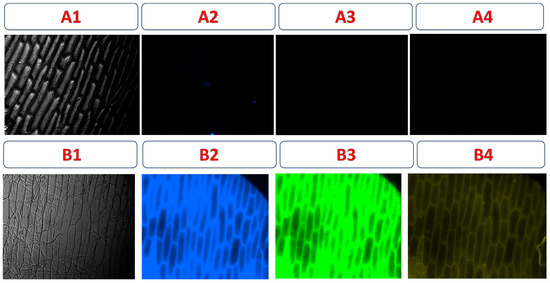
Figure 13.
Fluorescence images of onion epidermal cells. Control samples without CD-MF (A1–A4) and incubated with an aqueous solution containing 20 mg mL−1 of CDs-MF (B1–B4). Images were acquired using a fluorescence microscope at 20× magnification. Exposure times: Bright field (6 s), UV (6 s), green (30 s), and yellow (30 s) excitation.
After the addition of the pesticide, a significant fluorescence quenching was observed in the samples previously treated with CDs-MF-F) (Figure 14B1,C1), suggesting the interaction between the carbon dots and TMX. These results support the potential application of CDs-MF as fluorescence-based sensors for TMX detection. These results are in line with those previously published, supporting the reliability of our observations [42,89,90]. The histogram shifts towards the left show a decreasing mean fluorescence intensity after TMX addition.
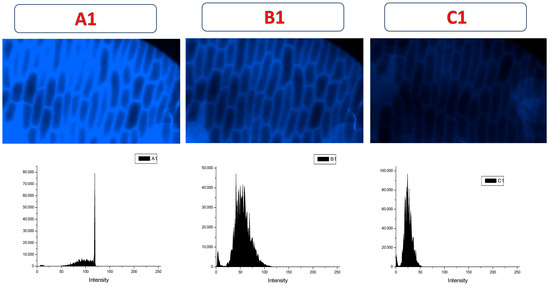
Figure 14.
Fluorescence images and representative histogram of onion epidermal cells incubated with an aqueous solution containing 20 mg mL−1 of CDs-MF-F (A1) and in presence of TMX (B1,C1). Images were acquired using a fluorescence microscope at 20× magnification. Exposure times: UV excitation (6 s) (A1,B1) and UV (2 s) (C1).
4. Conclusions
The purification method significantly influences the removal of aggregates and unreacted precursors. Ultracentrifugation (CDs-MF-C) tends to retain larger particles and aggregates, which explains the broader size distribution and slightly reduced fluorescence compared to syringe filtration (CDs-MF-F). Dialysis, although effective, resulted in the smallest particle sizes but also the lowest quantum yield, likely due to incomplete passivation or reduced nitrogen content. In the TMX pesticide sensing studies, the inner filter mechanism was similar across all CDs, independent of the synthesis or purification method employed. However, when analyzing the analytical parameter LOD, the lowest values were obtained for CDs-MF-C and CDs-MW (0.115 ppm), in relation to CDs-MF-F (0.146 ppm). The fluorescence quenching mechanistic comprehension can help the sensor optimization and generalization across different pesticide types. Furthermore, the studies demonstrated potential translation of these gelatin carbon dots into real-world applications, such as portable devices.
Supplementary Materials
The following supporting information can be downloaded at: https://www.mdpi.com/article/10.3390/chemosensors13090326/s1, Figure S1. Images of the obtained CDs after the synthesis process: (a) CDs-MF and (b) CDs-MW. Figure S2. Zeta potential of CDs-MF-C (a) and (b) CDs-MF-F in aqueous suspension at 25 °C. Figure S3. Thermogravimetric analysis of aqueous suspensions of CDs-MF. Figure S4. Integrated fluorescence intensity vs. absorbance of the CDs-MF-C (a) and CDs-MF-F (b). Figure S5. Fluorescence emission spectra vs. pH plots for CDs-MF-C, CDs-MF-F, and CDs-MW (a–c). Under λexc = 250 nm and CDs-MF-C, CDs-MF-F, and CDs-MW (d–f). (b) λexc = 320 nm and excitation/emission window 5/10. Figure S6. TMX concentration vs. (F0 − F)/F0 for CDs-MF-C (a), CDs-MF-F (b), and CDs-MW (c) using the Piecewise regression. Figure S7. Ratio of the fluorescence intensity (F0 − F/F0) of the CDs-MF solutions containing different pesticides. Table S1. Comparison of the analytical performances of the reported methods for TMX determination [78,91,92,93,94,95,96,97]. Table S2. Fluorescence lifetime parameters of CDs-MF in the presence of TMX in aqueous solution at 298 K. The concentration of TMX added was 6.740 ppm.
Author Contributions
M.M.C.: Investigation, Validation, Writing—original draft preparation. R.G.d.L.: Conceptualization, Resources, Writing—Review and Editing, Supervision. All authors have read and agreed to the published version of the manuscript.
Funding
This research received no external funding.
Institutional Review Board Statement
Not applicable.
Informed Consent Statement
Not applicable.
Data Availability Statement
The data shown in this article are available upon request from the corresponding author.
Acknowledgments
Coordenação de Aperfeiçoamento de Pessoal de Nível Superior—Brasil (CAPES)—Finance Code 001 for M.M.C. PhD scholarship. The authors also acknowledge Adriano Batista da Costa (Physical Department–FFCLRP-USP) for the time-resolved fluorescence facilities. The authors also acknowledge Felipe Haddad (FMRP) and Matheus Torelli Martin (FCFRP) for support in the Python program to obtain the Piecewise regression data. RELAM-UFU for equipment support and PROEX-CAPES.
Conflicts of Interest
The authors declare no conflicts of interest.
References
- Xu, X.; Ray, R.; Gu, Y.; Ploehn, H.J.; Gearheart, L.; Raker, K.; Scrivens, W.A. Electrophoretic Analysis and Purification of Fluorescent Single-Walled Carbon Nanotube Fragments. J. Am. Chem. Soc. 2004, 126, 12736–12737. [Google Scholar] [CrossRef] [PubMed]
- Rooj, B.; Mandal, U. A Review on Characterization of Carbon Quantum Dots. Vietnam J. Chem. 2023, 61, 693–718. [Google Scholar] [CrossRef]
- Das, S.; Mondal, S.; Ghosh, D. Carbon Quantum Dots in Bioimaging and Biomedicines. Front. Bioeng. Biotechnol. 2023, 11, 1333752. [Google Scholar] [CrossRef]
- Yu, J.; Sun, X. Nitrogen-Doped Carbon Dots as Acid-Base Bifunctional and Efficient Catalysts for the Cycloaddition of CO2 with Epoxides. New J. Chem. 2024, 48, 4245–4252. [Google Scholar] [CrossRef]
- Ding, Y.; Li, X.; Zheng, Z.; Chen, M.; Zhang, Y.; Liu, Z.; Wang, F.; Guan, L. Preparation and Luminescent Modulation of Yellow Carbon Dots for Electroluminescent Device. J. Lumin. 2022, 249, 119036. [Google Scholar] [CrossRef]
- Singh, A.; Qu, Z.; Sharma, A.; Singh, M.; Tse, B.; Ostrikov, K.; Popat, A.; Sonar, P.; Kumeria, T. Ultra-Bright Green Carbon Dots with Excitation-Independent Fluorescence for Bioimaging. J. Nanostruct. Chem. 2023, 13, 377–387. [Google Scholar] [CrossRef]
- Li, M.; Chen, T.; Gooding, J.J.; Liu, J. Review of Carbon and Graphene Quantum Dots for Sensing. ACS Sens. 2019, 4, 1732–1748. [Google Scholar] [CrossRef]
- Fan, J.; Kang, L.; Cheng, X.; Liu, D.; Zhang, S. Biomass-Derived Carbon Dots and Their Sensing Applications. Nanomaterials 2022, 12, 4473. [Google Scholar] [CrossRef]
- Zhang, X.; Liao, X.; Hou, Y.; Jia, B.; Fu, L.; Jia, M.; Zhou, L.; Lu, J.; Kong, W. Recent Advances in Synthesis and Modification of Carbon Dots for Optical Sensing of Pesticides. J. Hazard. Mater. 2022, 422, 126881. [Google Scholar] [CrossRef]
- Preeti Nitin Joshi; Martin Khristi Synthesis of Carbon Dots from Leaf of Cynodon Dactylon (Grass). World J. Adv. Res. Rev. 2023, 17, 23–29. [CrossRef]
- Ochoa, D.; Torres, J.G.; Cervantes, E.M.; Cavazos, J.L.; Gómez, I. The Effect of Sonication on the Photoluminescence Property of Carbon Quantum Dots Synthesized by Hydrothermal Route. Dig. J. Nanomater. Biostruct 2024, 19, 319–325. [Google Scholar] [CrossRef]
- Han, L.; Guo, Y.; Zhang, H.; Wang, Z.; Zhang, F.; Wang, Y.; Li, X.; Wang, Y.; Ye, J. Preparation of Carbon Quantum Dot Fluorescent Probe from Waste Fruit Peel and Its Use for the Detection of Dopamine. RSC Adv. 2024, 14, 12345–12352. [Google Scholar] [CrossRef]
- Caetano, M.M.; Becceneri, A.B.; Ferreira, M.V.; Assunção, R.M.N.; da Silva, R.S.; de Lima, R.G. Carbonized Polymer Dots: Influence of the Carbon Nanoparticle Structure on Cell Biocompatibility. ACS Omega 2024, 9, 38864–38877. [Google Scholar] [CrossRef]
- Rai, D.; Jaiswal, Y.; Sinha, S. Graphene Quantum Dots Synthesis Using Waste Unburnt Carbon: Implications for Optoelectronics. Appl. Surf. Sci. 2024, 653, 159386. [Google Scholar] [CrossRef]
- Silva, L.F.; Caetano, M.M.; de Lima, R.G. Simple and Cheap Preparation of Fluorescence Paper Sensor Based in Carbon Dot for Visual Detection of Chloramphenicol. Luminescence 2023, 38, 1319–1329. [Google Scholar] [CrossRef] [PubMed]
- Modi, P.D.; Mehta, V.N.; Prajapati, V.S.; Patel, S.; Rohit, J.V. Bottom-up Approaches for the Preparation of Carbon Dots. In Carbon Dots in Analytical Chemistry: Detection and Imaging; Elsevier: Amsterdam, The Netherlands, 2023; pp. 15–29. [Google Scholar] [CrossRef]
- Palacio-Vergara, M.; Álvarez-Gómez, M.; Gallego, J.; López, D. Biomass Solvothermal Treatment Methodologies to Obtain Carbon Quantum Dots: A Systematic Review. Talanta Open 2023, 8, 100244. [Google Scholar] [CrossRef]
- De Medeiros, T.V.; Manioudakis, J.; Noun, F.; Macairan, J.R.; Victoria, F.; Naccache, R. Microwave-Assisted Synthesis of Carbon Dots and Their Applications. J. Mater. Chem. C Mater. 2019, 7, 12345–12352. [Google Scholar] [CrossRef]
- Ozyurt, D.; Kobaisi, M.A.; Hocking, R.K.; Fox, B. Properties, Synthesis, and Applications of Carbon Dots: A Review. Carbon Trends 2023, 12, 100276. [Google Scholar] [CrossRef]
- Zhao, X.X.; Tao, S.Y.; Yang, B. The Classification of Carbon Dots and the Relationship between Synthesis Methods and Properties. Chin. J. Chem. 2023, 41, 1234–1245. [Google Scholar] [CrossRef]
- Rasal, A.S.; Subrahmanya, T.M.; Kizhepat, S.; Getachew, G.; Ghule, A.V.; Devan, R.S.; Hung, W.S.; Fahmi, M.Z.; Wibrianto, A.; Chang, J.Y. Carbon Quantum Dots: Classification-Structure-Property-Application Relationship for Biomedical and Environment Remediation. Coord. Chem. Rev. 2025, 533, 216510. [Google Scholar] [CrossRef]
- Liu, J.; Li, R.; Yang, B. Carbon Dots: A New Type of Carbon-Based Nanomaterial with Wide Applications. ACS Cent. Sci. 2020, 6, 2179–2195. [Google Scholar] [CrossRef] [PubMed]
- Crista, D.M.A.; da Silva, J.C.G.E.; da Silva, L.P. Evaluation of Different Bottom-up Routes for the Fabrication of Carbon Dots. Nanomaterials 2020, 10, 1316. [Google Scholar] [CrossRef]
- Ullal, N.; Muthamma, K.; Sunil, D. Carbon Dots from Eco-Friendly Precursors for Optical Sensing Application: An up-to-Date Review. Chem. Pap. 2022, 76, 6097–6127. [Google Scholar] [CrossRef]
- Wang, X.; Lv, Y.; Kong, X.; Ding, Z.; Cheng, X.; Liu, Z.; Han, G.C. A Fluorescence Visual Detection for Glyphosine Based on a Biomass Carbon Quantum Dot Paper-Based Sensor. New J. Chem. 2023, 47, 11827–11847. [Google Scholar] [CrossRef]
- Sinha, N.; Ray, S. Application of Carbon Quantum Dots Derived from Waste Tea for the Detection of Pesticides in Tea: A Novel Biosensor Approach. ACS Omega 2024, 9, 50201–50213. [Google Scholar] [CrossRef]
- Khairol Anuar, N.K.; Tan, H.L.; Lim, Y.P.; So’aib, M.S.; Abu Bakar, N.F. A Review on Multifunctional Carbon-Dots Synthesized From Biomass Waste: Design/ Fabrication, Characterization and Applications. Front. Energy Res. 2021, 9, 626549. [Google Scholar] [CrossRef]
- Han, Y.; Liccardo, L.; Moretti, E.; Zhao, H.; Vomiero, A. Synthesis, Optical Properties and Applications of Red/near-Infrared Carbon Dots. J. Mater. Chem. C Mater. 2022, 10, 11827–11847. [Google Scholar] [CrossRef]
- Zhou, Y.; Sharma, S.K.; Peng, Z.; Leblanc, R.M. Polymers in Carbon Dots: A Review. Polymers 2017, 9, 67. [Google Scholar] [CrossRef] [PubMed]
- Zheng, C.; Tao, S.; Yang, B. The Current Progress and Challenges of Carbonized Polymer Dot-Based Room-Temperature Phosphorescent Materials. CCS Chem. 2024, 6, 100–118. [Google Scholar] [CrossRef]
- Ullal, N.; Mehta, R.; Sunil, D. Separation and Purification of Fluorescent Carbon Dots—An Unmet Challenge. Analyst 2024, 149, 1680–1700. [Google Scholar] [CrossRef]
- Bartolomei, B.; Prato, M. The Importance of the Purification Step and the Characterization of the Products in the Synthesis of Carbon Nanodots. Small 2023, 19, 2206714. [Google Scholar] [CrossRef]
- Gonzalez-Vera, A.S.; Pineda-Arellano, C.A.; Ramírez-Monroy, A.; Matos, J.; Chazaro-Ruiz, L.F.; Rangel-Mendez, J.R.; Ania, C.O. Influence of the Sequential Purification of Biomass-Derived Carbon Dots on Their Colloidal and Optical Properties. Carbon Trends 2025, 19, 100460. [Google Scholar] [CrossRef]
- Stachowska, J.D.; Murphy, A.; Mellor, C.; Fernandes, D.; Gibbons, E.N.; Krysmann, M.J.; Kelarakis, A.; Burgaz, E.; Moore, J.; Yeates, S.G. A Rich Gallery of Carbon Dots Based Photoluminescent Suspensions and Powders Derived by Citric Acid/Urea. Sci. Rep. 2021, 11, 89984. [Google Scholar] [CrossRef]
- Qamar, W.; Shahid, M.U.; Irfan, M.; Abbas, R.Z.; Faraz, A.; Hussain, R.; Alvi, M.A. Thiamethoxam Toxicity: A Review in One-Health Perspective. Kafkas Univ. Vet. Fak. Derg. 2023, 29, 557–570. [Google Scholar] [CrossRef]
- Liang, Q.; Ma, W.; Shi, Y.; Li, Z.; Yang, X. Easy Synthesis of Highly Fluorescent Carbon Quantum Dots from Gelatin and Their Luminescent Properties and Applications. Carbon 2013, 60, 421–428. [Google Scholar] [CrossRef]
- Amjad, M.; Iqbal, M.; Faisal, A.; Junjua, A.M.; Hussain, I.; Hussain, S.Z.; Ghramh, H.A.; Khan, K.A.; Janjua, H.A. Hydrothermal Synthesis of Carbon Nanodots from Bovine Gelatin and PHM3 Microalgae Strain for Anticancer and Bioimaging Applications. Nanoscale Adv. 2019, 1, 3456–3465. [Google Scholar] [CrossRef] [PubMed]
- Asil, S.M.; Narayan, M. Surface Interactions of Gelatin-Sourced Carbon Quantum Dots with a Model Globular Protein: Insights into Carbon-Based Nanomaterials and Biological Systems. Nanoscale Adv. 2024, 7, 1104–1117. [Google Scholar] [CrossRef]
- Astolfi, B.S.; Bessas, N.C.; Graminha, A.E.; Becceneri, A.B.; da Silva, R.S.; de Lima, R.G. Gelatin Carbon Dots Interaction with Nitrosyl Ruthenium Complex: Fluorescence Quenching and Chemiluminescence Mechanisms. J. Fluoresc. 2024, 34, 2881–2893. [Google Scholar] [CrossRef]
- Omary, M.A.; Patterson, H.H. Luminescence, Theory. In Encyclopedia of Spectroscopy and Spectrometry, 3rd ed.; Elsevier: Amsterdam, The Netherlands, 2017; pp. 636–653. [Google Scholar] [CrossRef]
- Souri, E.; Kaboodari, A.; Adib, N.; Amanlou, M. A New Extractive Spectrophotometric Method for Determination of Rizatriptan Dosage Forms Using Bromocresol Green. DARU J. Pharm. Sci. 2013, 21, 12. [Google Scholar] [CrossRef]
- Liao, J.; Hu, Z.; Zhang, W.; Zhang, Y.; Xiao, J.; Lei, S. Characteristics of Peanut Protein-Derived Carbon Dots and Their Application in Cell Imaging and Sensing of Metronidazole. Chemosensors 2025, 13, 151. [Google Scholar] [CrossRef]
- Yang, N.; Shao, R.; Zhang, Z.; Dou, M.; Niu, J.; Wang, F. Gelatin-Derived Carbon: Carbonization Mechanism and Application in K-Ion Storage. Carbon 2021, 178, 49–61. [Google Scholar] [CrossRef]
- Wang, T.Y.; Chen, C.Y.; Wang, C.M.; Tan, Y.Z.; Liao, W.S. Multicolor Functional Carbon Dots via One-Step Refluxing Synthesis. ACS Sens. 2017, 2, 1374–1381. [Google Scholar] [CrossRef]
- Jusuf, B.N.; Sambudi, N.S.; Isnaeni, I.; Samsuri, S. Microwave-Assisted Synthesis of Carbon Dots from Eggshell Membrane Ashes by Using Sodium Hydroxide and Their Usage for Degradation of Methylene Blue. J. Environ. Chem. Eng. 2018, 6, 5293–5302. [Google Scholar] [CrossRef]
- Bian, Z.; Gomez, E.; Gruebele, M.; Levine, B.G.; Link, S.; Mehmood, A.; Nie, S. Bottom-up Carbon Dots: Purification, Single-Particle Dynamics, and Electronic Structure. Chem. Sci. 2025, 16, 4195–4212. [Google Scholar] [CrossRef]
- Zhou, S.; Sui, Y.; Zhu, X.; Sun, X.; Zhuo, S.; Li, H. Study and Comparison on Purification Methods of Multicolor Emission Carbon Dots. Chem. Asian J. 2021, 16, 348–354. [Google Scholar] [CrossRef]
- Fernández-Merino, Á.; Chávez, M.; Sánchez-Obrero, G.; Madueño, R.; Blázquez, M.; Del Caño, R.; Pineda, T. Fluorescent Carbon Dots with Red Emission: A Selective Sensor for Fe(III) Ion Detection. Chemosensors 2024, 12, 226. [Google Scholar] [CrossRef]
- Lakshmi Devi, A.; Sreelakshmi, M.; Suneesh, P.V.; Satheesh Babu, T.G. Copper and Nickel Doped Carbon Dots for Rapid and Sensitive Fluorescent Turn-off Detection of Bilirubin. Sci. Rep. 2025, 15, 1524. [Google Scholar] [CrossRef] [PubMed]
- Bigi, A.; Panzavolta, S.; Rubini, K. Relationship between Triple-Helix Content and Mechanical Properties of Gelatin Films. Biomaterials 2004, 25, 5675–5680. [Google Scholar] [CrossRef] [PubMed]
- Liu, F.; Majeed, H.; Antoniou, J.; Li, Y.; Ma, Y.; Yokoyama, W.; Ma, J.; Zhong, F. Tailoring Physical Properties of Transglutaminase-Modified Gelatin Films by Varying Drying Temperature. Food Hydrocoll. 2016, 58, 34–42. [Google Scholar] [CrossRef]
- Mintz, K.J.; Bartoli, M.; Rovere, M.; Zhou, Y.; Hettiarachchi, S.D.; Paudyal, S.; Chen, J.; Domena, J.B.; Liyanage, P.Y.; Sampson, R.; et al. A Deep Investigation into the Structure of Carbon Dots. Carbon 2021, 173, 83–98. [Google Scholar] [CrossRef]
- Mohammed, S.J.; Omer, K.M.; Hawaiz, F.E. Deep Insights to Explain the Mechanism of Carbon Dot Formation at Various Reaction Times Using the Hydrothermal Technique: FT-IR, 13C-NMR, 1H-NMR, and UV-Visible Spectroscopic Approaches. RSC Adv. 2023, 13, 10521–10534. [Google Scholar] [CrossRef]
- Rimal, V.; Srivastava, P.K. Review on Thermogravimetric Analysis of Carbon Dots. Proc. Natl. Acad. Sci. India Sect. A—Phys. Sci. 2024, 94, 563–570. [Google Scholar] [CrossRef]
- Sharma, N.; Sharma, I.; Bera, M.K. Microwave-Assisted Green Synthesis of Carbon Quantum Dots Derived from Calotropis Gigantea as a Fluorescent Probe for Bioimaging. J. Fluoresc. 2022, 32, 923–933. [Google Scholar] [CrossRef] [PubMed]
- Wei, S.; Yin, X.; Li, H.; Du, X.; Zhang, L.; Yang, Q.; Yang, R. Multi-Color Fluorescent Carbon Dots: Graphitized Sp2 Conjugated Domains and Surface State Energy Level Co-Modulate Band Gap Rather Than Size Effects. Chem.—Eur. J. 2020, 26, 13285–13295. [Google Scholar] [CrossRef] [PubMed]
- Das, A.; Kundelev, E.V.; Vedernikova, A.A.; Cherevkov, S.A.; Danilov, D.V.; Koroleva, A.V.; Zhizhin, E.V.; Tsypkin, A.N.; Litvin, A.P.; Baranov, A.V.; et al. Revealing the Nature of Optical Activity in Carbon Dots Produced from Different Chiral Precursor Molecules. Light Sci. Appl. 2022, 11, 278. [Google Scholar] [CrossRef] [PubMed]
- Javed, N.; O’Carroll, D.M. Long-Term Effects of Impurities on the Particle Size and Optical Emission of Carbon Dots. Nanoscale Adv. 2021, 3, 1987–1997. [Google Scholar] [CrossRef]
- Singaravelu, C.M.; Deschanels, X.; Rey, C.; Causse, J. Investigation on Fluorescence Origin and Spectral Heterogeneity in Carbon Dots: A Dynamic Perspective. ChemPhotoChem 2024, 8, 412–422. [Google Scholar] [CrossRef]
- Yang, H.L.; Bai, L.F.; Geng, Z.R.; Chen, H.; Xu, L.T.; Xie, Y.C.; Wang, D.J.; Gu, H.W.; Wang, X.M. Carbon Quantum Dots: Preparation, Optical Properties, and Biomedical Applications. Mater. Today Adv. 2023, 18, 100376. [Google Scholar] [CrossRef]
- Shamsipur, M.; Barati, A.; Taherpour, A.A.; Jamshidi, M. Resolving the Multiple Emission Centers in Carbon Dots: From Fluorophore Molecular States to Aromatic Domain States and Carbon-Core States. J. Phys. Chem. Lett. 2018, 9, 7255–7260. [Google Scholar] [CrossRef]
- Dimitriev, O.; Kysil, D.; Zaderko, A.; Isaieva, O.; Vasin, A.; Piryatinski, Y.; Fahlman, M.; Nazarov, A. Photoluminescence Quantum Yield of Carbon Dots: Emission Due to Multiple Centers versus Excitonic Emission. Nanoscale Adv. 2024, 6, 2185–2197. [Google Scholar] [CrossRef]
- Mohandoss, S.; Ahmad, N.; Velu, K.S.; Khan, M.R.; Palanisamy, S.; You, S.G.; Lee, Y.R. Synthesis of Photoluminescent Carbon Dots Using Hibiscus Tea Waste and Heteroatom Doping for Multi-Metal Ion Sensing: Applications in Cell Imaging and Environmental Samples. Chemosensors 2023, 11, 474. [Google Scholar] [CrossRef]
- Zhang, P.; Zheng, Y.; Ren, L.; Li, S.; Feng, M.; Zhang, Q.; Qi, R.; Qin, Z.; Zhang, J.; Jiang, L. The Enhanced Photoluminescence Properties of Carbon Dots Derived from Glucose: The Effect of Natural Oxidation. Nanomaterials 2024, 14, 970. [Google Scholar] [CrossRef] [PubMed]
- Lu, X.; Zhang, S.; Shi, W.; Cheng, D.; Li, H.W.; Xu, S.; Dong, B. Tunable Photoluminescence Emission from Surface-State to Carbon Core-State of PAMAM Carbonized Polymer Dots and Its High-Sensitive Detection of Copper(II). Colloids Surf. A Physicochem. Eng. Asp. 2022, 648, 12944. [Google Scholar] [CrossRef]
- Moniruzzaman, M.; Kim, J. N-Doped Carbon Dots with Tunable Emission for Multifaceted Application: Solvatochromism, Moisture Sensing, PH Sensing, and Solid State Multicolor Lighting. Sens. Actuators B Chem. 2019, 295, 12–21. [Google Scholar] [CrossRef]
- Kim, Y.; Park, Y.; Han, S.; Park, W.; Kim, M.; Kim, K.; Joo, J.; Hahn, S.K.; Kwon, W. Radiative and Non-Radiative Decay Pathways in Carbon Nanodots toward Bioimaging and Photodynamic Therapy. Nanomaterials 2022, 12, 70. [Google Scholar] [CrossRef]
- Nguyen, K.G.; Baragau, I.A.; Gromicova, R.; Nicolaev, A.; Thomson, S.A.J.; Rennie, A.; Power, N.P.; Sajjad, M.T.; Kellici, S. Investigating the Effect of N-Doping on Carbon Quantum Dots Structure, Optical Properties and Metal Ion Screening. Sci. Rep. 2022, 12, 14411. [Google Scholar] [CrossRef] [PubMed]
- Dutta Choudhury, S.; Chethodil, J.M.; Gharat, P.M.; Praseetha, P.K.; Pal, H. PH-Elicited Luminescence Functionalities of Carbon Dots: Mechanistic Insights. J. Phys. Chem. Lett. 2017, 8, 1389–1395. [Google Scholar] [CrossRef]
- Zhang, W.; Li, W.; Wang, Q.; Zhang, J.; Li, L.; Zhou, Z.; Lyu, B.; Ma, J. Synthesis of PH-Responsive Fluorescent Carbon Dots Using Waste Leather Scrap for Anti-Counterfeiting. Dye. Pigment. 2024, 231, 11243. [Google Scholar] [CrossRef]
- Zheng, W.X.; Li, T.X.; Xie, Y.H.; Lv, Y.D.; Xie, D.L.; Wu, F. Preparation of Multi-Colored Carbon Dots via PH-Controlled Degradation of Wheat Bran/o-Phenylenediamine for Fe3+ Ion Detection. RSC Adv. 2025, 15, 12028–12041. [Google Scholar] [CrossRef]
- Liu, C.; Zhang, F.; Hu, J.; Gao, W.; Zhang, M. A Mini Review on PH-Sensitive Photoluminescence in Carbon Nanodots. Front. Chem. 2021, 8, 605028. [Google Scholar] [CrossRef]
- Abu, N.; Chinnathambi, S.; Kumar, M.; Etezadi, F.; Bakhori, N.M.; Zubir, Z.A.; Md Salleh, S.N.; Shueb, R.H.; Karthikeyan, S.; Thangavel, V.; et al. Development of Biomass Waste-Based Carbon Quantum Dots and Their Potential Application as Non-Toxic Bioimaging Agents. RSC Adv. 2023, 13, 27472–27482. [Google Scholar] [CrossRef]
- Wang, Q.; Liu, X.; Zhang, L.; Lv, Y. Microwave-Assisted Synthesis of Carbon Nanodots through an Eggshell Membrane and Their Fluorescent Application. Analyst 2012, 137, 5392–5397. [Google Scholar] [CrossRef] [PubMed]
- Alberto, M.; Gabriela, M. Hydrodynamic Properties of Gelatin—Studies from Intrinsic Viscosity Measurements. In Products and Applications of Biopolymers; IntechOpen: London, UK, 2012. [Google Scholar] [CrossRef]
- Todey, S.A.; Fallon, A.M.; Arnold, W.A. Neonicotinoid Insecticide Hydrolysis and Photolysis: Rates and Residual Toxicity. Environ. Toxicol. Chem. 2018, 37, 528–1537. [Google Scholar] [CrossRef]
- Karmakar, R.; Singh, S.B.; Kulshrestha, G. Kinetics and Mechanism of the Hydrolysis of Thiamethoxam. J. Environ. Sci. Health B 2009, 44, 591–596. [Google Scholar] [CrossRef]
- Rishabh, I.; Rani, M.; Shanker, U. Fluorescence-Based Detection of Thiamethoxam in Agricultural and Fruit Samples by Green Synthesized N-CQDs from Citrus Sinensis. J. Food Compos. Anal. 2025, 139, 107109. [Google Scholar] [CrossRef]
- Xu, G.T.; Zhao, T.S.; Zhang, K.; Guo, L.Z.; He, Y.Q.; Hu, J.H.; Liao, Y.J.; Mai, X.; Li, N. Smartphone Assisted Fluorescent Sensor for Fe3+ and Ascorbic Acid Determination Based on Off-On Carbon Dots Probe. Chin. J. Anal. Chem. 2023, 51, 100206. [Google Scholar] [CrossRef]
- Boobalan, T.; Sethupathi, M.; Sengottuvelan, N.; Kumar, P.; Balaji, P.; Gulyás, B.; Padmanabhan, P.; Selvan, S.T.; Arun, A. Mushroom-Derived Carbon Dots for Toxic Metal Ion Detection and as Antibacterial and Anticancer Agents. ACS Appl. Nano Mater. 2020, 3, 5910–5919. [Google Scholar] [CrossRef]
- Lu, K.P.; Chang, S.T. An Advanced Segmentation Approach to Piecewise Regression Models. Mathematics 2023, 11, 4959. [Google Scholar] [CrossRef]
- Terzapulo, X.; Kassenova, A.; Loskutova, A.; Bukasov, R. Carbon Dots: Review of Recent Applications and Perspectives in Bio-Sensing and Biomarker Detection. Sens. Biosens. Res. 2025, 47, 100771. [Google Scholar] [CrossRef]
- Molaei, M.J. Principles, Mechanisms, and Application of Carbon Quantum Dots in Sensors: A Review. Anal. Methods 2020, 12, 1266–1287. [Google Scholar] [CrossRef]
- Sasikumar, K.; Rajamanikandan, R.; Ju, H. Inner Filter Effect-Based Highly Sensitive Quantification of 4-Nitrophenol by Strong Fluorescent N, S Co-Doped Carbon Dots. Carbon Lett. 2024, 34, 122–132. [Google Scholar] [CrossRef]
- Ren, H.; Labidi, A.; Sun, J.; Allam, A.A.; Ajarem, J.S.; Abukhadra, M.R.; Wang, C. Facile Synthesis of Nitrogen, Sulfur Co-Doped Carbon Quantum Dots for Selective Detection of Mercury (II). Environ. Chem. Lett. 2024, 22, 119–130. [Google Scholar] [CrossRef]
- Zu, F.; Yan, F.; Bai, Z.; Xu, J.; Wang, Y.; Huang, Y.; Zhou, X. The Quenching of the Fluorescence of Carbon Dots: A Review on Mechanisms and Applications. Microchim. Acta 2017, 184, 1899–1914. [Google Scholar] [CrossRef]
- Wang, Q.; Cheng, Y.; Ding, L.; Li, S.; Zhang, J.; Niu, Y.; Jing, Z. N, S, Br Co-Doped Carbon Dots: One-Step Synthesis and Fluorescent Detection of 6-Mercaptopurine in Tablet. J. Pharm. Anal. 2024, 14, 291–293. [Google Scholar] [CrossRef]
- Dai, D.; Zhang, C.; Thuy, N.T.D.; Zhao, G.; Lu, W.; Fan, J. Strong Fluorescence Quenching of Carbon Dots by Mercury(II) Ions: Ground-State Electron Transfer and Diminished Oscillator Strength. Diam. Relat. Mater. 2022, 126, 109076. [Google Scholar] [CrossRef]
- Vijayaraj, V.; Sasikala, G.; Manivannan, N.; Mathivanan, N.; Karuppasamy, P.; Senthil Pandian, M.; Ramasamy, P. Fluorescence Imaging of Onion Epidermal Cell Utilizing Highly Luminescent Water-Soluble CdTe Colloidal Quantum Dots. Inorg. Chem. Commun. 2023, 149, 110352. [Google Scholar] [CrossRef]
- Cao, C.; Guo, W. Carbon Dots-Based Fluorescent Probe for the Detection of Imidacloprid Residue in Leafy Vegetables. Food Chem. 2024, 435, 137578. [Google Scholar] [CrossRef]
- Ganesamurthi, J.; Keerthi, M.; Chen, S.M.; Shanmugam, R. Electrochemical Detection of Thiamethoxam in Food Samples Based on Co3O4 Nanoparticle@Graphitic Carbon Nitride Composite. Ecotoxicol. Environ. Saf. 2020, 189, 110035. [Google Scholar] [CrossRef] [PubMed]
- Fang, X.; Duan, D.; Ye, J.; Li, K. A Sensitive Visual Detection of Thiamethoxam Based on Fluorescence Resonance Energy Transfer from NH2–SiO2@CsPbBr3 to Merocyanine Configuration of Spiropyran. Anal. Chim. Acta 2021, 1183, 338938. [Google Scholar] [CrossRef] [PubMed]
- Kong, Q.; Yue, F.; Liu, M.; Huang, J.; Yang, F.; Liu, J.; Li, J.; Li, F.; Sun, X.; Guo, Y.; et al. Non-Immobilized GO-SELEX of Aptamers for Label-Free Detection of Thiamethoxam in Vegetables. Anal. Chim. Acta 2022, 1202, 339677. [Google Scholar] [CrossRef] [PubMed]
- Shi, Q.; Tao, H.; Wu, Y.; Chen, J.; Wang, X. An Ultrasensitive Label-Free Electrochemical Aptasensing Platform for Thiamethoxam Detection Based on ZIF-67 Derived Co-N Doped Porous Carbon. Bioelectrochemistry 2023, 149, 108317. [Google Scholar] [CrossRef]
- Dai, Y.; Xu, W.; Hong, J.; Zheng, Y.; Fan, H.; Zhang, J.; Fei, J.; Zhu, W.; Hong, J. A Molecularly Imprinted Ratiometric Fluorescence Sensor Based on Blue/Red Carbon Quantum Dots for the Visual Determination of Thiamethoxam. Biosens. Bioelectron. 2023, 238, 115559. [Google Scholar] [CrossRef] [PubMed]
- Xu, Y.; Pu, Y.; Jiang, H.; Huang, Y.; Shen, C.; Cao, J.; Jiang, W. Highly Sensitive Fluorescent Sensing Platform for Imidacloprid and Thiamethoxam by Aggregation-Induced Emission of the Zr(IV) Metal−Organic Framework. Food Chem. 2022, 375, 131879. [Google Scholar] [CrossRef] [PubMed]
- Hou, L.; Hu, X.; Pang, W.; Cao, R.; Wang, S.; Wang, W.; Liu, X.; Tang, Y. Fluorescence Homogenous Analysis Based on AgNPs Quenching Carbon Dots and Polymer Dots for Simultaneous Detection of Glyphosate and Thiamethoxam in Food. Sens. Actuators B Chem. 2025, 443, 138209. [Google Scholar] [CrossRef]


Disclaimer/Publisher’s Note: The statements, opinions and data contained in all publications are solely those of the individual author(s) and contributor(s) and not of MDPI and/or the editor(s). MDPI and/or the editor(s) disclaim responsibility for any injury to people or property resulting from any ideas, methods, instructions or products referred to in the content. |
© 2025 by the authors. Licensee MDPI, Basel, Switzerland. This article is an open access article distributed under the terms and conditions of the Creative Commons Attribution (CC BY) license (https://creativecommons.org/licenses/by/4.0/).