1. Introduction
The ocean is a vital component of the Earth’s ecosystem [
1]. In recent years, human activities, such as industrial wastewater discharge, mining, and the combustion of fossil fuels, have led to severe heavy metal pollution in marine environments, with Pb
2+ and Cd
2+ being particularly problematic due to their persistence and synergistic toxic effects [
2,
3]. These metals cannot be readily degraded in natural environments, but instead undergo transformations, such as adsorption, precipitation, and bioaccumulation, posing long-term ecological risks [
4]. Pb
2+ and Cd
2+ exhibit significant combined toxicity, with their synergistic mechanism primarily attributed to cooperative interactions [
5,
6]. Both metals interfere with marine organisms’ respiration and osmotic pressure regulation [
7], severely inhibiting growth and increasing the risk of developmental deformities [
8,
9]. Once released into aquatic systems, they tend to adsorb onto sediments and organic matter, but changes in pH or redox conditions may trigger their re-release, perpetuating contamination. Additionally, their bioaccumulation across trophic levels—such as in fish, shellfish, and plankton—facilitates their entry into the human food chain [
10,
11]. Upon human exposure, Pb
2+ and Cd
2+ induce gastrointestinal irritation, metabolic dysfunction, and liver damage [
12,
13,
14]. Moreover, their synergistic neurotoxicity allows them to cross the blood–brain barrier, disrupting neurotransmitter metabolism (e.g., acetylcholine imbalance) and impairing neural signaling [
15]. According to China’s seawater quality standards (GB 3097–1997), Maowei Sea is classified as a Category II marine area, and the wastewater discharge must meet the standards of Pb ≤ 5 µg/L and Cd ≤ 0.5 µg/L [
16]; developing a robust sensor for simultaneous Pb
2+ and Cd
2+ detection in marine environments is crucial for pollution monitoring and risk mitigation.
Traditional detection techniques, such as atomic absorption spectroscopy (AAS), atomic fluorescence spectroscopy (AFS), and ultraviolet visible spectrophotometry (UV-Vis) [
17], each offer distinct advantages but exhibit notable limitations in marine environmental monitoring. For example, AAS suffers from low efficiency in single-element detection and requires specialized equipment; AFS is constrained by the fluorescence characteristics of specific elements; and UV-Vis spectroscopy faces challenges regarding sensitivity and selectivity. Moreover, these laboratory-based analytical methods share common drawbacks, including the need for sophisticated instrumentation and high operator expertise. In contrast, electrochemical techniques offer several advantages, such as simple instrumentation, low cost, excellent selectivity, and the capability for rapid response, making them particularly suitable for the on-site and real-time detection of Pb
2+ and Cd
2+ [
18].
Over the past few years, scientists have developed various electrochemical sensors based on different functional materials. The Shaohua Hu team developed composite materials based on the principle of bismuth oxychloride for the detection of Cd
2+ and Pb
2+, showing detection limits of 0.87 μg/L and 0.74 μg/L, respectively [
19]. The Jadranka Milikić team first synthesized composite materials using different MOF−5 and PANI weight ratios in conductive (ES) or non-conductive (EB) forms for the detection of Cd
2+ and Pb
2+. The MOF−5/EB−1 electrode demonstrated detection limits of 77 μg/L for Cd
2+ and 33 μg/L for Pb
2+ [
20]. The Shuai Hu team modified a glassy carbon electrode (GCE) with Bi@ZIF−8/CMWCNTs, achieving detection limits of 0.76 μg/L for Pb
2+ and 0.87 μg/L for Cd
2+ in the range of 2.0–50.0 μg/L [
21]. The Liqiang Luo team developed a hybrid electrode based on bismuth–carbon montmorillonite for the simultaneous detection of Cd
2+ and Pb
2+, with detection limits of 0.20 μg/L for Pb
2+ and 0.35 μg/L for Cd
2+ [
22]. The Dongyue Li team constructed a bismuth membrane-modified graphene nanofiber–nafion composite glassy carbon electrode (BiF/GNFs-NA/GCE) with detection limits of 0.09 μg/L for Cd
2+ and 0.02 μg/L for Pb
2+ [
23]. Despite significant advancements in Pb
2+ and Cd
2+ detection using electrochemical sensors, the existing electrochemical sensors often require pairing with dedicated electrochemical workstations, which are bulky and consume a high amount of power, posing inherent limitations in terms of size and power consumption.
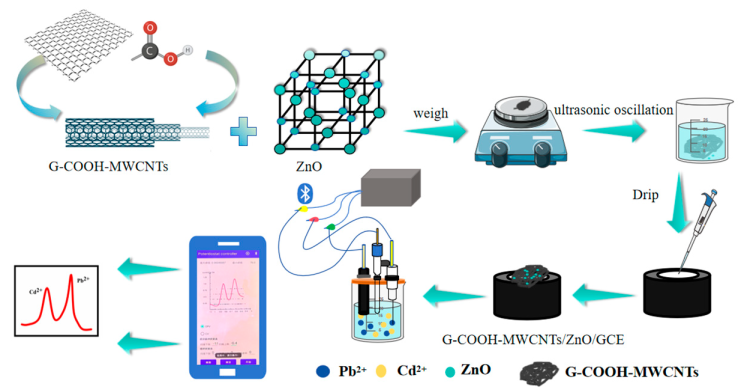
This study constructed a sensor based on a G-COOH-MWCNTs/ZnO composite-modified electrode. Its advantages are mainly reflected in the following two aspects: (1) Material Synergistic Effect: The high electron transport capability of the graphene framework [
24], the increased specific surface area and active site enrichment of carboxylated multiwalled carbon nanotubes [
25,
26], and the dispersion control and agglomeration inhibition properties of ZnO nanoparticles [
27,
28,
29,
30] synergistically achieved high sensitivity for the detection of Pb
2+ and Cd
2+. (2) System Integration Innovation: By integrating a portable intelligent detection system, the limitations of time and space in traditional laboratory testing were overcome. This system not only eliminates the risk of sample degradation during transportation, but also enables the real-time, on-site monitoring of heavy metal pollution in seawater, offering an appropriate technological solution for marine environmental management. The sensor significantly enhances detection performance through the multi-level synergistic effects of nanomaterials, while the construction of an intelligent mobile detection platform further replaces the complex operational processes of traditional DPV equipment. It offers an innovative solution integrating efficiency, convenience, and practicality for heavy metal pollution prevention and control.
![Chemosensors 13 00251 i001]()
2. Experimental Section
2.1. Equipment and Reagents
The experiments were conducted using a CHI830D (Shanghai Chen Hua Instrument Co., Ltd. (Shanghai, China)) electrochemical workstation, equipped with a standard three-electrode system, including a 3 mm GCE, a platinum wire as the auxiliary electrode, and an Ag/AgCl electrode as the reference. The CHI830D workstation offers a high scan rate of 100 mV/s and a maximum sampling rate of 300 Hz, making it suitable for DPV measurements. The electronic balance was provided by Shanghai Lichen Instruments Technology Co., Ltd. (Shanghai, China); the electric heating drying oven was from Zhejiang Lichen Instruments Technology Co., Ltd. (Shaoxing, China); the ultrasonic cleaner came from Shenzhen Jie Meng Cleaning Equipment Co., Ltd. (Shenzhen, China); and the scanning electron microscope (SEM) was from Sigma HD-type. The electrochemical detection system for intelligent mobile devices was used for DPV testing.
The intelligent mobile electrochemical detection system consisted of a wireless potentiostat as the lower computer and an Android-based smart mobile device as the upper computer. This system integrates multiple functions, including Bluetooth-controlled potentiostat operation, data preprocessing, curve fitting, curve visualization, peak display, and manual peak calibration. It is capable of performing both CV and DPV measurements.
The reagents used in the experiment included graphitized, carboxylated, multiwalled carbon nanotubes (G-COOH-MWCNTs, purity > 99%) and zinc oxide (ZnO, purity > 99%) from Shanghai Maiklin Biochemical Technology Co., Ltd. (Shanghai, China), and Pb2+ and Cd2+ standard solutions (1000 µg/mL) from the National Non-ferrous Metal and Electronic Analysis and Testing Center. Buffer solutions including HAc-NaAc (0.1 mol/L), KCl, PBS, dimethylformamide (DMF), and K3[Fe(CN)6] were obtained from Shanghai Aladdin Biochemical Technology Co., Ltd. (Shanghai, China).
2.2. Preparation of G-COOH-MWCNTs/ZnO-Modified Electrodes
The 3.0 mm GCE was polished with Al2O3 powders (1.0, 0.3, and 0.5 μm) using a figure-of-eight motion. After polishing, the electrode was sonicated in ultrapure water for approximately 3 min to eliminate any remaining Al2O3 particles adhering to the surface. This sonication step was crucial for removing any abrasive residues that could interfere with the electrochemical analysis. Subsequently, in a 0.1 mol/L sulfuric acid solution, cyclic voltammetry was performed with a potential range from −1 to 1 V, a scan rate of 100 mV/s, and 20 cycles, until the curves completely overlapped. After activation, the electrode was thoroughly rinsed with ultrapure water to remove residual acid, dried, and stored for future use. Activation in an acidic solution is an essential step to enhance the electrochemical properties of the GCE, removing organic contaminants and improving surface reactivity by promoting the formation of surface-active sites.
The G-COOH-MWCNTs/ZnO composite solution was prepared by dispersing 3.5 mg of G-COOH-MWCNTs and 0.8 mg of ZnO nanoparticles in 5 mL of dimethylformamide (DMF), followed by ultrasonication for 3 h to ensure complete dispersion. The GCE surface modification was then performed via a drop-coating technique, wherein 5 μL of the uniformly dispersed composite suspension was carefully drop-cast onto the pretreated GCE surface using a precision microsyringe. Subsequently, the modified electrode was placed in a temperature-controlled drying oven at 28 °C until complete solvent evaporation was achieved.
2.3. Pretreatment of Water Sample Handling
To assess trace metal contamination, water samples were collected from multiple sites across the Maowei Sea, allowed to stand for three days to settle particulate matter, filtered through a 0.45 µm membrane to target dissolved Pb2+ and Cd2+, and analyzed using a multi-point standard addition method with 0.1 mol/L of HAc-NaAc buffer (1:1 v/v) to stabilize ionic strength and pH. To ensure analytical accuracy, all seawater samples were immediately preserved after collection following standard protocols. Preserved samples were stored at 4 °C in the dark.
2.4. Electrochemical Detection
Standard Pb2+ and Cd2+ solutions were diluted to different concentrations and introduced into a 0.1 mol/L HAc-NaAc-supporting electrolyte (pH 5.5). A three-electrode system was employed for detection: the working electrode was a GCE modified with G-COOH-MWCNTs/ZnO, the counter electrode was a platinum wire electrode, and the reference electrode was a silver/silver chloride electrode. Constant potential (i-t) deposition was performed under stirring conditions, with the deposition potential set at −1.1 V and a deposition time of 300 s. The stirring was stopped after the deposition ended. The DPV (100 mV/s scan rate, 0.05 V pulse amplitude, 2 s quiet time, −1.1 V deposition potential, and 300 s deposition time) scan voltage ranged from −0.95 V to −0.2 V. The peak current was directly proportional to the target ion concentration. A linear regression equation was established using the standard curve, and the detection limit was calculated accordingly.
2.5. Data Treatment
In this study, all experimental data were obtained based on three independent replicate measurements (
n = 3) to ensure statistical reliability and experimental reproducibility of the results. We used Equations (1) and (2) to calculate the detection limit, with the specific equations expressed as follows:
In Equations (1) and (2), SD is the standard deviation, n is the number of parallel measurements of the blank sample, I0i is the signal value of the blank sample, and K is the slope of the linear equation.
3. Results and Discussion
3.1. Morphological Characterization of Modified Electrodes
SEM images revealed the morphology of G-COOH-MWCNTs, ZnO, and the G-COOH-MWCNTs/ZnO composite material.
Figure 1a shows the SEM image of G-COOH-MWCNTs at a magnification of 100 kx, where the tubular structures of G-COOH-MWCNTs are observed to be densely entangled. In
Figure 1b, ZnO exhibits a nanoparticle and sheet-like morphology, with some degree of particle aggregation observed between the individual particles.
Figure 1c,d show the morphological characterization of the G-COOH-MWCNTs/ZnO composite material, where ZnO particles are embedded within the G-COOH-MWCNTs structure, forming a composite microstructure.
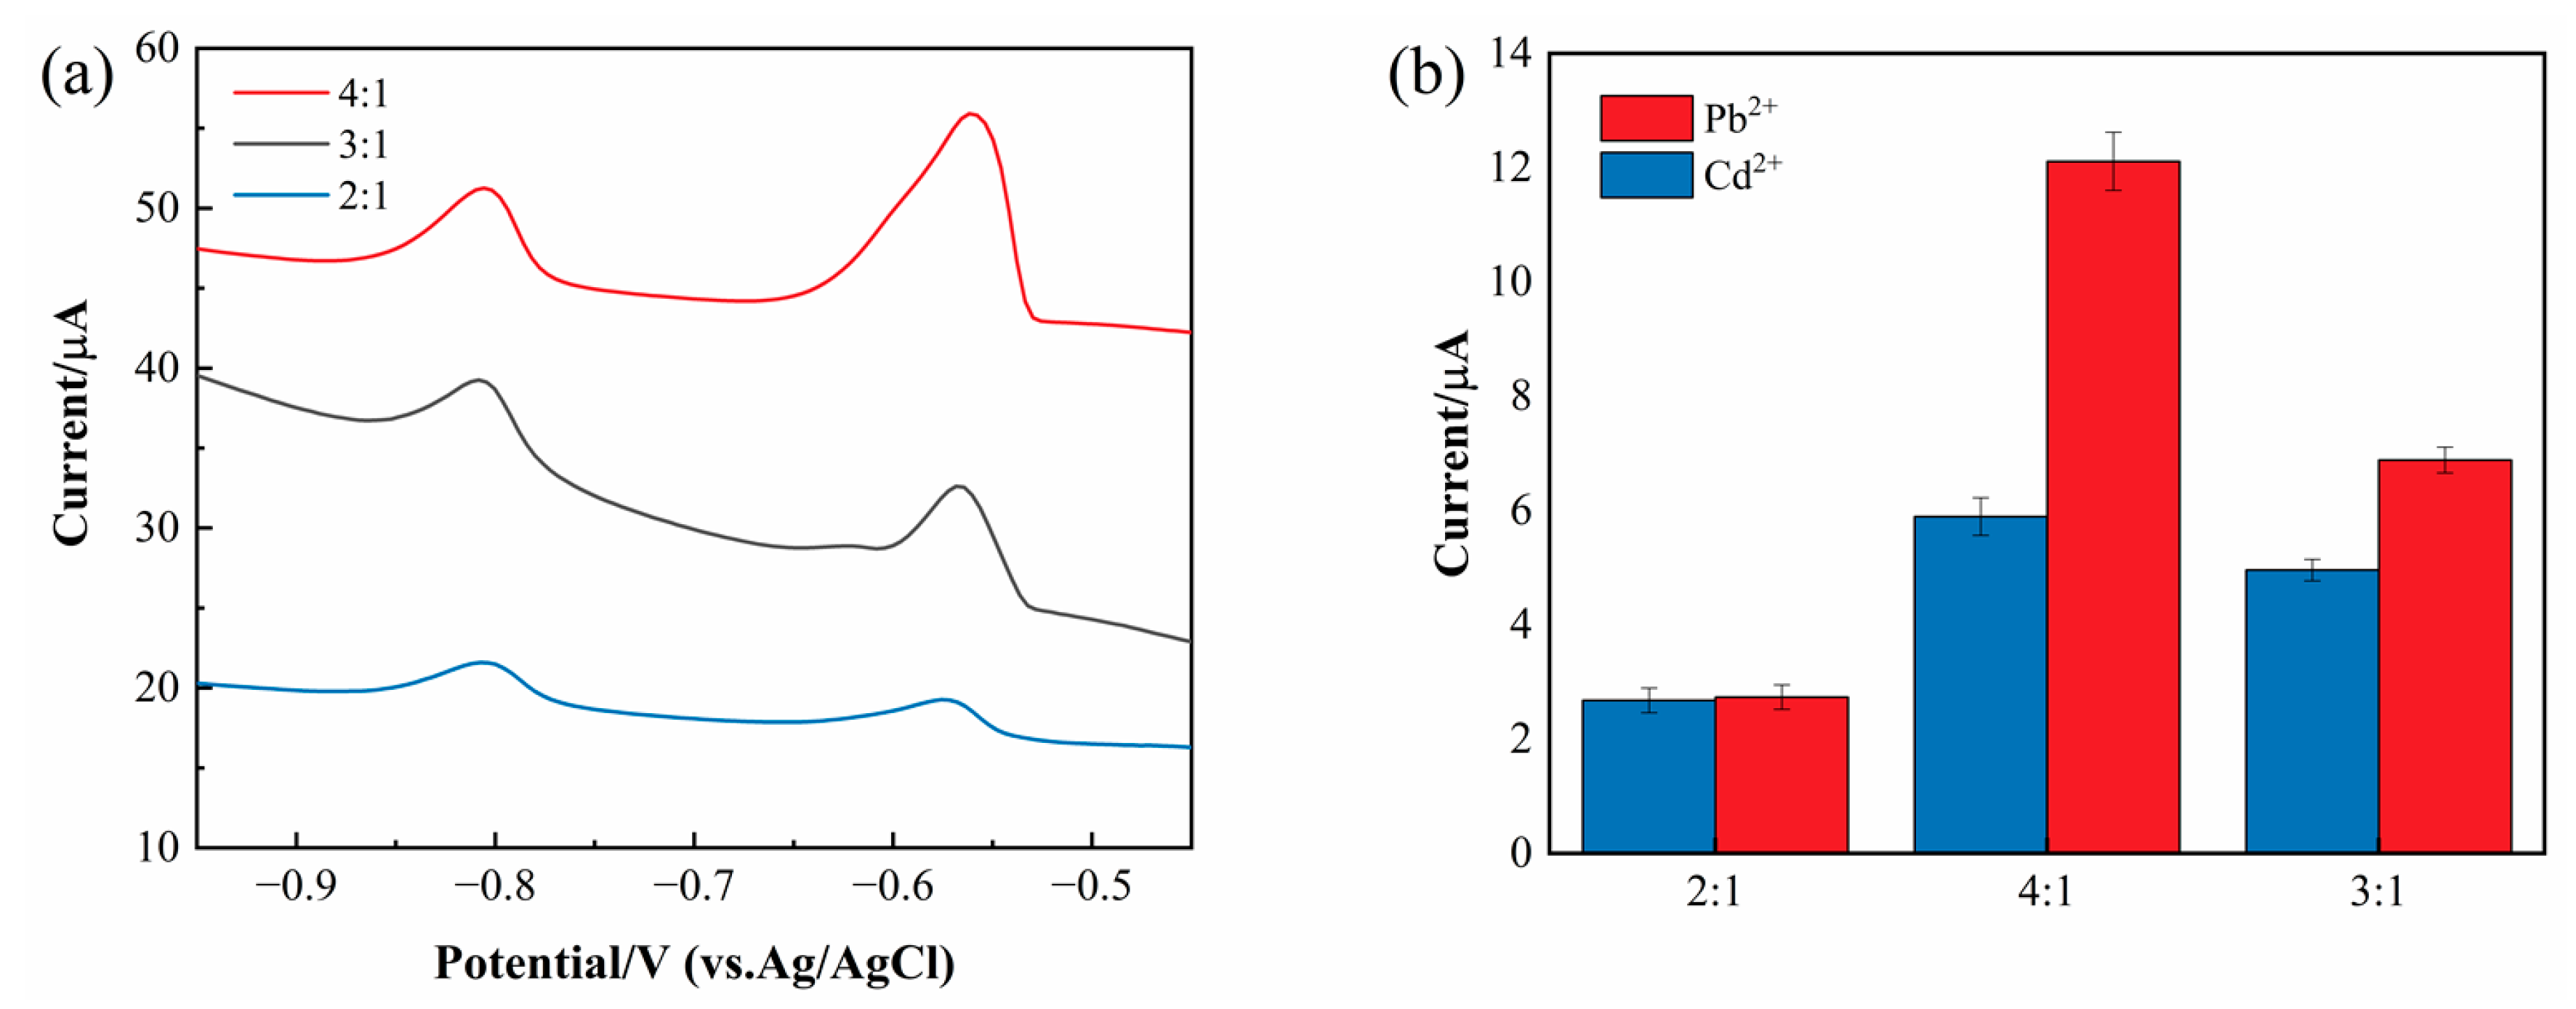
3.2. The Effect of Different Ratio Materials
To verify the contributions of each component, we prepared composites with different ratios (G-COOH-MWCNTs:ZnO = 4:1, 3:1, and 2:1). As shown in
Figure 2, the experimental results demonstrate that the optimal response was achieved at a ratio of 4:1. The higher content of G-COOH-MWCNTs likely contributes to enhanced adsorption capacity, conductivity, and larger specific surface area, facilitating the enrichment of heavy metal ions and electron transfer, thereby improving sensitivity.
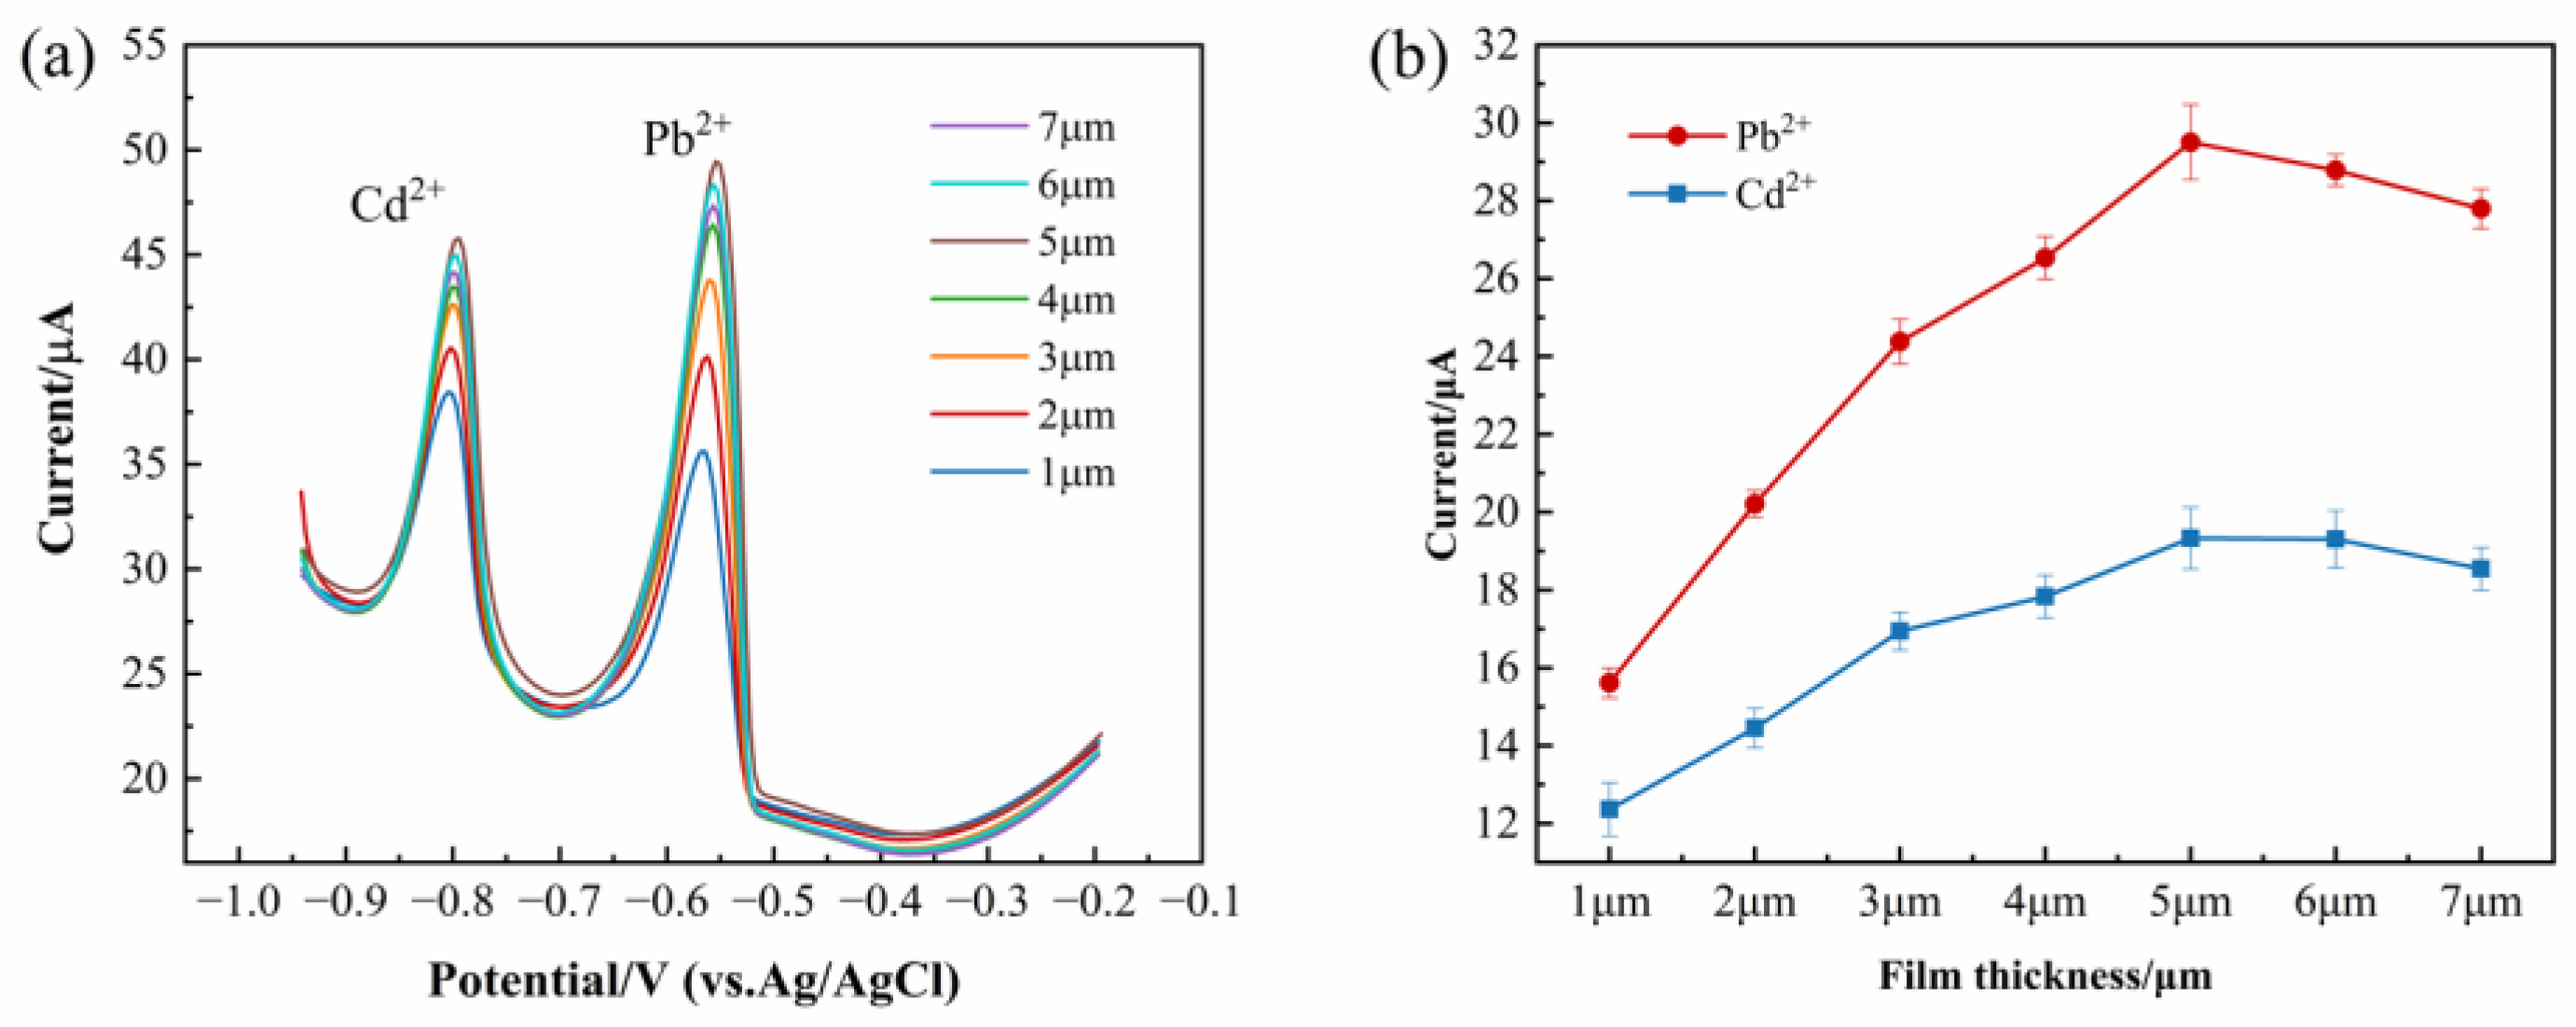
3.3. Effect of Film Thickness
The corresponding peak current responses are illustrated in
Figure 3a. As depicted in
Figure 3b, the peak current exhibits a steady increase with increasing film thickness and reaches its maximum at 5 μm. However, when the film thickness was further increased to 6 μm, a noticeable decline in the peak current was observed.
This phenomenon can be attributed to the uneven distribution of active components within thinner films, leading to inefficient electrochemical reactions on the electrode surface and, consequently, lowering peak currents. In contrast, with increasing film thickness, excessive proton transport pathways may hinder the transmission of Pb2+ and Cd2+. Additionally, the limited adsorption capacity hinders electron transfer, thereby restricting redox activity on the electrode surface and leading to a decrease in peak current. All subsequent optimizations (pH, deposition time, etc.) were conducted using the identified optimal thickness.
3.4. Electrochemical Characterization of Modified Electrodes
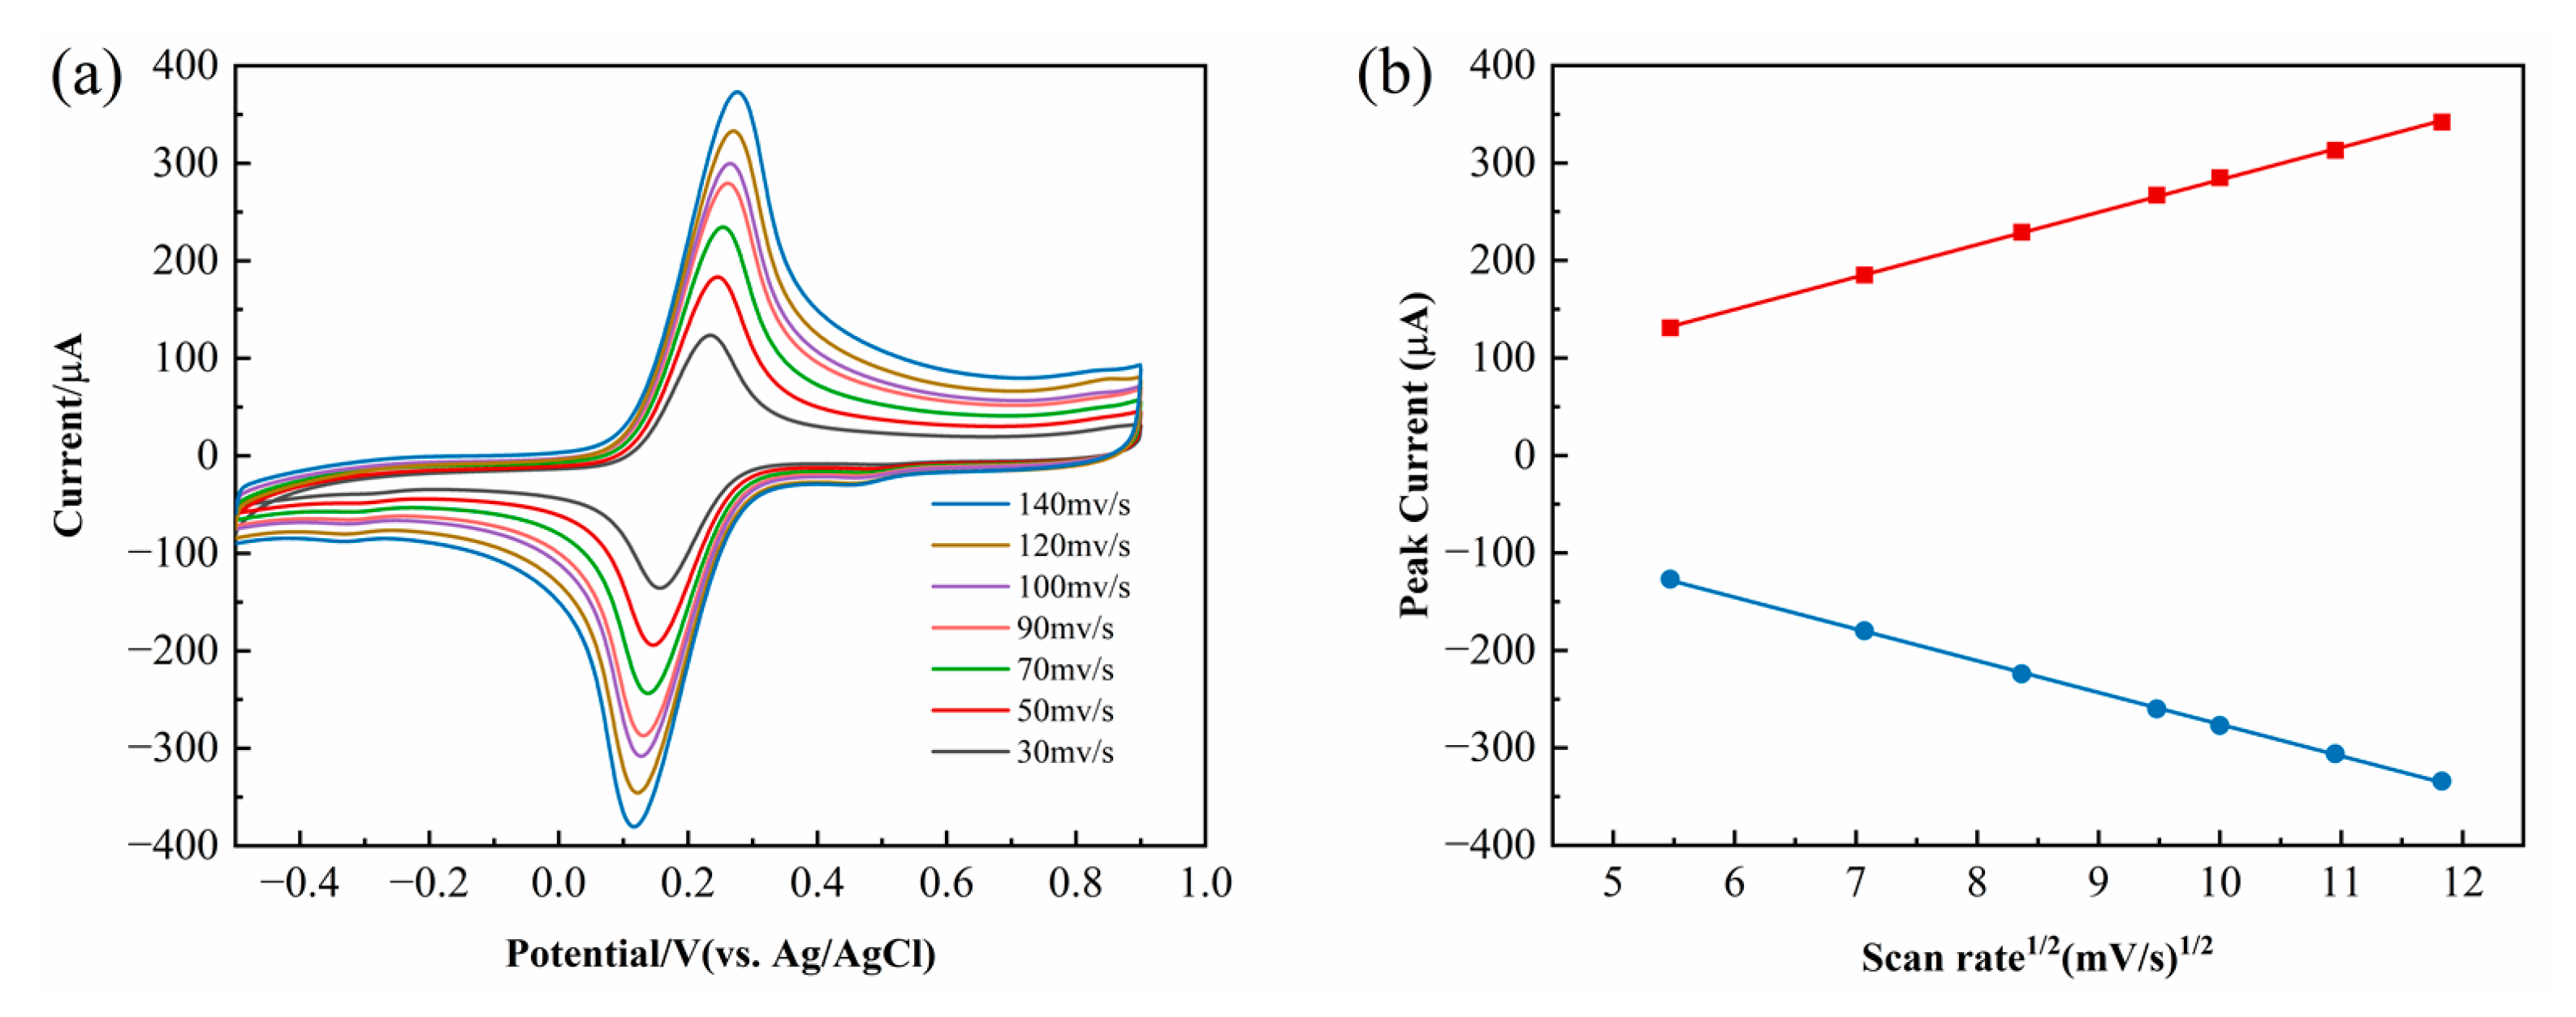
The electrochemical reaction process of the electrode can be categorized into surface-controlled and diffusion-controlled processes. As shown in
Figure 4a, the peak current gradually increases with the increase in the scan rate.
Figure 4b further demonstrates that the peak current exhibits a linear relationship with the square root of the scan rate, indicating that the electron transfer process at the G-COOH-MWCNTs/ZnO/GCE-modified electrode is governed by diffusion control.
As the electrode reaction was confirmed to be diffusion-controlled (
Figure 4), the Randles–Sevcik equation was subsequently applied to calculate the effective electrode surface area. The Randles–Sevcik (RS) equation, based on the diffusion-controlled electrode reaction theory in electrochemistry, defines the correlation between peak current and analyte concentration. Assuming the electrode reaction is a reversible single-electron transfer process, and the concentration distribution of the electroactive species is only influenced by diffusion (neglecting factors such as convection and electromigration), the RS equation can be derived from Fick’s law of diffusion and the Butler–Volmer electrode kinetics equation. Based on the RS equation, the effective surface areas of GCE, G-COOH-MWCNTs/GCE, and G-COOH-MWCNTs/ZnO/GCE were determined as 0.064 cm
2, 0.132 cm
2, and 0.232 cm
2, respectively. These results indicate that the G-COOH-MWCNTs/ZnO/GCE composite-modified electrode accelerates the electron transfer rate on the electrode surface and exhibits excellent conductivity. The RS equation is as follows:
When calculating the active surface area, Ip represents the peak current; n denotes the number of electrons transferred from [Fe(CN)6]3− to [Fe(CN)6]4−, meaning n = 1; C is the electrolyte concentration, which is 5 mM in this study; v represents the scan rate, set as 0.1 V/s here; and D is the diffusion coefficient, which is 6.70 × 10⁻⁶ cm2/s at 25 °C.
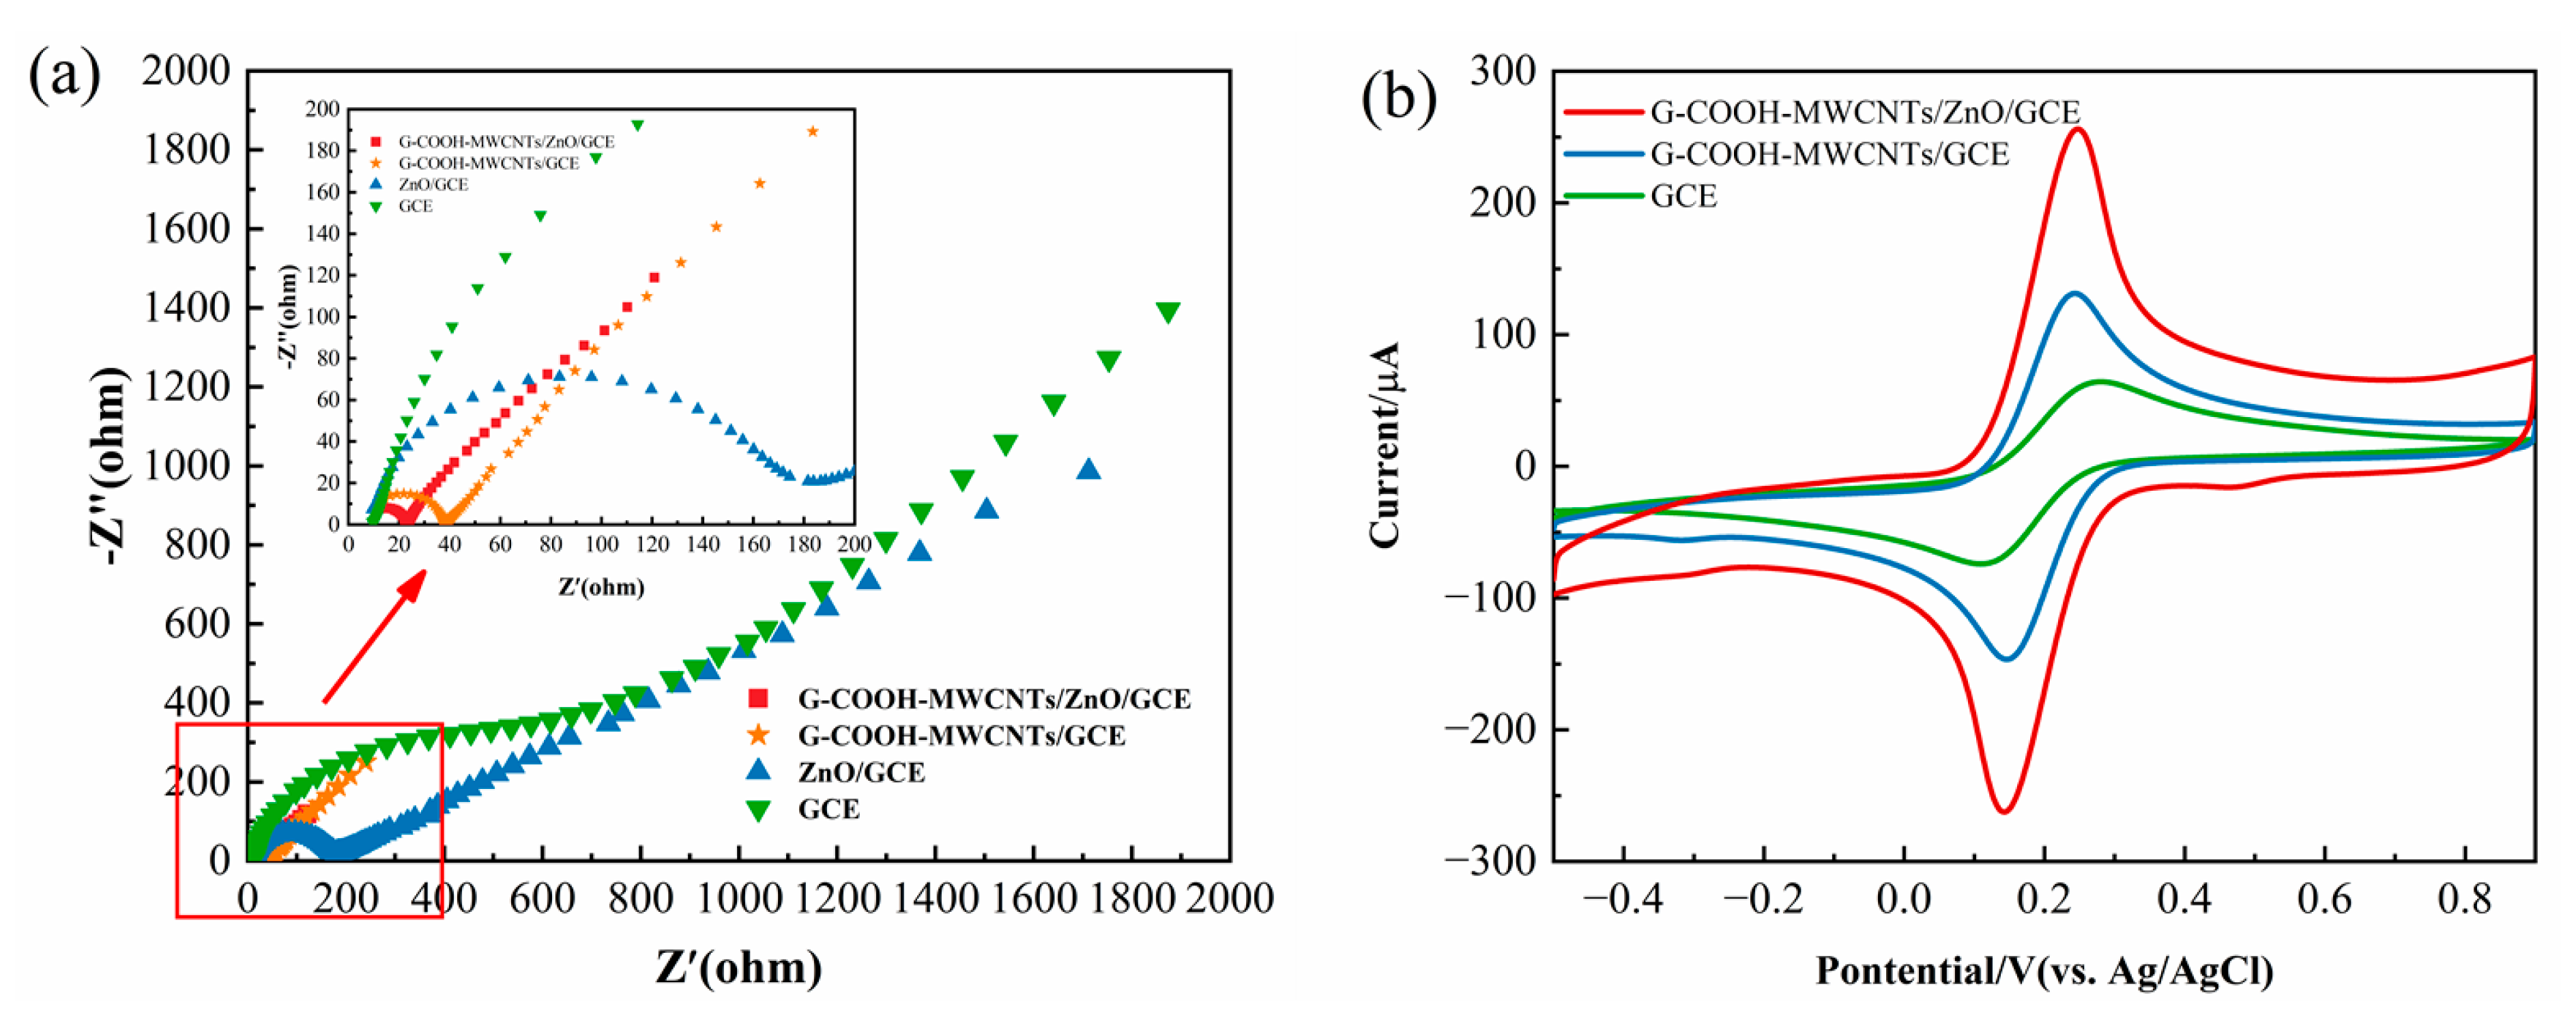
Figure 5a shows the impedance spectra for bare GCE,ZnO/GCE,G-COOH-MWCNTs/GCE and G-COOH-MWCNTs/ZnO/GCE. As shown in
Figure 5a, the G-COOH-MWCNTs/ZnO/GCE-modified electrode exhibits the smallest arc, indicating superior electron conductivity and a larger surface area that facilitates electron transfer compared to GCE, ZnO/GCE, and G-COOH-MWCNTs/GCE.
G-COOH-MWCNTs significantly enhance the electrode’s effective surface area through their tubular structure and high aspect ratio, while graphene layers improve conductivity via π-electron overlap. The hydroxyl and carboxyl groups boost stability, dispersion, and adsorption efficiency. When combined with ZnO, a semiconductor with high catalytic activity [
31], the composite reconstructs the conductive network. ZnO’s high specific surface area facilitates intimate interface contact with G-COOH-MWCNTs, synergistically enhancing electron transport and electrochemical performance. As shown in
Figure 5b, the G-COOH-MWCNTs/ZnO/GCE system exhibits the strongest voltammetric current response, confirming the composite’s synergistic effect.
3.5. Comparison of Detection Performance Among Different Modified Electrodes
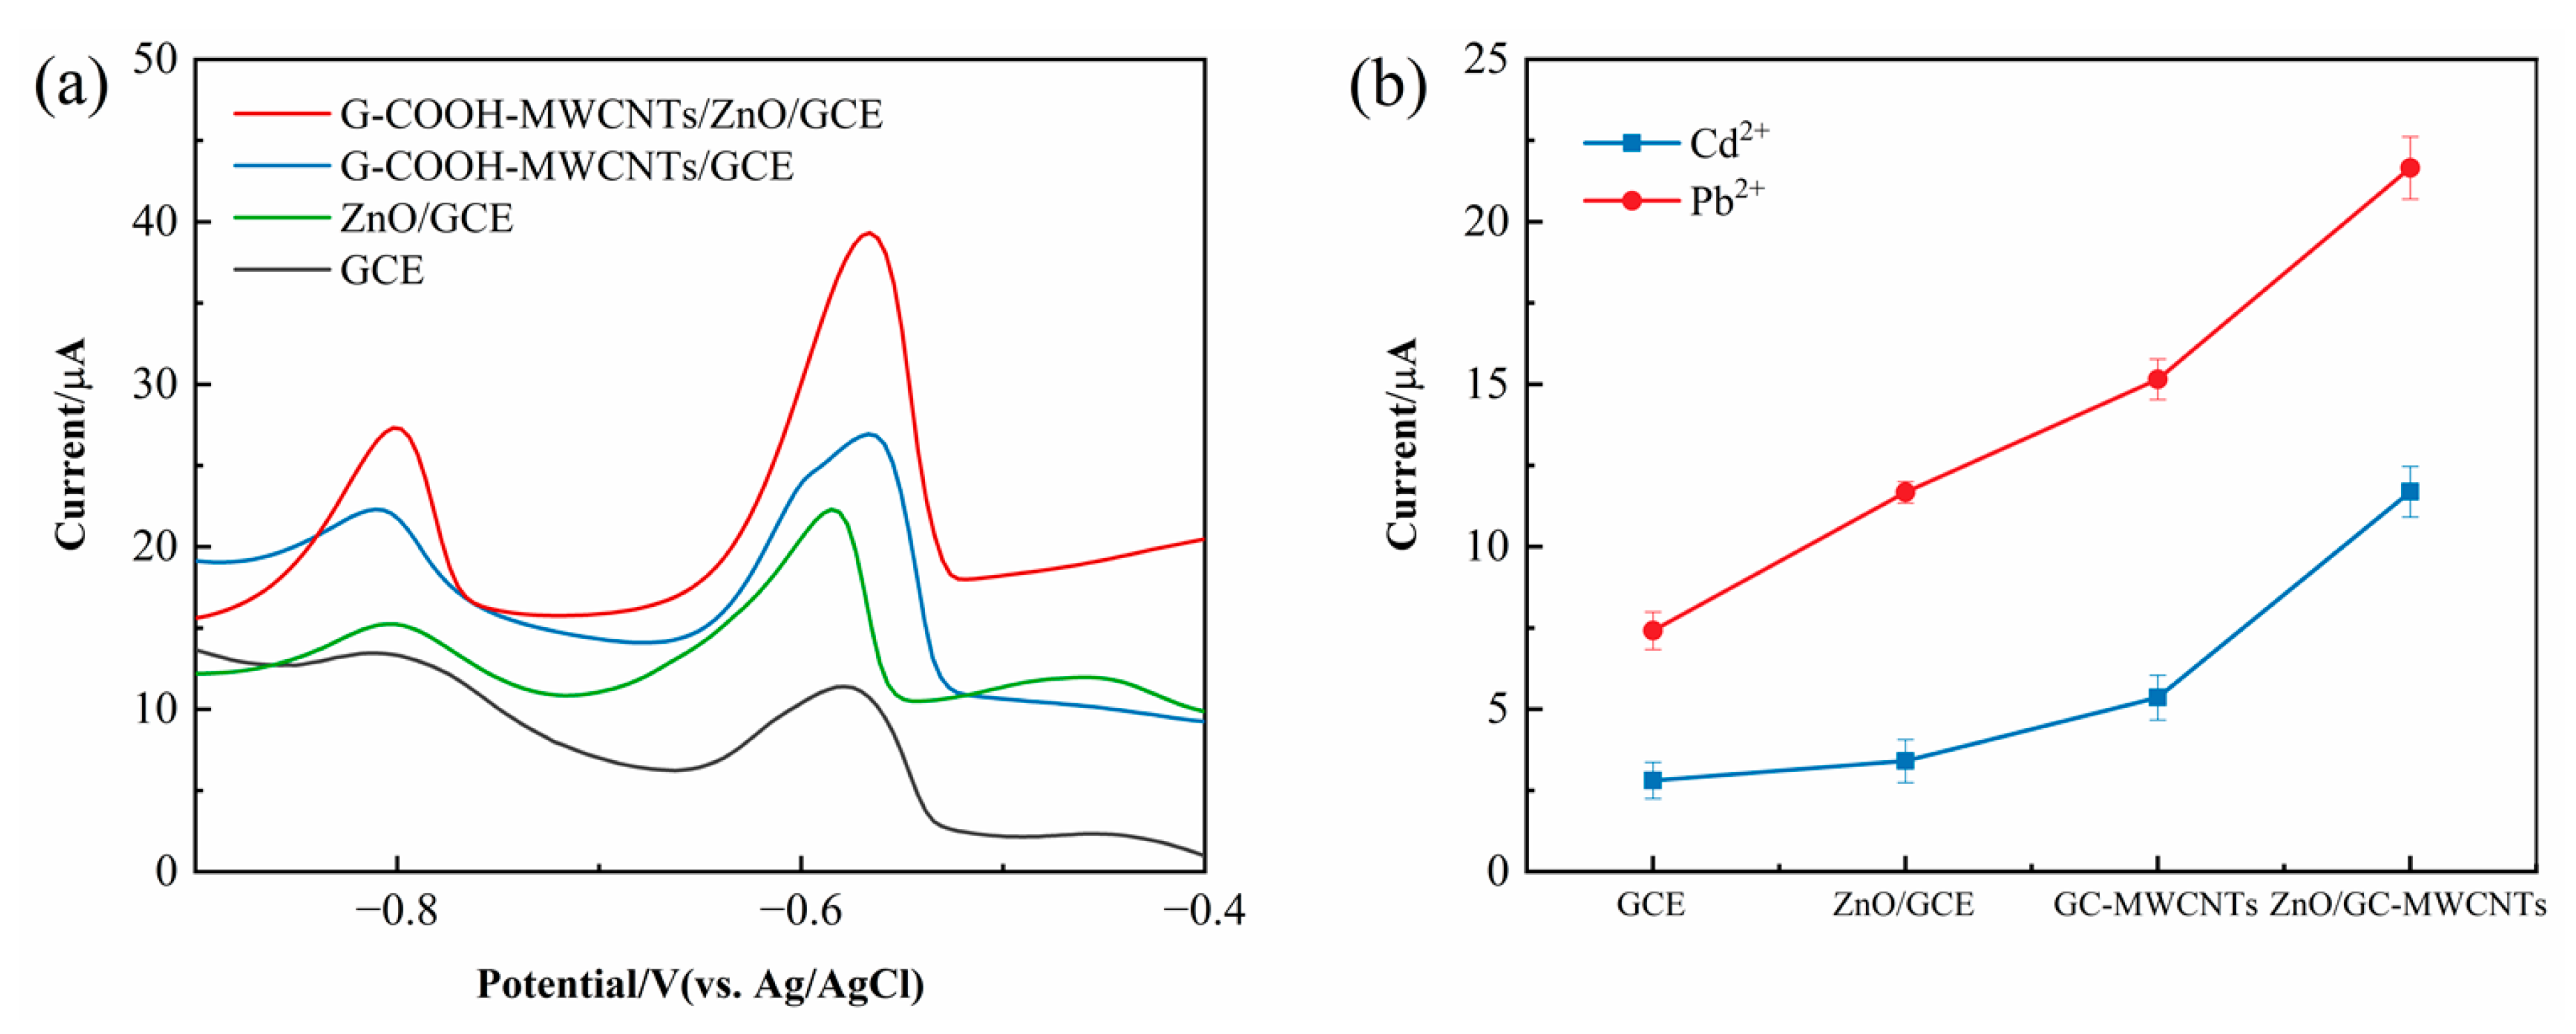
As illustrated in
Figure 6a, the electrochemical response of the GCE is relatively low, which can be attributed to its limited density of electroactive sites and poor catalytic activity. The smooth surface of the unmodified GCE offers a minimal adsorption capacity for metal ions, resulting in weak preconcentration efficiency and suboptimal charge transfer kinetics. Consequently, the stripping peak current observed during the electrochemical detection of Pb
2+ and Cd
2+ remains relatively low, limiting the electrode’s sensitivity for trace metal ion detection.
GCE was modified with G-COOH-MWCNTs, leading to a significant enhancement in the current response. This improvement can be attributed to the distinctive physicochemical properties of G-COOH-MWCNTs, which exhibit a remarkably high specific surface area, excellent electrical conductivity, and robust mechanical stability. The large surface area of G-COOH-MWCNTs increases the density of electroactive sites available for metal ion adsorption, thereby enhancing the preconcentration efficiency of target analytes. Furthermore, the superior electrical conductivity of G-COOH-MWCNTs facilitates efficient charge transfer, contributing to an overall improvement in electrochemical performance. As a result, the modified electrode exhibits a significantly increased stripping peak current, demonstrating its potential for highly sensitive electrochemical detection.
The significantly enhanced current response of the G-COOH-MWCNTs/ZnO/GCE electrode in Cd
2 and Pb
2+ detection (
Figure 6b) clearly demonstrates the synergistic effect between ZnO nanoparticles and carboxyl-functionalized carbon nanotubes. This superior electrochemical performance stems from two complementary mechanisms: (1) ZnO nanoparticles introduce abundant active sites for Cd
2+ and Pb
2+ adsorption while facilitating charge transfer through their intrinsic redox activity, and (2) the uniform dispersion of ZnO on G-COOH-MWCNTs creates an interconnected conductive network that dramatically improves electron mobility. The resulting composite electrode exhibits remarkably accelerated redox kinetics for Pb
2+ reduction compared to its individual components, highlighting the critical role of interfacial electronic interactions in optimizing electrocatalytic performance.
3.6. Optimization of Electrochemical Detection Conditions
3.6.1. Effect of Buffer Solution and pH
Three representative buffer systems were comparatively investigated: (i) 0.1 mol/L KCl; (ii) 0.1 mol/L HAc-NaAc; and (iii) phosphate-buffered saline (PBS), all adjusted to pH 5.5 ± 0.1 using a calibrated pH meter (Leici PHS−25) and spiked with 100 µg/L Pb
2+ and Cd
2+ standard solutions. As shown in
Figure 7a, the highest peak current can be observed in the HAc-NaAc buffer solution, which contained a weak acid and a conjugate base, providing a stable pH environment conducive to the electrochemical detection of Pb
2+ and Cd
2+. The enhanced response in the HAc-NaAc solution can be attributed to the optimal interaction between the metal ions and the electrode surface, as well as the buffer’s ability to maintain a consistent pH during the accumulation and stripping steps. Therefore, HAc-NaAc was chosen as the optimal electrolyte to ensure stable and reliable electrochemical measurements.
During the experimental optimization process, we systematically investigated the effect of pH 2–6 on the detection signals of 100 µg/L Cd
2+ and Pb
2+. As shown in
Figure 7b, the results indicate that as the pH increases from 2 to 5.5, the peak currents of Cd
2+ and Pb
2+ exhibit a significant upward trend. This phenomenon is primarily attributed to the fact that, under highly acidic conditions, the carboxyl groups (–COOH) on the G-COOH-MWCNTs surface are prone to protonation, thereby reducing their binding capacity with metal ions. As the pH approached the near-neutral range, the carboxyl groups gradually deprotonated, leading to an increase in the peak current. However, when the pH exceeded 5.5, the detection signals sharply declined due to the formation of metal hydroxide complexes, which hindered the accumulation of Cd
2+ and Pb
2+ on the electrode surface. Based on considerations of signal intensity and stability, pH 5.5 was ultimately selected as the optimal detection condition.
3.6.2. Effect of Deposition Potential and Deposition Time
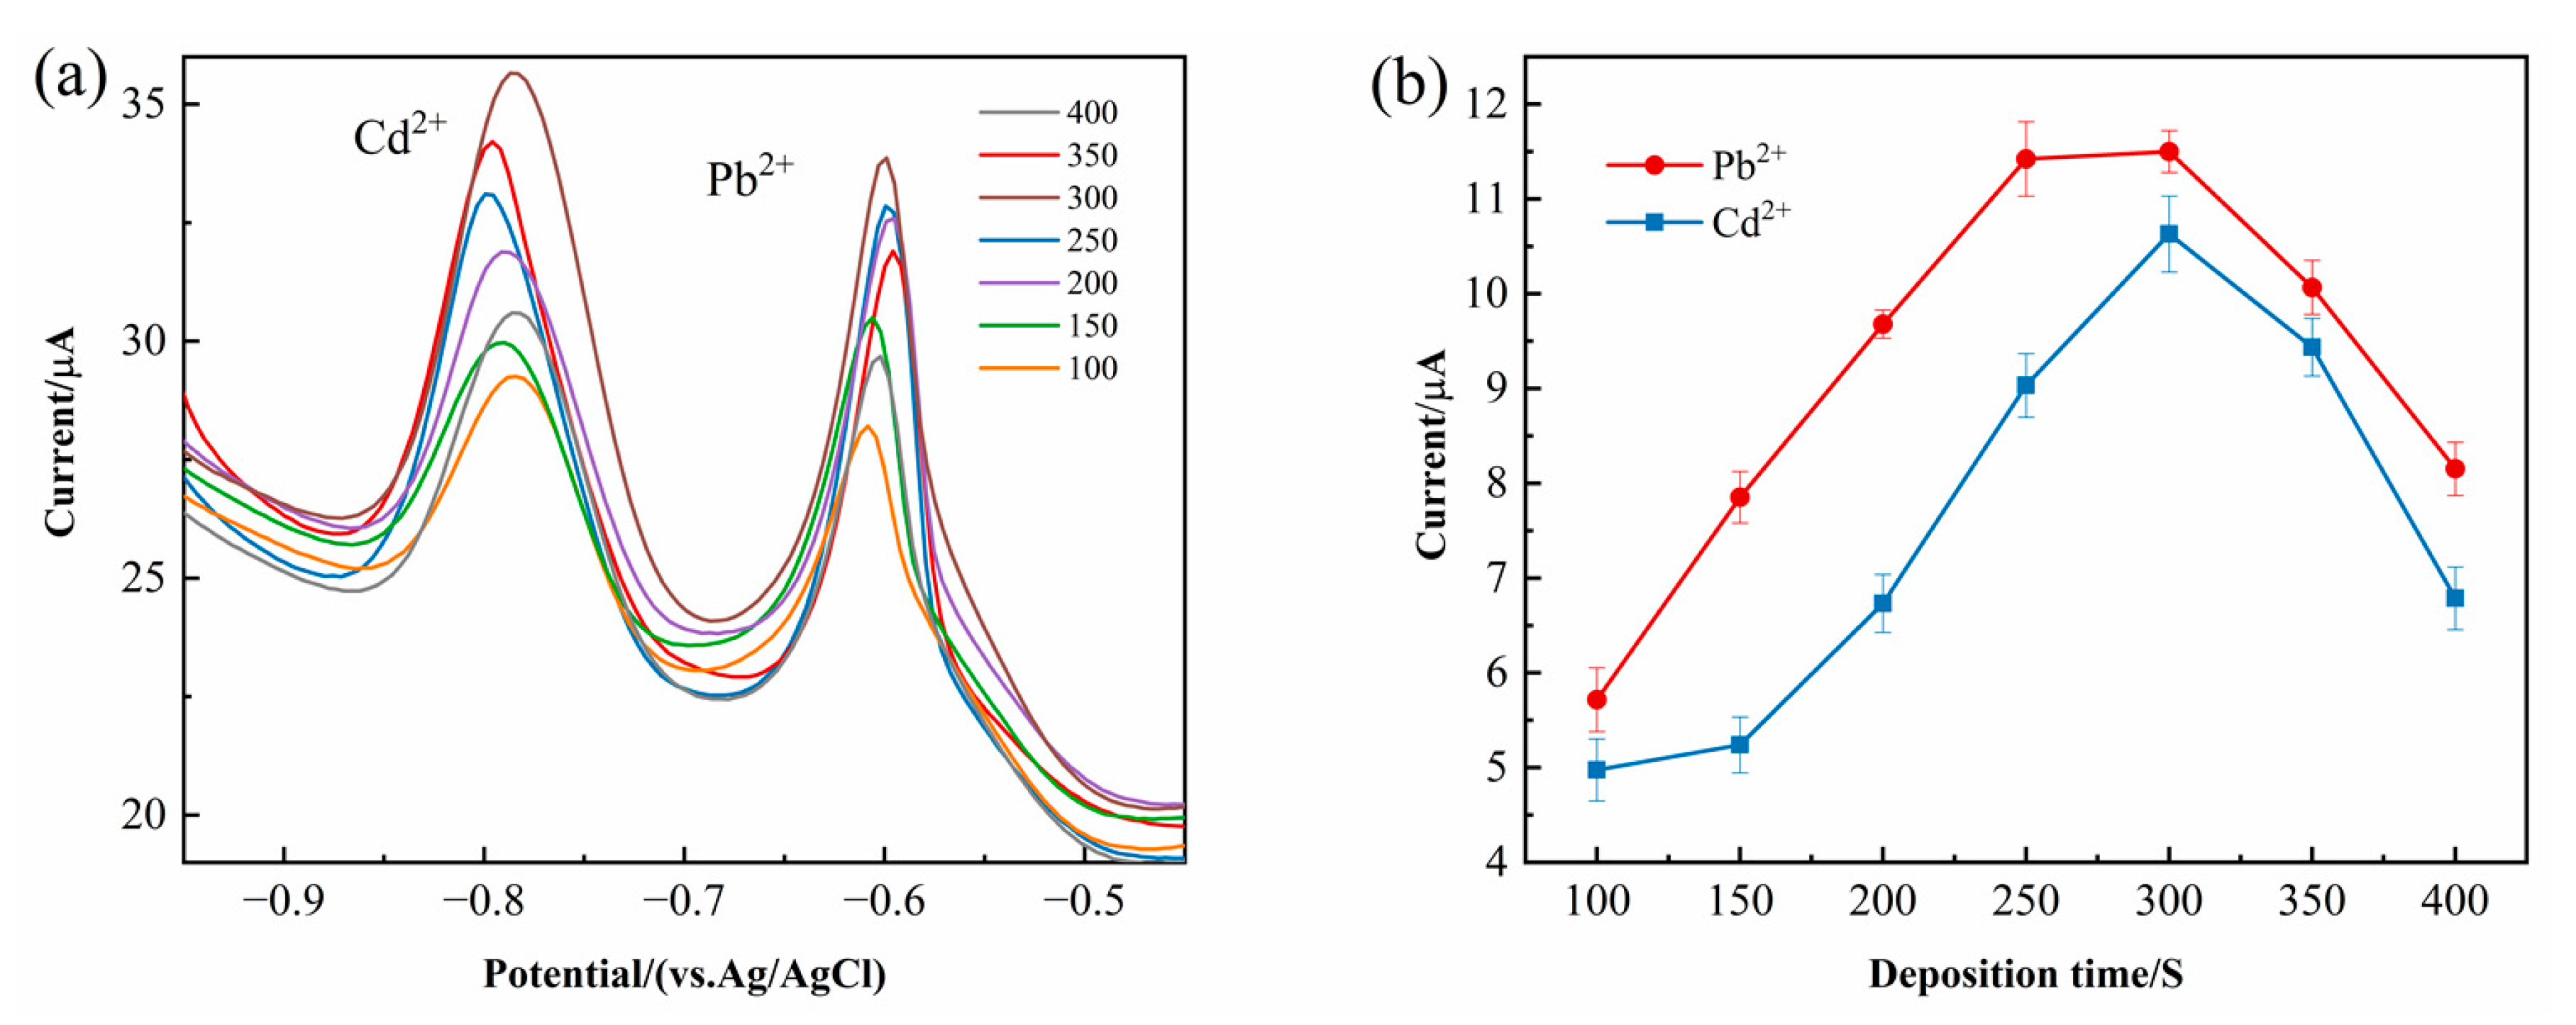
As illustrated in
Figure 8a, the peak currents of Pb
2+ and Cd
2+ exhibit a substantial increase as the deposition time extends from 100 s to 400 s. This trend can be attributed to the prolonged accumulation of metal ions onto the modified electrode surface, leading to enhanced preconcentration and, consequently, an increased electrochemical signal. However, when the deposition time exceeds 300 s, a decline in the peak current can be observed. The subsequent decrease in the peak current at longer deposition times is likely due to the saturation of active sites on the electrode surface, limiting further ion adsorption. Additionally, prolonged deposition may lead to increased background noise and signal instability, reducing the overall detection sensitivity. As depicted in
Figure 8b, the highest peak current was recorded at 300 s, indicating that this duration allows for an optimal balance between ion accumulation and potential saturation effects. Consequently, a deposition time of 300 s was identified as the optimal parameter, striking a balance between maximizing the electrochemical response and ensuring reliable measurement accuracy.
In addition to the deposition time, the selection of an appropriate deposition potential is a critical factor in optimizing the sensitivity of the electrochemical detection system.
Figure 9a presents the effect of varying deposition potentials on the peak current response of Pb
2+ and Cd
2+. As shown in
Figure 9b, the peak current increased significantly within the potential range from −0.9 V to −1.1 V, reaching its maximum at −1.1 V. This trend suggests that more metal ions were successfully reduced and accumulated on the electrode surface within this potential range, leading to an enhanced stripping response. When the deposition potential was adjusted to values more negative than −1.1 V, a noticeable decrease in the peak current was recorded. This reduction can be primarily attributed to the onset of the hydrogen evolution reaction (HER) at highly negative potentials [
32], which results in the formation of gas bubbles on the electrode surface. The presence of these bubbles disrupts the uniform deposition of Pb
2+ and Cd
2+, reducing the effective electrode area and hindering ion accumulation. As the stripping peak currents for Pb
2+ and Cd
2+ reached their maximum at −1.1 V, this potential was determined to be the most effective for facilitating metal ion deposition. The selection of −1.1 V as the optimal deposition potential ensures enhanced sensitivity and accuracy in subsequent electrochemical analyses by maximizing ion accumulation while minimizing potential interference from competing reactions.
3.6.3. Simultaneous Detection of Heavy Metal Ions
The characteristic DPV peaks of Cd2+ and Pb2+ were determined through experimental measurements combined with the electrochemical theory. In the experiments, by recording the voltage changes and current responses of the electrode, distinct DPV peaks for Cd2+ at −0.8 V and for Pb2+ at −0.65 V were observed. The assignment of these peak potentials is based on the redox properties of the ions and their reaction kinetics at the electrode surface. The specific peak potentials for Cd2+ and Pb2+ arise from their different standard reduction potentials in the electrochemical system. Since Cd2+ exhibits a higher redox potential, its DPV peak appears at a more positive potential, while Pb2+, having a lower redox potential, shows its peak at a more negative potential.
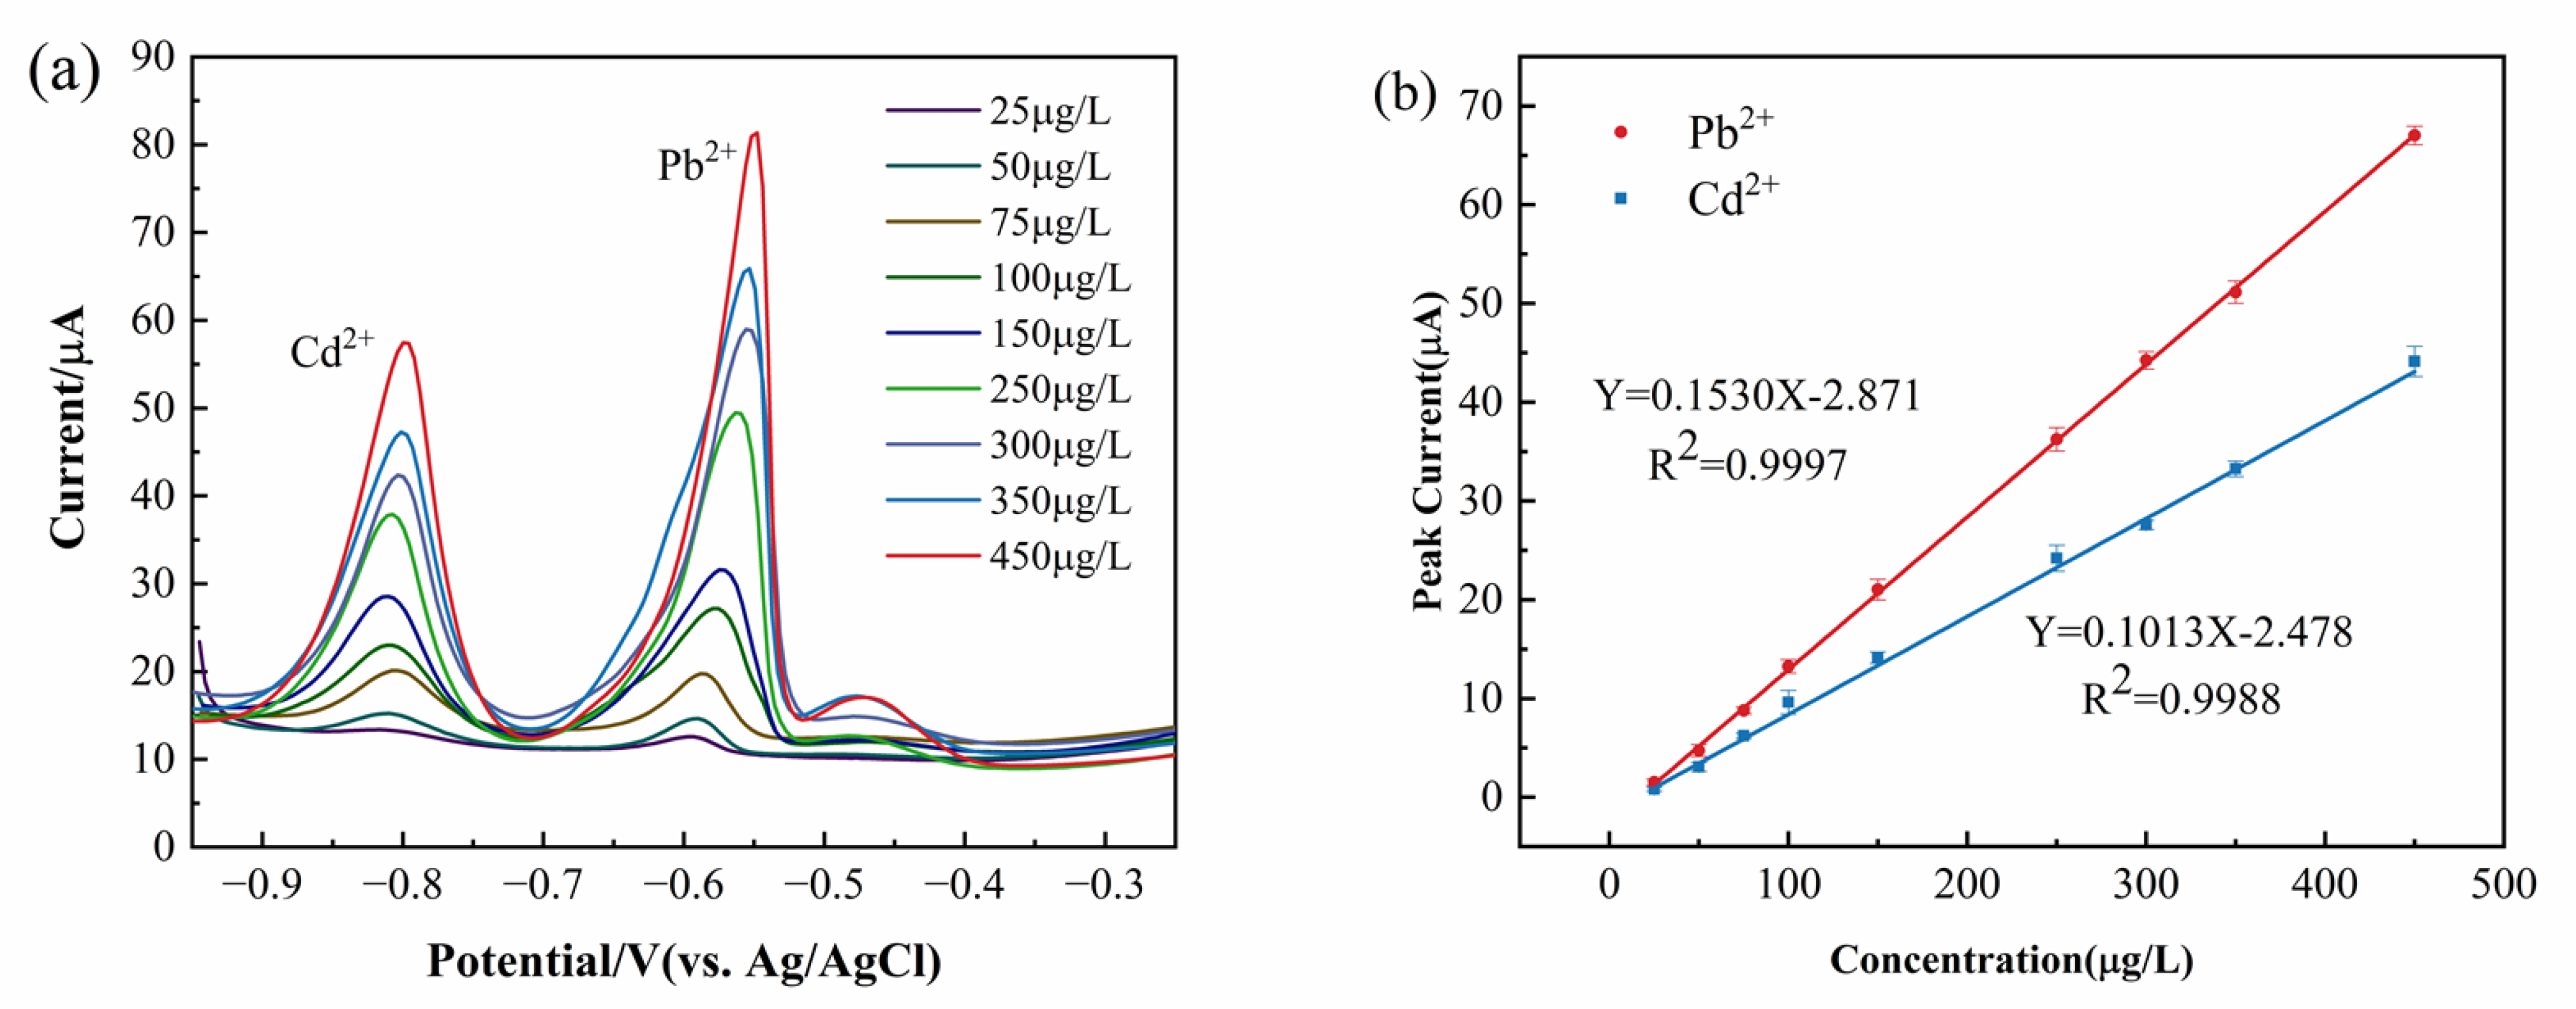
Figure 10a illustrates the relationship between the stripping peak current and concentration, while
Figure 10b presents the linear regression equations for Pb
2+ and Cd
2+. The linear regression equation for Pb
2+ is Y = 0.15303X − 2.8715 with a correlation coefficient of 0.99977, while that for Cd
2+ is Y = 0.10136X − 2.478 with a correlation coefficient of 0.9988. The LODs for Pb
2+ and Cd
2+ were determined to be as low as 0.354 μg/L and 0.535 μg/L, respectively.
3.7. Sensitivity Analysis
To further evaluate the detection performance of Pb
2+ and Cd
2+ electrodes, a comparative study of different electrodes was conducted. As shown in
Table 1, the developed G-COOH-MWCNTs/ZnO/GCE electrode was found to exhibit satisfactory comparability.
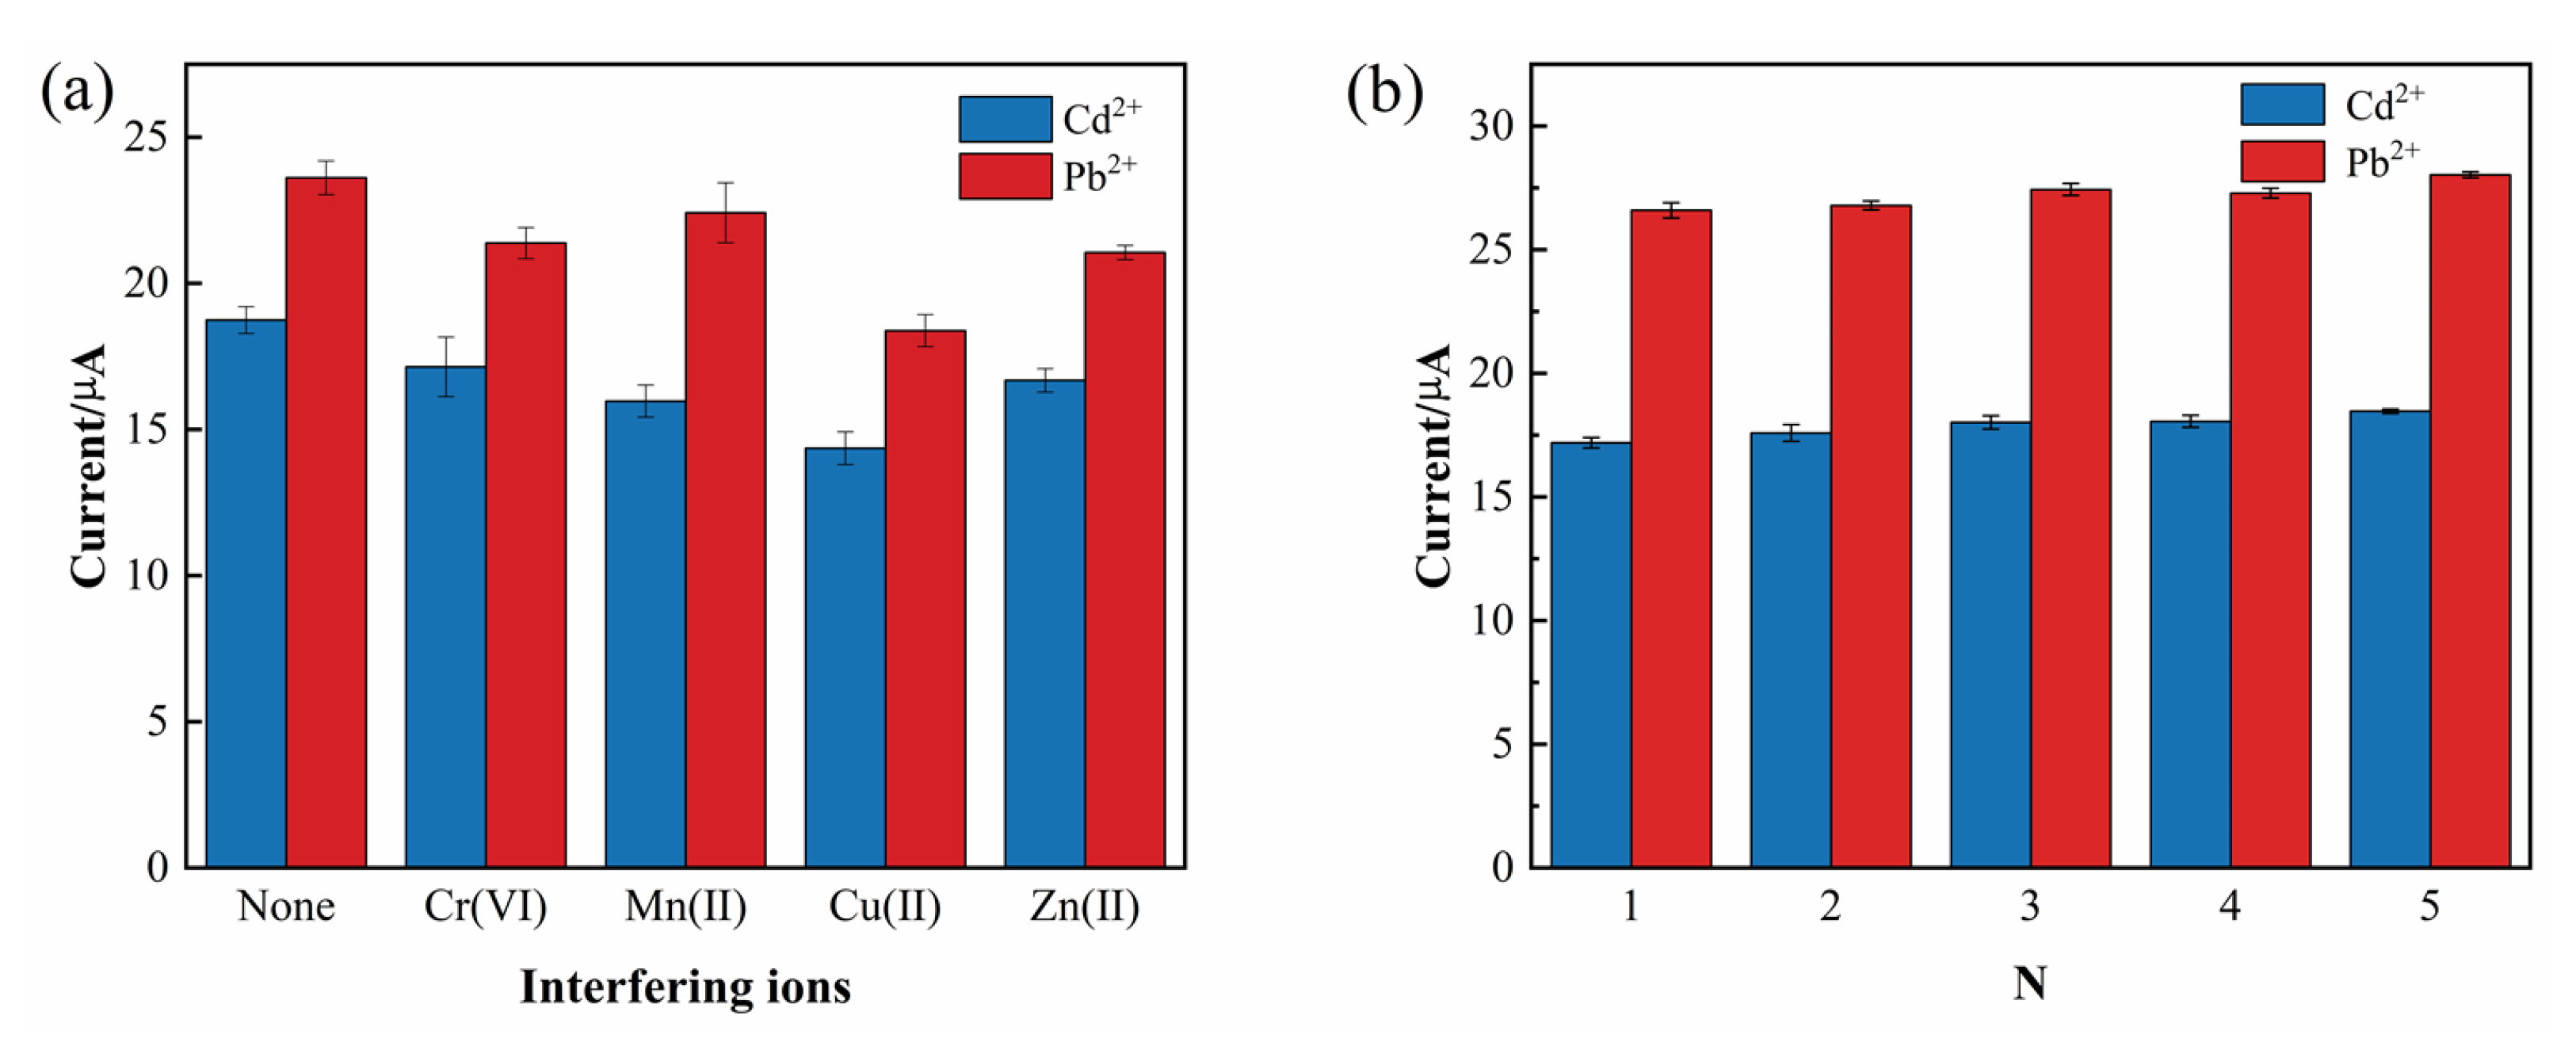
3.8. Anti-Interference and Repeatability
To further evaluate the detection capability and specificity of the G-COOH-MWCNTs/ZnO/GCE electrode, the influence of potential interfering ions on its performance was systematically investigated. This interference study is critical for assessing the electrode’s selectivity and reliability in complex sample matrices, where other metal ions commonly coexist with Pb2+ and Cd2+ and may compromise analytical accuracy. In this experiment, Cr6+, Mn2+, Cu2+, and Zn2+ ions were selected due to their frequent occurrence in environmental and industrial water samples. Each interfering ion was introduced at a 150-fold molar excess relative to the target analytes.
The DPV of Pb
2+ and Cd
2+ in the presence of these interfering ions are shown in
Figure 11a. The results demonstrate that Cu
2+ exerted the most significant inhibitory effect, reducing the peak currents of Pb
2+ and Cd
2+ by approximately 24% and 23%, respectively. Zn
2+ caused moderate decreases in peak currents of approximately 10% and 11%.
In addition to evaluating the anti-interference capability of the electrode, the reproducibility of the sensor was also investigated to verify its reliability across multiple measurements and different electrode devices. To this end, five independently modified G-COOH-MWCNTs/ZnO/GCE electrodes were fabricated, and each was tested under identical experimental conditions in an HAc-NaAc buffer solution containing 150 µg/L of Pb
2+ and Cd
2+, with all measurements performed in triplicate (
n = 3). As shown in
Figure 11b, the relative standard deviations (RSDs) of the peak current variations across the five electrodes are all less than 8.68%. This low RSD value demonstrates that the G-COOH-MWCNTs/ZnO/GCE sensor exhibits excellent reproducibility.
3.9. Stability
To assess short-term stability, six successive DPV measurements were conducted. As illustrated in
Figure 12a, the fluctuation in the peak current remains within 7.30% across the six consecutive tests, demonstrating the excellent short-term stability of the G-COOH-MWCNTs/ZnO/GCE. This minimal deviation in the current response suggests that the electrode maintains consistent performance even after repeated measurements. Such stability is critical to ensure the reproducibility and reliability of the sensor during frequent testing and iterative analysis.
Long-term stability, on the other hand, is equally important for assessing how well the electrode retains its performance over extended periods, especially for applications involving long-term environmental monitoring or infrequent use. To evaluate this, DPV measurements were performed on the same electrode over a 30-day period, with all experimental conditions kept constant. As illustrated in
Figure 12b, the peak current exhibits a slight decrease over the 30 days, which is a common phenomenon observed in electrochemical sensors due to factors such as the gradual degradation of the electrode material or the accumulation of non-ideal substances on the electrode surface. Despite this gradual decline, the variation in peak current was found to remain within 6.64%, indicating that the G-COOH-MWCNTs/ZnO/GCE electrode retains its electrochemical activity over a prolonged period. The relatively small change in the peak current demonstrates the excellent long-term stability of the sensor, confirming its suitability for long-term environmental monitoring or other applications where a consistent performance is critical.
Overall, the G-COOH-MWCNTs/ZnO/GCE electrode not only exhibits robust short-term stability, but also maintains a high level of performance over an extended period. This combination of short-term and long-term stability ensures that the sensor is reliable for routine analysis, with minimal signal degradation over time.
While the sensor demonstrates excellent stability and reproducibility, future studies could cross-validate its performance with ICP-MS or AAS to confirm accuracy in complex matrices with potential interferents. This would further solidify its applicability for real-world environmental monitoring.
4. On-Site Detection of Pb2+ and Cd2+ Using a Miniaturized Intelligent Mobile Detection Device
The miniaturized intelligent mobile detection device integrates an electrochemical sensing module with wireless communication technology, enabling the rapid on-site detection of Pb
2+ and Cd
2+ in seawater. The device adopts a modular design, consisting of a wireless potentiostat (lower unit) and an Android-based smart mobile terminal (upper unit). The two units communicate in real time via a low-power Bluetooth protocol, ensuring efficient data transmission and control. The detection system is compatible with a standard three-electrode configuration, and DPV measurements of Pb
2+ and Cd
2+ within a potential range from −1.1 to −0.4 V are shown in
Figure 13. The mobile application of the upper unit integrates signal acquisition, baseline correction, and peak current calibration functionalities, allowing for the real-time display of voltammetric curves and direct visualization of peak current values. Compared to traditional electrochemical workstations, this device achieves an 80% reduction in size (dimensions: 158 mm × 90 mm × 75 mm) and a 65% reduction in power consumption, eliminating the need for specialized personnel for operation. This feature makes it highly suitable for deployment in complex environments, such as coastal waters and ports within an Internet of Things (IoT) platform.
Sample Analysis
The Maowei Sea, located in southern Qinzhou, is a major water body within the Qinzhou Bay marine region, covering an area of approximately 135 km2. As a semi-enclosed inland sea, it is primarily influenced by the inflow of freshwater from two major rivers: the Qinjiang and Maoling Rivers. These rivers introduce a complex mixture of freshwater, nutrients, and various pollutants originating from surrounding industrial, agricultural, and urban areas, thereby significantly affecting the chemical composition and ecological quality of the seawater. Given its geographical location and hydrological characteristics, the Maowei Sea is classified as a coastal water body, where interactions between freshwater and seawater play a pivotal role in determining the overall biogeochemical dynamics.
Quantitative measurements were carried out using DPSV under optimized conditions, including a deposition potential of –1.1 V, a deposition time of 300 s, and other relevant experimental parameters. To ensure the repeatability and robustness of the method, each concentration level was measured in triplicate.
The results of the standard addition recovery test are summarized in
Table 2 and
Table 3. The recovery rates for Pb
2+ and Cd
2+ ranged from 97.7% to 103% and from 97% to 106.1%, respectively, demonstrating the high accuracy and precision of the method. These findings confirm that the G-COOH-MWCNTs/ZnO-modified electrode is a reliable and effective tool for the detection of trace Pb
2+ and Cd
2+ ions in real seawater samples.

 ,
, 


