Article

Integrating In Situ Non-Destructive Techniques and Colourimetric Analysis to Evaluate Pigment Ageing and Environmental Effects on Tibetan Buddhist Murals

1
Key Laboratory of Archaeomaterials and Conservation, Ministry of Education, Institute of Cultural Heritage and History of Science & Technology, University of Science and Technology Beijing, Beijing 100083, China
2
Chilechuan Museum, Tumd Youqi 014100, China
3
National Centre for Archaeology, Beijing 100013, China
*
Author to whom correspondence should be addressed.
Chemosensors 2025, 13(6), 202; https://doi.org/10.3390/chemosensors13060202
Submission received: 2 April 2025 / Revised: 19 May 2025 / Accepted: 29 May 2025 / Published: 2 June 2025

Abstract

:
The colour degradation of murals presents a significant challenge in the conservation of architectural heritage. Previous research has often concentrated on localized pigment changes while paying insufficient attention to the interaction between colour variation and indoor environmental conditions. Although non-destructive analytical techniques are widely used in heritage studies, their integrated application in combination with colourimetry has been limited, particularly in the context of Tibetan Buddhist murals in highland continental climates. This study investigates the murals of Liuli Hall in Meidai Lamasery, Inner Mongolia, as a representative case. We employed a comprehensive methodology that combines non-destructive analytical tools, gas chromatography–mass spectrometry, and quantitative colour analysis to examine pigment composition, binding material, and surface deterioration. Through joint analysis using the CIE Lab and CIE LCh colour space systems, we quantified mural colour changes and explored their correlation with material degradation and environmental exposure. The pigments identified include cinnabar, atacamite, azurite, and chalk, with animal glue and drying oils as binding materials. Colourimetric results revealed pronounced yellowing on the east and west walls, primarily caused by the ageing of organic binders. In contrast, a notable reduction in brightness on the south wall was attributed to dust accumulation. These findings support tailored conservation measures such as regular surface cleaning for the south wall and antioxidant stabilization treatments for the east and west walls. Initial cleaning efforts proved effective. The integrated approach adopted in this study provides a replicable model for mural diagnostics and conservation under complex environmental conditions.

1. Introduction

The preservation of cultural heritage around the world, especially murals, faces great challenges because of environmental and human factors. The damage to murals is one of the biggest problems in heritage conservation today [1]. Mural paintings are valuable artworks. Changes in their colour not only affect the beauty and historical accuracy of cultural heritage but also affect people’s shared memory. Therefore, the colour deterioration of murals is an important problem that cannot be ignored [2].
In recent years, a variety of non-destructive analysis techniques has been widely used in the international academic community. In situ non-invasive analysis offers a safer, rapid, non-destructive, and more convenient approach to analyzing various mural components. In situ non-invasive analysis can also integrate compositional, structural, and morphological information to reconstruct mural production processes and historical restoration interventions. These methods, such as multi-spectral and hyperspectral imaging (HSI), X-ray fluorescence (XRF), fibre optic reflectance spectroscopy (FORS), and portable Raman spectroscopy, are often used in combination to achieve comprehensive results [3,4,5,6,7].
vHSI is a detection method that combines spectral acquisition with target imaging. Utilizing imaging spectroscopy technology, it enables the spectral imaging of a single target across continuous spectral bands. This approach integrates spatial, radiometric, and spectral information, significantly enhancing the dimensionality of target observation. Fischer and Kakoulli [8] have highlighted that HSI, as a non-destructive analytical method, can effectively provide valuable data for artefact analysis. It facilitates the spatial mapping of pigment compositions, biological changes, and restoration traces, offering crucial insights for conservation and research. Costanza Cucci et al. [9] utilized HSI to study frescoes and inscriptions from the archeological site of Pompeii, Italy. Their research demonstrated the effectiveness of hyperspectral spectroscopy in identifying painting materials and mapping their distribution in frescoes. Additionally, for the inscriptions, HSI demonstrated its utility in improving the visibility of faded sections, facilitating subsequent examination. Ning Pan et al. [10] proposed a method for extracting faded mural patterns from HSI, demonstrated on murals from Tang Dynasty tombs. Tingting Li et al. [11] suggest an image spectral fusion (ISF) method that integrates HSI technology with superpixel segmentation, data augmentation, and spectral preprocessing techniques.
Multi-spectral imaging (MSI) combines the use of digital CCD or CMOS sensors coupled with filters in several wavelength bands to capture digital images from the ultraviolet, visible, and infrared ranges. Multi-spectral imaging provides preliminary insights into pigment distribution, application techniques, underpainting information, and restoration traces, which are crucial for recognizing ancient artefacts [12]. A wide range of multi-spectral imaging applications has been investigated [13,14,15]. For example, Christine Bläuer and Annette T. Keller employed MSI to identify pigments in Carolingian wall paintings in the Chapel of the Holy Cross of Müstair [16]. Chai Bolong et al. [17] used MSI to obtain infrared-reflected pseudocolour, ultraviolet-reflected pseudocolour, and ultraviolet-illuminated images of a mural. These images provide valuable insights for studying the pigment discolouration and fading phenomenon.
FORS is a safe, convenient, fast, and non-destructive technique for pigment analysis. It collects diffuse reflectance spectrum data over the ultraviolet, visible, and infrared ranges of the subject. Eleni Cheilakou et al. [18] used fibre optic reflectance spectroscopy to analyze pigments in Byzantine frescoes and compared it with standard laboratory analysis results. The data obtained confirm the efficacy of the FORS technique in pigment identification, highlighting the instrument mobility features, which are crucial in archeological research.
Portable XRF is a common technique for elemental analysis that quantifies the energy and intensity of X-ray emissions. It has been employed for many years to identify pigments in murals [19]. Maria Francesca Alberghina et al. [20] conducted a diagnostic investigation using XRF and FORS on twelfth-century Byzantine wall paintings preserved in the Museum of Byzantine and Norman Culture and Figurative Arts of San Marco d’Alunzio. Michela Ricca et al. [21] applied a portable XRF for the analysis of the elemental composition of fresco pigments and provided information for restoration intervention.
The integration of several analytical techniques is becoming increasingly important in the field of mural analysis. Letizia Bonizzoni et al. [22] employed digital optical microscopy (OM), XRF, FORS, Fourier transform infrared spectroscopy in the external reflection mode (ER-FTIR), and Raman spectroscopy to analyze the murals. These techniques were applied to selected points based on image analysis results and available records of previous interventions, aiming to characterize the original and restoration materials. Antonino Cosentino et al. [23] demonstrated the application of MSI, XRF, and FORS for the identification of mural pigments, revealing the painting processes and pigments employed in murals. John K. Delaney et al. [24] employed hyperspectral cameras, FORS, and μXRF to reveal the composition of pigments and specific paint variations in paintings, including those applied by the original artist on drawings and markings or by subsequent restorers. Jessica Brocchieri et al. [25] used XRF, multi-spectral imaging, and scanning electron microscope/energy dispersive spectroscopy (SEM/EDS) to analyze the manufacturing methods, pigment utilization, and fixative sprays in an oil painting.
Although case studies from the Ming and Qing dynasties comparable to the present research are limited, several relevant works have been reported. For example, A. Lluveras-Tenorio et al. [26] identified organic materials used in the paintings of the Five Northern Provinces’ Assembly Hall. Their results revealed the presence of protein-based binders (such as animal glue and egg), carbohydrate materials (fruit tree gum), and drying oils in different paint layers. Indigo was identified as the main pigment, providing valuable insight into the painting techniques employed. In another study, Gele Teri et al. [27] conducted a comprehensive analysis of nine samples taken from the beams and ceiling paintings inside the main hall of Puren Temple. Using polarized light microscopy (PLM), energy-dispersive X-ray fluorescence spectroscopy (ED-XRF), micro-Raman spectroscopy (m-RS), and X-ray diffraction (XRD), they identified the pigments used on the beams as cinnabar, lead white, lapis lazuli, and lime green. The ceiling paintings contained cinnabar, orpiment, lead white, lapis lazuli, and lime green, with animal glue applied as the binding medium. These studies offer valuable references for material characterization and conservation strategies for murals from the same historical period.
Although HSI, XRF, and other non-destructive analytical techniques have been widely used internationally in recent years to study mural deterioration, there is a lack of comprehensive analytical methods that quantitatively correlate pigment composition and colour changes, resulting in a lack of in-depth scientific understanding of the mechanism of colour deterioration.
From a macro-architectural perspective, it is important for international heritage conservation science to study how indoor and outdoor building environments, such as airflow, temperature, humidity, and light, damage mural colours [28,29,30]. Daisuke Ogura et al. [31] studied the damage to murals in Cave 285 caused by humidity, temperature, and light. They conducted controlled experiments using simulated mural samples. M. Veneranda et al. [32] studied the environmental factors affecting the murals of Pompeii. They used in situ methods to find out how humidity, pollution, biological damage, and other forms of damage influenced the murals. Juanli Wang et al. [33] analyzed the composition of the dust from a microscopic perspective using ICP-MS, IC, and XRD techniques. The results revealed the factors responsible for the loss of original tone, fading, blurring, or darkening of the painted layer. These studies commonly employ methods such as data logging, environmental sensors, image-based monitoring, and colourimetric tracking to illustrate how environmental factors contributing to mural deterioration can be effectively monitored [34]. These studies provide some reference for combined macro and micro-studies.
In this paper, we propose a new integrated methodology for the scientific analysis and restoration planning of mural paintings, applied to the Liuli Hall murals at Meidai Zhao Temple in Inner Mongolia, a representative example of Tibetan Buddhist wall paintings. This methodology integrates in situ non-destructive analysis, binding material analysis, and quantitative colourimetry in the CIE Lab colour space to construct a model linking pigment composition to mural colour change. Our results show that colour alteration is influenced by pigment properties as well as environmental conditions and previous conservation treatments. By quantifying these factors using colourimetric data, the methodology provides a scientific understanding of deterioration mechanisms and supports data-driven restoration planning. This methodology was applied to actual restoration works and yielded beneficial results. It is straightforward to implement, scalable, and has strong potential for broad application at similar heritage sites worldwide. Therefore, the present research is of academic significance and practical value in the field of cultural heritage preservation.
The methodology for scientific analysis and restoration planning of mural paintings comprises a sequence of activities, as presented in the flowchart of Figure 1.

2. Materials and Methods

2.1. Overview of the Murals in Liuli Hall and Sampling Locations

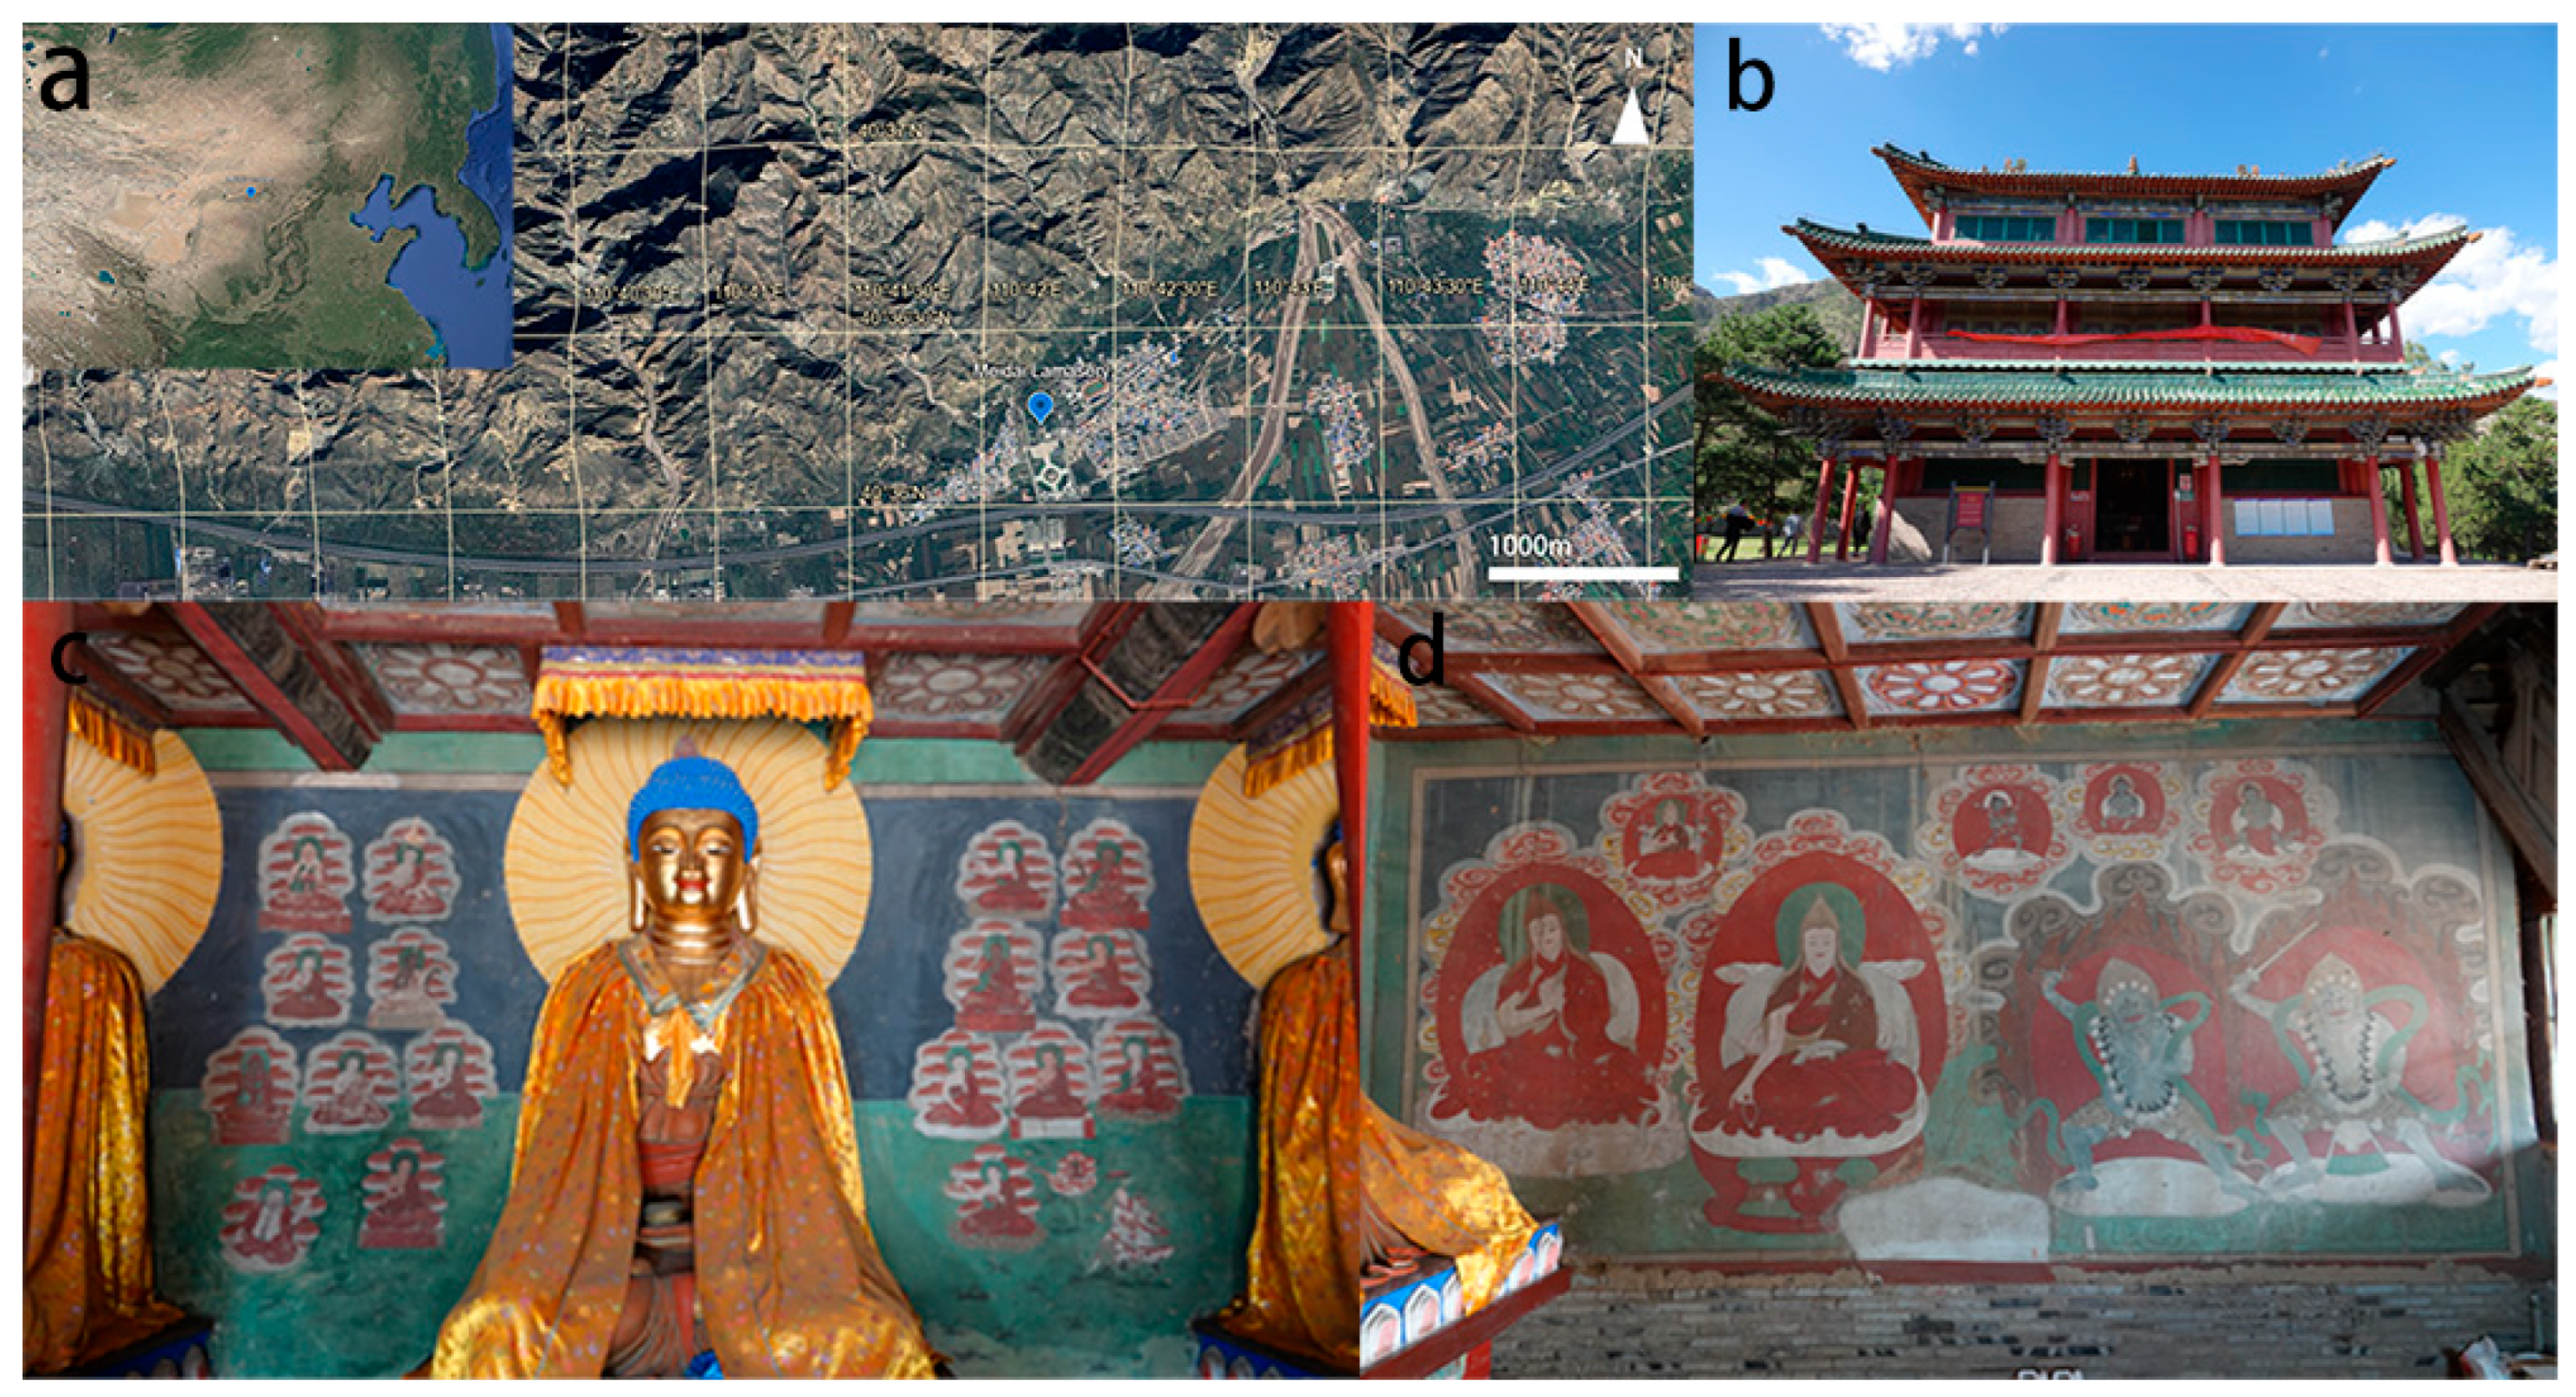
Meidai Lamasery is located in Meidaizhao Town, Tumoteyouqi (土默特右旗), Baotou City, and has been designated as China’s fourth batch of key cultural relics (Figure 2). It was the first temple established in the Mongolian region after Tibetan Buddhism was adopted. It signifies the introduction of Tibetan Buddhist art to the area. The Meidai Lamasery, known as the “ Inner Mongolia Mural Art Museum “, possesses substantial historical value for the study of Mongolian history, Buddhism, architecture, and art during the Ming Dynasty. The murals of Liuli Hall at Meidai Lamasery, created during the Ming Dynasty and painted between the 40th and 42nd years of the Wanli reign (1612–1614), are distinguished by their vibrant colours, smooth lines, and lively expressions of the Buddha statue [35]. The murals illustrate the profound teachings of Buddhism and are considered to be a showcase of the exceptional craftsmanship of the painters. These murals, primarily featuring themes of Tibetan Buddhism, distinctly depict the cultural and artistic exchanges among Mongols, Tibetans, Han Chinese, Manchus, etc. Furthermore, they reflect the Mongolian integration of Han cultural traditions and Tibetan Buddhist aesthetics, resulting in a distinctive artistic style.
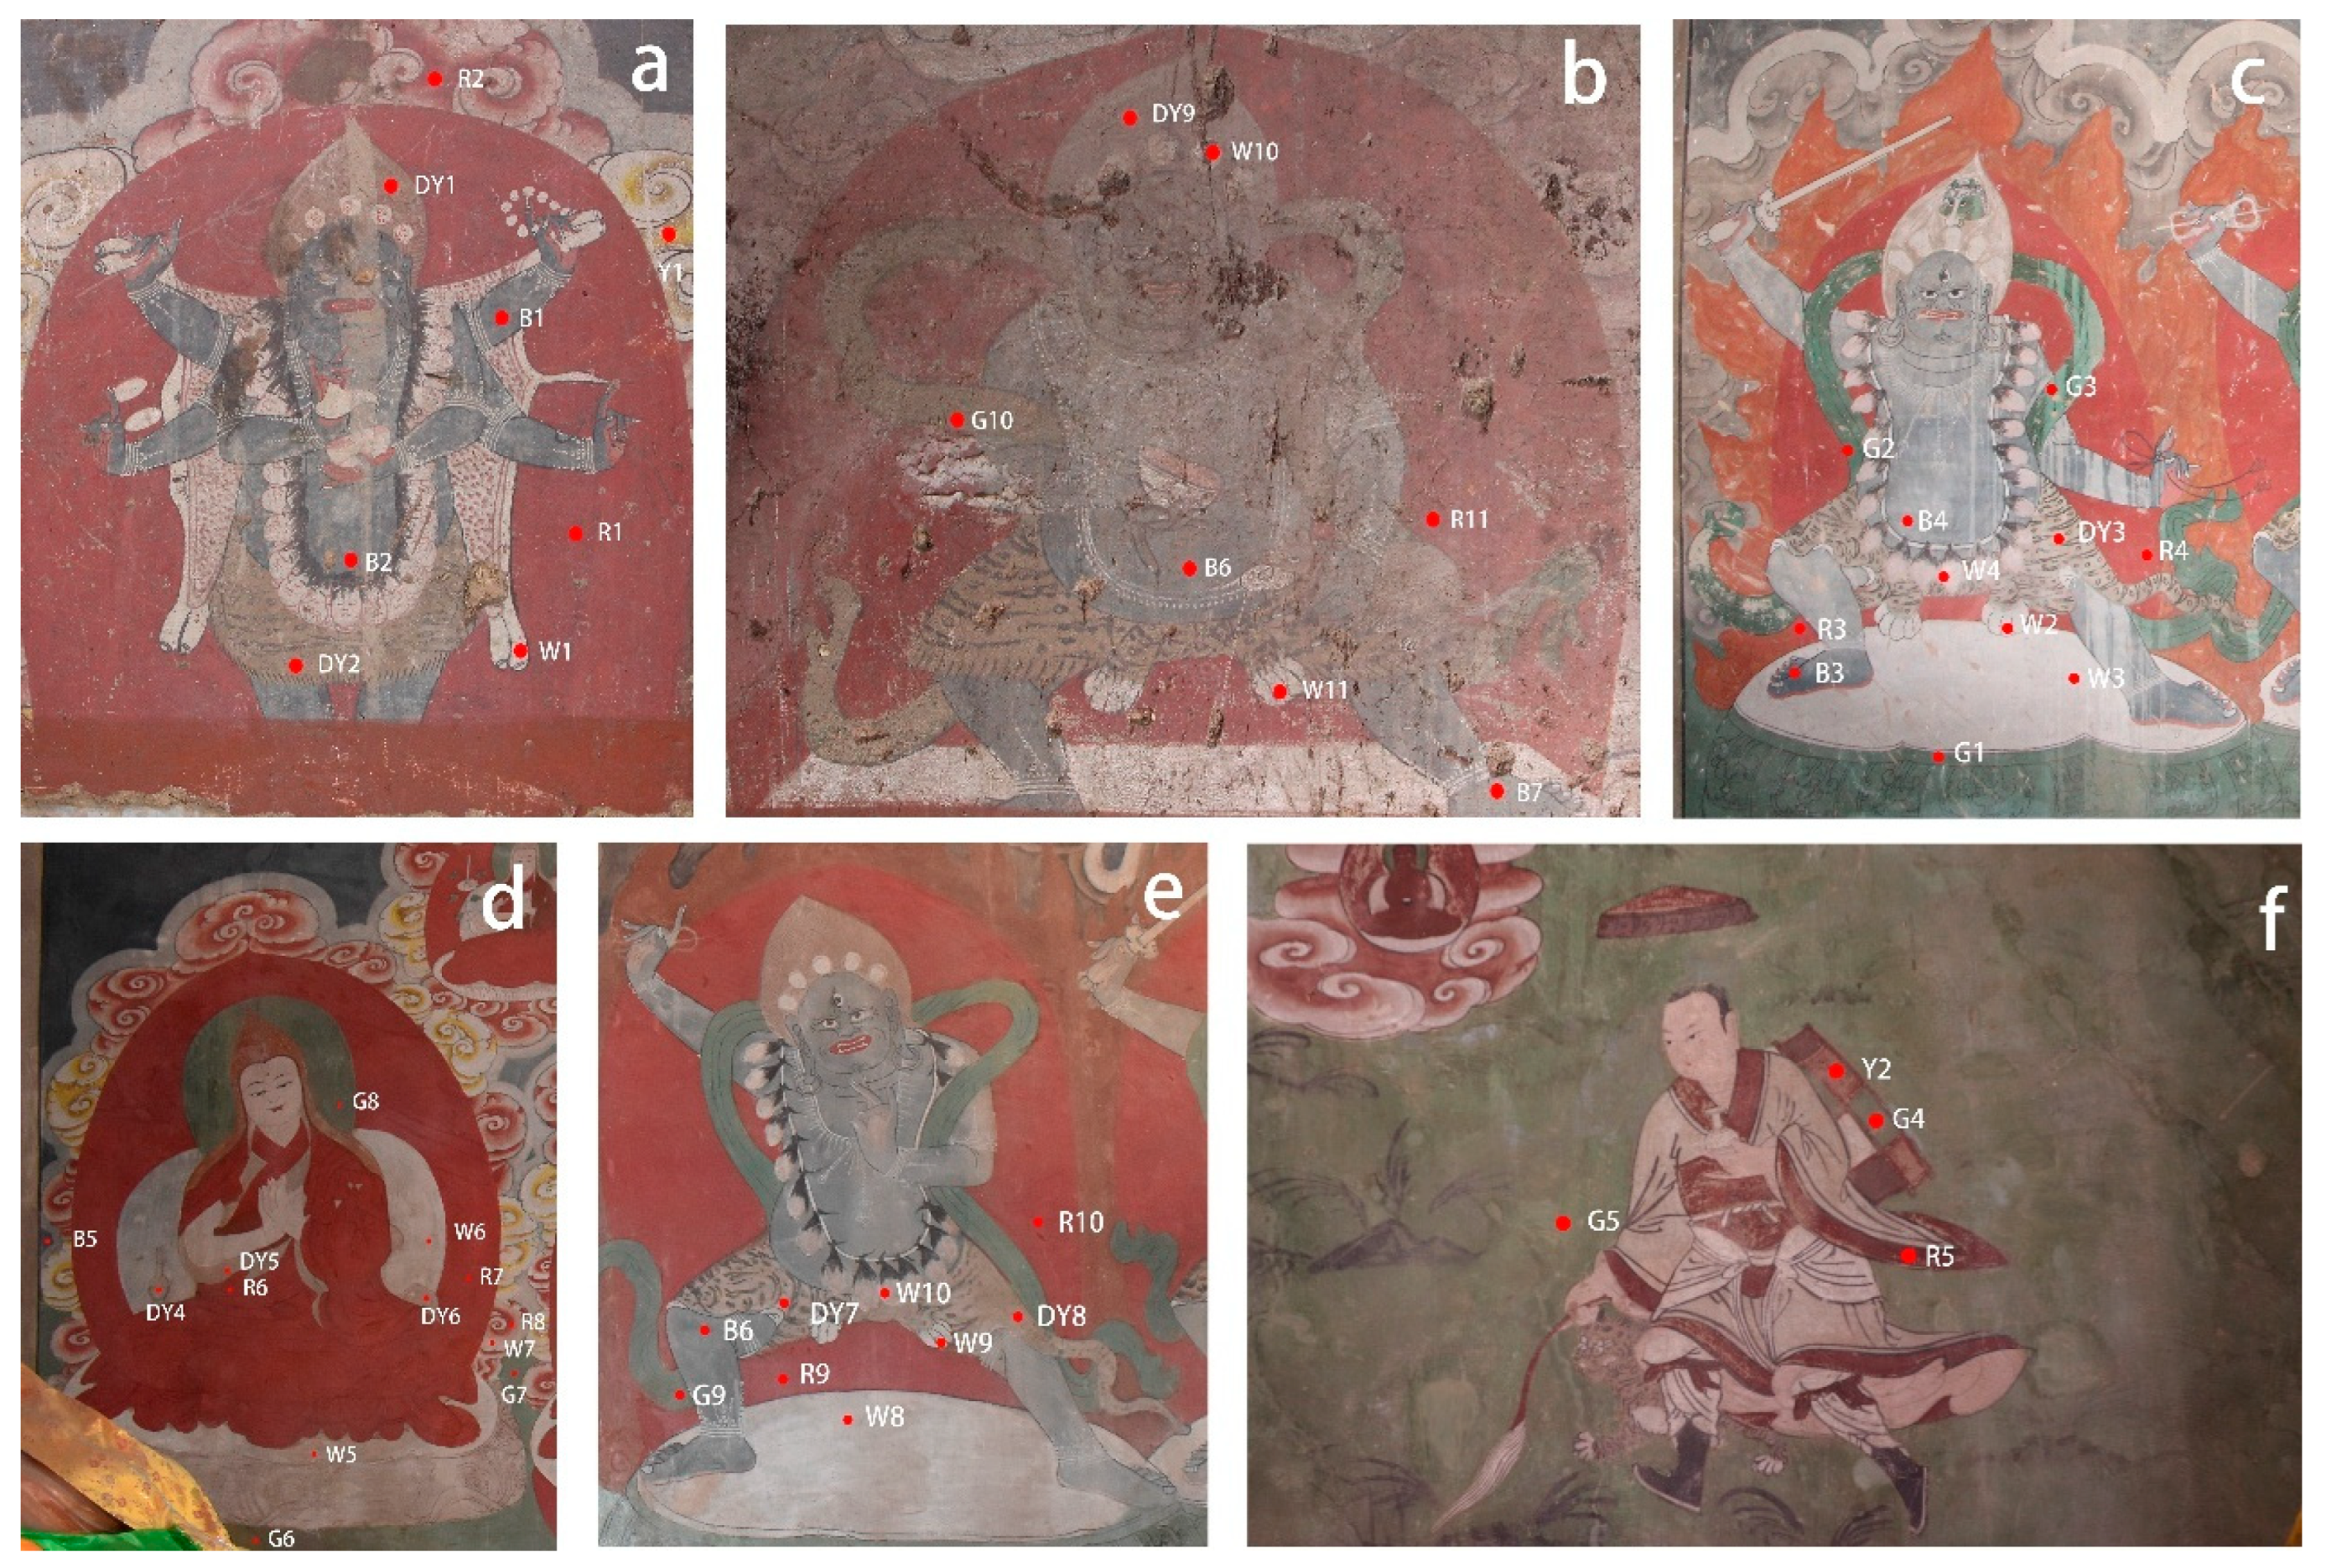
The representative areas of the murals in Liuli Hall of Meidai Lamasery were selected for sampling, which were dust accumulation areas on the left part of the south wall (Figure 3a), the right part of the south wall (Figure 3b), fading area (Figure 3c), unfaded area (Figure 3d,e), and historical restoration area (Figure 3f). The distribution of sampling points is shown in Figure 3.

2.2. Analytical Instruments and Method

2.2.1. HSI Instrumentation Parameters and Image Processing

A portable hyperspectral camera (SPECIM-IQ, Konica Minolta), a line scan camera manufactured by SPECIM of Finland, was used. The system consists of a front lens, an imaging spectrograph, and an image sensor. It is based on Specim’s push-broom technology, namely, line scan cameras. The system consists of a front lens, an imaging spectrograph, and an image sensor. The following are specifications of the technology: spectral range of 400–1000 nm, spatial sampling of 512 pix, spectral resolution of 7 nm, producing 204 spectral band images, and image resolution of 512 × 512 pix. The white board is made of PTFE, a white light reference board material with 100% reflectivity in the Specim IQ wavelength range. The white reference panel material has 100% reflectivity in the wavelength range of Specim IQ. The used light source is a 2700 K tungsten halogen lamp, emitting wavelengths ranging from 400 to 2500 nm.
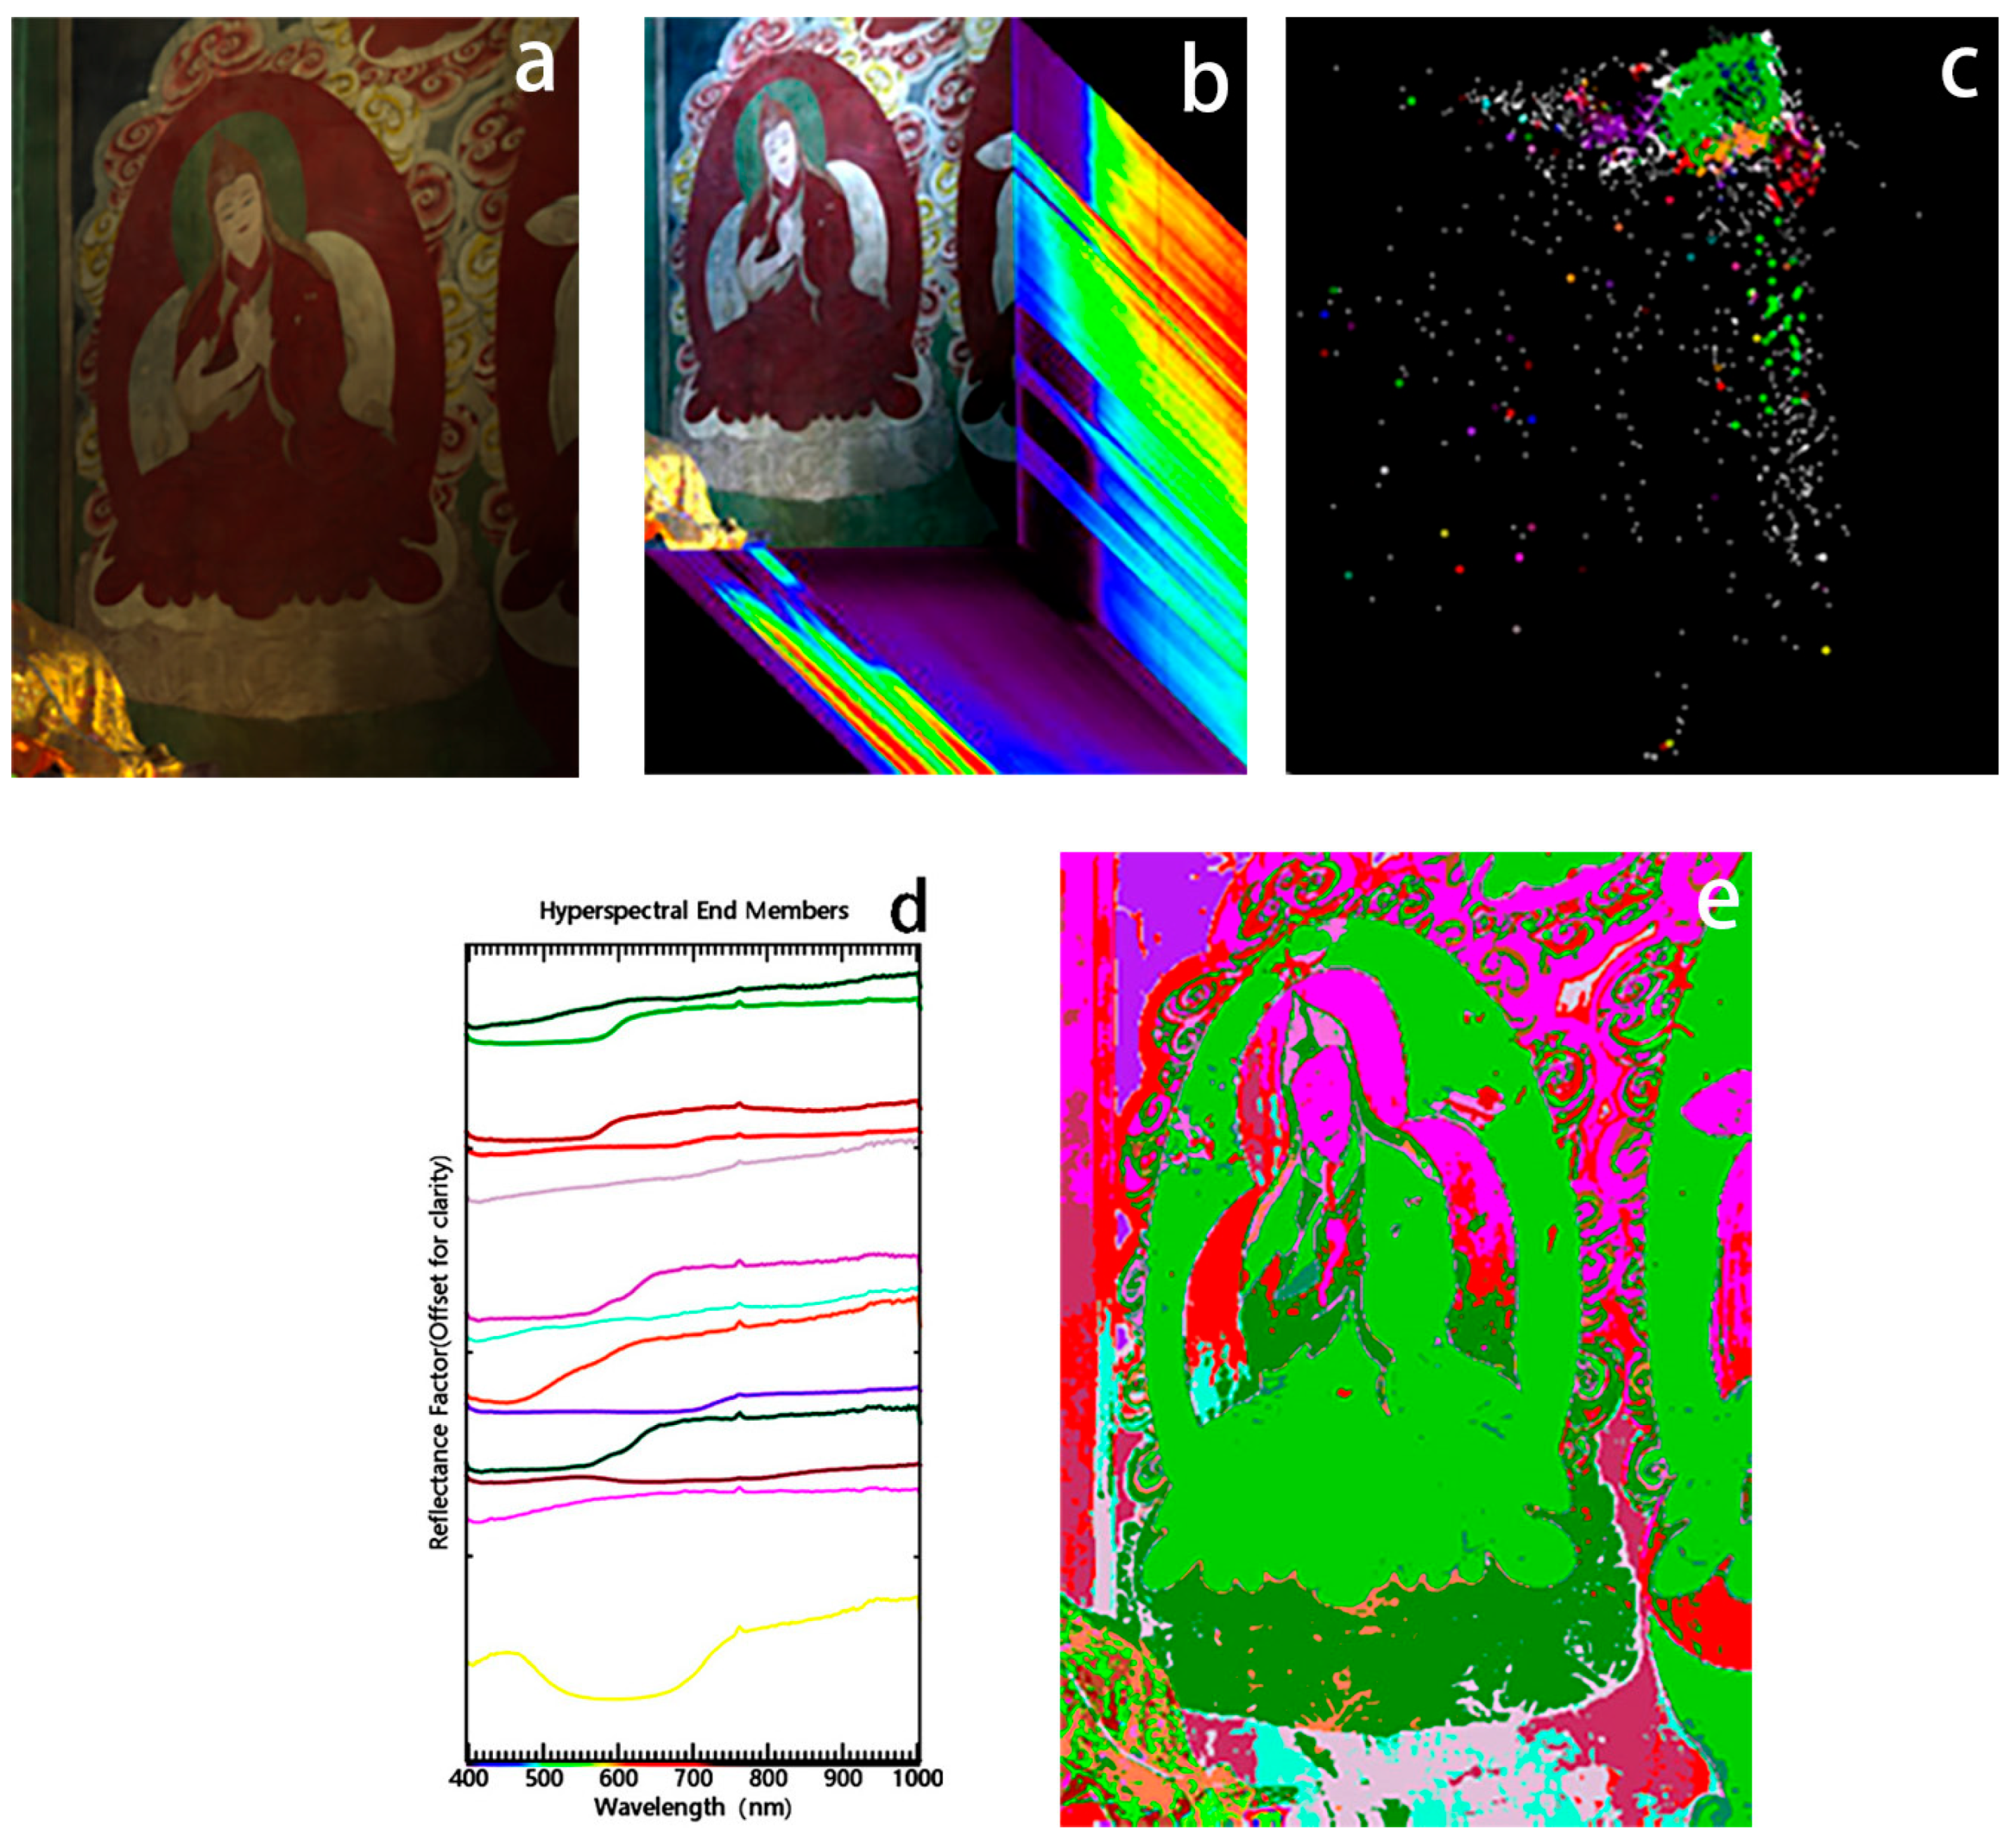
The processing workflow of hyperspectral images is as follows: Firstly, non-destructive identification of the mural pigments was carried out using HIS techniques to reveal the specific distribution and material composition of the pigments on the surface of the mural. In this section, a spectral cube of the mural’s unfaded area, the image of Master Atisha (Figure 4a) in tLiuli Hall of Meidai Lamasery, was acquired through a hyperspectral camera, producing a cube image for analysis (Figure 4b). The calibration was conducted in simultaneous mode on a standard whiteboard. Spectral image processing was performed with ENVI’s Spectral Hourglass Wizard mode. The first 30 MNF feature images were extracted from a cube of 204 bands, and pixel purity index (PPI) maps were obtained using 100,000 iterations with a threshold of 1 to find the most important pixels in the painting. Clustering was performed using the Nd-visualizer algorithm (Figure 4c) to obtain 13 endmember spectra (Figure 4d). To obtain information on the spatial distribution of the spectral endmember (Figure 4e), the spectral angular mapping (SAM) algorithm was used. Pigment composition and spatial distribution were determined by comparing the reflectance spectra of the endmember with a database of published mineral spectra and FORS data collected in situ.

2.2.2. MSI Equipment Specifications and Imaging Setup

The Canon 200D digital camera modification enhanced the sensitivity of the CMOS sensor by removing built-in UV/IR block filter from the RGB colour filter array and then equipped it with a CMOS sensor (size 22.3 × 14.9 mm) with a resolution of 24.2 megapixels, enabling it capable of recording UV, visible light, and near-IR radiation (360–1000 nm) (Table 1). The camera was calibrated with the X-Rite ColorChecker Passport, the industry standard colour reference target for generating DNG profiles for colour management, allowing for the evaluation of specific colours. The images were captured in camera RAW format and subsequently colour-corrected using the aforementioned camera profile.

2.2.3. FORS Instrumentation and Spectral Parameters

Terra Spec 4 Hi-Res Mineral Spectrometer, Malvern Panalytical: wavelength range was from 350 nm to 2500 nm. The spectral resolution was less than 3 nm in the VNIR range and less than 6 nm in the SWIR range. The spot size was 10 mm, and the average acquisition time was less than 4 s. Halogen bulb colour temperature was 2900 K, and standard whiteboard correction was used.

2.2.4. XRF Instrumentation and Analytical Conditions

The portable XRF spectrometer (Niton XL3t 800, Thermo Scientific, Waltham, MA, USA) was used for in situ elemental analysis. The measurements were performed with a tube voltage of 50 kV, a current of 40 μA, and a silver (Ag) anode target. The acquisition time was set to 60 s per point. All measurements were conducted under identical conditions to ensure consistency. The instrument was operated in mining mode with built-in calibration, and no additional sample preparation was required. In the following sections, “XRF” is used in place of “portable XRF” for consistency and clarity.

2.2.5. Py-GC/MS Analysis

Pyrolysis gas chromatography–mass spectrometry analysis was performed using a Multi-Shot Pyrolyzer PY-3030D (Frontier Laboratories, Koriyama, Japan) linked with a gas chromatograph GC-2010 (Shimadzu, Kyoto, Japan). A laboratory analytical balance (BSA224S, 0.1 mg/0.0001 g, Sartorius, Göttingen, Germany) was used to weigh 0.2 mg of the sample, which was placed into a sample cup with tweezers. The sample cup was placed in an AS-1020E autosampler (Frontier Laboratories, Japan). The pyrolysis temperature was 600 °C, the time was 12 s, the syringe temperature was 290 °C, and the temperature of the connection interface between the syringe and the chromatograph was 315 °C. The heating scale was designed to match previously reported thermal behaviour of similar binding media in murals, allowing for consistent compound identification [36]. The initial temperature of the column was 35 °C and held for 1.5 min. It increased to 100 °C at a rate of 60 °C/min, then increased to 250 °C at a rate of 14 °C/min, finally increased to 315 °C at a rate of 6 °C/min, and held for 5 min. The carrier gas for the GC-2010 was high-purity helium, and the inlet pressure was 104.2 Kpa with a shunt ratio of 1:30. The electronic pressure control system was used in constant flow mode, the mass spectrometer was operated by EI ionization with an ionization energy of 70 eV, and the sweep range of mass-to-charge ratio was from 35 to 500, with a cycle time of 0.3 s. The mass spectral libraries of the identified compounds were NIST17 and NIST17s.

2.2.6. Surface Flatness and Microstructure Observation

Surface morphology and flatness of the mural pigment layer were examined using a digital microscope (Model VHX-6000, KEYENCE, Osaka, Japan). The instrument provides high-resolution 3D imaging and profilometric analysis, enabling accurate assessment of surface undulations and microstructural features. Prior to measurement, the base of the sample was gently polished to ensure stability during scanning. The resulting surface profiles and roughness parameters were used to evaluate the degree of flatness and its potential influence on optical reflectance and colourimetric readings.

2.2.7. Colour Measurement Method and Data Processing

The measurements were performed using a KONICA MINOLTA CM-26d spectrophotometer equipped with a D65 light source, operating in SCI measurement mode, with an 8 mm measurement aperture, a measurement angle of 8°, a reflectance resolution of 0.001%, and a spectral range of 360 to 740 nm. Three in situ measurement points were used for each sample. The average values were taken and used for calculations. To obtain the colour characteristics of the samples, both the CIE Lab colour space and its polar coordinate counterpart, CIE LCh, were used. The CIE LCh space is the polar representation of CIE Lab and provides a more intuitive description of chroma and hue, making it particularly suitable for analyzing colour distribution. Therefore, both coordinate systems were adopted in this study to enhance the accuracy and interpretability of colour evaluation. L represents the lightness component, ranging from 0 to 100; a denotes the red–green axis, with positive values indicating a shift toward red and negative values toward green; and b corresponds to the yellow–blue axis, where positive values indicate yellow and negative values indicate blue. The typical value ranges for a and b are approximately from −128 to 127 [37]. In the LCh model, L refers to lightness, which is identical to the lightness component in the LAB colour space. C represents chroma, describing the colour’s saturation or intensity, while h denotes the hue angle, usually expressed in degrees from 0 to 360, 0° represents red, 90° represents yellow, 180° represents green, and 270° represents blue [38], helping to identify different colour schemes, thus converting CIE Lab to CIE LCh values. Finally, the magnitude of the colour difference transformation before and after the sample is expressed as ∆E.
Δ E * = Δ L * 2 + Δ a * 2 + Δ b * 2

2.2.8. K-Means Clustering Algorithm

The area of each colour used in the mural was obtained through clustering. K-Means is an unsupervised classification method. The dataset was divided into K clusters such that data points within the same cluster are as similar as possible, and data points between different clusters are as different as possible. For each sample point in the dataset, calculate its Euclidean distance to the centre of each cluster and assign the sample point to the cluster with the closest distance. Calculate the new centre of each cluster, which is the mean of all points in the cluster. Subsequently, the category of each pixel is held constant, while the loss function is reduced by adjusting the position of the centre point. This iterative process continues until the loss function monotonically decreases to a minimum value. At this point, the centroids and pixel categories converge simultaneously, yielding the cluster mean value called K-Means value and colour classification for the final colour data [39]. The objective of the K-Means algorithm is to divide the given dataset into K clusters, and the optimization objective is to minimize the following function:
J = i = 1 n k = 1 K I z i = k x i μ k 2
I(zi = k) is the indicator function that represents the data point Xi, whether or not it belongs to the cluster K. Xi refers to the data points, which represent pixels in the image. The centre of cluster k is the representative position of that cluster, and K denotes the total number of clusters. Because there are ten distinct colours in the mural, K is set to 10 in this study.

3. Results

3.1. Material Analysis and Historical Interventions

3.1.1. HSI Results

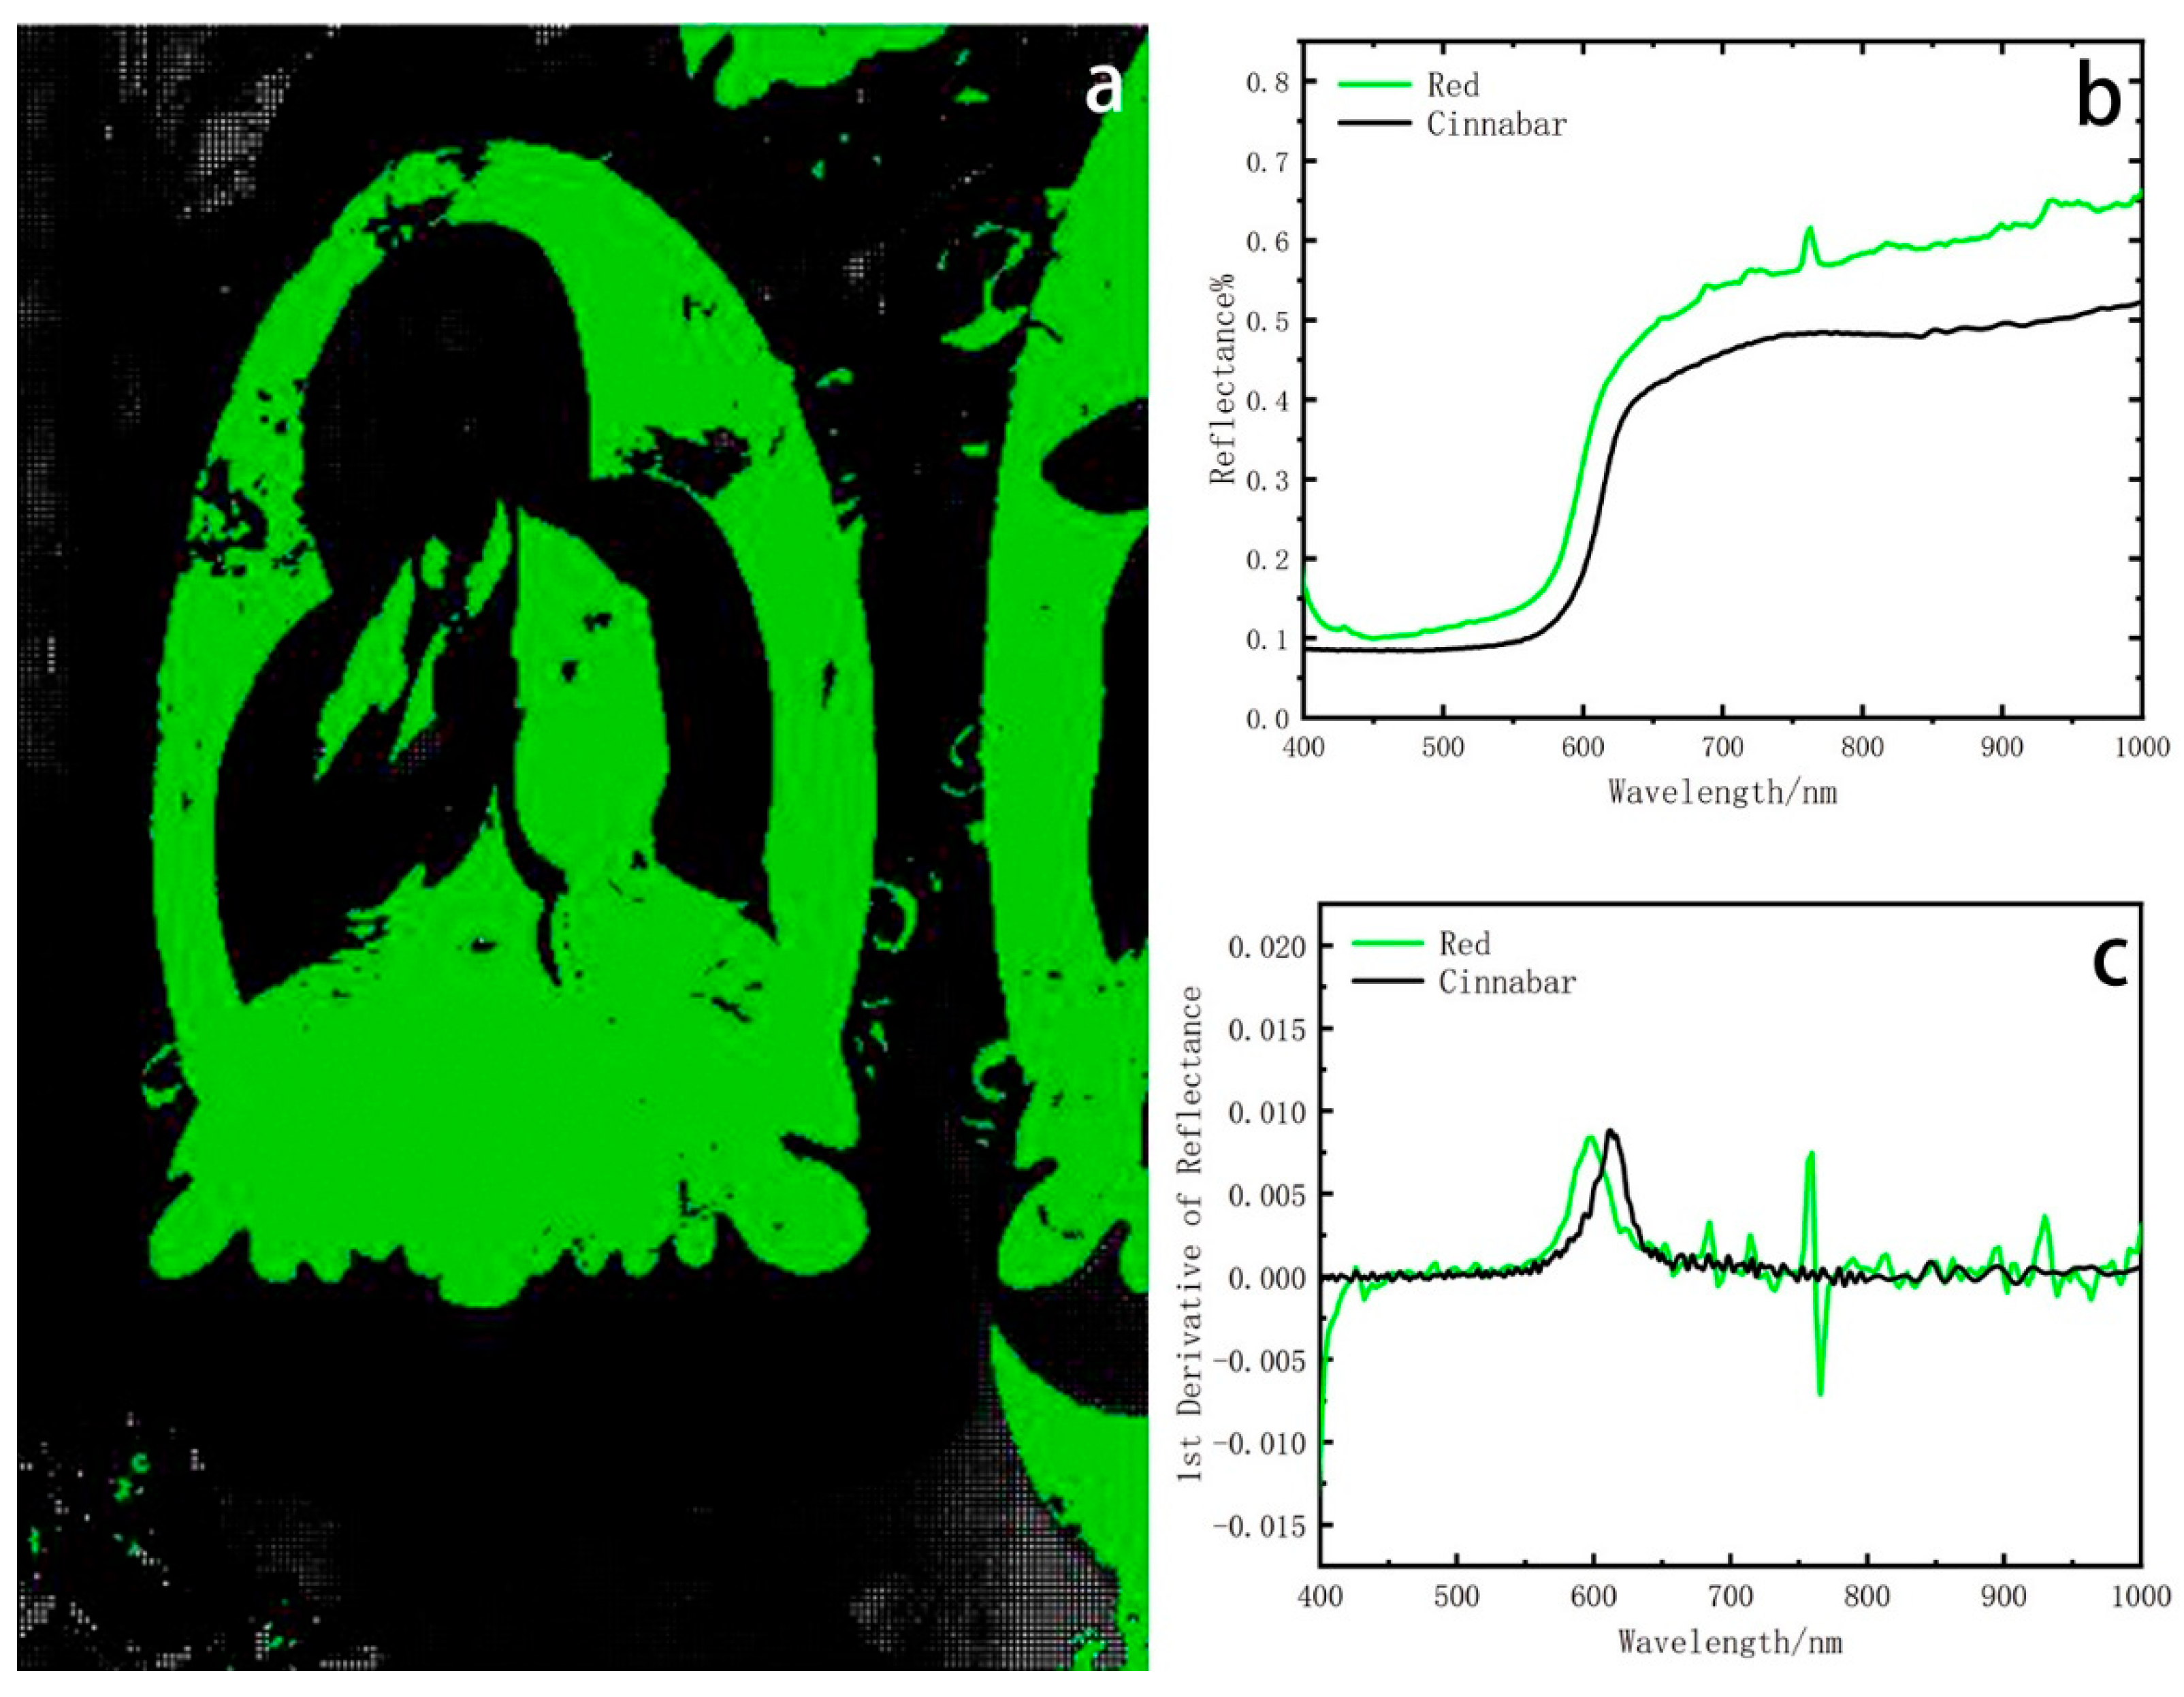
As shown in Figure 5, red is distributed on Master Atisha’s clothing and the halo of the Buddha statue, corresponding to the light green regions in the endmember spatial map. Green appears in the halo around the Buddha’s head and the bottom sections of the background of the Master Atisha, corresponding to the light blue, pale pink, and fuchsia areas of the endmember spatial map. Blue appears in the upper part of the background, corresponding to the purple regions of the endmember spatial map. White is distributed in the halo around the Buddha’s body, the Buddha’s skin tone, the clouds, and the Buddha seat, corresponding to the dark green, pink, and red regions of the endmember spatial map. Notably, white is associated with three endmembers, which are further analyzed in the white section below.
Spectral analysis reveals the presence of an endmember in the red region, corresponding to the location of the halo and clothing of the Buddha statue (Figure 5a). Spectral analysis reveals that its spectral characteristics are S-shaped, with a reflectance of 0.1–0.7. The HSI spectral match corresponds to cinnabar. The red endmember shows a pronounced increase in reflectance about 570 nm and a linear ascent beyond 630 nm. The reference spectrum of cinnabar shows a pronounced increase in reflectance about 570 nm and a linear ascent above 630 nm (Figure 5b). In order to determine the pigment composition, the first-order derivative was obtained. According to the result, the first-order derivative peak indicates that the peak of red pigment is 600 nm, the first-order derivative peak of minium is around 565 nm, and the first-order derivative peak of Cinnabar is 600 nm (Figure 5c) [40]. Therefore, it is inferred that the pigment used is cinnabar, the natural red pigment derived from the mineral. Under polarizing microscopy, the cinnabar in the sample exhibits an angular, irregular grain morphology, characteristic of the natural form. A polarizing micrograph of the pigment is provided in the Supplementary File.
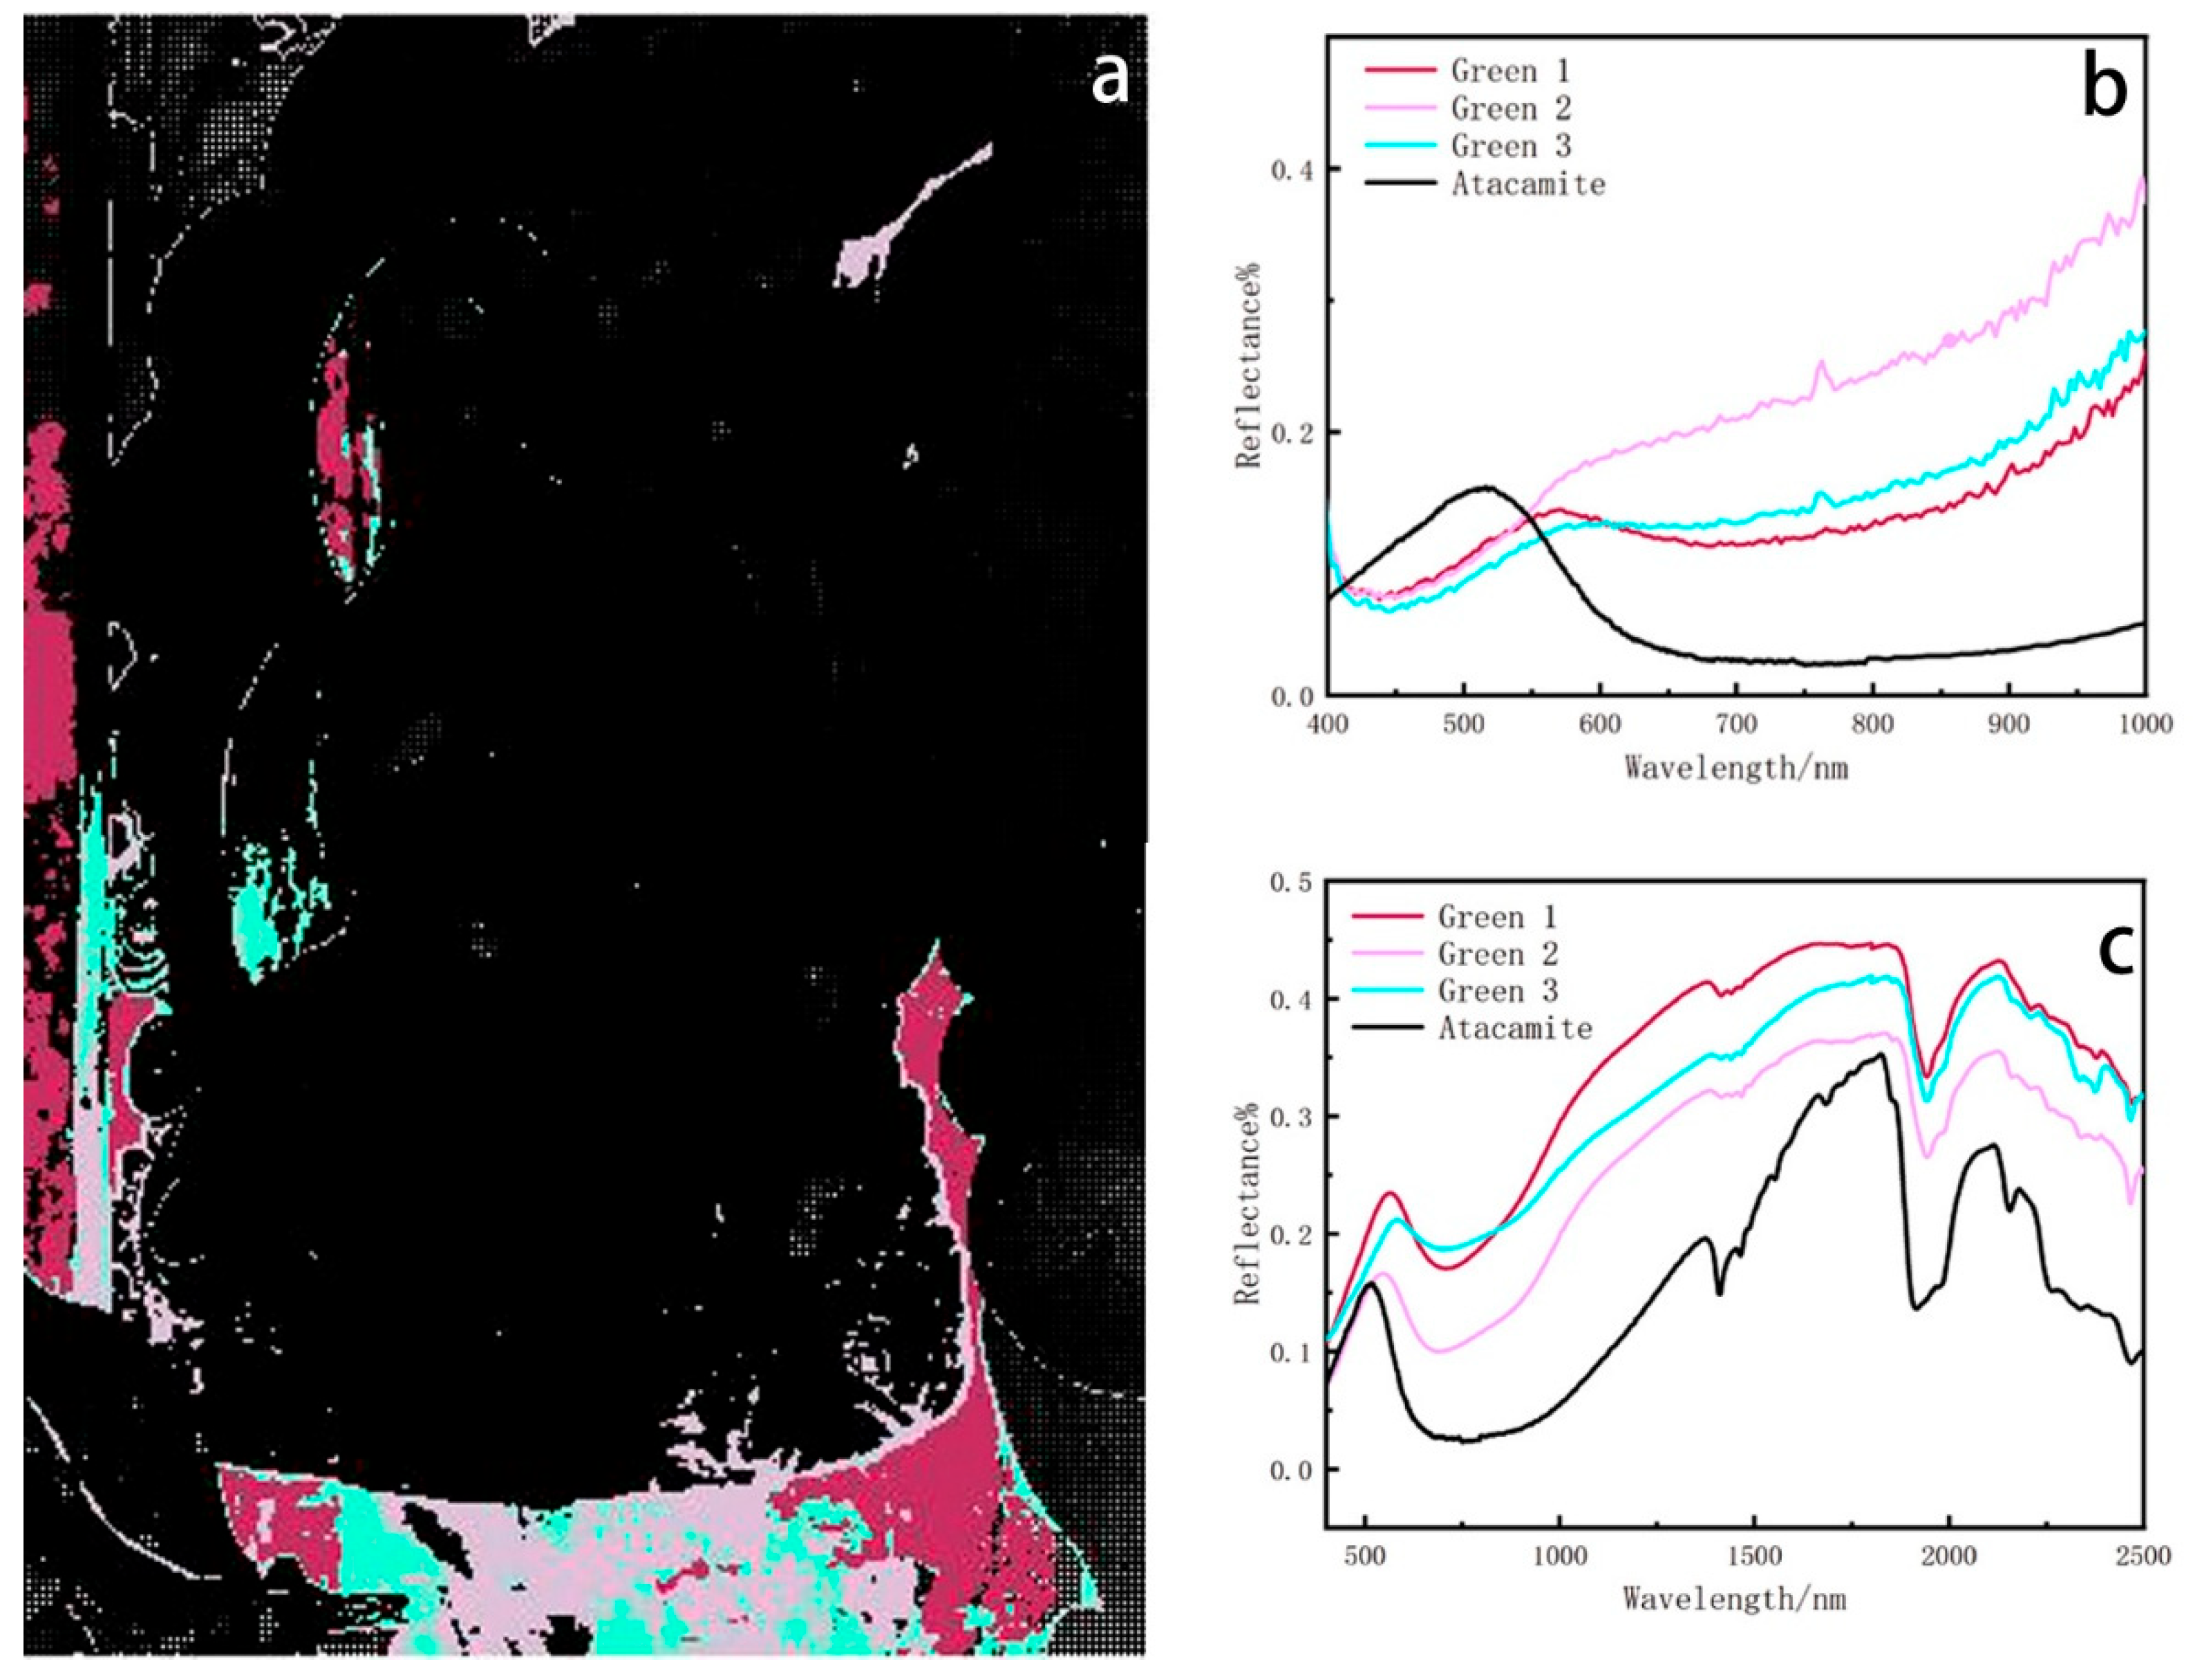
There are three endmembers in the green area, corresponding to the background region and the part of the halo of the Buddha (Figure 6a). Spectral analysis reveals that the spectra of the three clusters of green are not the same. The pink and blue-green colour area detected contamination on the mural. The three green endmembers exhibit peaks around 570 nm, and the HSI spectrum corresponds with chlorocopperite (Figure 6b) [41]. To ascertain the pigment used in this area, fibre-optic reflectance spectroscopy was conducted to analyze the material composition. Fibre-optic reflectance spectroscopy reveals that the three spectral curves exhibit an absorption band for Cu2+ and another absorption band at 2000 nm, which is consistent with the spectra of chlorocopperite (Figure 6c). Further identification based on microstructure observation and Raman spectroscopy indicates that the pigment is paratacamite, a common green pigment in ancient Chinese mural painting, as detailed in the Supplementary File.
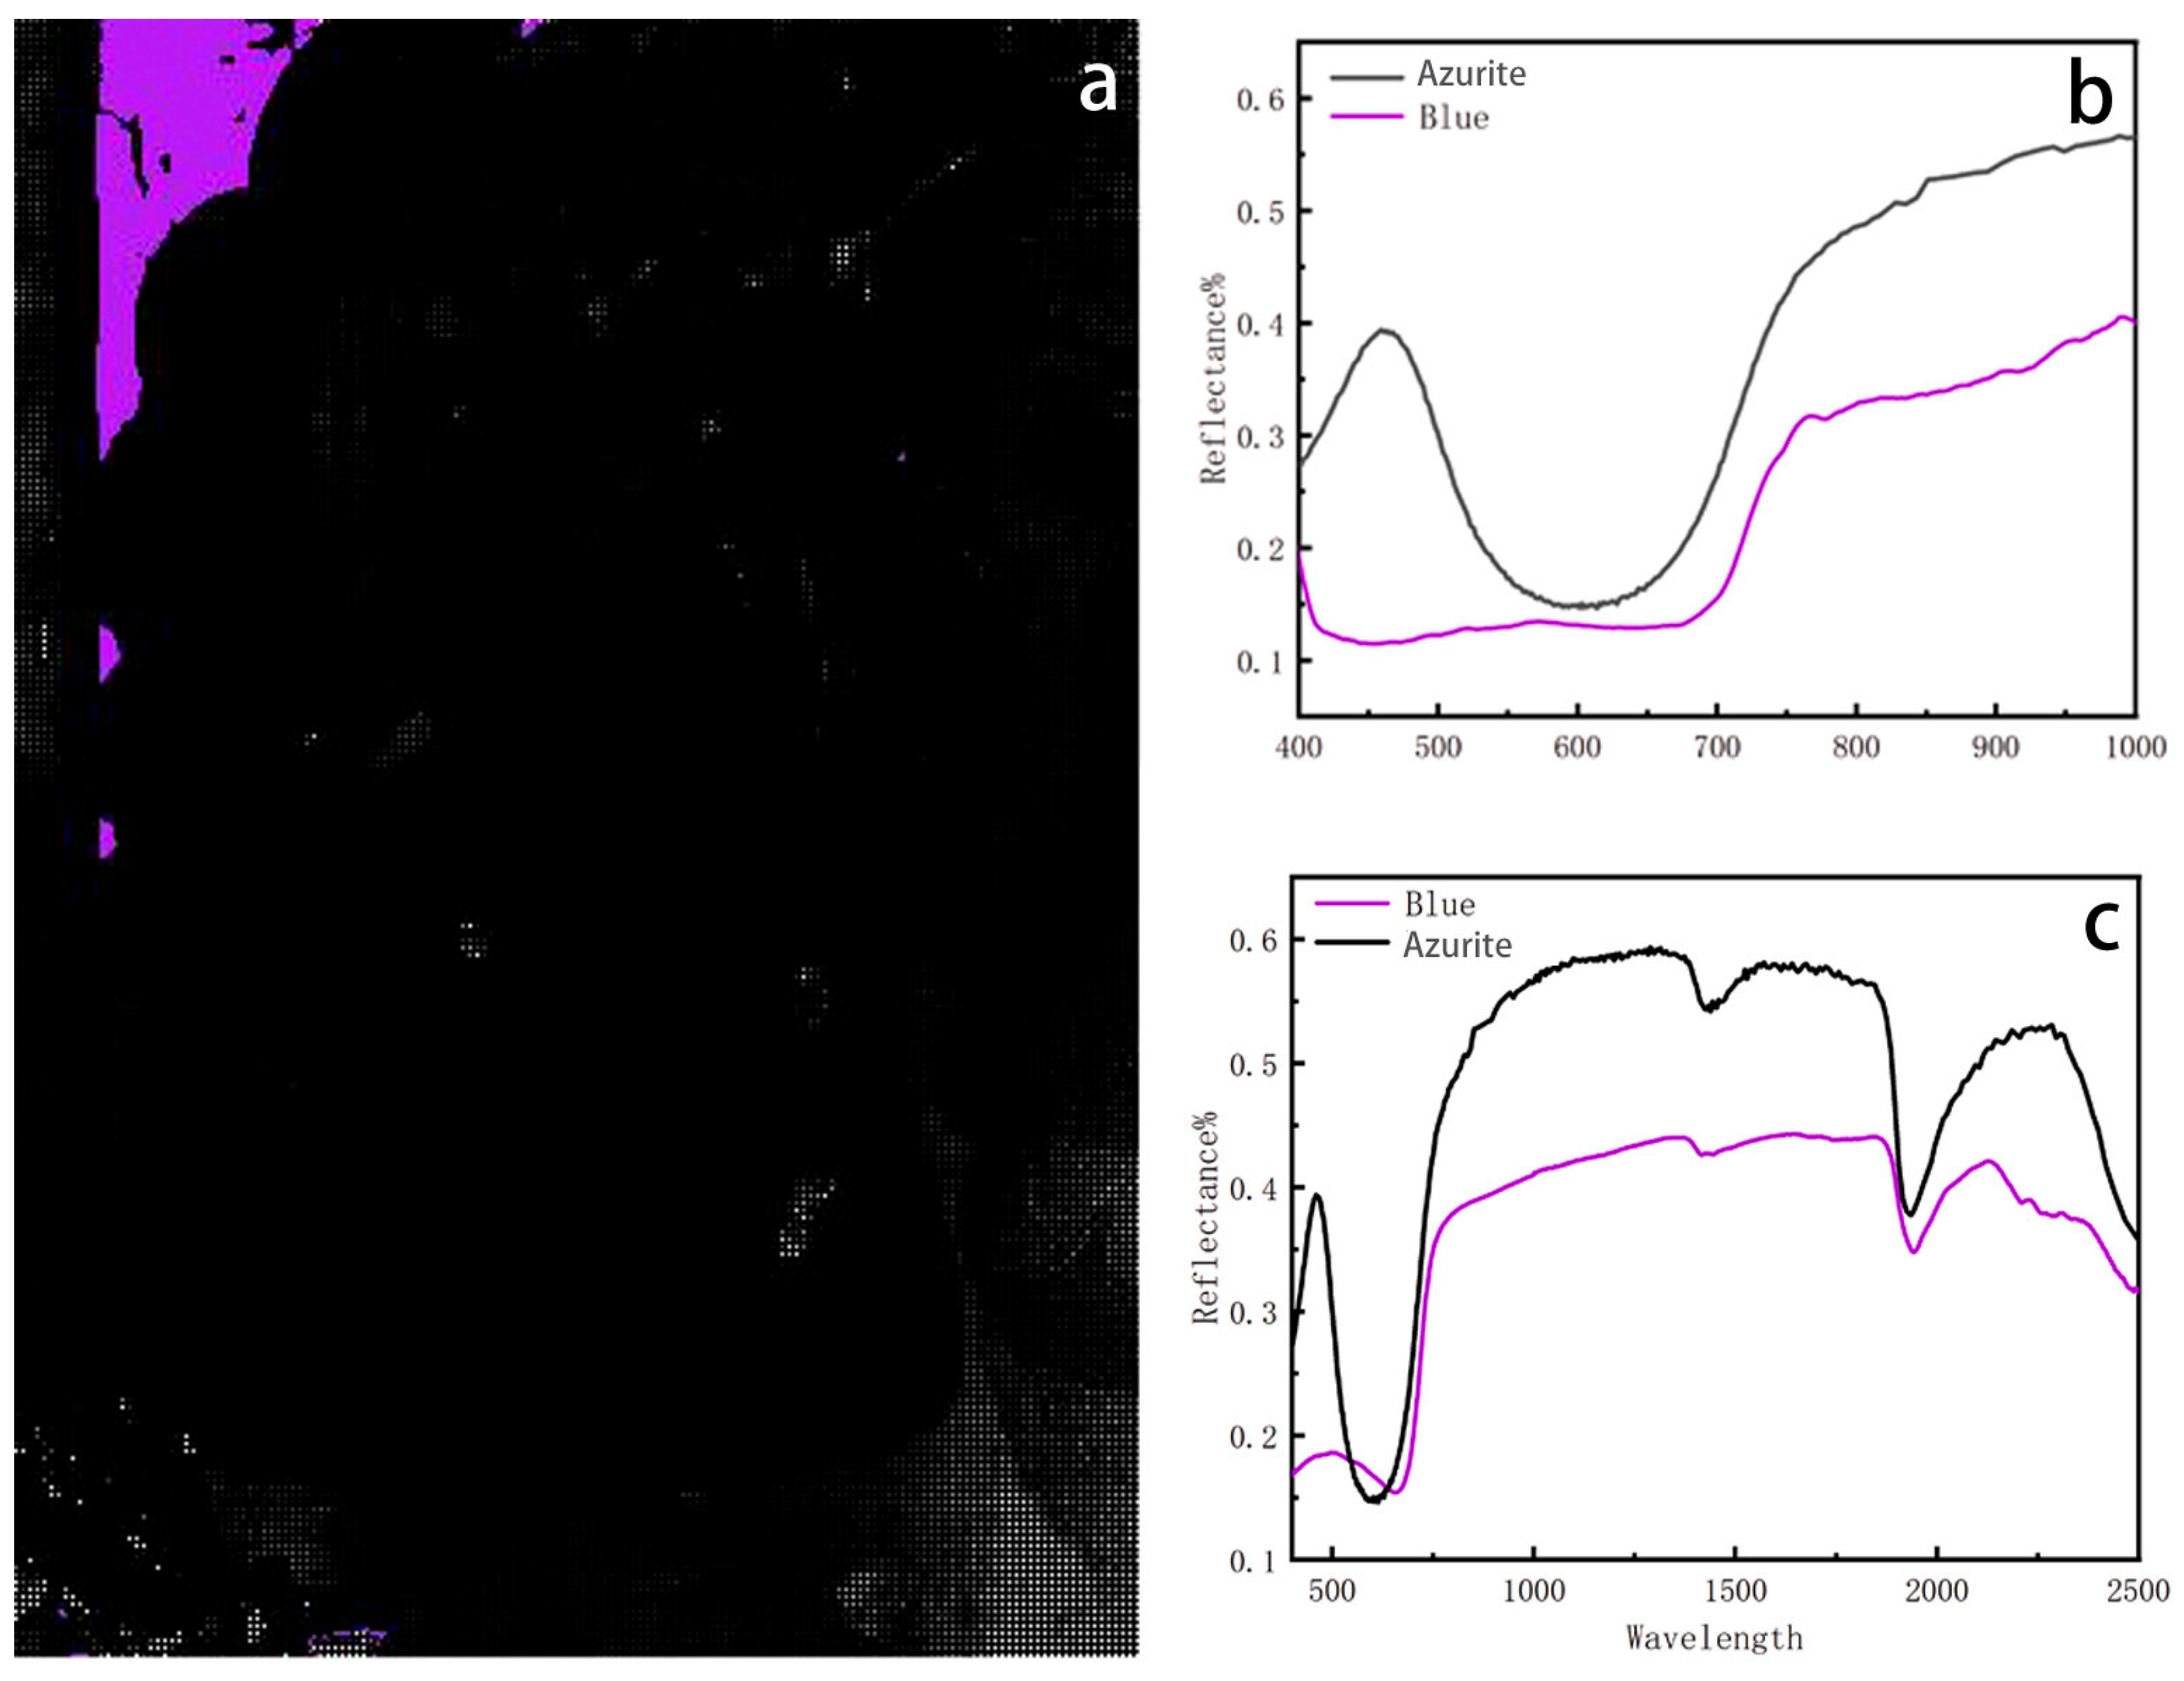
An endmember is located in the blue region, corresponding to the sky depicted in the mural (Figure 7a). A rise in reflectance at 600–700 nm aligns with the properties of blue mineral pigments. The HSI spectrum corresponds to azurite (Figure 7b), which exhibits characteristic absorption bands between 500 and 600 nm and near 1900 nm, along with distinct reflectance features between approximately 480 nm and 700–750 nm. To further determine the pigment used in this region, fibre-optic reflectance spectroscopy was conducted to analyze the composition of the substance (Figure 7c). It was found that blue pigments have absorption peaks in the visible and near-infrared region, around 500 nm and 1900 nm, which are usually associated with moisture O-H vibration or carbonate C-O vibration, corresponding to the characteristics of moisture or carbonate minerals. The absorption peaks around 500 nm and 1900 nm of the standardized PU of lithopanax are related to the hydroxyl O-H vibration and carbonate CO32− absorption characteristics. Therefore, the mineral pigment was confirmed to be azurite [42].
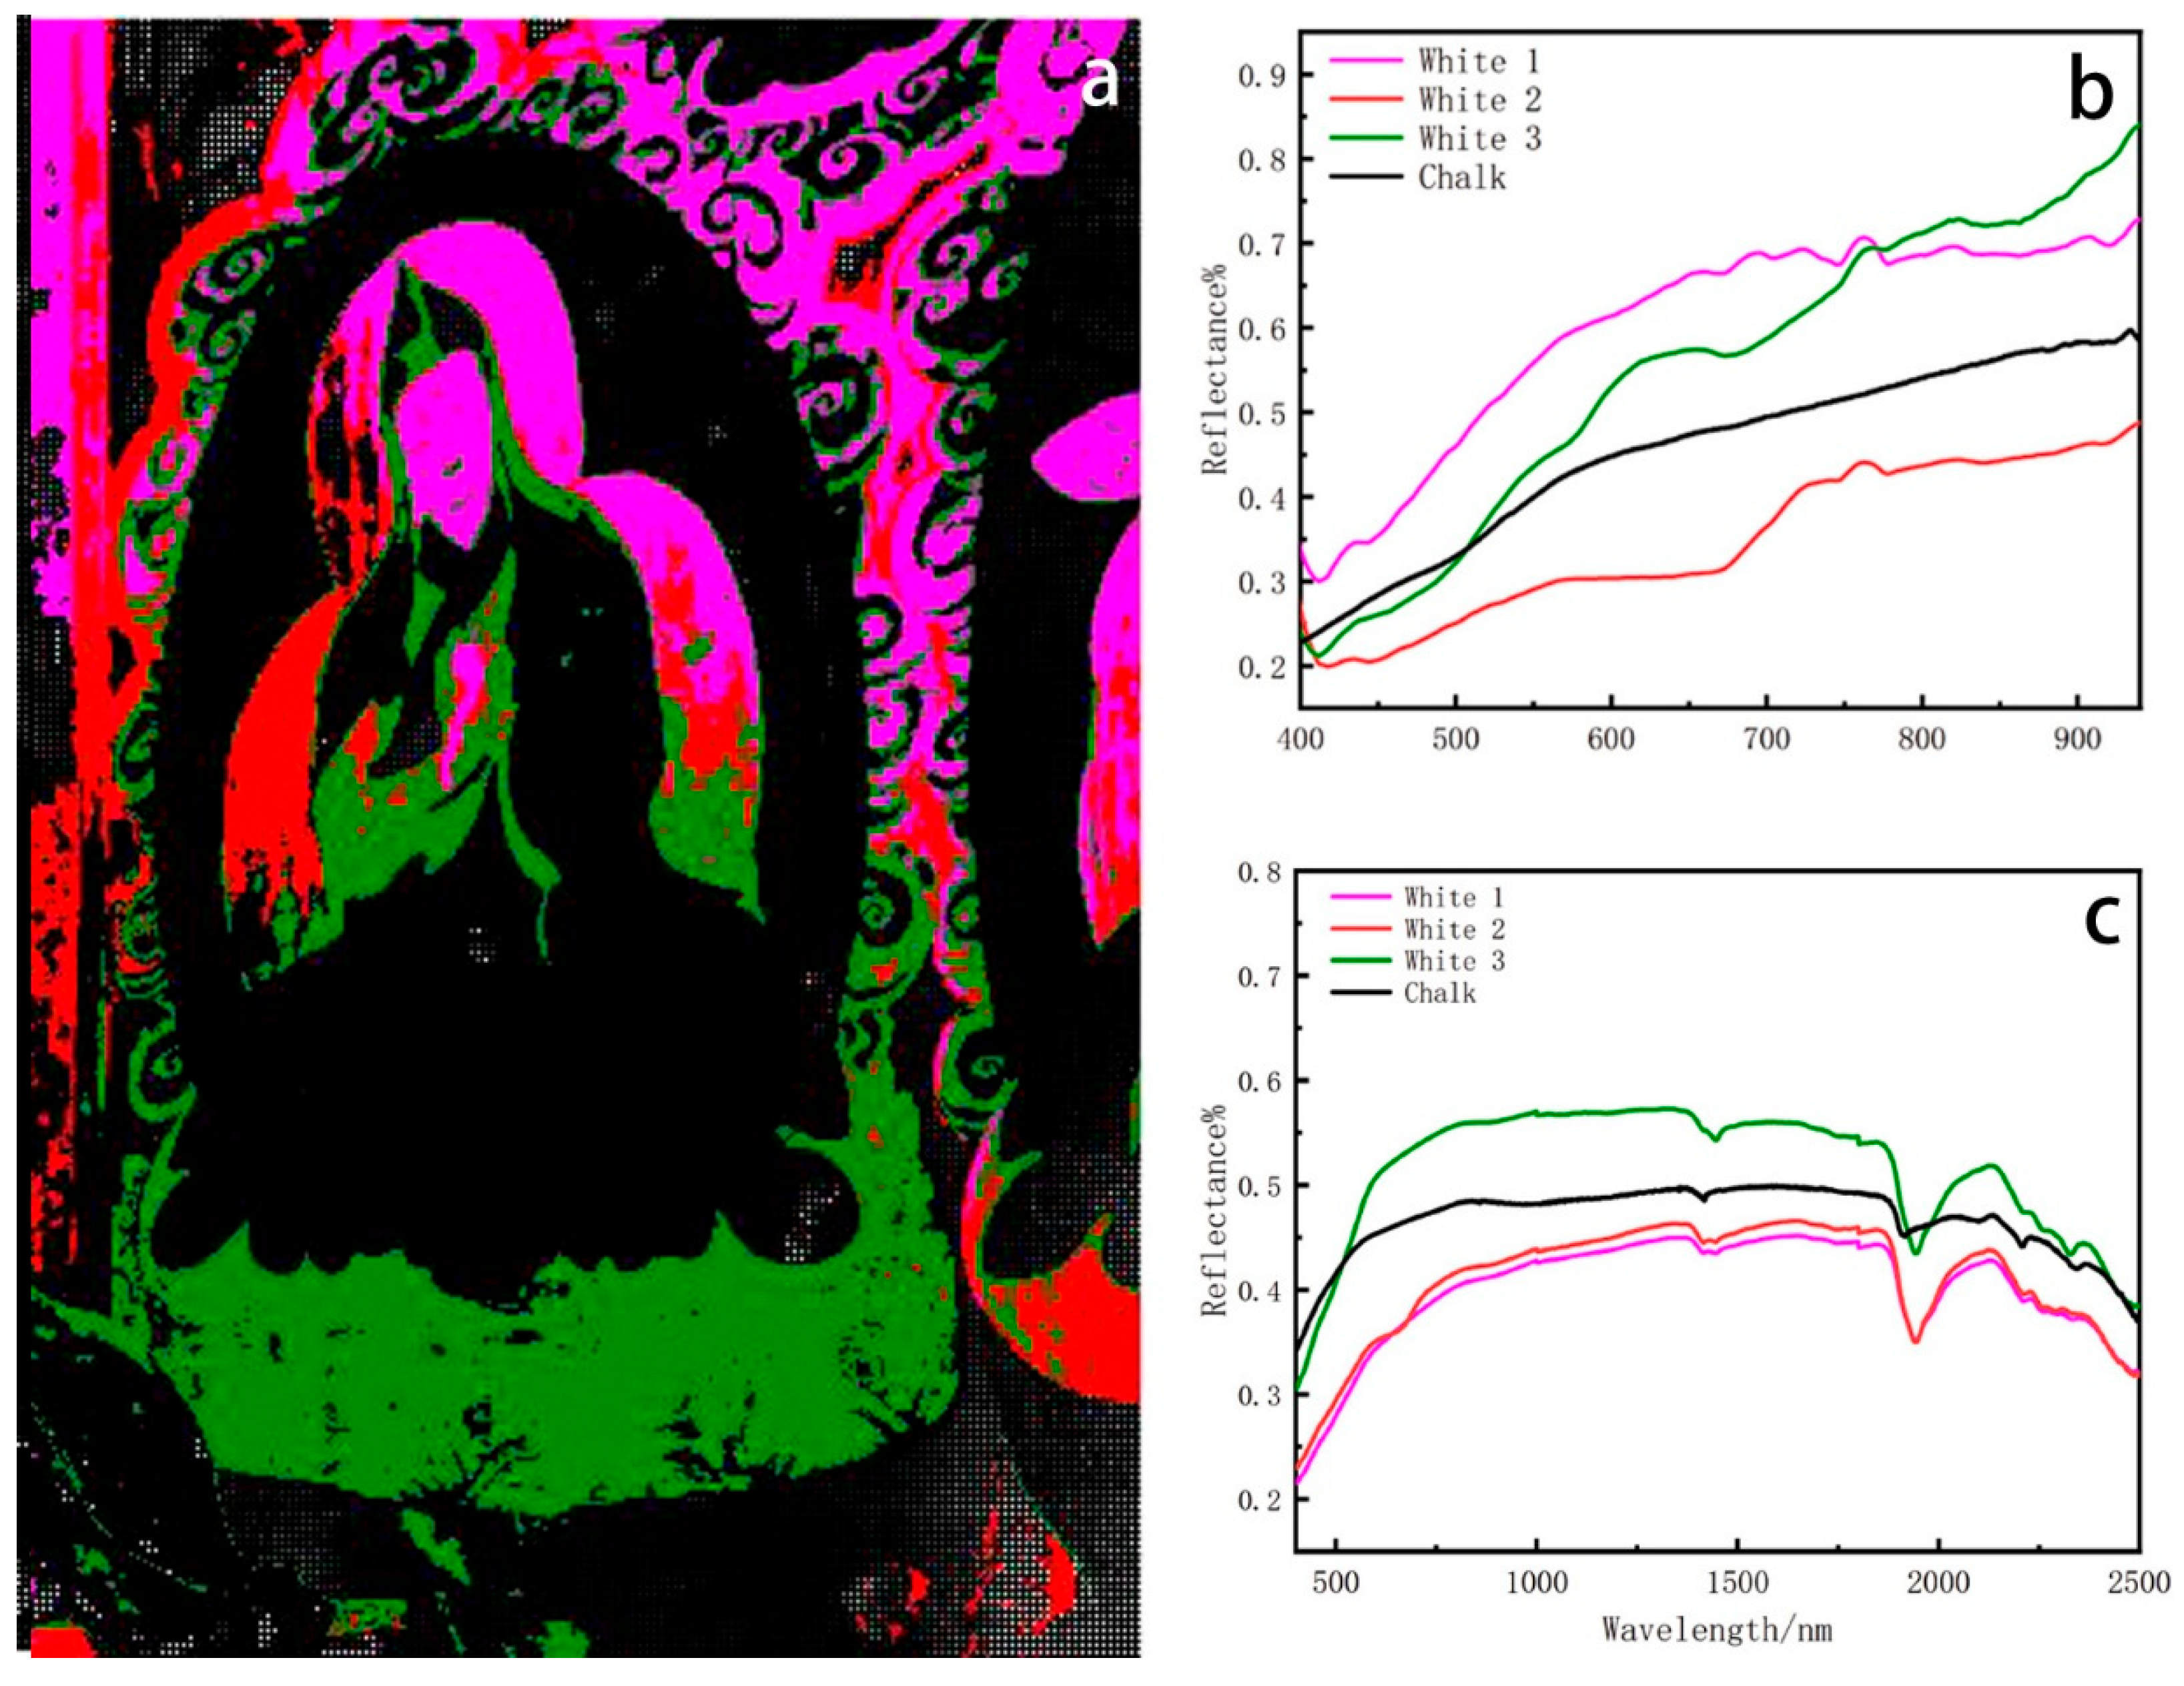
There are three endmembers in the white region, corresponding to the Buddha’s halo, the Lotus Throne, and the cloudy part (Figure 8a). Spectral analysis revealed that the spectra of the three white clusters were not similar. The pigment colouration was not uniform when observed on site and was found similar to chalk through spectral matching (Figure 8b). In order to further ascertain the pigment used in this area, optical fibre reflectance spectroscopy was conducted to analyze the material’s composition (Figure 8c). Spectral analysis revealed that the three end elements of white colour had absorption peaks at 1447 nm and 1945 nm, aligning with the fundamental spectrum of chalk [43].
The above pigments are significantly historically representative and consistent with the regularity of pigment use in traditional Chinese mural paintings [27,44].

3.1.2. XRF Analysis

In order to further confirm the identification results of the HSI, a portable X-ray fluorescence spectrometer was employed for the in situ analysis of red, green, blue, and white areas in the murals of previously mentioned sampling points in the Liuli Hall of Meidai Lamasery [45]. The composition and density of different pigments affect the penetration depth of X-rays in XRF analysis, as high-atomic-number elements attenuate X-rays more strongly, resulting in shallower analysis depths compared to lighter elements. Therefore, even on the same mural surface, the effective analysis depth can vary depending on the pigment used in each region [46]. Some of the results reveal the underlying material elements during the analysis. All XRF profiles indicate the presence of Ca, Fe, Ba, Zr, and Pb elements. The artworks were executed on a white powder layer containing Ca. The microstructure and XRF spectrum are provided in the Supplementary File. The used materials were probably chalk (CaCO3), gypsum (CaSO4·2H2O), and lead white 2PbCO3·Pb(OH)2.
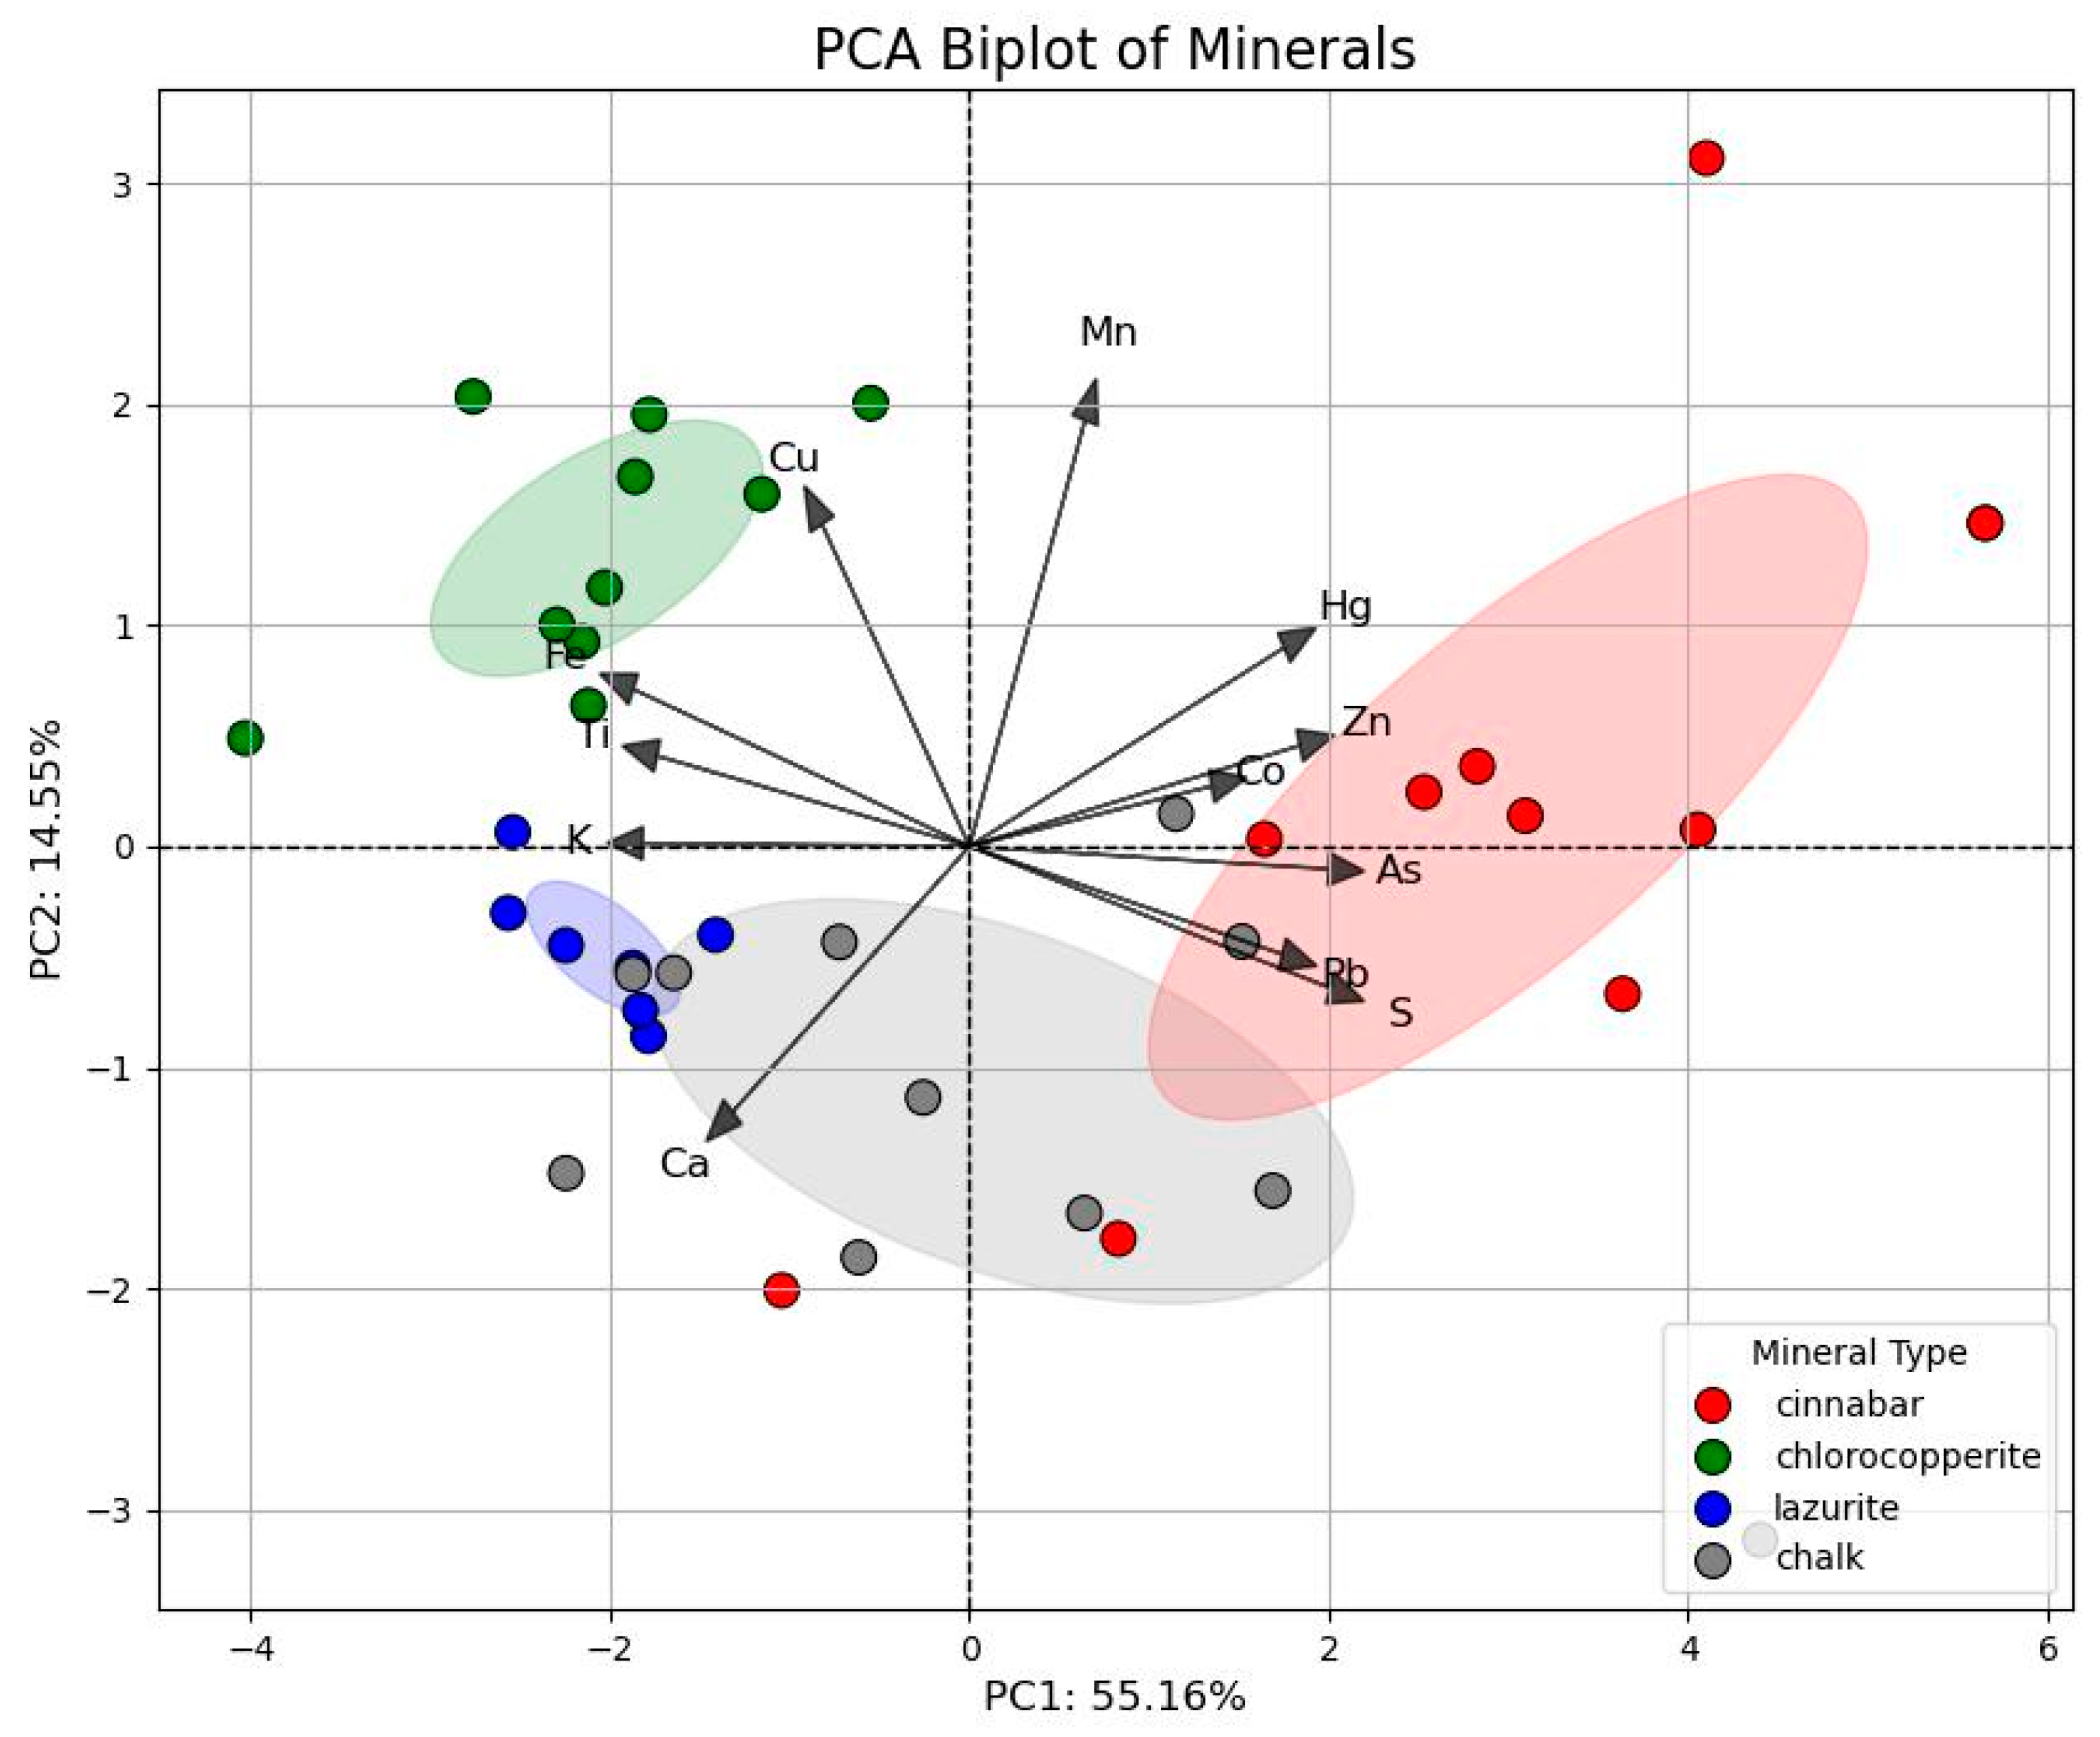
PCA analysis was performed on the concentration value data of each element obtained by XRF. Figure 9 showed that the first two principal components (PC1, PC2) accounted for 51.46% and 17.75% of the variance, respectively. The inorganic pigments are divided into four groups based on their different principal components. A large amount of Hg was detected in the red pigment test points, validating the use of cinnabar pigments, with a small amount of Pb element indicating the presence of Pb-based material in the mural paintings, maybe attributable to lead white or minium. The green pigment exhibits a significant content of Cu, and, combined with the hyperspectral analysis results, it is assumed that the green pigment is chlorocopperite. The XRF analysis of the blue pigment reveals a high intensity of Ca and Cu, suggesting the presence of calcite or azurite. The presence of Ca can be attributed to the stratigraphic structure of the mural at Meidai Lamasery, which consists of a ground layer, a white layer, and a pigment layer (see Supplementary File S4). Additionally, a notable Cu signal is detected, along with an absorption peak at 1900 nm in the FORS, which is consistent with the characteristics of azurite. Consequently, it is inferred that the colour pigment used in the mural is azurite. The mural exhibits a significant concentration of Fe, and the hyperspectral signature in the 400–600 nm range does not align with the standard spectrum of azurite. This spectral discrepancy, together with the elevated Fe signal, suggests possible interference from restoration materials, such as Prussian blue (Fe4[Fe(CN)6]3), commonly used in modern conservation. There is consistency between XRF and HSI results. The samples represented by the green and blue points are relatively clustered, indicating low variability in the chemical composition of these minerals. In contrast, the two red points significantly deviate from the other samples, particularly along the positive direction of PC1 and the negative direction of PC2. These points, located in the non-faded region, exhibit elevated concentrations of As and Hg, suggesting the use of cinnabar as the primary pigment. Although As is present at relatively high levels, no evidence of orpiment or realgar was observed in the corresponding microstructure or Raman analysis. The arsenic may originate from trace impurities in mineral cinnabar or from naturally occurring arsenic-bearing accessory minerals.

3.1.3. Binding Material

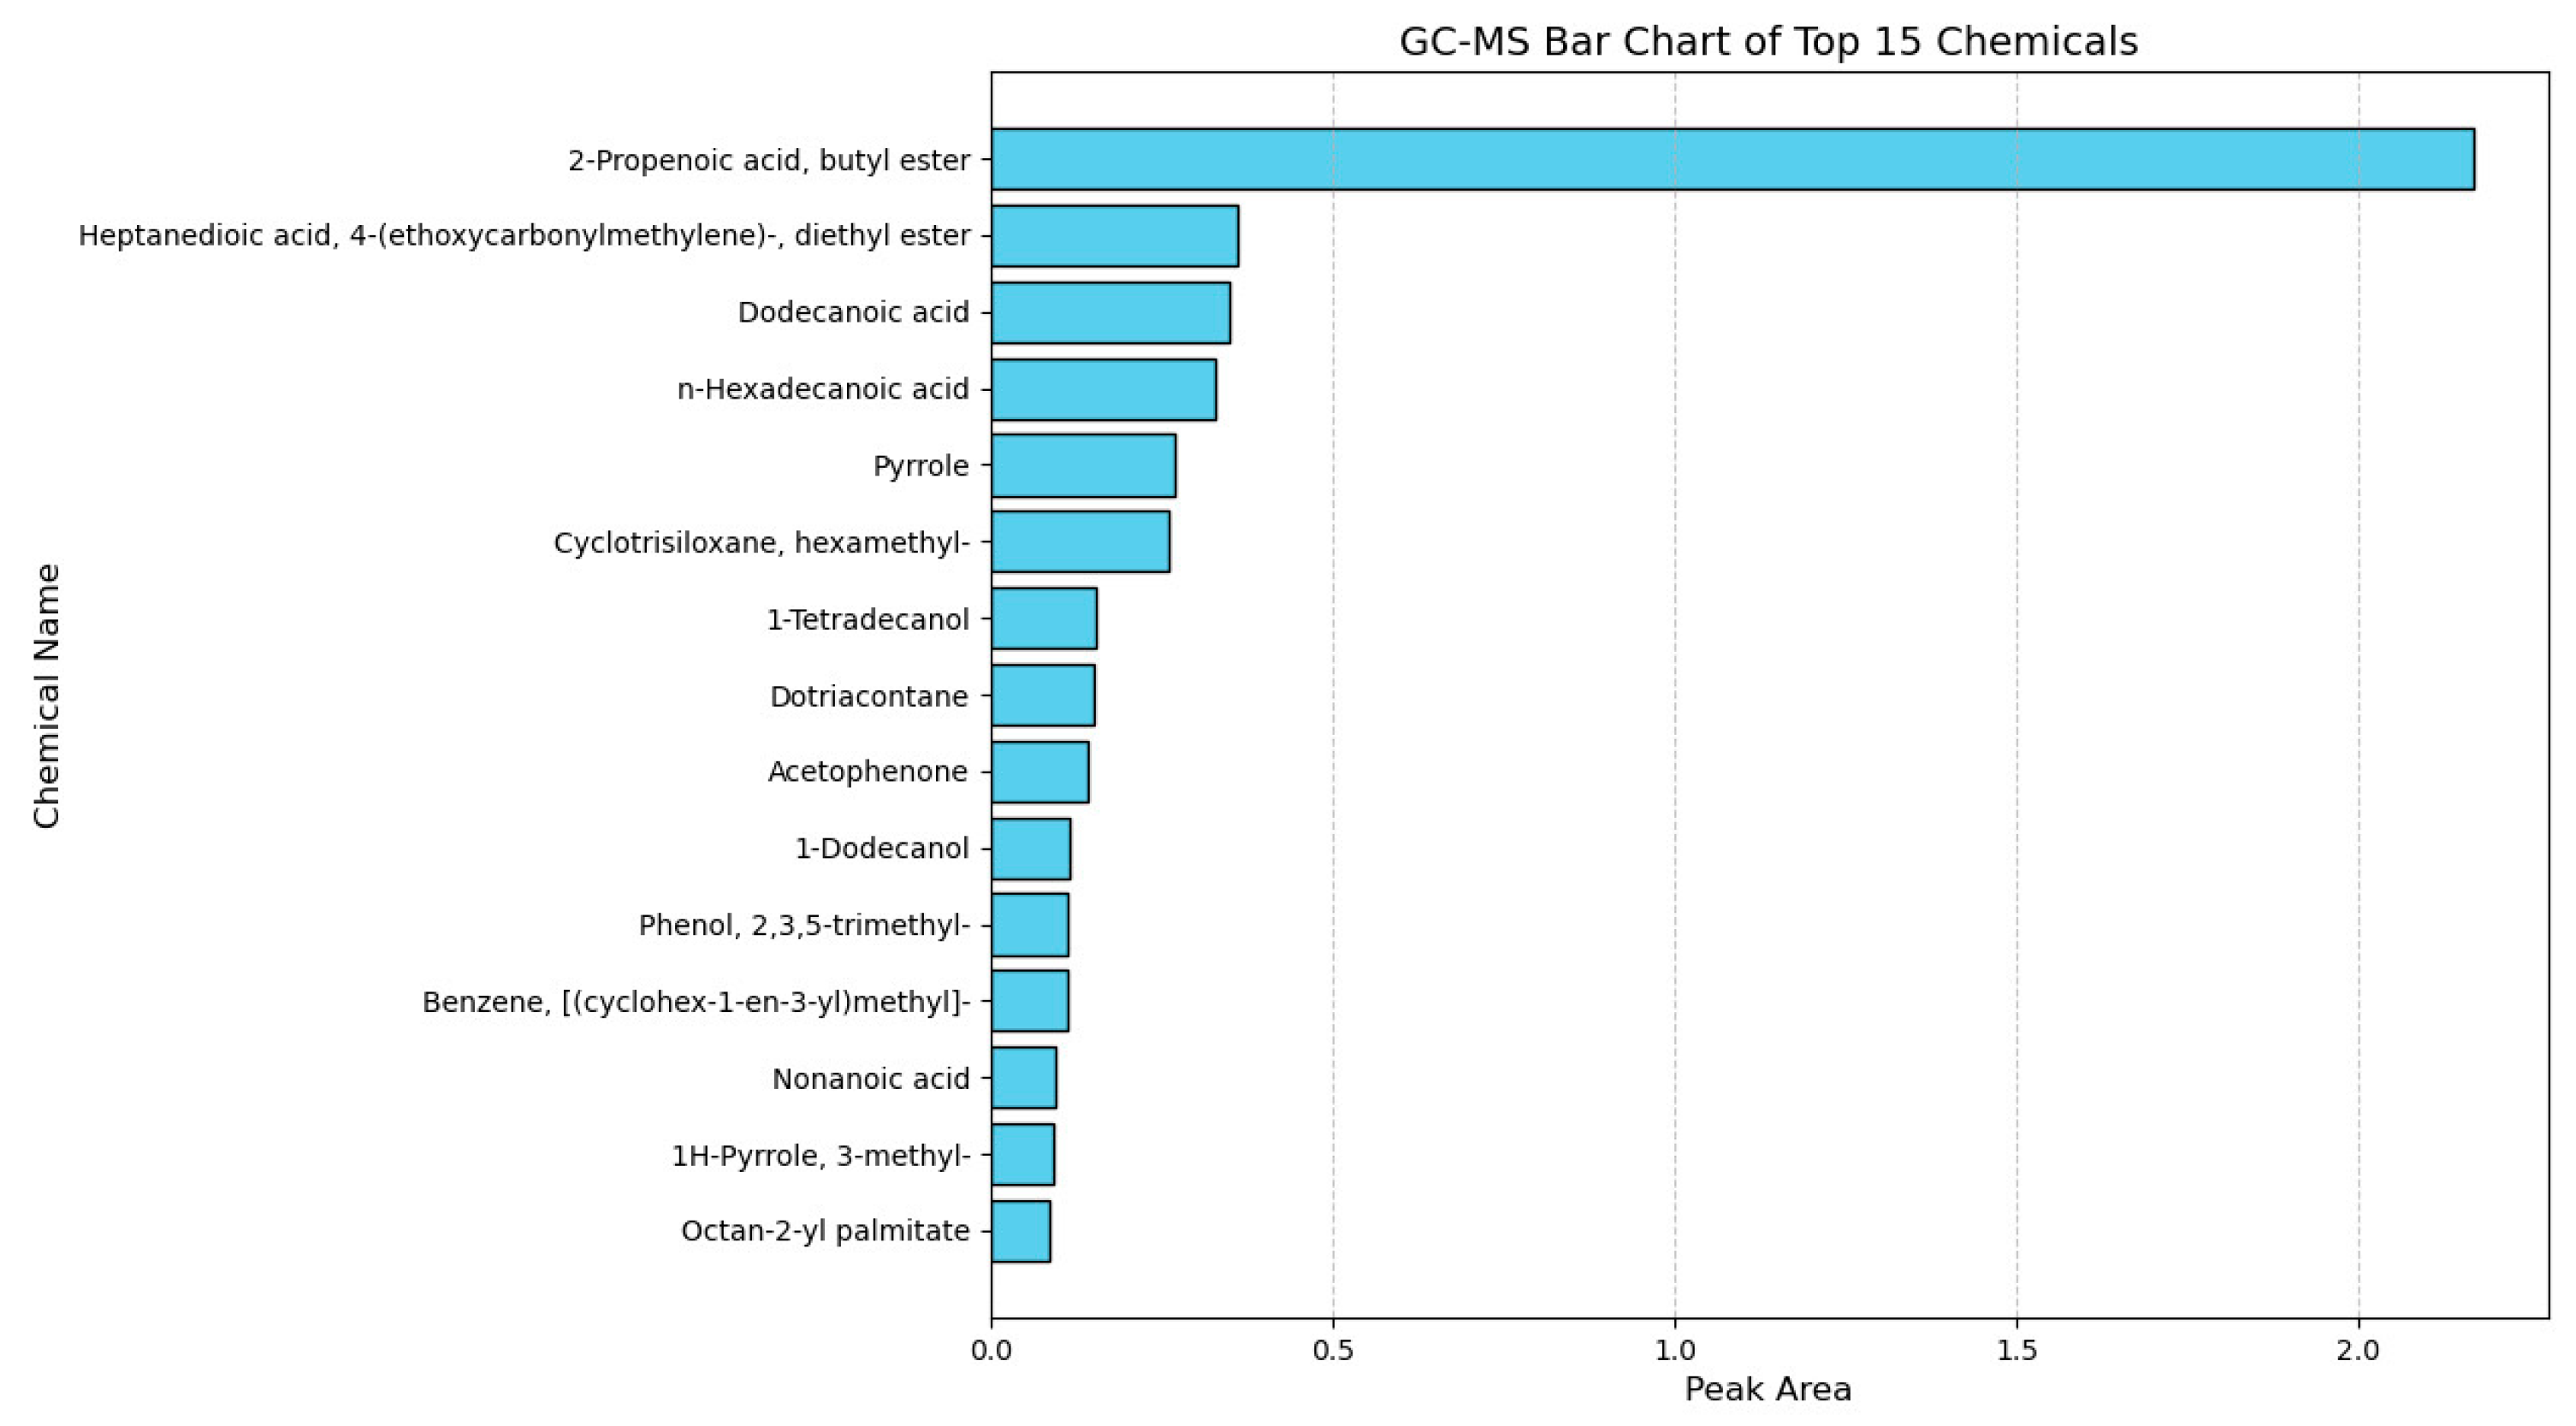
In order to clarify the binding material factor for colour deterioration of the murals, samples of the murals were analyzed using the GC-MS technique. GC-MS analysis revealed that the sample was dominated by amino acid degradation products and aromatic compounds, including pyrrole, 1H-pyrrole, 3-methyl, benzaldehyde, acetophenone, and dibutyl phthalate. These substances are the main components of animal glue [47,48]. The presence of animal glue may have an effect on colour deterioration. Therefore, it is considered that animal glue is used. In addition, a range of long-chain fatty acids and alcohols, with n-Hexadecanoic acid, Octadecanoic acid, Dodecanoic acid, Nonanoic acid, Heptanedioic acid, 4-ethoxycarbonylmethylene, diethyl ester, Octan-2-yl palmitate, 1-Dodecanol, 1-Tetradecanol, and Dotriacontane were also found. These substances are the main components of drying oil [49], so it is thought that drying oil was also used in the murals (Figure 10). During the ageing process, the film formed by drying oils gradually loses its elasticity, leading to brittleness and cracking. Variations in temperature and humidity can exacerbate this issue, as the difference in thermal expansion coefficients between the oil film and the underlying plaster layer may result in cracking, blistering, or even delamination of the pigment layer. Furthermore, exposure to light and oxidative conditions induces molecular changes in the oil components, causing yellowing of the protective or pigment layers. This discolouration not only alters the overall tone of the mural but also reduces the refractive index of the pigments, leading to a dull and muddy appearance that was originally vivid colours.

3.1.4. Surface Flatness of the Mural

Prior to the profilometric analysis, the base of the mural fragment was gently polished to ensure measurement stability and eliminate substrate-induced error. The surface contour of the pigment layer was then examined using non-contact 3D profilometry. The results revealed slight micro-undulations on the surface, with vertical deviations ranging from approximately 0.02 mm. Although the overall flatness remained relatively high, such minor surface irregularities may still influence optical reflectance characteristics, potentially affecting the measured L and C values. Furthermore, uneven regions are more likely to trap airborne particles and contaminants, which may accelerate localized discolouration and surface degradation over time (Figure 11).

3.1.5. Restoration of Traces

Multi-spectral imaging can obtain pigment distribution. Under visible light, the brushstrokes exhibit identical reflectance or transmittance to the surrounding substances, which cannot be distinguished by human eyes. Some painting pigments exhibit different absorption rates of infrared and ultraviolet light, creating a contrast with reflective substances when subjected to infrared and ultraviolet radiation. These characteristics enable the analysis of mural paintings’ pigments, binding materials, contour details, underlying information, repair traces, and defacement notes, etc. [50].
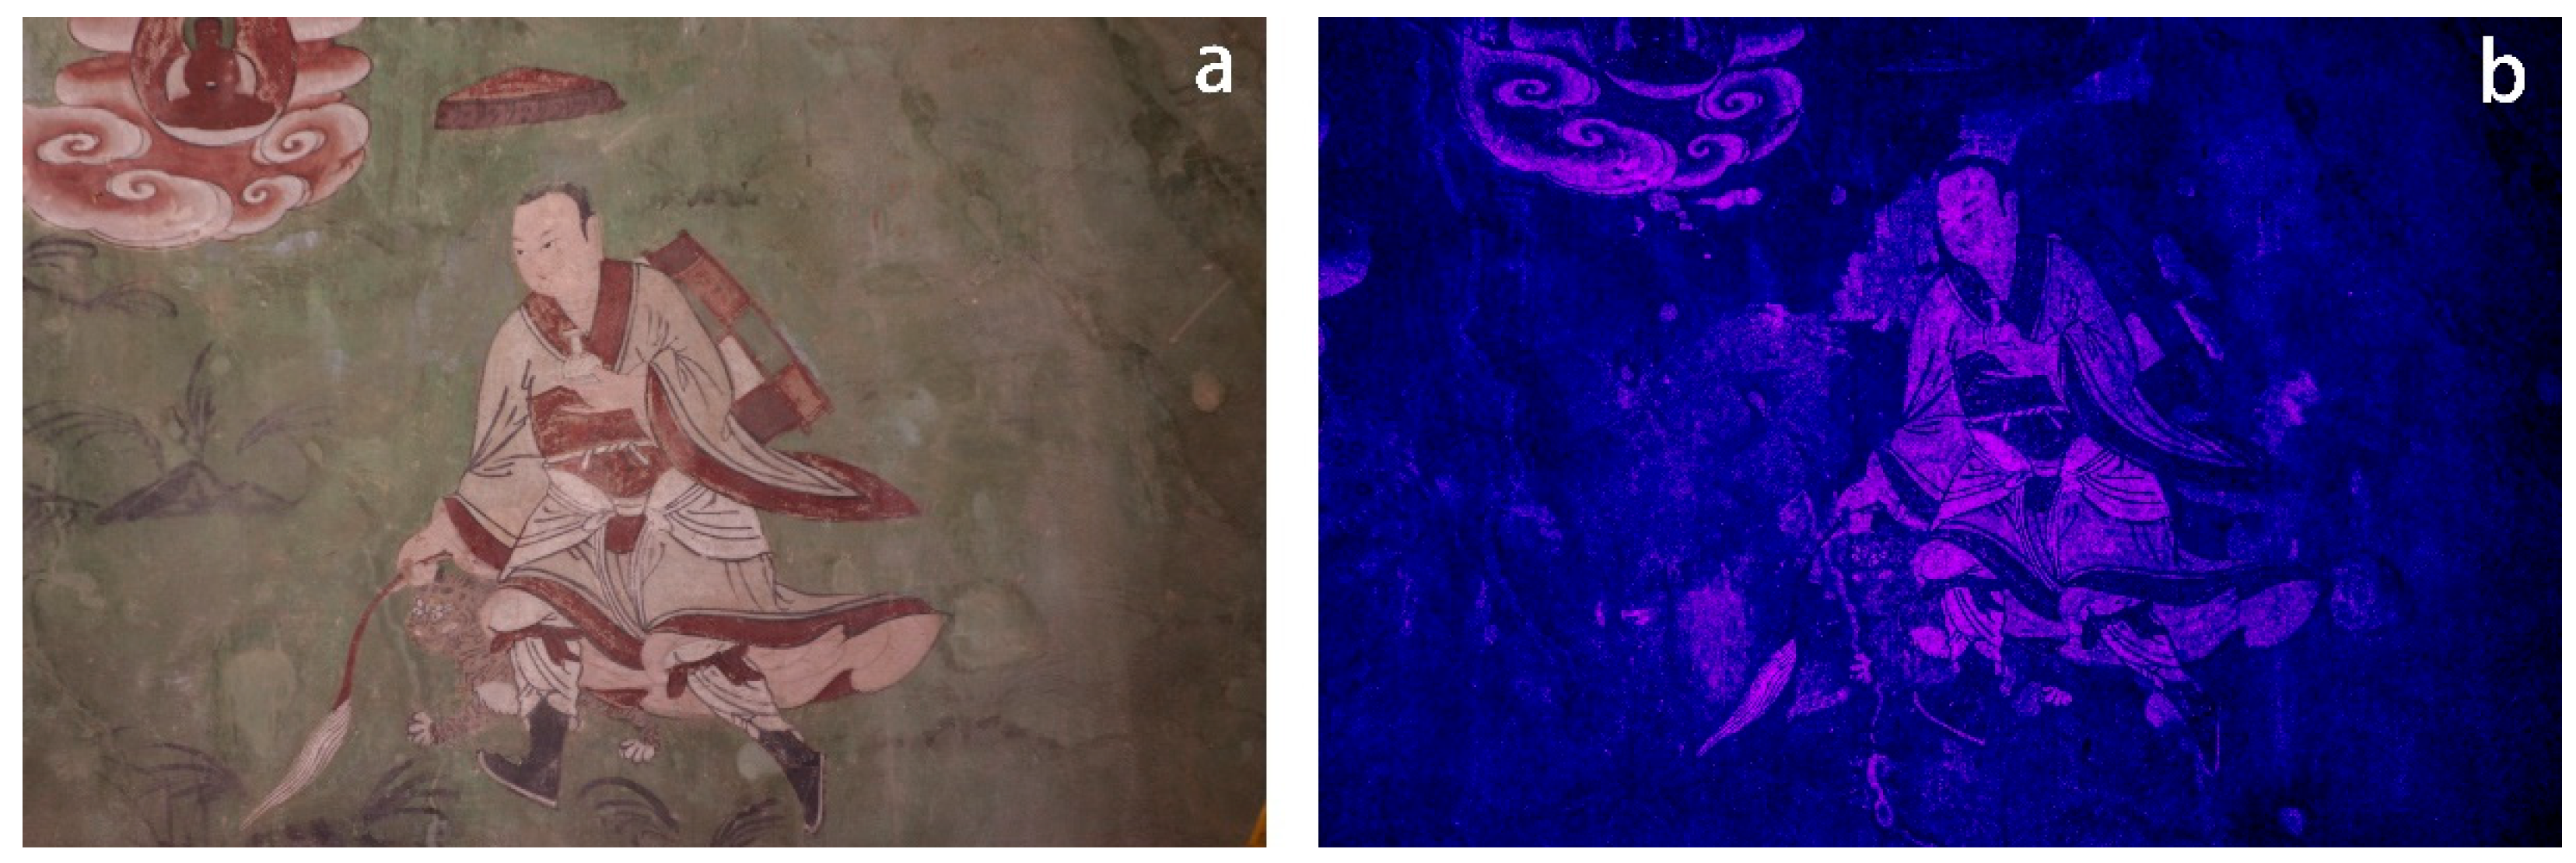
In Venerable Dharmodara ‘s diagram, according to the UVF technique, the pigment layer exhibits a non-uniform blue and fuchsia fluorescence, the blue area corresponds to the green part of the background, the pink fluorescent area corresponds to the white part of the picture created with white pigment, displaying an irregular colour distribution (Figure 12).
The UVR technique addresses the uppermost layer of pigment or binding material, and there exists an area around the Buddha’s head in the image that shows anomalies, characterized by a light grey colour and irregular form. It is identified as a repair trace made by a brush. There are traces of liquid adjacent to the skirt of the figure, presumably resulting from a recent repair. Red and green are shown as dark grey, and the grey distribution of the green part of the visible background is uneven, indicating traces of repair (Figure 13a). The use of a 950 nm infrared filter clearly reveals the contour lines of the Buddha statue in the mural, which correspond to the preparatory drawing. It may be carbon black. The infrared reflection shows that the painting style employs a two-layer outline, with lines beneath the pigment layer under the skirt of Venerable Dharmodara. The edges were finished with ink lines after the pigment was applied (Figure 13b).
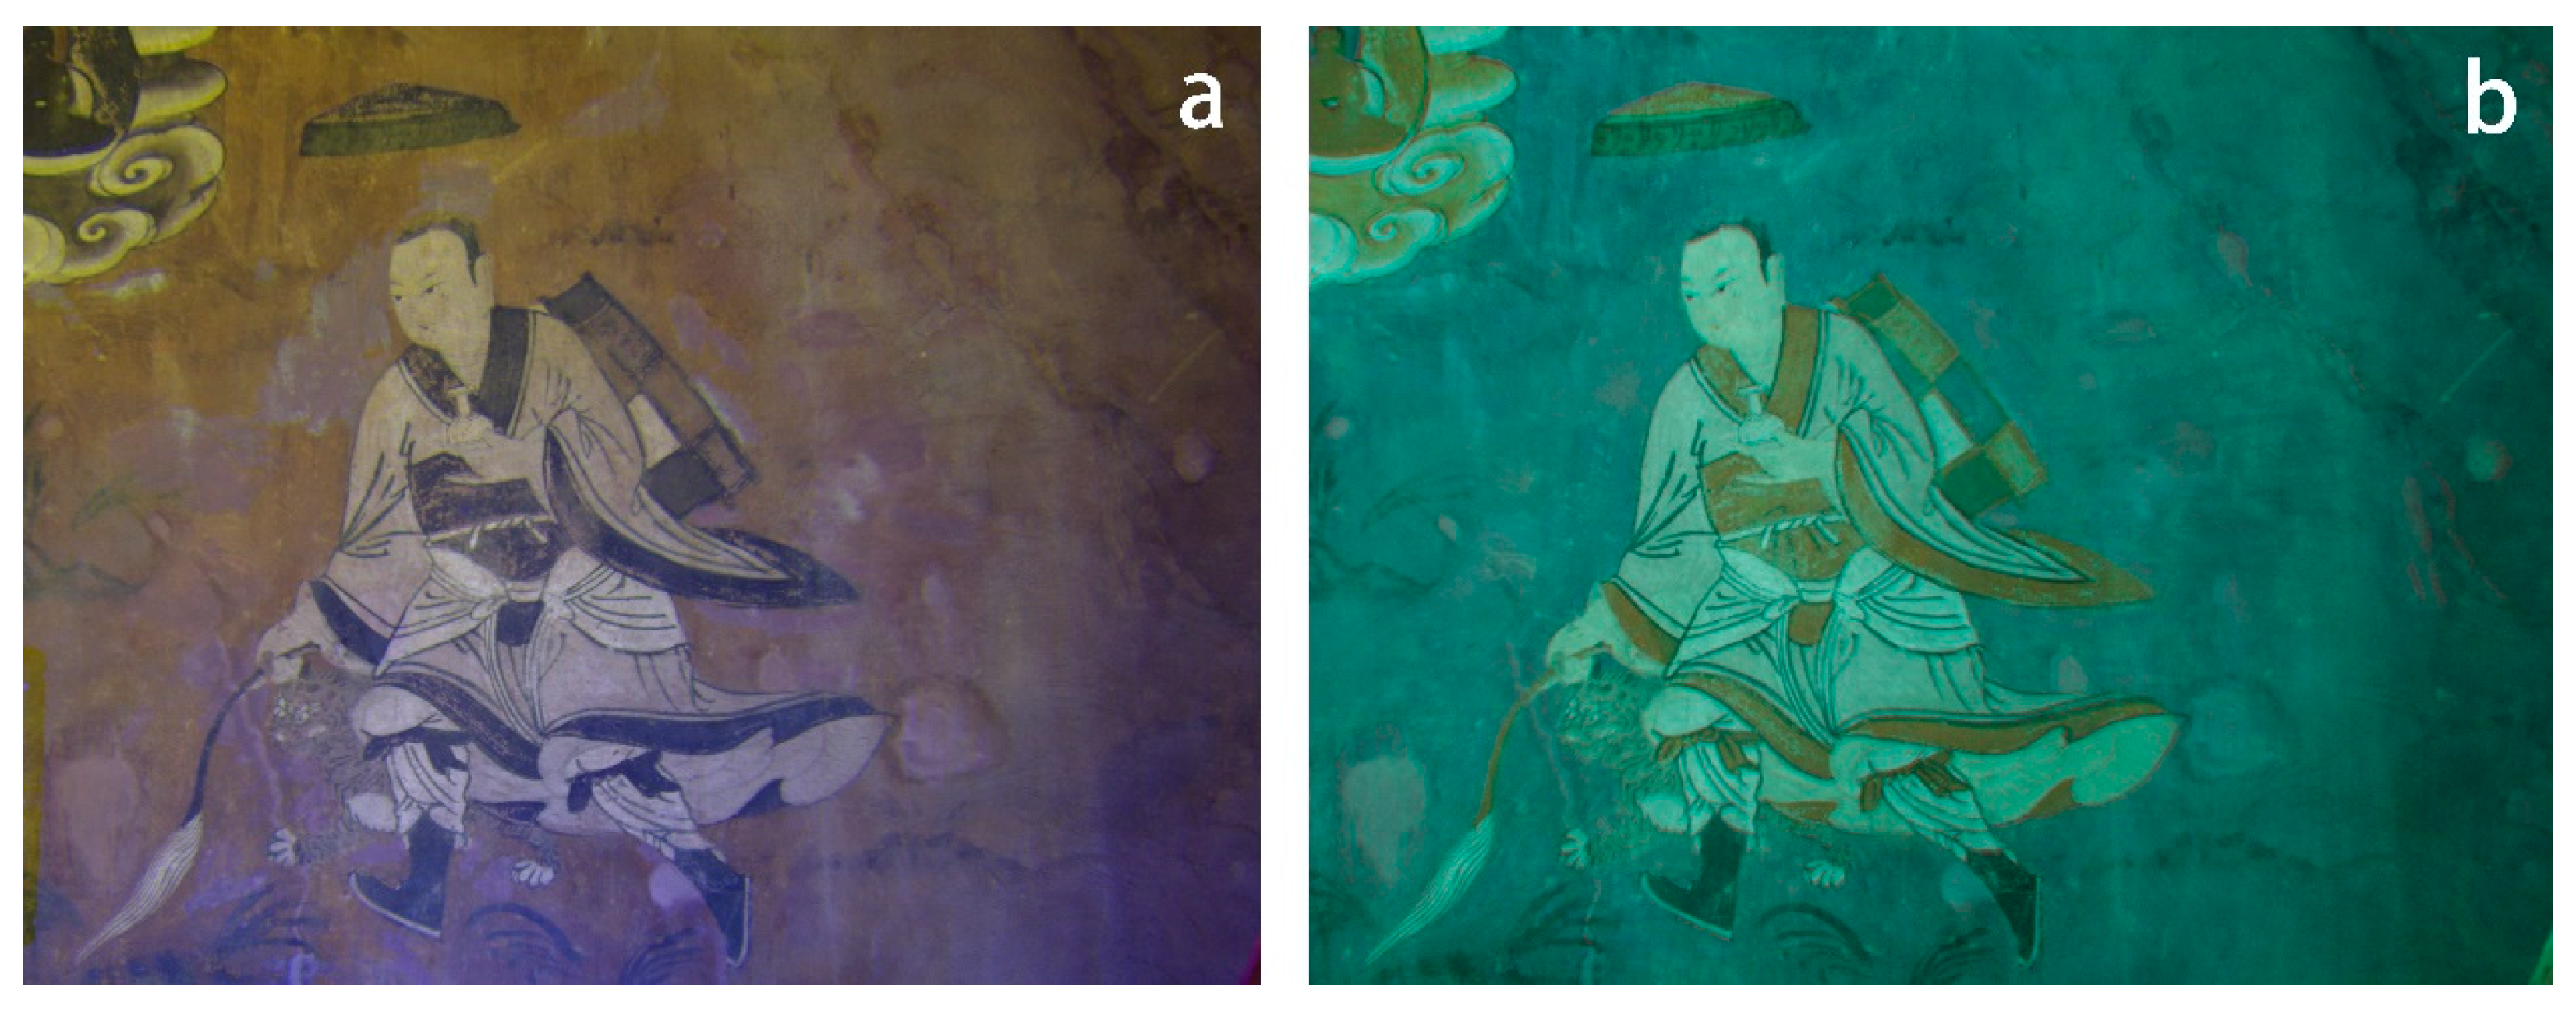
The UV false-colour map shows that the green background corresponds to the yellow area in the false-colour map, which is unevenly coloured due to historical restoration traces. The red part of the figure’s clothes is shown as black in the false colour map. The white of the skin, the grey of the clothes, and the white of the belt are all shown as colourless white or grey, and the black pigment in the visible light appears black in the ultraviolet false-colour map. The infrared false-colour image reveals an irregular background distribution, suggesting evidence of historical restoration. The head of the Buddha statue displays tratteggio, while spot-like restoration marks are evident around the dusting brush and the skirt (Figure 14).

3.2. Colour Measurement

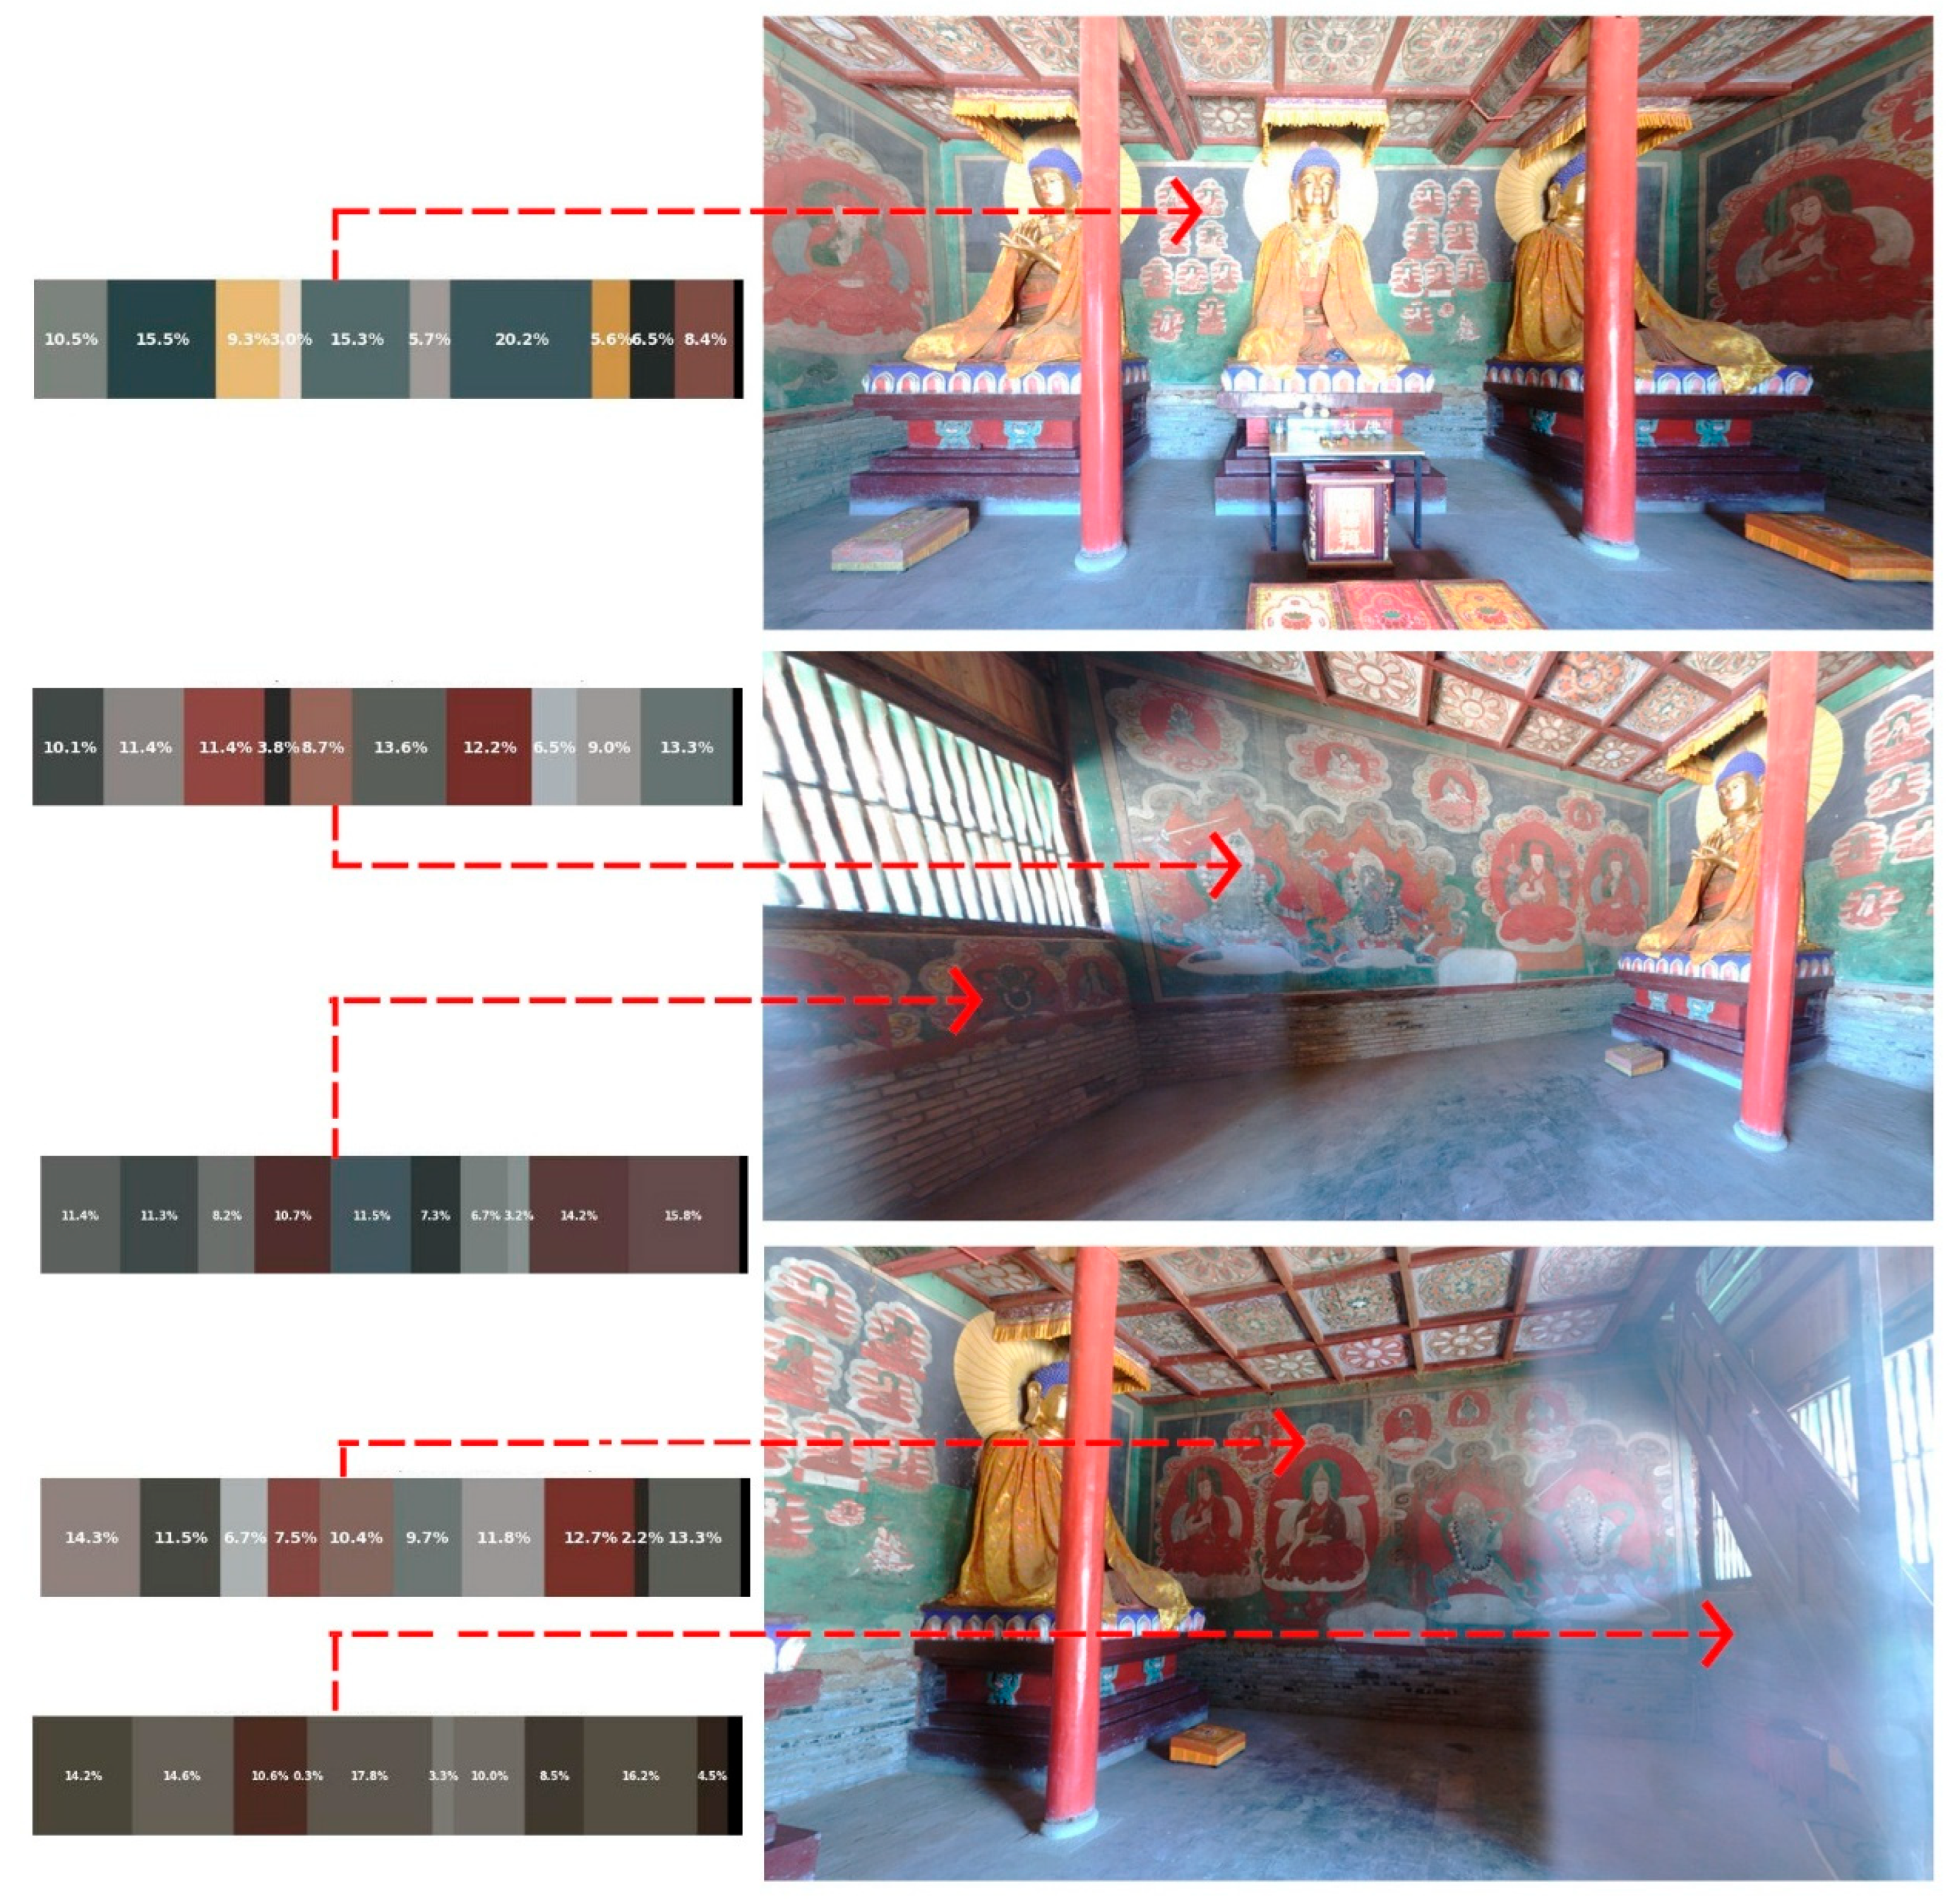
K-Means clustering was performed in RGB mode on the model exported after 3D scanning and constructed colour-scale spatial models (Figure 15). The results indicate that the colours of the south wall are predominantly blue, green, and yellow, with small amounts of black and red. The colours of the west wall are mainly green, grey, red, blue, and orange. The colours of the east wall are mainly green, grey, red, blue, and brown. The colours of the south wall are mainly green, grey, red, and blue. The colours of the overall mural are green, grey, red, and blue. The murals exhibit diminished lightness and saturation due to dust and other factors.
The points in the sample were collected using a spectrophotometer. Colour changes were evaluated through the CIE Lab system. Compared to other colour models, the CIE Lab colour space and its polar coordinates (CIE-LCh) can more accurately capture and quantify the nuances of human-perceived colour differences. The colour values in the Liuli Hall of Meidai Lamasery are mainly distributed in red, green, yellow, blue, and white, with regular chromaticity distribution, and the overall colour distribution is concentrated. The L values of red, green-yellow, dusty yellow, and blue-white are all medium-low. The green-red values are also medium-low, as are the blue-yellow values. The C value is at a low-to-medium level (Table 2). In the Liuli Hall of Meidai Lamasery, brightness and colour are at a low level, and, in addition to the accumulation of dust, they are a major reason for the mural’s raw materials in the ageing of animal glue.
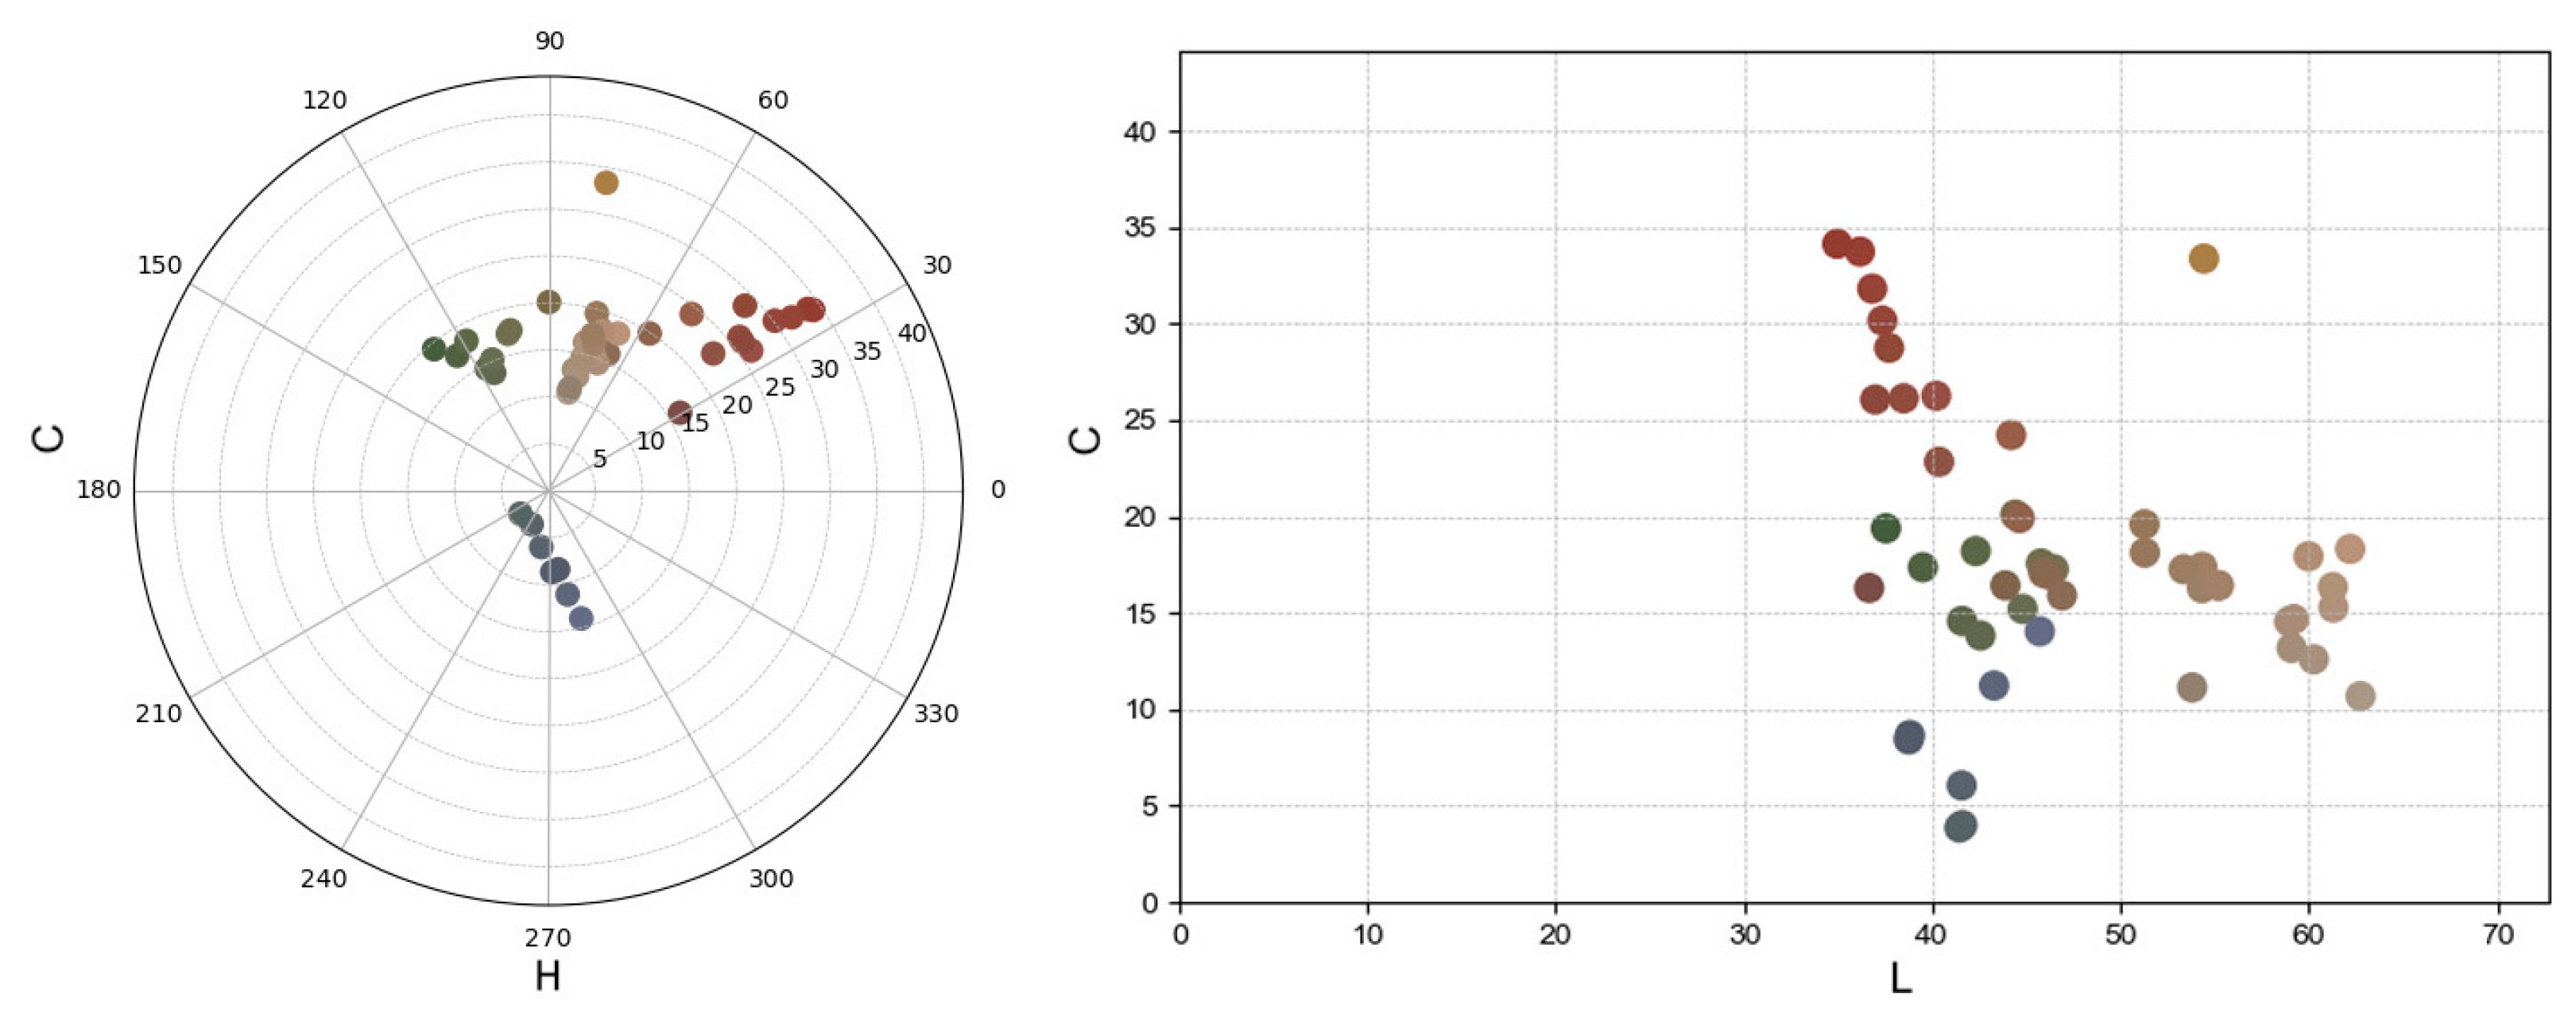
There was a conversion from the CIE Lab model to the more intuitive CIE LCh model, which was then used to construct the colour space model. The hue angles of these colours are distributed mainly between 0–60° and 240–300°, corresponding to warm reds, yellows, and cool blues, respectively. The green hues are positioned around 90–150° (Figure 16). The saturation chroma of most colours is in the low-to-medium range, indicating that the colour has experienced some degree of fading or discolouration, which is related to pigment ageing, the effects of environmental factors, or degradation of the binding material. The tendency for colour dots to cluster indicates that some of the colour may have changed due to oxidation, degradation, or surface contamination. Over time, the original vibrancy has diminished.
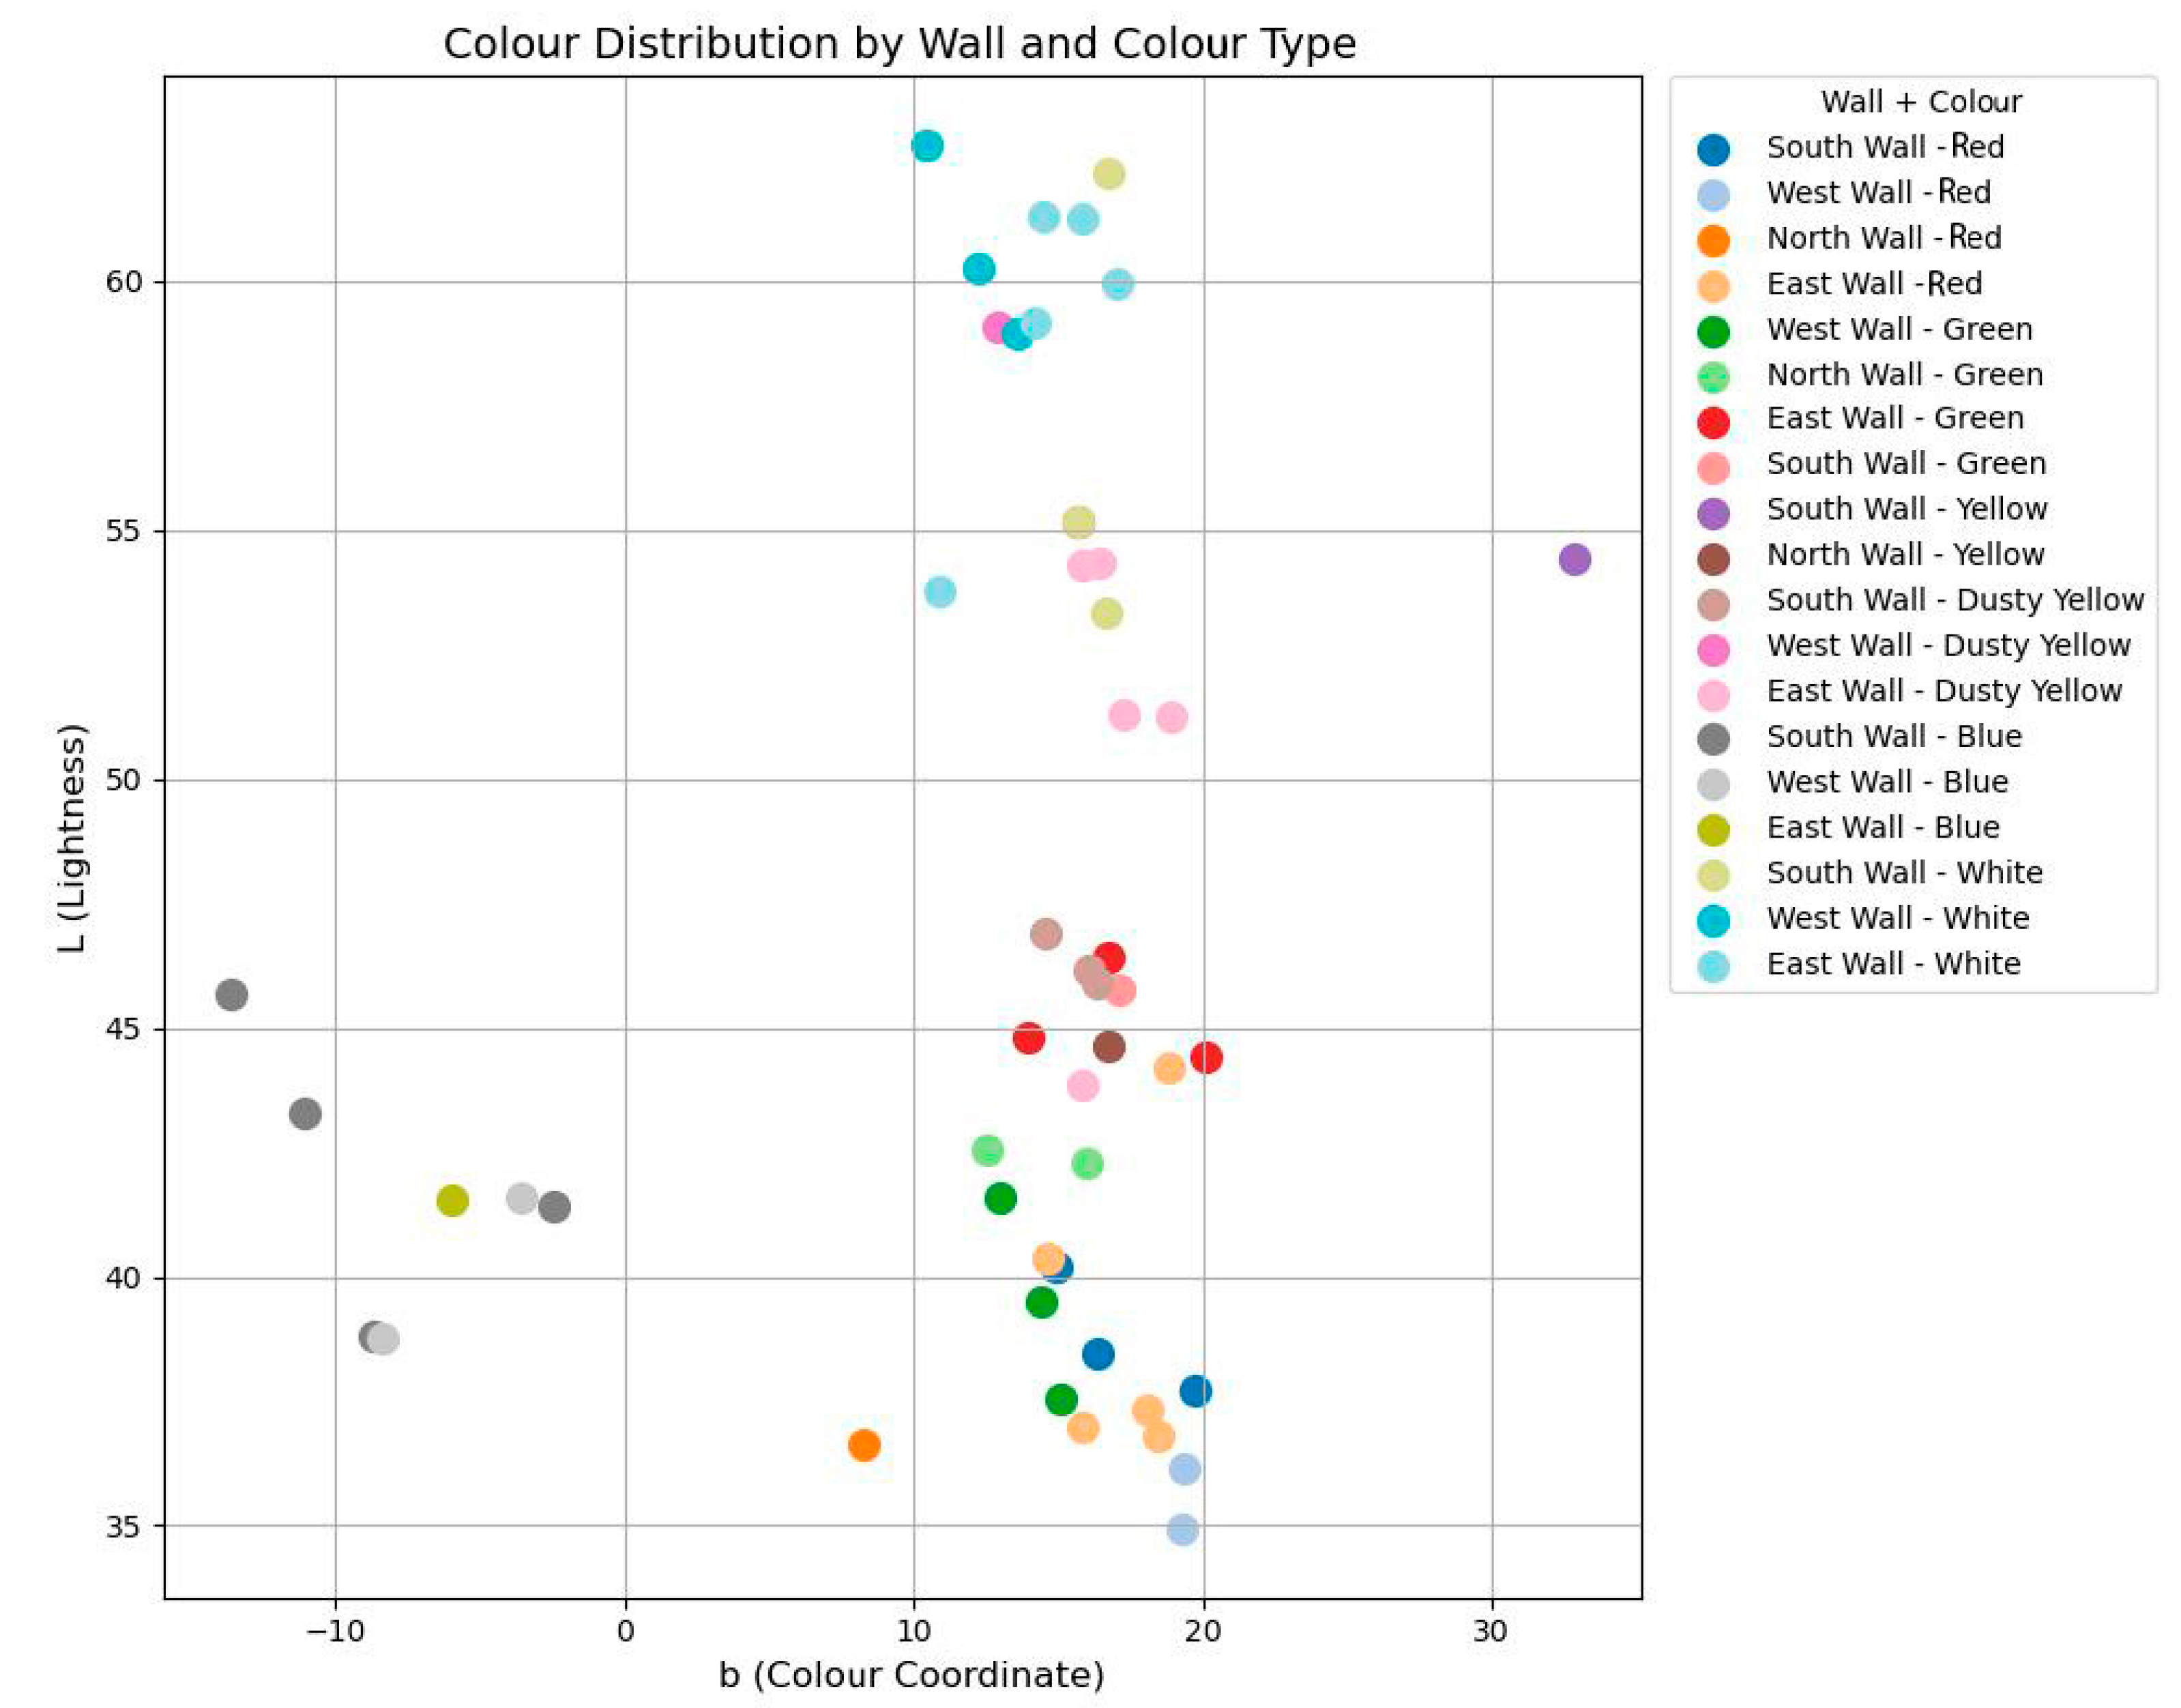
In specific areas, except for white and dusty yellow, the average L value of the south-wall mural samples is notably higher than those of the east and west walls. The b-values on the east and west walls are also higher than those on the south wall. In cinnabar-rich regions, the L values are low, likely reflecting reduced brightness due to light-induced degradation [51,52], which is consistent with the visibly darkened cinnabar observed on site. Most b-values range between 10 and 20, except for the blue regions (Figure 17).
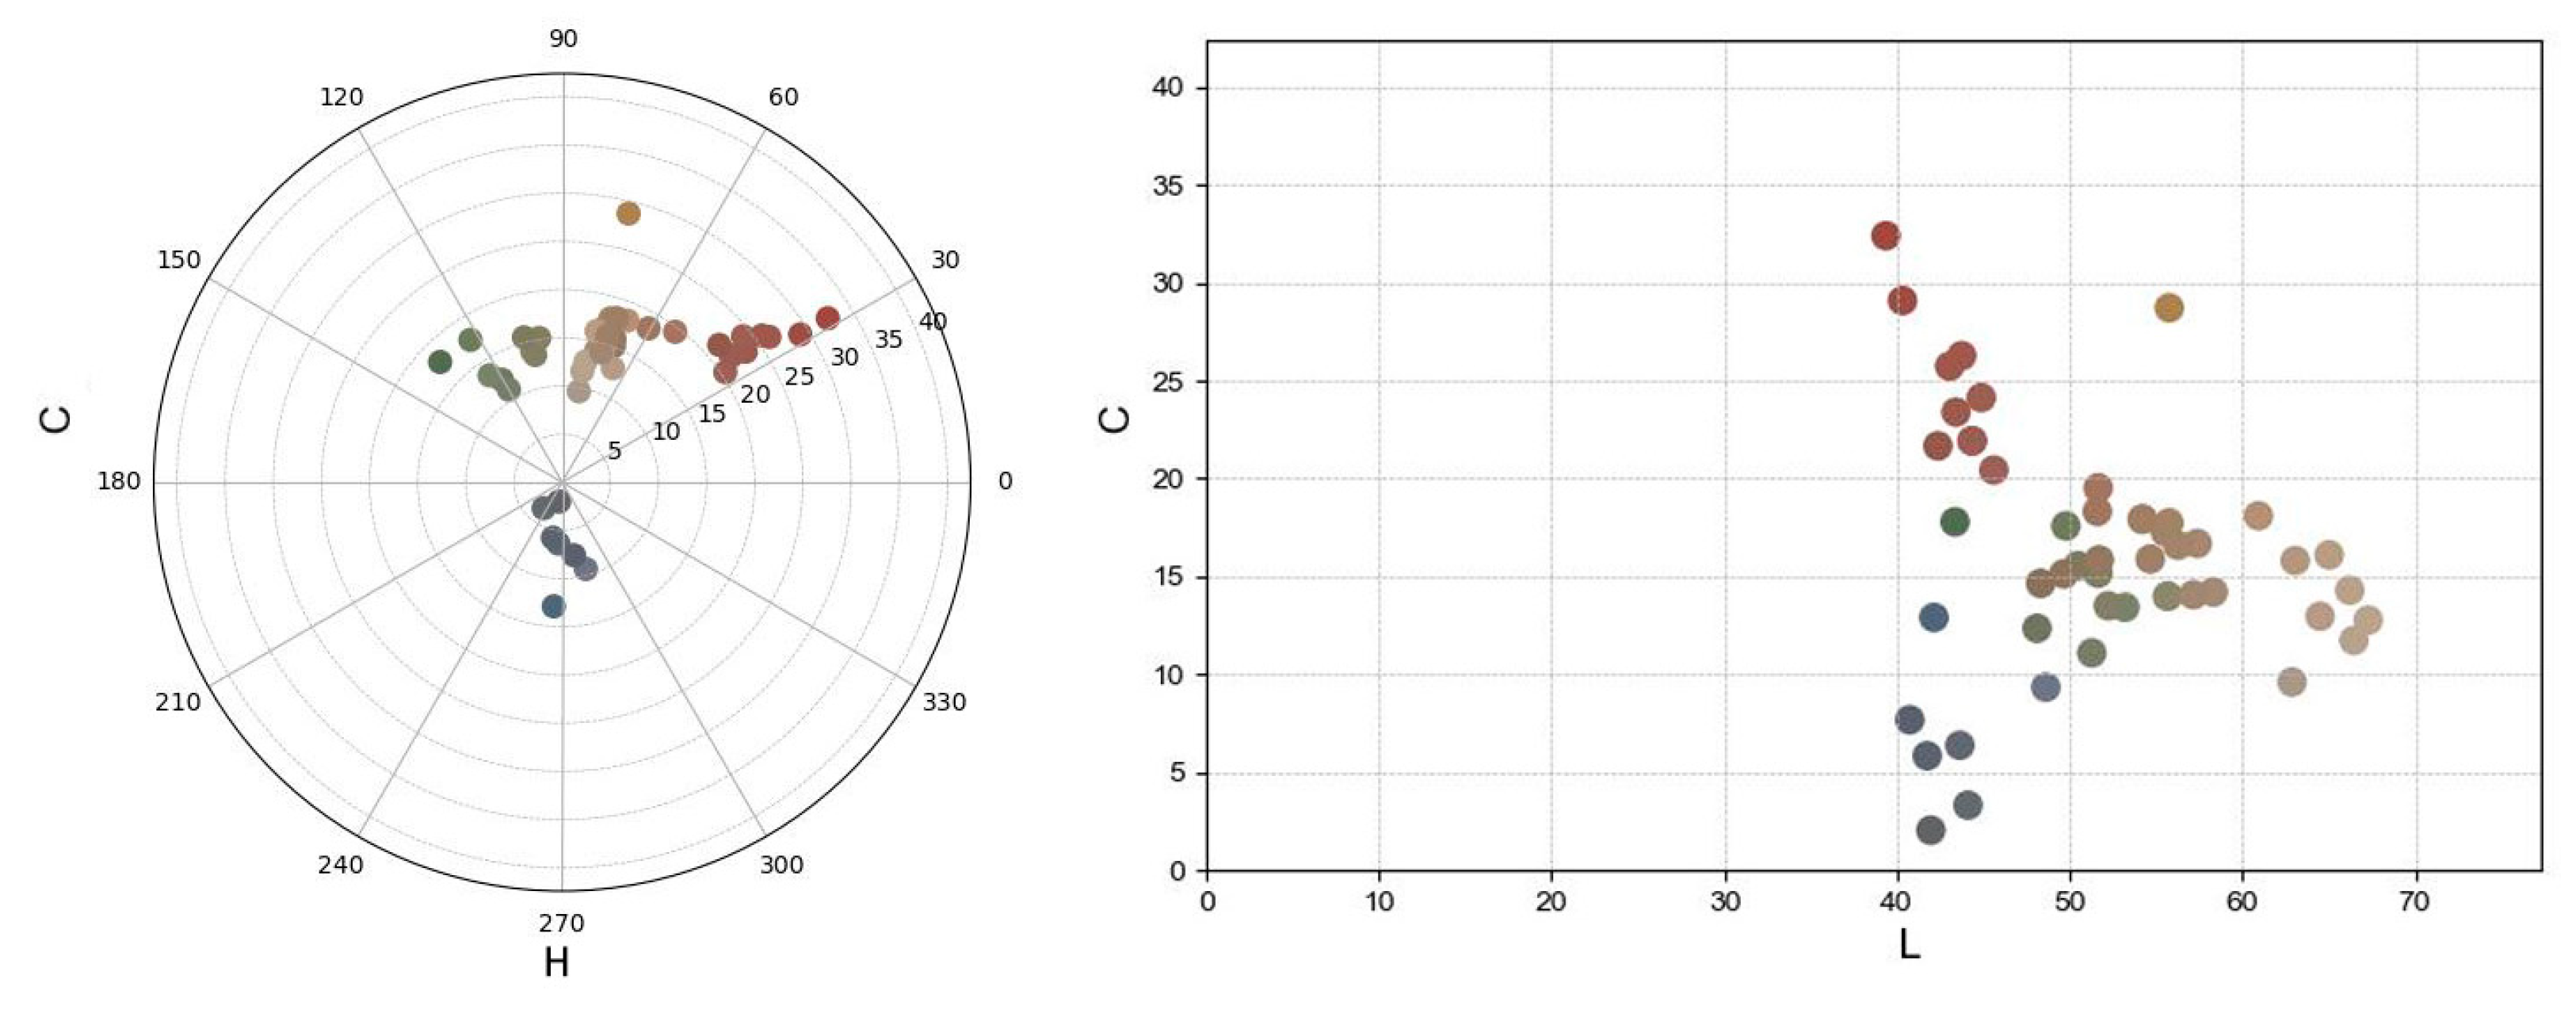
The ageing and degradation of materials is a time-dependent process. To verify the reliability of the research model, we extended the experimental period and data tracking. Colourimetric data reflecting changes in the interior of the hall were collected after one year. A comparison between the initial and follow-up measurements reveals notable chromatic shifts. As shown in the LC and LCh polar coordinate plots (Figure 18), several red and green pigments exhibit a downward shift in C values, suggesting a loss in saturation. Meanwhile, certain blue-grey tones show a slight increase in L values, indicating surface lightening, potentially due to dust accumulation or pigment fading. The overall trend points toward a reduction in colour purity and increased convergence of chromaticity, which aligns with the expected effects of environmental exposure and material ageing.
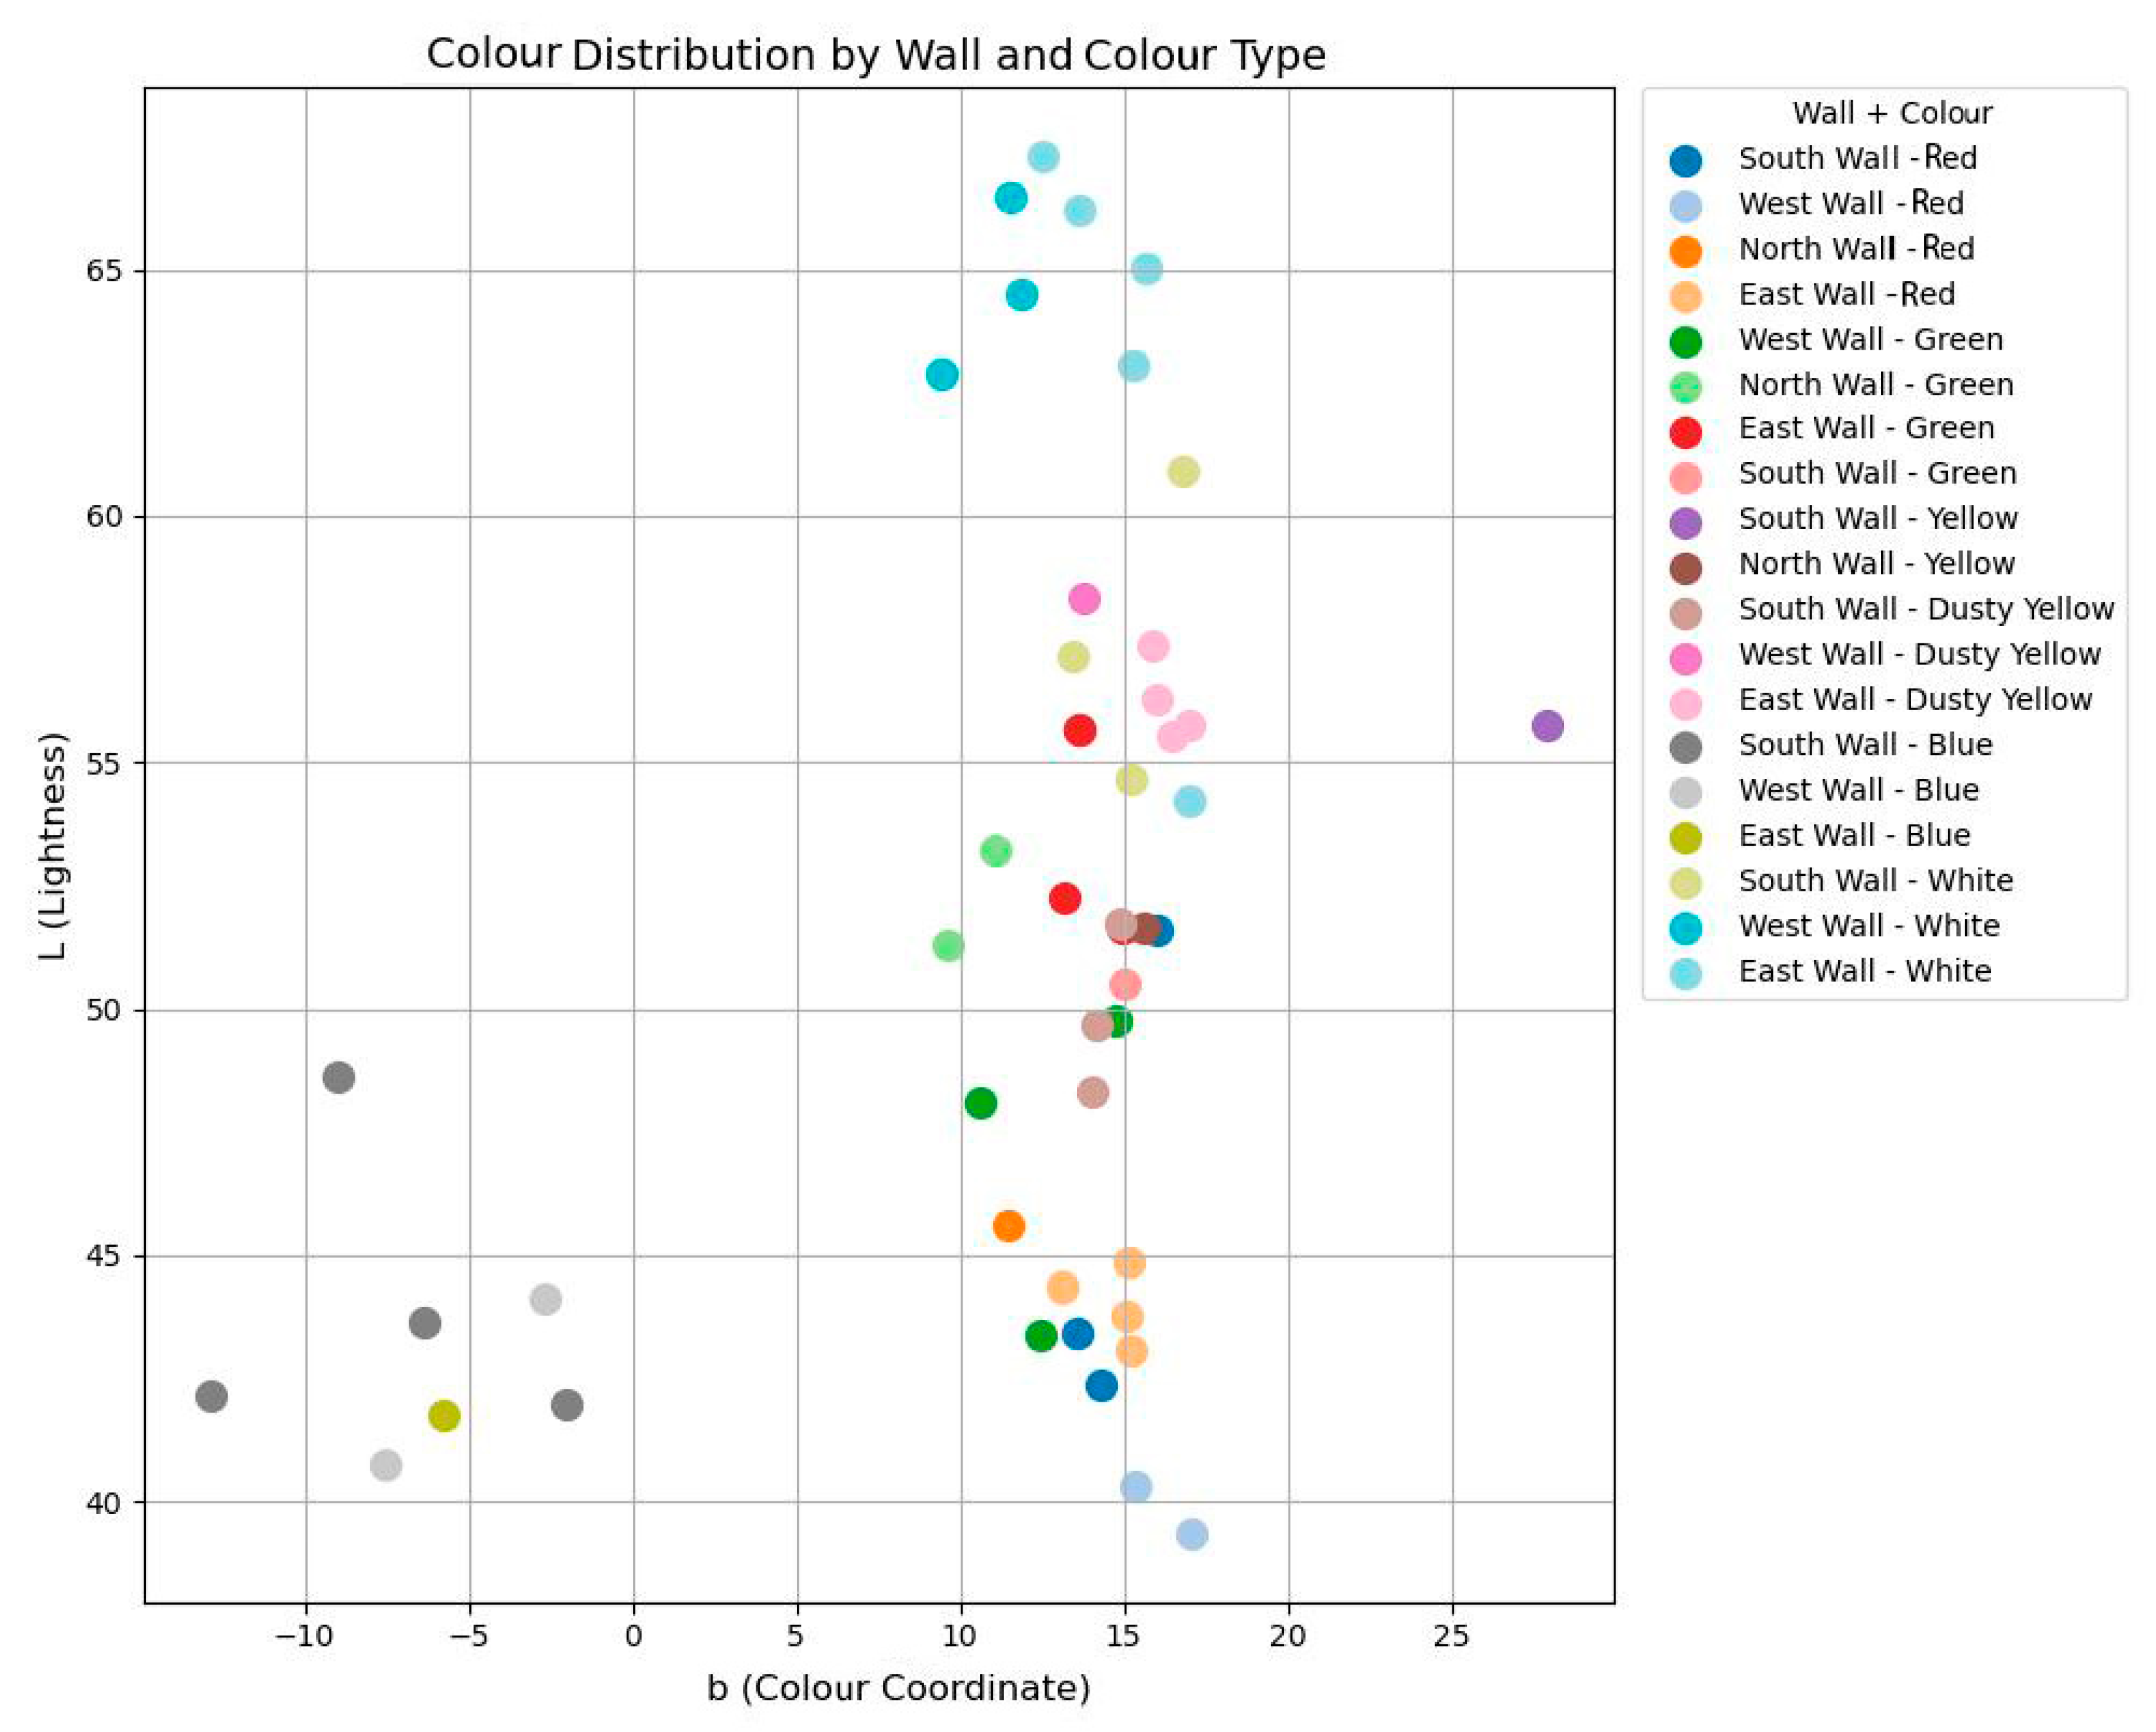
Further comparison of the L–b distributions before and after the one year interval reveals perceptible shifts in both lightness and chromatic direction. As illustrated in Figure 19, a number of colour points, particularly in red, dusty yellow, and white regions, exhibit increases in L values, indicating a progressive surface lightening. This may result from surface dust accumulation, the fading of organic binders, or the degradation of pigment layers. Additionally, a contraction of b-values toward the neutral axis is observed in several blue and green areas, suggesting a desaturation or chromatic flattening effect. This phenomenon is likely associated with pigment ageing, airborne pollution, or minor environmental fluctuations such as humidity and airflow. The collective movement of points toward higher L and moderate b-values supports the trend of reduced colour saturation and increasing uniformity over time.
These observed changes further support the validity of the proposed correlation model, confirming that pigment composition and environmental conditions jointly contribute to the progressive alteration of mural colours over time.

4. Discussion

This study addresses how pigment material composition and space factors work together to influence the variation in colour in mural paintings.
HSI and XRF analyses of pigment type and elemental content show a clear correlation with the quantitative analysis of CIE Lab colours. It was found that the L value of cinnabar, litharge, and chlorocopperite was low, and the b-values of blue and green, which are copper-based pigments, were negative. It is presumed that oxidation of the surface of the pigment particles or loosening of the particles took place, which led to the overall darkening of the colours of the murals. Cinnabar has a high a-value, and oxidation or other light-induced chemical reactions may have occurred. Lead white has high b-values, indicating yellowing or discolouration.
The proportion of elemental Hg is higher in the light-devarnished cinnabar area on the west wall, but the b-value in the Lab colour space is higher, suggesting that oxidation or other light-induced chemical reactions may have occurred on the surface of the cinnabar pigment. Higher b-values also occurred in the green and blue pigment areas of the west wall, which may have originated from changes in the crystal structure of the pigment or the ageing of the cementing material.
The L value of the point of the south wall is significantly higher than on the other walls, indicating that the colour saturation of the other walls is higher than that of the south wall, which is due to the accumulation of dust on the wall paintings, and the phenomenon of accumulation of dust is closely related to its architectural form, spatial layout, and airflow movement.
Meidaizhao is located in Inner Mongolia and belongs to the temperate continental climate, which is dry throughout the year with little rain, especially in the spring when there is more sandy weather. According to the China Meteorological Data Service Center, the prevailing wind direction is usually north-west (Figure 20a). This means the following: the north wall is relatively less exposed to the wind, but the south wall is located on the windward side and is prone to becoming a sand accumulation point. When the sand and dust carried by the wind touches the south wall, it settles due to the reduced wind speed, leading to increased dust accumulation. The interior space of Liuli Hall is weakly lit, especially the south wall, which is less exposed to sunlight than the interior. Additionally, the air convection effect is weakened, and it is a low-velocity zone of air flow, leading to the easier deposition of dust. In buildings, hot air is usually discharged from high places, while the airflow in low places is relatively stagnant. The south-wall mural is in a lower position with insufficient thermal pressure effect, the air flow is low, and dust is more likely to accumulate (Figure 20b). Regarding indoor dust accumulation, we collected particulate data from Liuli Hall between 12 May 2024, and 12 May 2025. The measured deposition rates ranged from 59.70 to 248.76 g/m2, with the highest accumulation observed on the south and east walls. These results indicate significant indoor particulate pollution contributing to the colour change in the murals, and data collection is still ongoing (Figure 20c).
To better understand the environmental conditions affecting mural degradation in Liuli Hall, key climatic parameters, including air temperature, relative humidity, wind speed, wind direction, and solar radiation, were monitored monthly over the course of one year. The dataset thus provides an essential reference for interpreting mural colour change patterns and guiding environment-based conservation strategies (Table 3).
The east and west-wall murals have low L and higher b. In terms of sunlight, the east and west murals form a localized high-light area on the wall, resulting in a more rapid ageing process. Photodegradation is likely to occur under long-term UV irradiation, leading to fading or discolouration. The low solar altitude angle in winter subjects murals to direct exposure for long periods, resulting in more significant fading. Binding materials are prone to yellowing under ultraviolet radiation, thus altering the overall tone of the mural and diminishing its original vividness (Figure 21) [53,54].
Before proposing cleaning measures, we conducted a systematic assessment of the conservation state of the murals. Structural and ground layer deterioration, including detachment of the preparatory layer, bulging, and alkali efflorescence, accounts for 32.44% of all documented damages. Pigment layer issues, such as localized flaking, pigment loss, and water staining, represent 17.97% of the total damage. Surface contamination, including mud stains, historical overpainting, and covering materials, constitutes the remaining 49.59%. The murals were primarily executed using natural mineral pigments bound with animal glue, and their colour expression is significantly influenced by environmental conditions.
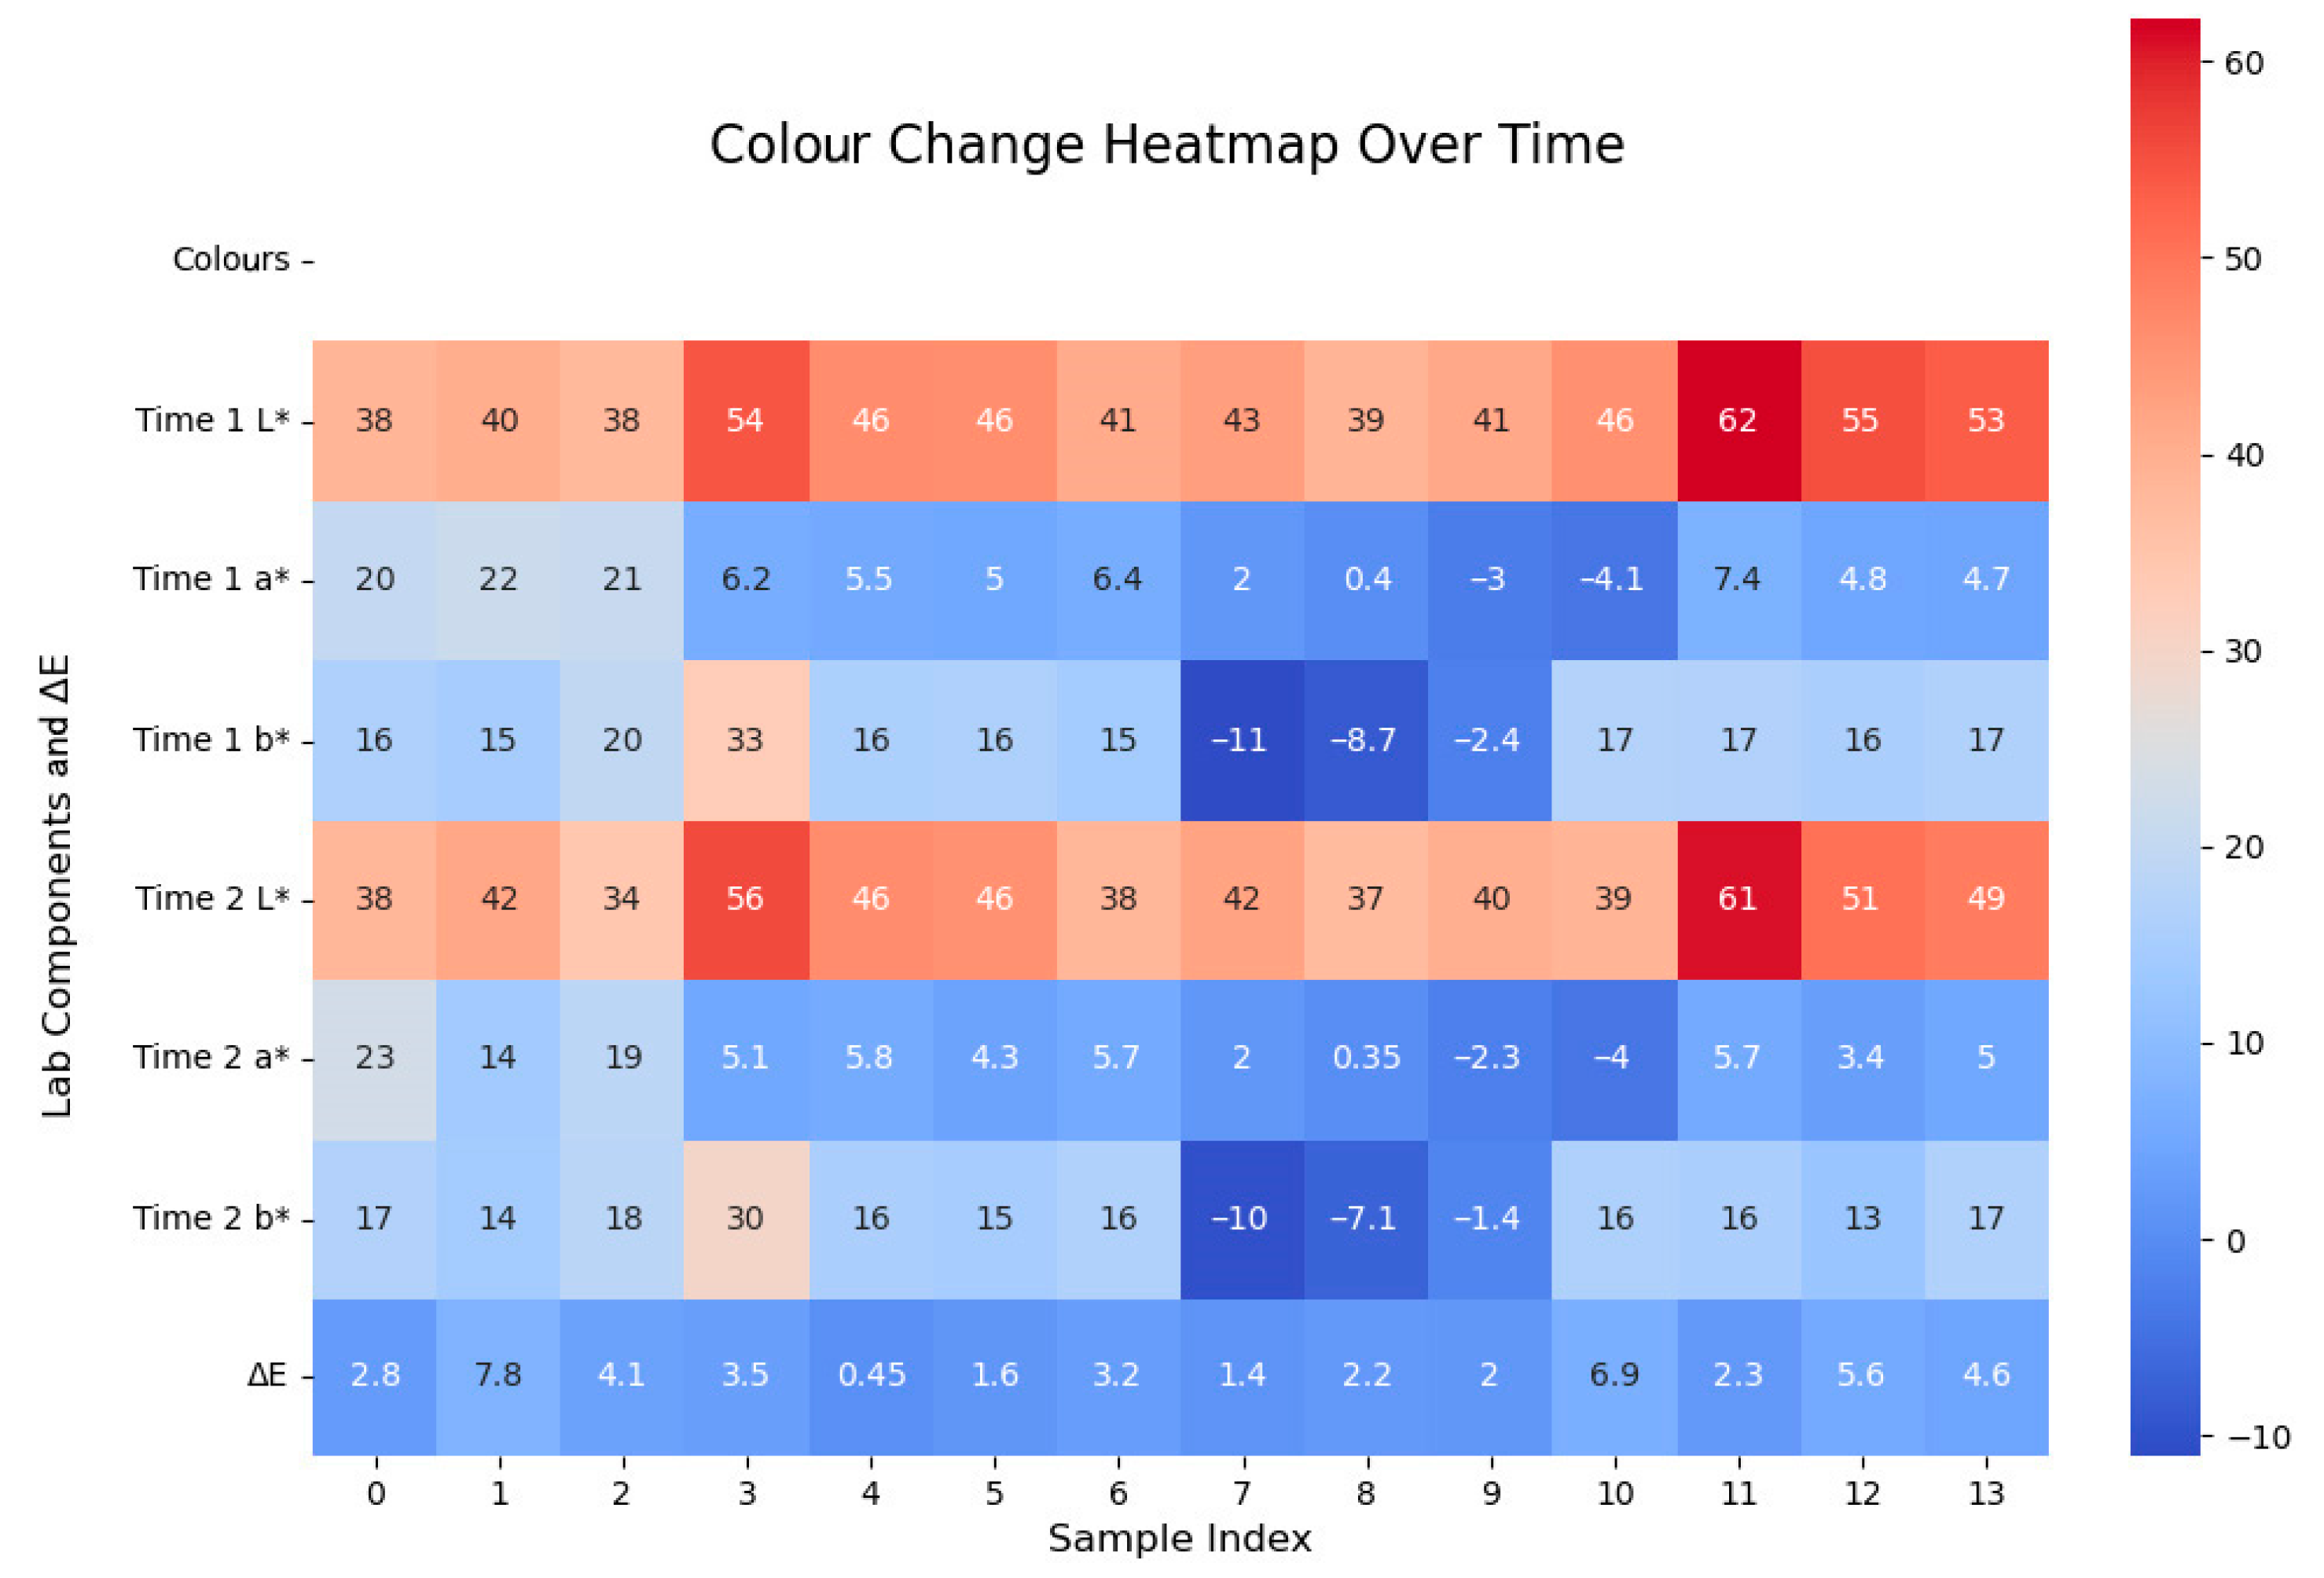
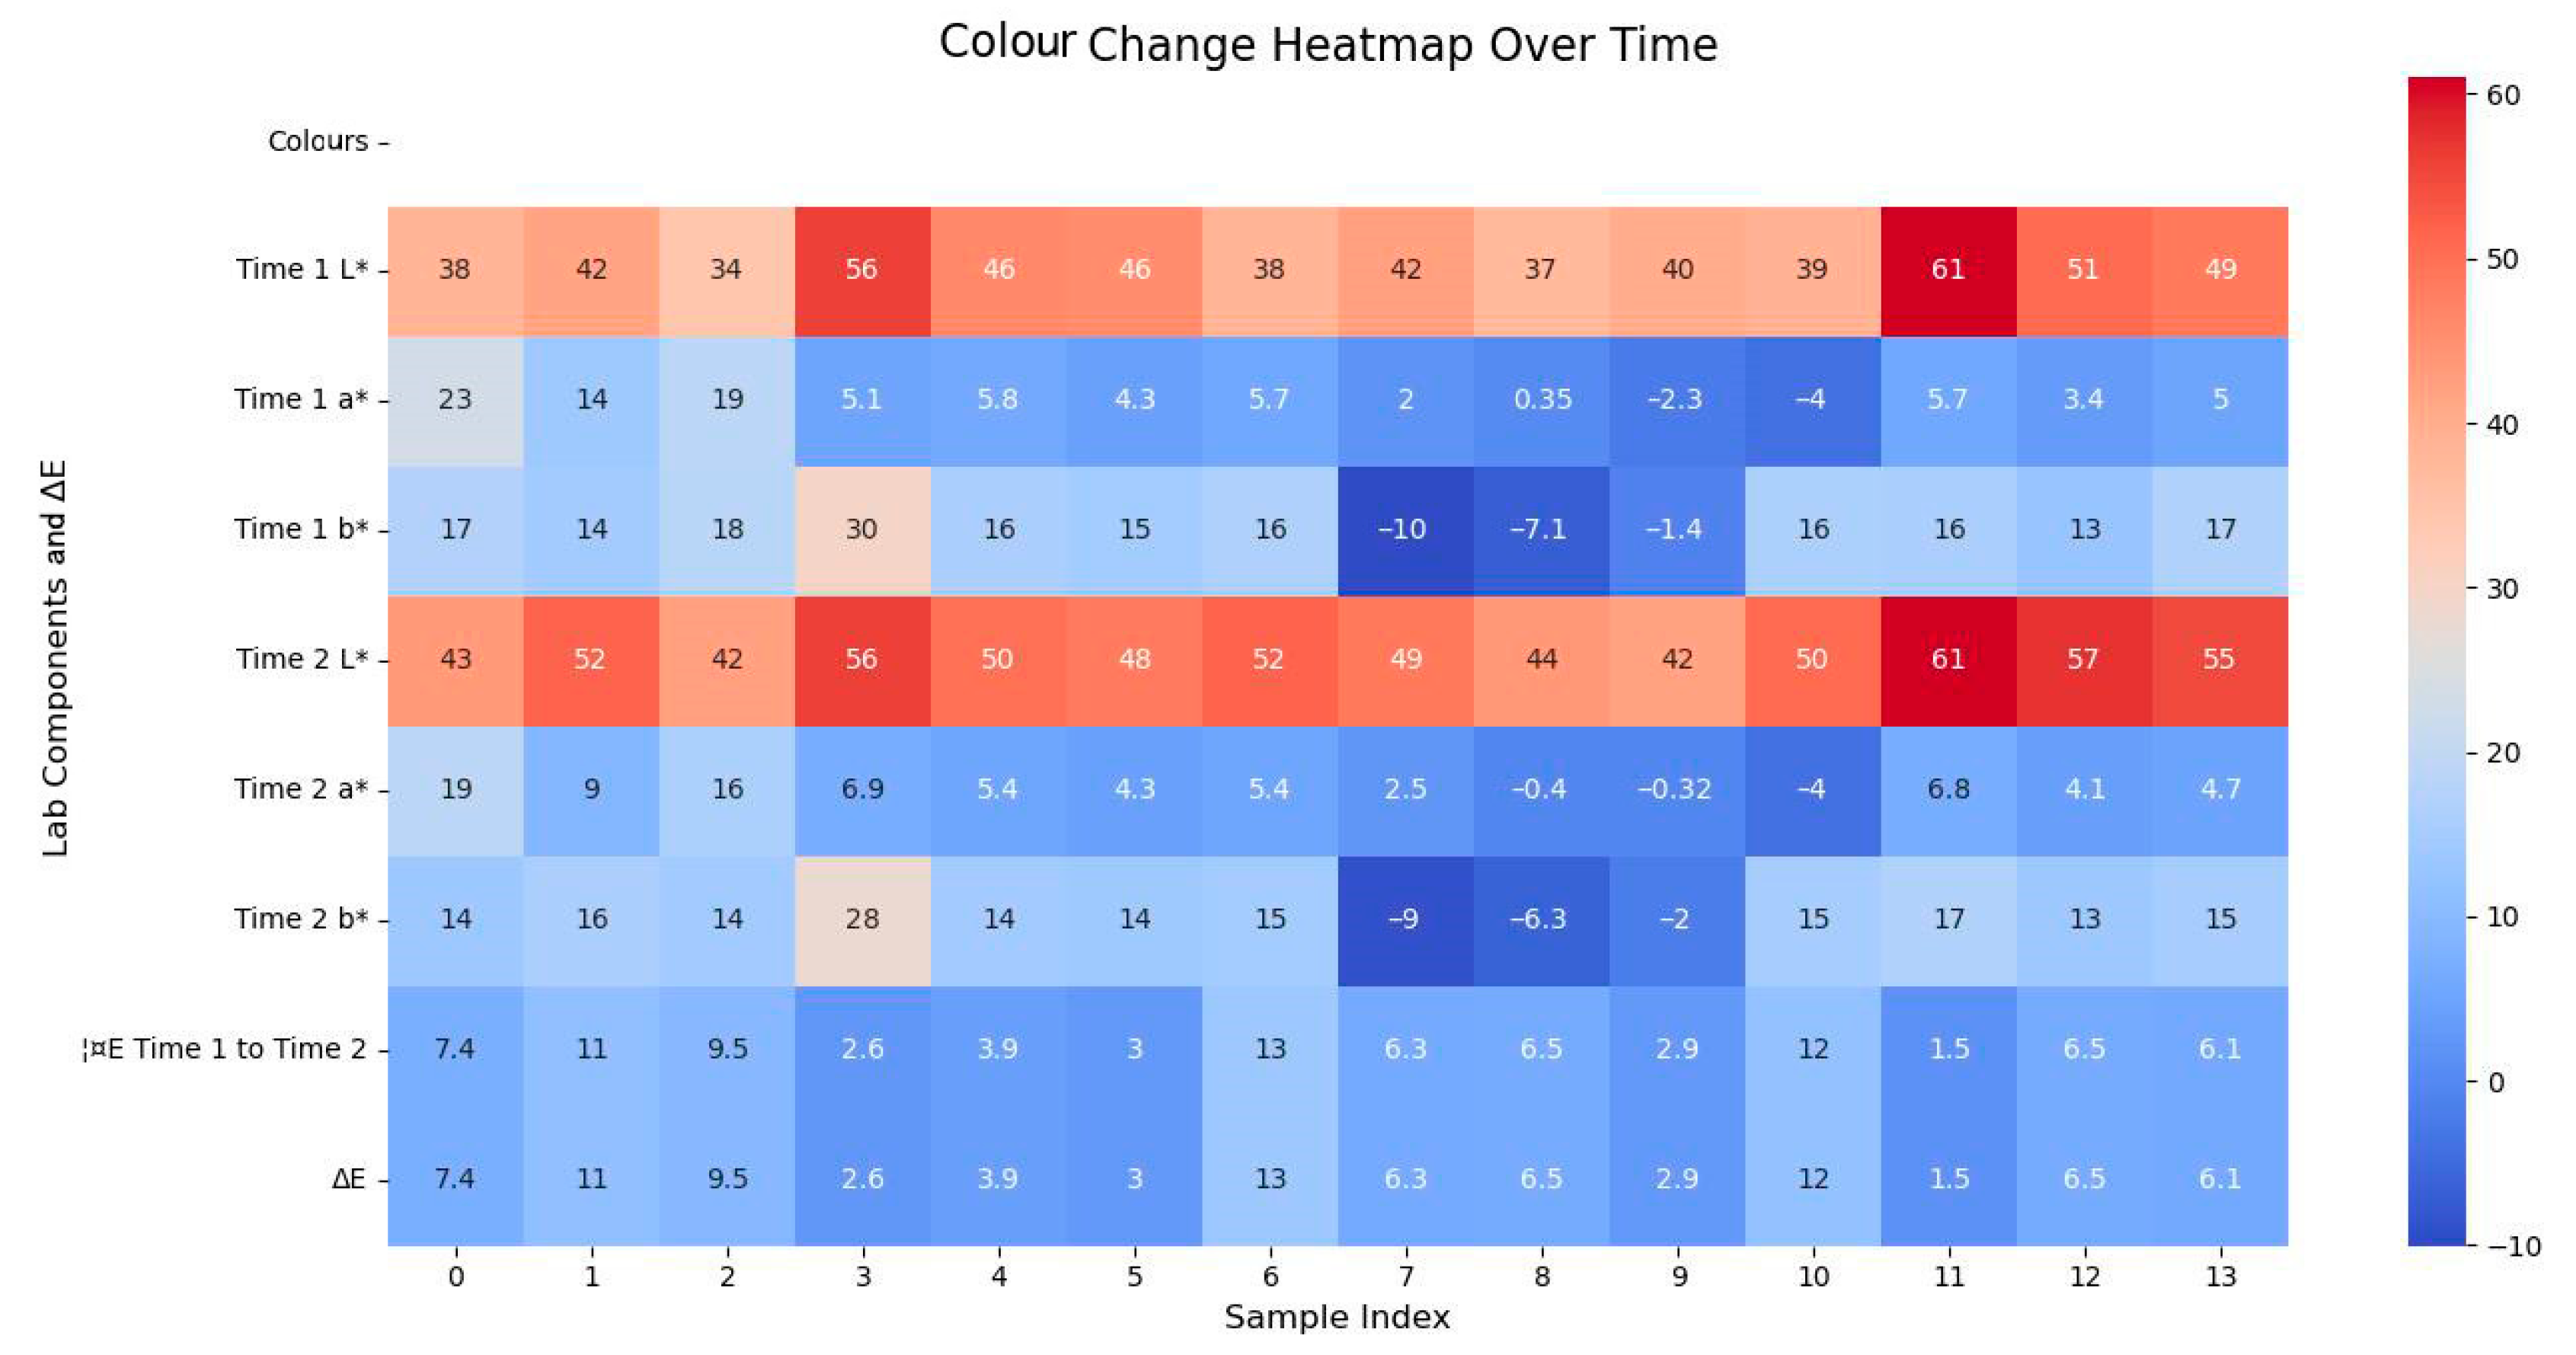
The south wall exhibits significant dust accumulation; it is difficult to remove it completely in a single cleaning due to the strong adsorption of the accumulated dust particles and the possible development of multi-layer deposits. Therefore, during the cleaning process, it is recommended to use the stepwise repeated cleaning method to perform two treatments, ensuring the effective removal of dust. Studies have shown that multiple gentle cleanings can increase the rate of contamination removal without damaging the surface material of the mural. Step 1: Remove loose contamination particles from the surface using a low-concentration cleaning agent. Step 2: Remove residual contaminants using microemulsion or colloidal dispersion techniques to ensure the integrity of the mural’s colour layer and substrate. For the east and west walls where the light makes the cemented material age and turn yellow, it is recommended that antioxidant materials such as nano-calcium hydroxide be added to the restoration material. The cleaning of the mural has now been completed on site as recommended, and the results are shown in this picture (Figure 22). The changes in colour Lab* values and ΔE before and after dust removal are shown in the heatmap (Figure 23).
To evaluate the long-term effects of the proposed protection measures, we compared the values measured immediately after dust removal; most sampling points exhibited a significant increase in ΔE after one year. While the initial ΔE values were relatively low, subsequent increases up to 9.8 units suggest considerable colour change over time. This could be attributed to renewed dust accumulation, environmental exposure, or ongoing pigment degradation. Only a few points remained stable or improved slightly. These results highlight the importance of long-term monitoring and the potential need for supplementary protection strategies following cleaning interventions (Figure 24).
The phenomenon of colour changes in murals due to the interaction of pigment components with environmental factors observed in the mural paintings of Medaizhao is similar to that reported in historical fresco sites in Italy, Spain, and elsewhere, where humidity, light, and atmospheric pollutants can lead to changes in colour. Similar pigment changes have been observed in murals at Dunhuang and in Tibetan Buddhist temples, particularly the ageing of litharge and organic binders.
This study provides a replicable research paradigm for the conservation of cultural heritage under similar climatic conditions, and the results provide a general methodology for the conservation of colour in Tibetan Buddhist murals on the plateau. Due to the current preservation status of the wall paintings in Meidaizhao and the limitations of the research conditions, there are some limitations in the sample area and analysis dimensions of this study, which can be further expanded to larger areas and richer micro-environmental monitoring and simulation experiments in the future [55]. In subsequent studies, we can further expand to more areas and richer micro-environment monitoring and simulation experiments and explore more emerging materials for the preventive preservation of historical murals.

5. Conclusions

In this study, we propose an integrated deterioration diagnostic framework for mural paintings, which combines HSI, XRF, FORS, MSI, and CIE Lab-based colourimetric analysis. This multidisciplinary approach successfully bridges pigment composition with observed chromatic changes, revealing material-specific degradation pathways.
Based on the combined results of XRF, FORS, and HSI analyses, the red pigment was identified as cinnabar, the green pigment as chlorocopperite, the blue pigment as azurite, and the white pigment as chalk. Animal glue and dry oil were used as binders. Traces of historical restoration were found in the section of the Venerable Dharmodara’s statue on the north wall of the hall using multi-spectral imaging.
Combining in situ detection technology with a colour space model, we found out that the L values of cinnabar, litharge, and chlorocopperite were low, and the b-values of blue and green, which are copper-based pigments, were negative. Cinnabar has a high a-value. Lead white has high b-values. The saturation chroma of most colours is in the low-to-medium range. This shows that the L value of the point of the south wall is significantly higher than the other walls. It was found that the east and west wall-murals have low L and higher b-values. This is due to the air flow and light inside the building. Due to the use of mineral pigments and the low humidity, the change in b-values is mainly due to the ageing of the animal glue.
It is recommended that the south wall should be dusted twice and that antioxidant materials should be added the restoration of the east and west walls. Cleaning of the murals has now been completed as recommended.
This research not only advances the scientific understanding of mural deterioration mechanisms but also provides a replicable and non-invasive diagnostic strategy for heritage conservation globally. The integration of spectral, elemental, and colourimetric data offers a valuable scientific paradigm with strong international applicability and practical relevance.

Supplementary Materials

The following supporting information can be downloaded at: https://www.mdpi.com/article/10.3390/chemosensors13060202/s1. Supplementary File S1: Polarizing micrograph of the cinnabar sample. Supplementary File S2: Microscopic image of green pigment particles. Supplementary File S3: Raman spectrum of the green pigment. Supplementary File S4: The structure of the white powder layer. Supplementary File S5: XRF spectrum of the white powder layer. Supplementary File S6: Digital microscopic image of the repair trace (60×).

Author Contributions

Conceptualization, X.L. and J.Z.; investigation, X.L. and J.W.; data curation, X.L. and E.S.; writing—original draft preparation, X.L.; writing—review and editing, X.L., J.Z. and Y.H.; supervision, J.Z. All authors have read and agreed to the published version of the manuscript.

Funding

This work was supported by the Research Fund of the Wudang Lamasery Mural Protection Pre-research Project (BTZCS-C-F-240061).

Institutional Review Board Statement

Not applicable.

Informed Consent Statement

Informed consent was obtained from all subjects involved in the study.

Data Availability Statement

The authors confirm that the data supporting the findings of this study are available within this article.

Conflicts of Interest

The authors declare no conflicts of interest.

References

  1. Wang, Y.; Wu, X. Current progress on murals: Distribution, conservation and utilization. Herit. Sci. 2023, 11, 61. [Google Scholar] [CrossRef] [PubMed]
  2. Valadas, S.; Candeias, A.; Mirão, J.; Tavares, D.; Coroado, J.; Simon, R.; Silva, A.; Gil, M.; Guilherme, A.; Carvalho, M. Study of mural paintings using in situ XRF, confocal synchrotron-μ-XRF, μ-XRD, optical microscopy, and SEM-EDS—The case of the frescoes from Misericordia Church of Odemira. Microsc. Microanal. 2011, 17, 702–709. [Google Scholar] [CrossRef] [PubMed]
  3. Domenech-Carbo, M.T. Novel analytical methods for characterising binding media and protective coatings in artworks. Anal. Chim. Acta 2008, 621, 109–139. [Google Scholar] [CrossRef] [PubMed]
  4. Janssens, K.; Dik, J.; Cotte, M.; Susini, J. Photon-based techniques for nondestructive subsurface analysis of painted cultural heritage artifacts. Acc. Chem. Res. 2010, 43, 814–825. [Google Scholar] [CrossRef]
  5. Mounier, A.; Le Bourdon, G.; Aupetit, C.; Belin, C.; Servant, L.; Lazare, S.; Lefrais, Y.; Daniel, F. Hyperspectral imaging, spectrofluorimetry, FORS and XRF for the non-invasive study of medieval miniatures materials. Herit. Sci. 2014, 2, 24. [Google Scholar] [CrossRef]
  6. Cucci, C.; Donell, S.; Zucchini, E.; Picollo, M.; Stefani, L.; Lippi, D. Fifteenth century Florentine mural investigated in situ with VNIR Hyperspectral Imaging and NIR Photography supports interpretation as a bloodletting scene. Sci. Rep. 2024, 14, 11698. [Google Scholar] [CrossRef]
  7. Moretti, P.; Piqué, F.; Ocampo, A.G.; Aceto, M.; Villa, L.; Cassitti, P.; Cavallo, G. Non-invasive study of Early Medieval wall paintings in the churches of St. Stephan in Chur and St. Martin in Disentis (Switzerland). J. Cult. Herit. 2024, 67, 368–376. [Google Scholar] [CrossRef]
  8. Fischer, C.; Kakoulli, I. Multispectral and hyperspectral imaging technologies in conservation: Current research and potential applications. Stud. Conserv. 2006, 51, 3–16. [Google Scholar] [CrossRef]
  9. Cucci, C.; Picollo, M.; Chiarantini, L.; Uda, G.; Fiori, L.; De Nigris, B.; Osanna, M. Remote-sensing hyperspectral imaging for applications in archaeological areas: Non-invasive investigations on wall paintings and on mural inscriptions in the Pompeii site. Microchem. J. 2020, 158, 105082. [Google Scholar] [CrossRef]
  10. Pan, N.; Hou, M.; Lv, S.; Hu, Y.; Zhao, X.; Ma, Q.; Li, S.; Shaker, A. Extracting faded mural patterns based on the combination of spatial-spectral feature of hyperspectral image. J. Cult. Herit. 2017, 27, 80–87. [Google Scholar] [CrossRef]
  11. Li, T.; Ning, B.; Yu, Z.; Li, L.; He, Y.; Wan, W.; Liu, Z.; Yu, X. Non-Destructive Differentiation of Ancient Murals Pigments by Hyperspectral Imaging. Available online: https://papers.ssrn.com/sol3/papers.cfm?abstract_id=4954588 (accessed on 28 May 2025).
  12. Dyer, J.; Sotiropoulou, S. A technical step forward in the integration of visible induced luminescence imaging methods for the study of ancient polychromy. Herit. Sci. 2017, 5, 24. [Google Scholar] [CrossRef]
  13. Tragni, C.B. The use of ultraviolet-induced visible fluorescence for examination of photographs. In Advanced Residency Program in Photograph Conservation, George Eastman House International Museum of Photography and Film & Image Permanence Institute; Rochester Institute of Technology: Rochester, NY, USA, 2005. [Google Scholar]
  14. Comelli, D.; Valentini, G.; Nevin, A.; Farina, A.; Toniolo, L.; Cubeddu, R. A portable UV-fluorescence multispectral imaging system for the analysis of painted surfaces. Rev. Sci. Instrum. 2008, 79, 086112. [Google Scholar] [CrossRef] [PubMed]
  15. Verri, G.; Comelli, D.; Cather, S.; Saunders, D.; Piqué, F. Post-capture data analysis as an aid to the interpretation of ultraviolet-induced fluorescence images. In Proceedings of the Computer Image Analysis in the Study of Art, San Jose, CA, USA, 28–29 January 2008; pp. 11–22. [Google Scholar]
  16. Bläuer, C.; Keller, A.T. Mainly red and a hidden blue–Laboratory and MSI investigations on the Carolingian wall paintings in the Chapel of the Holy Cross of Müstair (Switzerland). J. Cult. Herit. 2020, 42, 72–80. [Google Scholar] [CrossRef]
  17. Bolong, C.; Zongren, Y.; Manli, S.; Zhongwei, S.; Jinli, Z.; Biwen, S.; Zhuo, W.; Yaopeng, Y.; Bomin, S. Virtual reconstruction of the painting process and original colors of a color-changed Northern Wei Dynasty mural in Cave 254 of the Mogao Grottoes. Herit. Sci. 2022, 10, 164. [Google Scholar] [CrossRef]
  18. Cheilakou, E.; Troullinos, M.; Koui, M. Identification of pigments on Byzantine wall paintings from Crete (14th century AD) using non-invasive Fiber Optics Diffuse Reflectance Spectroscopy (FORS). J. Archaeol. Sci. 2014, 41, 541–555. [Google Scholar] [CrossRef]
  19. Schreiner, M.; Frühmann, B.; Jembrih-Simbürger, D.; Linke, R. X-rays in art and archaeology: An overview. Powder Diffr. 2004, 19, 3–11. [Google Scholar] [CrossRef]
  20. Alberghina, M.F.; Zicarelli, M.A.; Randazzo, L.; Schiavone, S.; La Russa, M.F.; Labriola, M.; Rigaglia, D.; Ricca, M. Byzantine wall paintings from San Marco d’Alunzio, Sicily: Non-invasive diagnostics and microanalytical investigation of pigments and plasters. Herit. Sci. 2024, 12, 184. [Google Scholar] [CrossRef]
  21. Ricca, M.; Alberghina, M.F.; Houreh, N.D.; Koca, A.S.; Schiavone, S.; La Russa, M.F.; Randazzo, L.; Ruffolo, S.A. Preliminary study of the mural paintings of Sotterra Church in Paola (Cosenza, Italy). Materials 2022, 15, 3411. [Google Scholar] [CrossRef]
  22. Bonizzoni, L.; Caglio, S.; Galli, A.; Germinario, C.; Izzo, F.; Magrini, D. Identifying Original and Restoration Materials through Spectroscopic Analyses on Saturnino Gatti Mural Paintings: How Far a Noninvasive Approach Can Go. Appl. Sci. 2023, 13, 6638. [Google Scholar] [CrossRef]
  23. Cosentino, A.; Stout, S.; Di Mauro, R.; Perondi, C. The Crucifix Chapel of Aci Sant’Antonio: Newly discovered frescoes. Archeomatica 2014, 5, 36–42. [Google Scholar]
  24. Delaney, J.K.; Thoury, M.; Zeibel, J.G.; Ricciardi, P.; Morales, K.M.; Dooley, K.A. Visible and infrared imaging spectroscopy of paintings and improved reflectography. Herit. Sci. 2016, 4, 1–10. [Google Scholar] [CrossRef]
  25. Brocchieri, J.; Scialla, E.; D’Onofrio, A.; Sabbarese, C. Combining XRF, Multispectral Imaging and SEM/EDS to Characterize a Contemporary Painting. Quantum Beam Sci. 2023, 7, 13. [Google Scholar] [CrossRef]
  26. Lluveras-Tenorio, A.; Bonaduce, I.; Sabatini, F.; Degano, I.; Blaensdorf, C.; Pouyet, E.; Cotte, M.; Ma, L.; Colombini, M.P. The organic materials in the Five Northern Provinces’ Assembly Hall: Disclosing the painting technique of the Qing dynasty painters in civil buildings. Appl. Phys. A 2015, 121, 879–889. [Google Scholar] [CrossRef]
  27. Teri, G.; Han, K.; Huang, D.; Li, Y.; Tian, Y.; Chao, X.; Jia, Z.; Fu, P.; Li, Y. A study on the materials used in the ancient architectural paintings from the qing dynasty tibetan buddhist monastery of Puren, China. Materials 2023, 16, 6404. [Google Scholar] [CrossRef]
  28. Gil, M.; Valadas, S.; Cardoso, I.; Dias, L. Preliminary Diagnostic Survey of Deteriorated Paint Layers at the Maritime Station of Rocha Do Conde De Óbidos; A Multianalytical Research: Lisbon, Portugal, 2023. [Google Scholar]
  29. Gil, M.; Costa, M.; Dias, L.; Frade, J.C.; Vandenabeele, P. An Insight into the Green Deteriorated Paint Layers of the Maritime Station of Alcântara (Lisbon): An Archeometric Study. 2023. Available online: https://ijcs.ro/public/IJCS-23-78_Acevedo-Mejia.pdf (accessed on 28 May 2025).
  30. Alonso-Villar, E.M.; Rivas, T.; Pozo-Antonio, J.S.; Pellis, G.; Scalarone, D. Efficacy of colour protectors in urban art paintings under different conditions: From a real mural to the laboratory. Heritage 2023, 6, 3475–3498. [Google Scholar] [CrossRef]
  31. Boardman, J.W.; Kruse, F.A.; Green, R.O. Mapping target signatures via partial unmixing of AVIRIS data. In Proceedings of the Summaries of the Fifth Annual JPL Airborne Earth Science Workshop, Pasadena, CA, USA, 23–26 January 1995. Volume 1: AVIRIS Workshop. [Google Scholar]
  32. Veneranda, M.; Prieto-Taboada, N.; de Vallejuelo, S.F.-O.; Maguregui, M.; Morillas, H.; Marcaida, I.; Castro, K.; Garcia-Diego, F.-J.; Osanna, M.; Madariaga, J. In-situ multianalytical approach to analyze and compare the degradation pathways jeopardizing two murals exposed to different environments (Ariadne House, Pompeii, Italy). Spectrochim. Acta Part A Mol. Biomol. Spectrosc. 2018, 203, 201–209. [Google Scholar] [CrossRef] [PubMed]
  33. Wang, J.; Cao, M.; Fu, P.; Dong, W. The color influence of dust in air pollutants on architectural painting: A case of archery tower at the West Gate in Shaanxi, China. Herit. Sci. 2024, 12, 293. [Google Scholar] [CrossRef]
  34. Fang, S.; Hu, W.; Li, Q.; Zhang, B.; Chen, X.; Xie, L. The relationship between the microclimate and efflorescence of revealed mural paintings and th–e later protection strategy. Sci. Total Environ. 2024, 922, 171337. [Google Scholar] [CrossRef]
  35. Wang, S.Q. San Yun Chou Zu Kao: Feng Gong Kao*[三云筹俎考·封贡考]; Ming Dynasty Woodblock Edition; 1610. [Google Scholar]
  36. Yao, Y.-X.; Huang, Y.-Z.; Ma, Y.; Qi, Y.-M.; Wei, S.-Y. The Identification and Analysis of the Materials and Workmanship for the Water-and-Land-Murals of Daxiong Dian (Hall) of Princess Temple, Fanshi. Spectrosc. Spectr. Anal. 2023, 43, 1155–1161. [Google Scholar]
  37. Cinko, O.U.; Becerir, B. Dependence of colour difference formulae on regular changes of colour coordinates in CIELAB colour space. Ind. Textila 2019, 70, 248–254. [Google Scholar] [CrossRef]
  38. Nakayama, M.; Ikeda, K. Comparison of Perceived Colour Differences with Colorimetric Colour Differences in Uniform Colour Spaces and Colour Appearance Model. J. Light Vis. Environ. 2004, 28, 81–92. [Google Scholar] [CrossRef]
  39. Dong, L.; Kang, M. Quantitative Comparison of Geographical Color of Traditional Village Architectural Heritage Based on K-Means Color Clustering—A Case Study of Southeastern Hubei Province, China. Buildings 2025, 15, 748. [Google Scholar] [CrossRef]
  40. Liu, M.; Wang, Z.; Liu, X. Spectroscopic Techniques for Identifying Pigments in Polychrome Cultural Relics. Coatings 2025, 15, 20. [Google Scholar] [CrossRef]
  41. Shi, X.; Lin, X.; Lei, Y.; Wu, J.; Lv, X.; Zhou, Y. A Study on Pigment Composition of Buddhist Cave Paintings Based on Hyperspectral Technology. Materials 2024, 17, 5147. [Google Scholar] [CrossRef] [PubMed]
  42. Delaney, J.K.; Ricciardi, P.; Glinsman, L.D.; Facini, M.; Thoury, M.; Palmer, M.; Rie, E.R.d. Use of imaging spectroscopy, fiber optic reflectance spectroscopy, and X-ray fluorescence to map and identify pigments in illuminated manuscripts. Stud. Conserv. 2014, 59, 91–101. [Google Scholar] [CrossRef]
  43. Donate, I.; García, A.R.; Vega, C.; Mayans, B.; Martín, M.; Bueso, M. An application of near-infrared reflectance imaging spectroscopy on historical studies: Differentiation of painting ground layers from the 15th and 16th centuries. In Proceedings of the Optics for Arts, Architecture, and Archaeology VIII, Online, 21–25 June 2021; pp. 185–197. [Google Scholar]
  44. Zhang, Y.; Wang, J.; Liu, H.; Wang, X.; Zhang, S. Integrated analysis of pigments on murals and sculptures in Mogao Grottoes. Anal. Lett. 2015, 48, 2400–2413. [Google Scholar] [CrossRef]
  45. Yao, Z.; Hong, G.; Jian-du, Y.; Bo, L.; Jin-feng, T.; Rong-bo, Y. The Application of Nondestructive In-Situ Analysis on the Murals of the Xianrenya Grottoes in Tianshui. Spectrosc. Spectr. Anal. 2022, 42, 3526–3532. [Google Scholar]
  46. Trojek, T.; Musílek, L.; Prokeš, R. Depth of layers in historical materials measurable by X-ray fluorescence analysis. Radiat. Phys. Chem. 2019, 155, 239–243. [Google Scholar] [CrossRef]
  47. Park, J. Analysis of animal glue by pyrolysis/GC/MS. Anal. Sci. Technol. 2015, 28, 221–227. [Google Scholar] [CrossRef]
  48. Tousi, E.T.; Hashim, R.; Bauk, S.; Jaafar, M.S.; Al-Jarrah, A.M.; Kardani, H.; Abu Arra, A.M.H.; Aldroobi, K.S.A. A study of the properties of animal-based wood glue. Adv. Mater. Res. 2014, 935, 133–137. [Google Scholar] [CrossRef]
  49. Cappitelli, F.; Learner, T.; Chiantore, O. An initial assessment of thermally assisted hydrolysis and methylation-gas chromatography/mass spectrometry for the identification of oils from dried paint films. J. Anal. Appl. Pyrolysis 2002, 63, 339–348. [Google Scholar] [CrossRef]
  50. Chen, X.-h.; Chen, K.-h.; Liang, X. Materials Science and Engineering of Powder Metallurgy. Mater. Sci. Eng. Powder Metall. 2011, 16, 225–230. [Google Scholar]
  51. Chiriu, D.; Pala, M.; Pisu, F.; Cappellini, G.; Ricci, P.; Carbonaro, C. Time through colors: A kinetic model of red vermilion darkening from Raman spectra. Dye. Pigment. 2021, 184, 108866. [Google Scholar] [CrossRef]
  52. Neiman, M.K.; Balonis, M.; Kakoulli, I. Cinnabar alteration in archaeological wall paintings: An experimental and theoretical approach. Appl. Phys. A 2015, 121, 915–938. [Google Scholar] [CrossRef]
  53. Radepont, M.; Coquinot, Y.; Janssens, K.; Ezrati, J.-J.; de Nolf, W.; Cotte, M. Thermodynamic and experimental study of the degradation of the red pigment mercury sulfide. J. Anal. Spectrom. 2015, 30, 599–612. [Google Scholar] [CrossRef]
  54. Pagnin, L.; Calvini, R.; Wiesinger, R.; Weber, J.; Schreiner, M. Photodegradation kinetics of alkyd paints: The influence of varying amounts of inorganic pigments on the stability of the synthetic binder. Front. Mater. 2020, 7, 600887. [Google Scholar] [CrossRef]
  55. Merello, P.; García-Diego, F.-J.; Zarzo, M. Microclimate monitoring of Ariadne’s house (Pompeii, Italy) for preventive conservation of fresco paintings. Chem. Cent. J. 2012, 6, 145. [Google Scholar] [CrossRef]
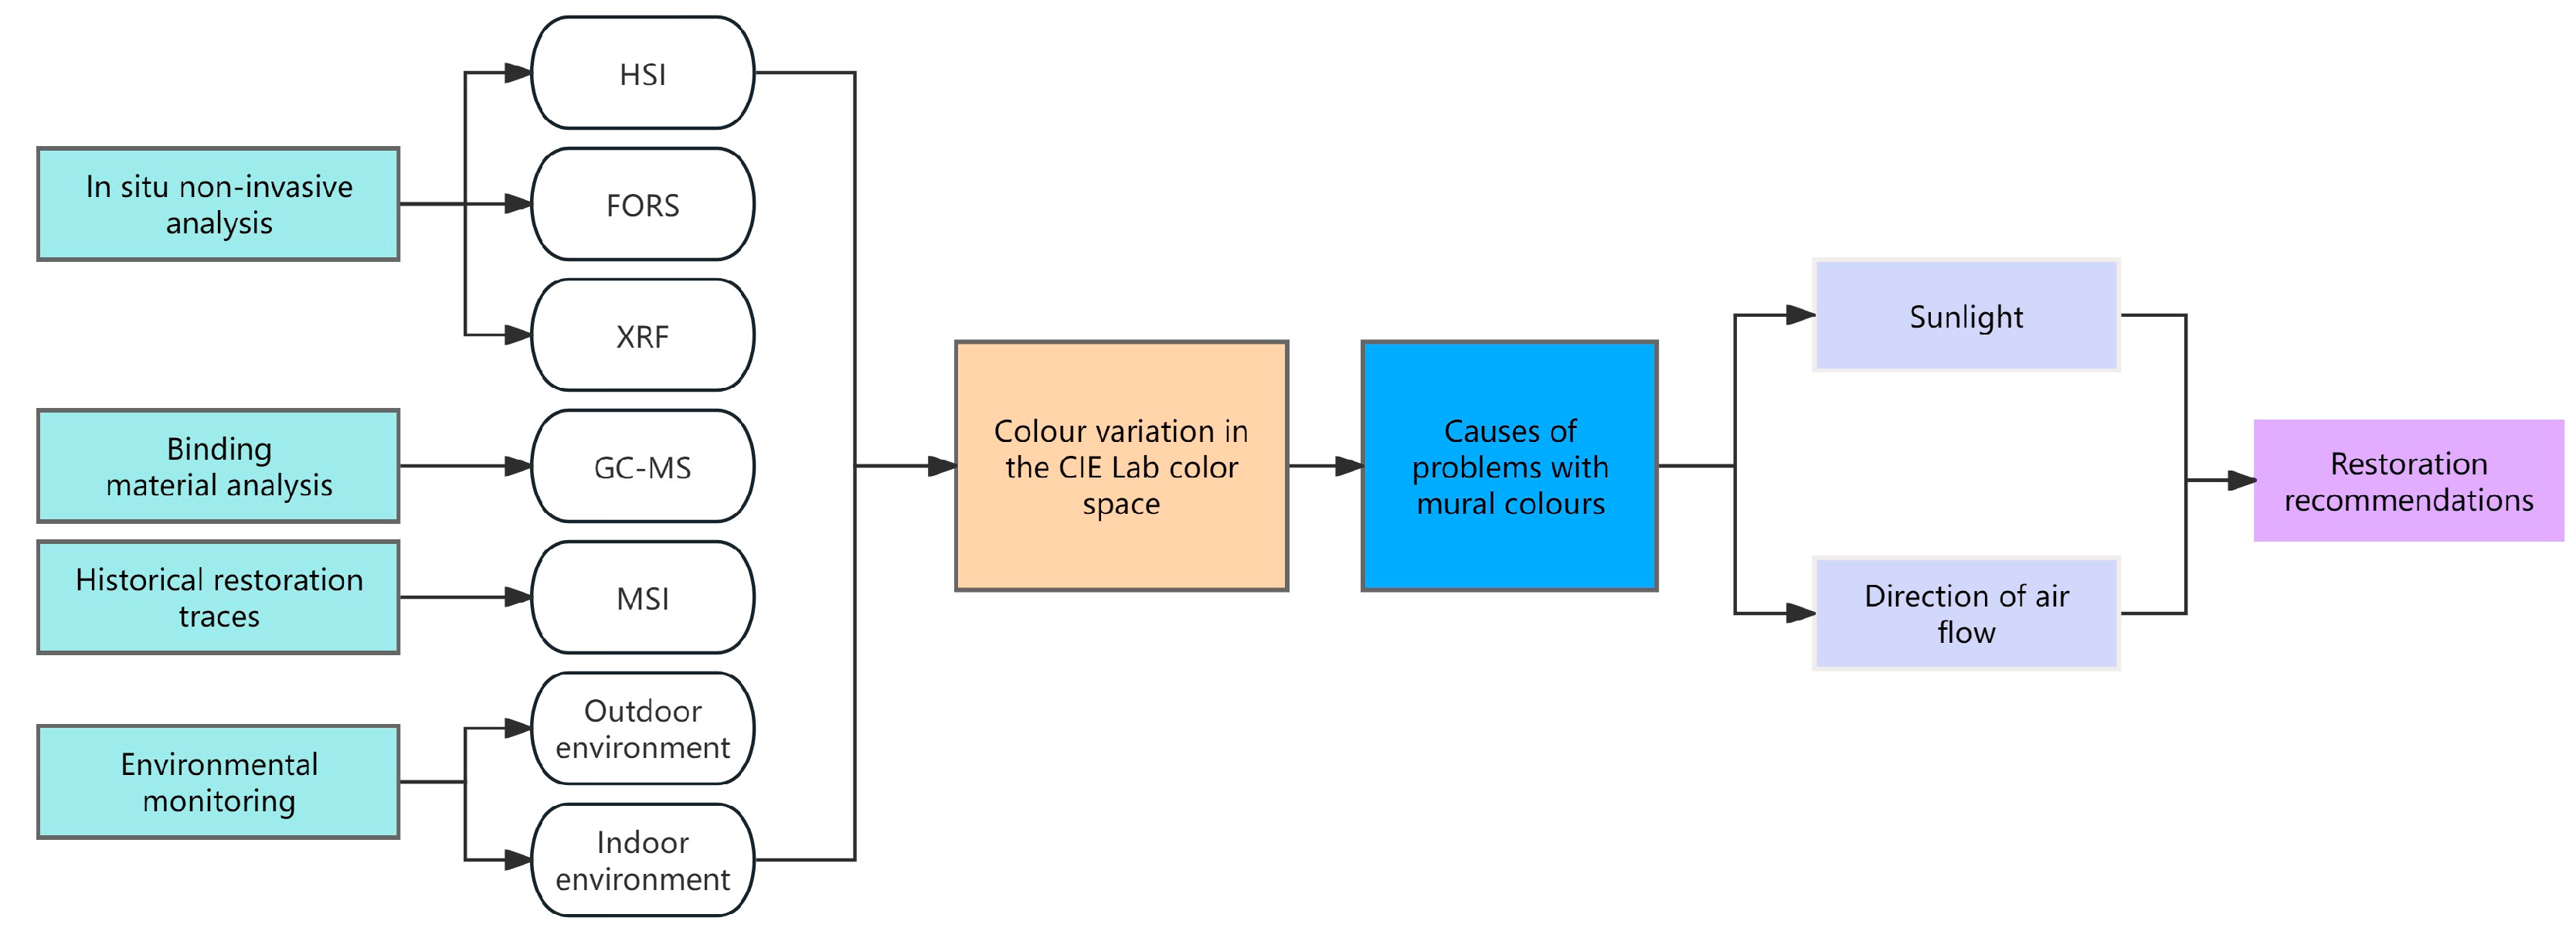
Figure 1. Research flow chart.
Chemosensors 13 00202 g001
Figure 2. General overview map: (a) position of Meidai Lamasery; (b) Liuli Hall of Meidai Lamasery; (c) mural painting on the north wall; and (d) mural painting on the eastern wall.
Chemosensors 13 00202 g002
Figure 3. Murals of Meidai Lamasery: (a) dust accumulation area; (b) dust accumulation area; (c) fading area; (d) unfaded area; (e) unfaded area; and (f) historical restoration area.
Chemosensors 13 00202 g003
Figure 4. (a) Visible light map of Master Atisha; (b) hyperspectral Cube; (c) cluster map used to define the primary endmember; (d) reflectance spectrograms of the endmember; (e) relevant spatial distribution of the endmember in the drawing.
Chemosensors 13 00202 g004
Figure 5. (a) Spatial distribution corresponding to red endmember; (b) hyperspectral reflectance curve of red pigment; (c) the first derivatives of the red pigment FORS.
Chemosensors 13 00202 g005
Figure 6. (a) Spatial distribution corresponding to green endmember. (b) Hyperspectral reflectance curve of green pigment. (c) FORSCurve of green pigment.
Chemosensors 13 00202 g006
Figure 7. (a) Spatial distribution corresponding to blue endmember. (b) Hyperspectral reflectance curve of blue pigment. (c) FORSCurve of blue pigment.
Chemosensors 13 00202 g007
Figure 8. (a) Spatial distribution corresponding to white endmember. (b) Hyperspectral reflectance curve of white pigment. (c) FORSCurve of white pigment.
Chemosensors 13 00202 g008
Figure 9. Principal component analysis of mural sample.
Chemosensors 13 00202 g009
Figure 10. Result of GC-MS analyses of mural samples.
Chemosensors 13 00202 g010
Figure 11. (a) Surface flatness of the green sample; (b) surface flatness of the white sample.
Chemosensors 13 00202 g011
Figure 12. (a) VIS image of Venerable Dharmodara; (b) UVF image of Venerable Dharmodara.
Chemosensors 13 00202 g012
Figure 13. (a) UVR image of Venerable Dharmodara; (b) IR image of Venerable Dharmodara.
Chemosensors 13 00202 g013
Figure 14. (a) UV-FC image of Venerable Dharmodara; (b) IR-FC image of Venerable Dharmodara.
Chemosensors 13 00202 g014
Figure 15. The overall colour space distribution.
Chemosensors 13 00202 g015
Figure 16. LCh distribution of mural samples.
Chemosensors 13 00202 g016
Figure 17. Colour distribution by wall and colour type.
Chemosensors 13 00202 g017
Figure 18. LCh distribution of mural samples after one year.
Chemosensors 13 00202 g018
Figure 19. Colour distribution by wall and colour type after one year.
Chemosensors 13 00202 g019
Figure 20. (a) Wind rose diagram of the region where Meidai Lamasery is located. (b) Schematic diagram of indoor airflow circulation. (c) Dust deposition density map on each wall of Liuli Hall.
Chemosensors 13 00202 g020
Figure 21. (a) Daily solar elevation analysis for Meidaizhao (2024). (b) Daily sunlight exposure diagram of Liuli Hall. (c) A 3D view of east and west walls with window on south wall and solar entry angle.
Chemosensors 13 00202 g021
Figure 22. Before and after mural dusting.
Chemosensors 13 00202 g022
Figure 23. Heatmap of colour changes before and after mural dusting.
Chemosensors 13 00202 g023
Figure 24. Comparison of colour heatmaps before and after one year.
Chemosensors 13 00202 g024
Table 1. Multi-spectral camera configuration.
Camera and LensPhotography TypesLightingFiltersCalibration
Attachment
Canon 200D modified to remove the infrared cut-off filter on the front of the sensor. Equipped with fixed-focus 60 mm F2.8 lensUVRLiezong professional red ultraviolet light source. The luminous wavelength is 400~1100 nmZWB2+TSN575
UVFUV LED light, wavelength 365 nmWratten 2E
VIS ICF2139X-Rite
ColorChecker
18 Grayscale card
IRLiezong professional red ultraviolet light source. The luminous wavelength is 400~1100 nmGreen.L infrared filter (R950)
Table 2. Colour distribution range table.
RedGreenYellowDusty
Yellow
BlueWhite
Distribution range of luminance L values34.94~44.1837.53~55.1944.63~54.4243.87~59.0738.74~45.753.34~62.73
Distribution range of red and green a-values14.02~28.19−4.06~−12.186.16~10.772.7~6.36−2.99~3.492.12~7.41
Distribution range of yellow and blue b-values8.3~19.7112.55~20.0916.74~32.812.9~18.9−13.6~−2.4410.47~16.74
Chroma distribution range16.29~34.1313.82~20.0919.91~33.3713.18~19.593.86~14.0410.68~18.31
Hue
distribution range
30.63~50.9772.89~128.957.24~79.3666.42~78.18219.2~284.366.12~78.55
Table 3. Seasonal changes in main climatic parameters.
MonthAvg
Temperature (°C)
Avg Relative Humidity (%)Avg Wind Speed (m/s)Avg Wind Direction (°)Avg Solar Radiation (W/m2)
1−10.5151.812.41152.61115.81
2−7.6854.322.58194.29152.24
32.3146.812.89205.65226.24
412.0145.93.02164.07260.94
516.3538.353.67211293.23
622.1753.133.06176.47284.75
722.7564.422.89173.94277.34
820.74632.69282.16278.8
917.1166.272.63261.17219.83
108.5457.522.73267.94171.73
11−0.0664.92.77266.57117.86
12−11.2576.322.21267.52103.84
Disclaimer/Publisher’s Note: The statements, opinions and data contained in all publications are solely those of the individual author(s) and contributor(s) and not of MDPI and/or the editor(s). MDPI and/or the editor(s) disclaim responsibility for any injury to people or property resulting from any ideas, methods, instructions or products referred to in the content.