Surface-Enhanced Raman Scattering of Bioaerosol: Where Are We Now? A Systematic Review


Abstract
1. Introduction
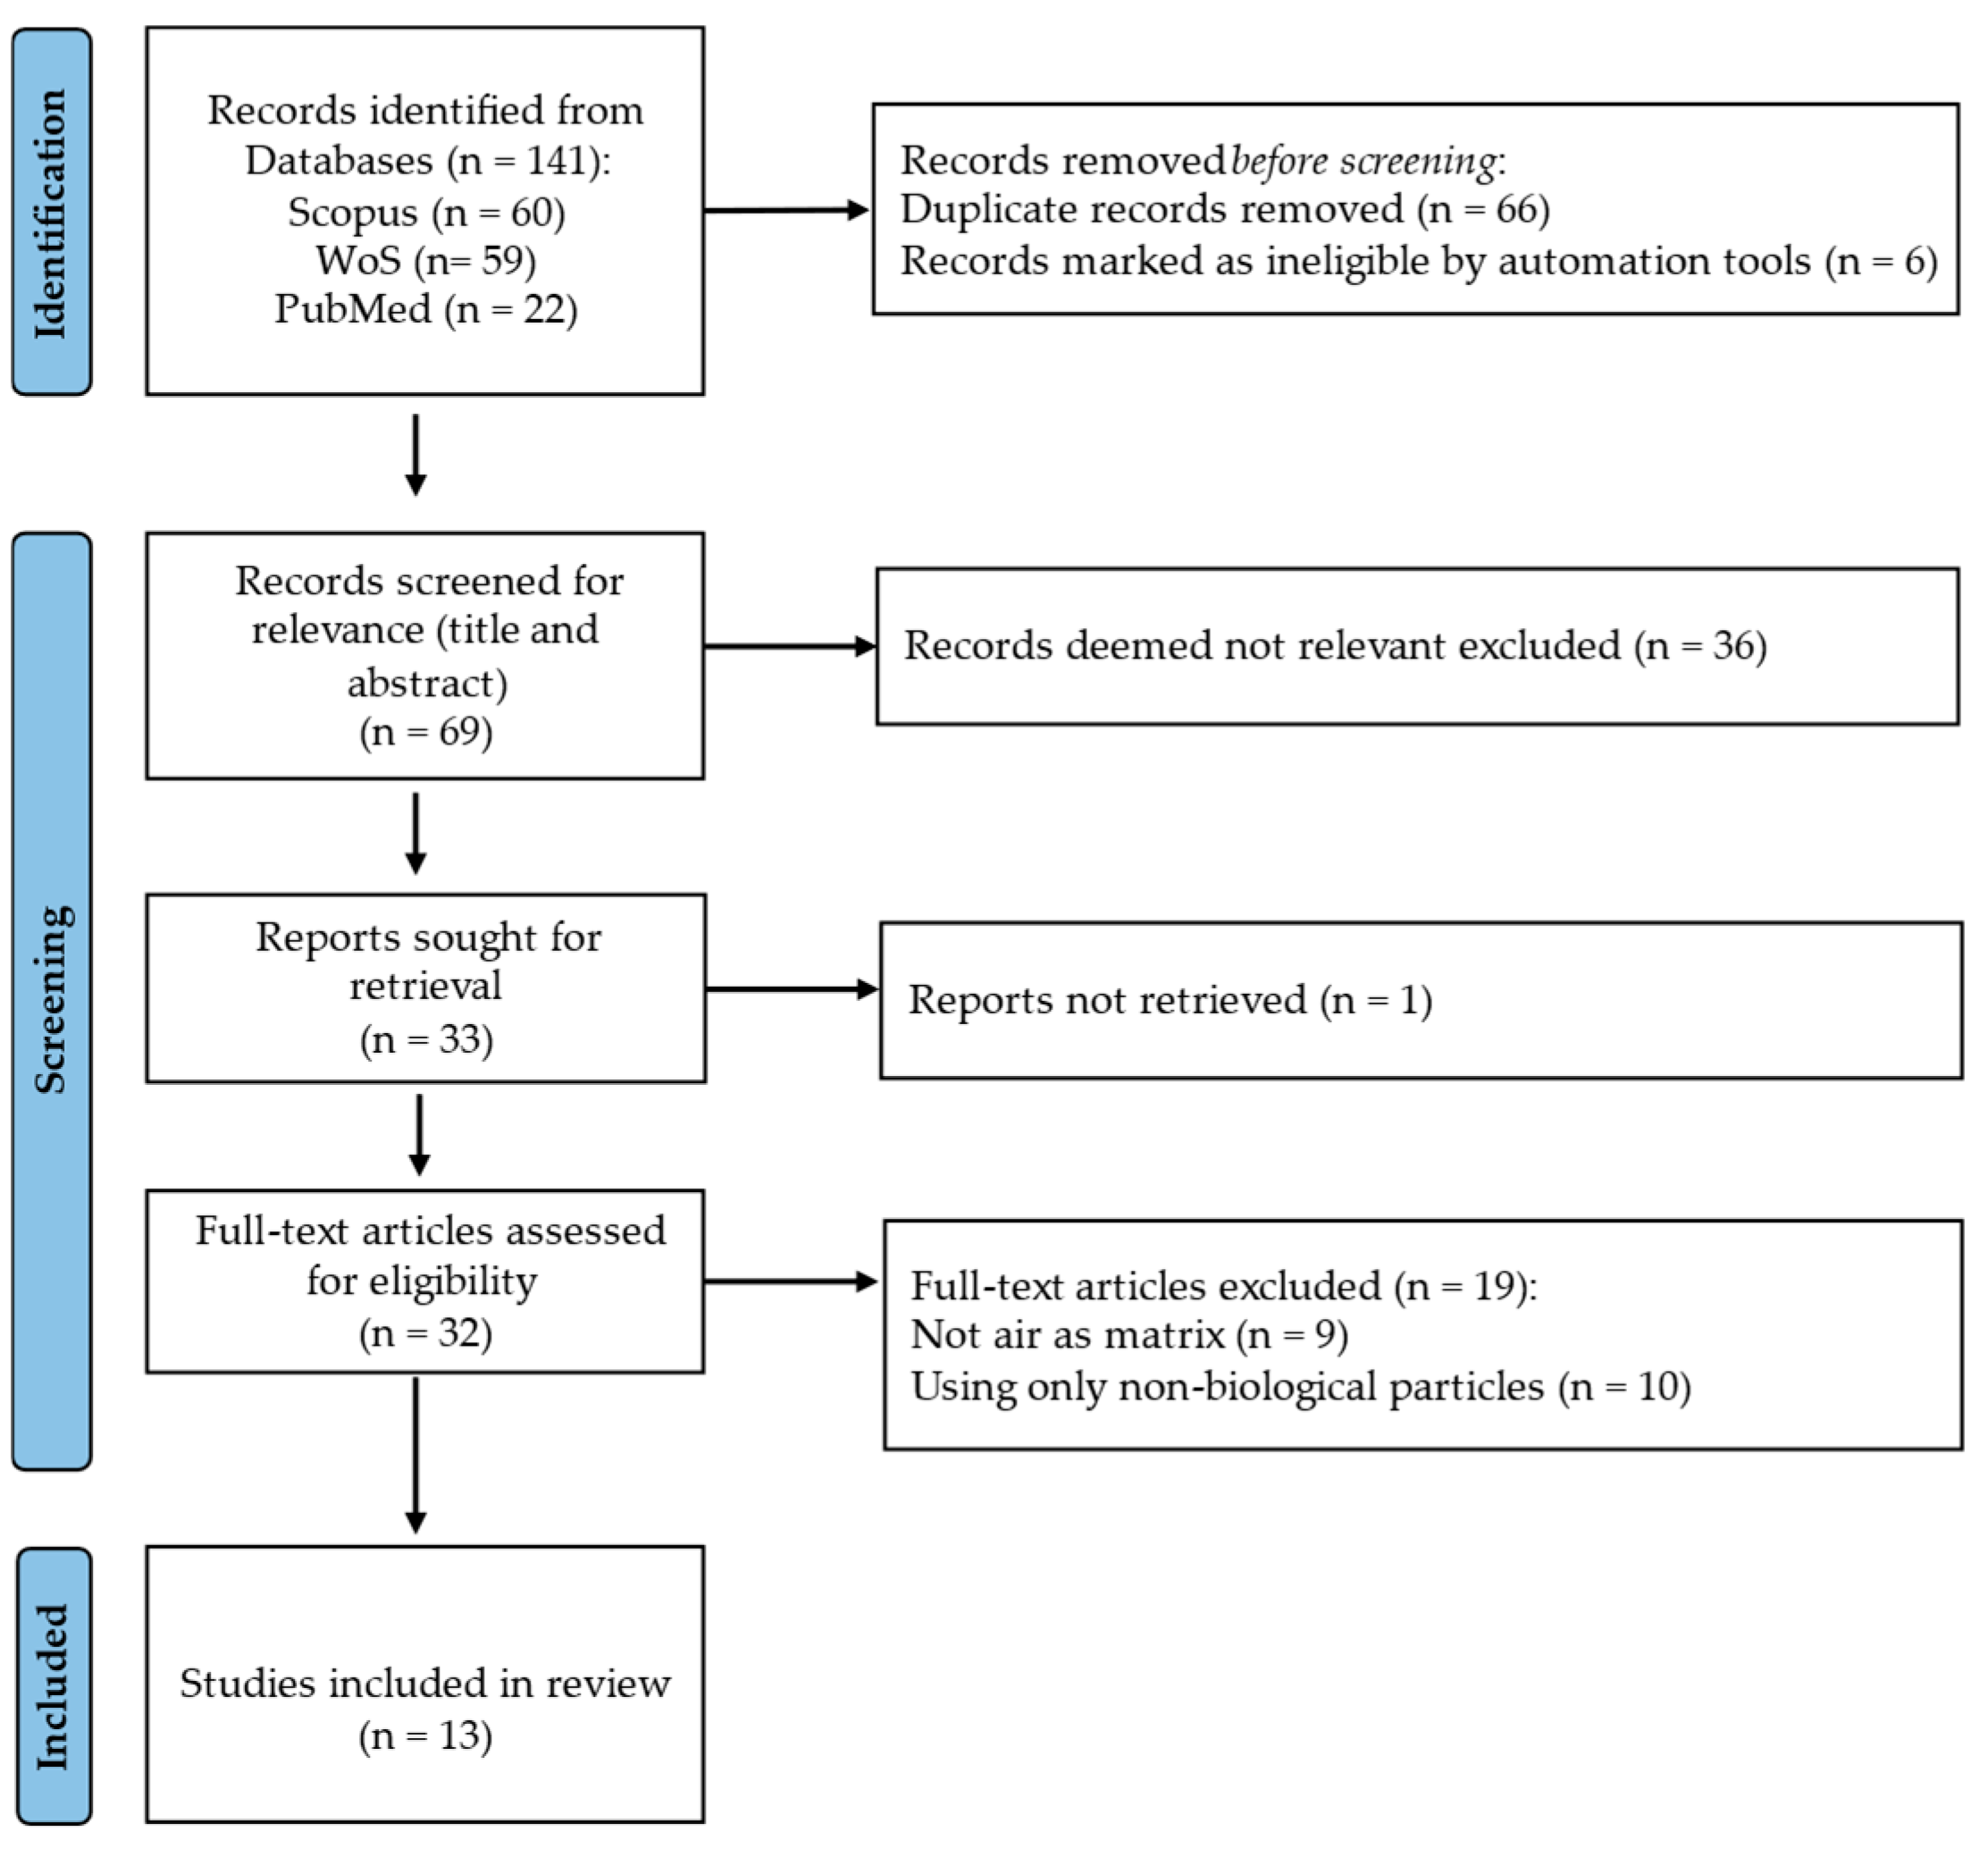
2. Methodology
- Has any research been conducted in a controlled and standardised system? The aim was to offer an overview of the available knowledge about how bioaerosol generation and sampling technologies may affect SERS analysis.
- Are there any studies performed on real samples? In which environment? The aim was to survey investigations on real-life applications.
- What nature of PBAPs can be detected by SERS? How? The aim was to determine what types of bioaerosol were tested.
- Which biological/environmental processes have been investigated? The aim was to survey the possible practical applications.
2.1. Search Strategy
2.2. Inclusion and Exclusion Criteria
2.3. Bibliometric Analysis
2.4. Data Extraction
3. Results and Discussion
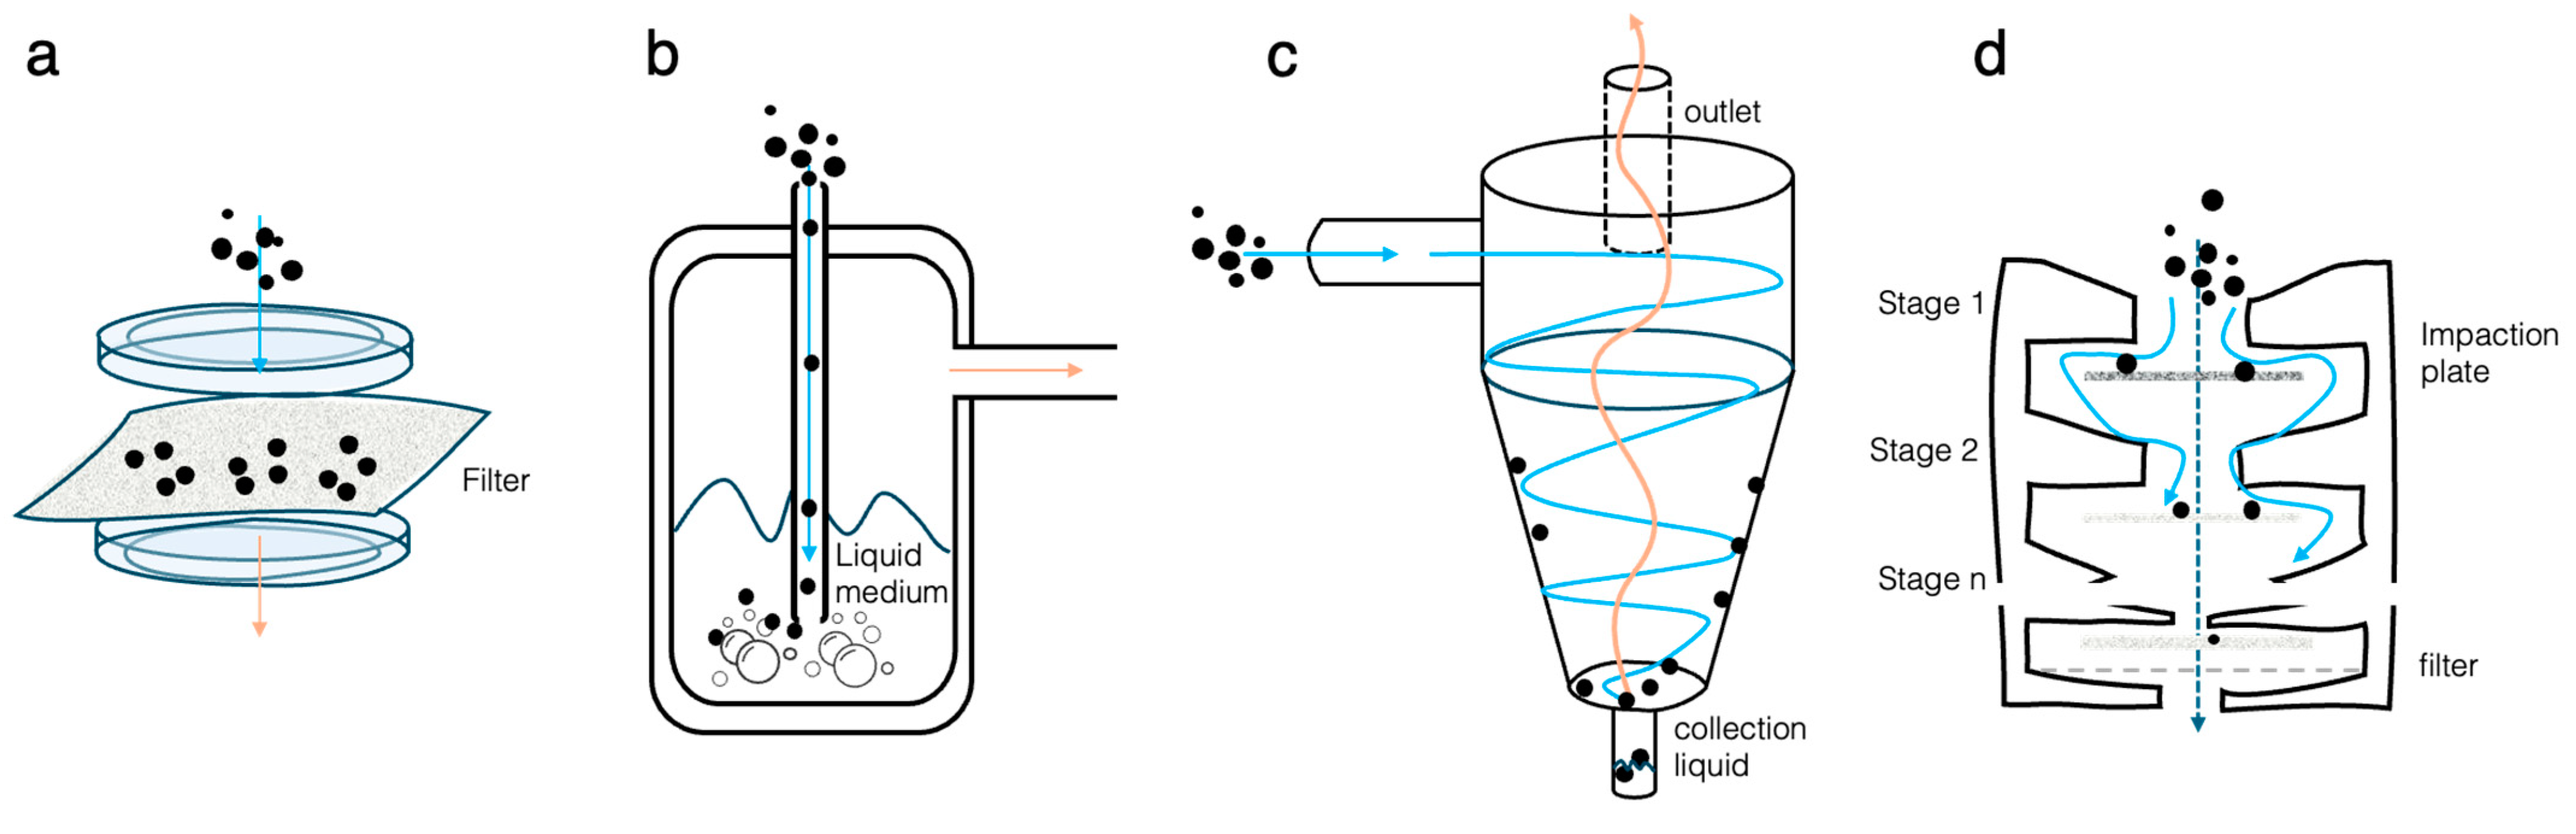
3.1. Bioaerosol Generation
3.2. Bioaerosol Sampling
3.3. SERS Substrates
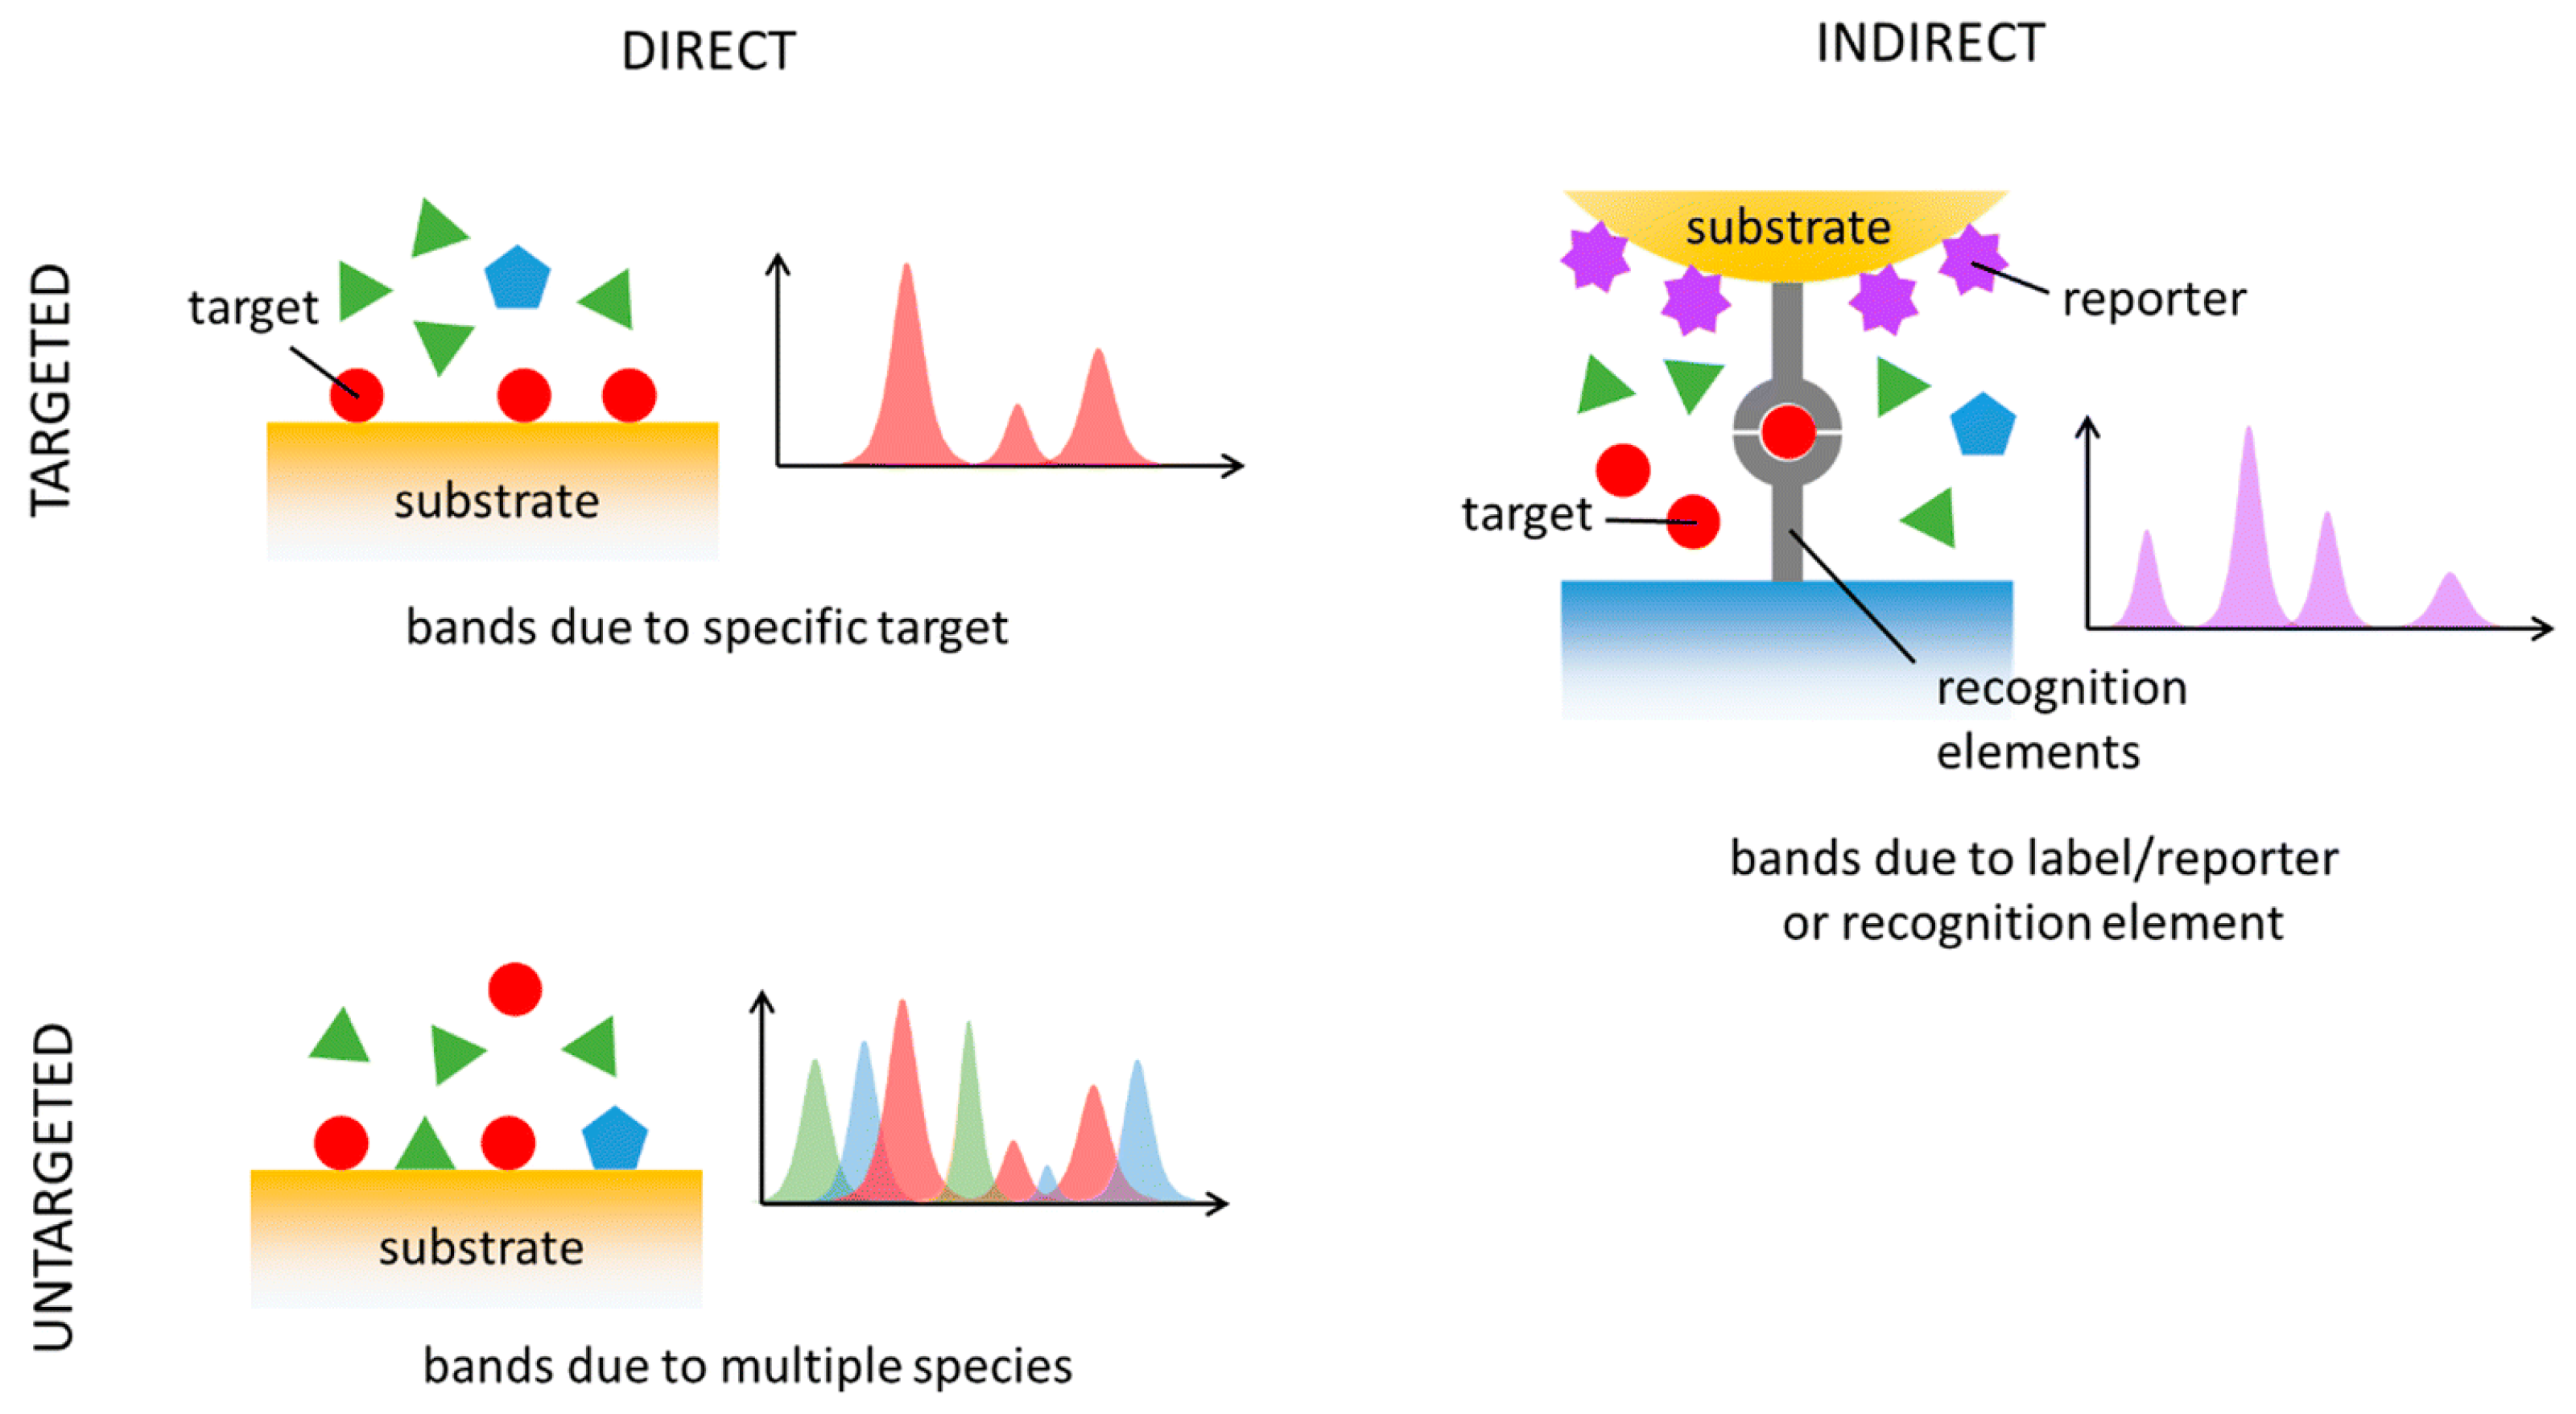
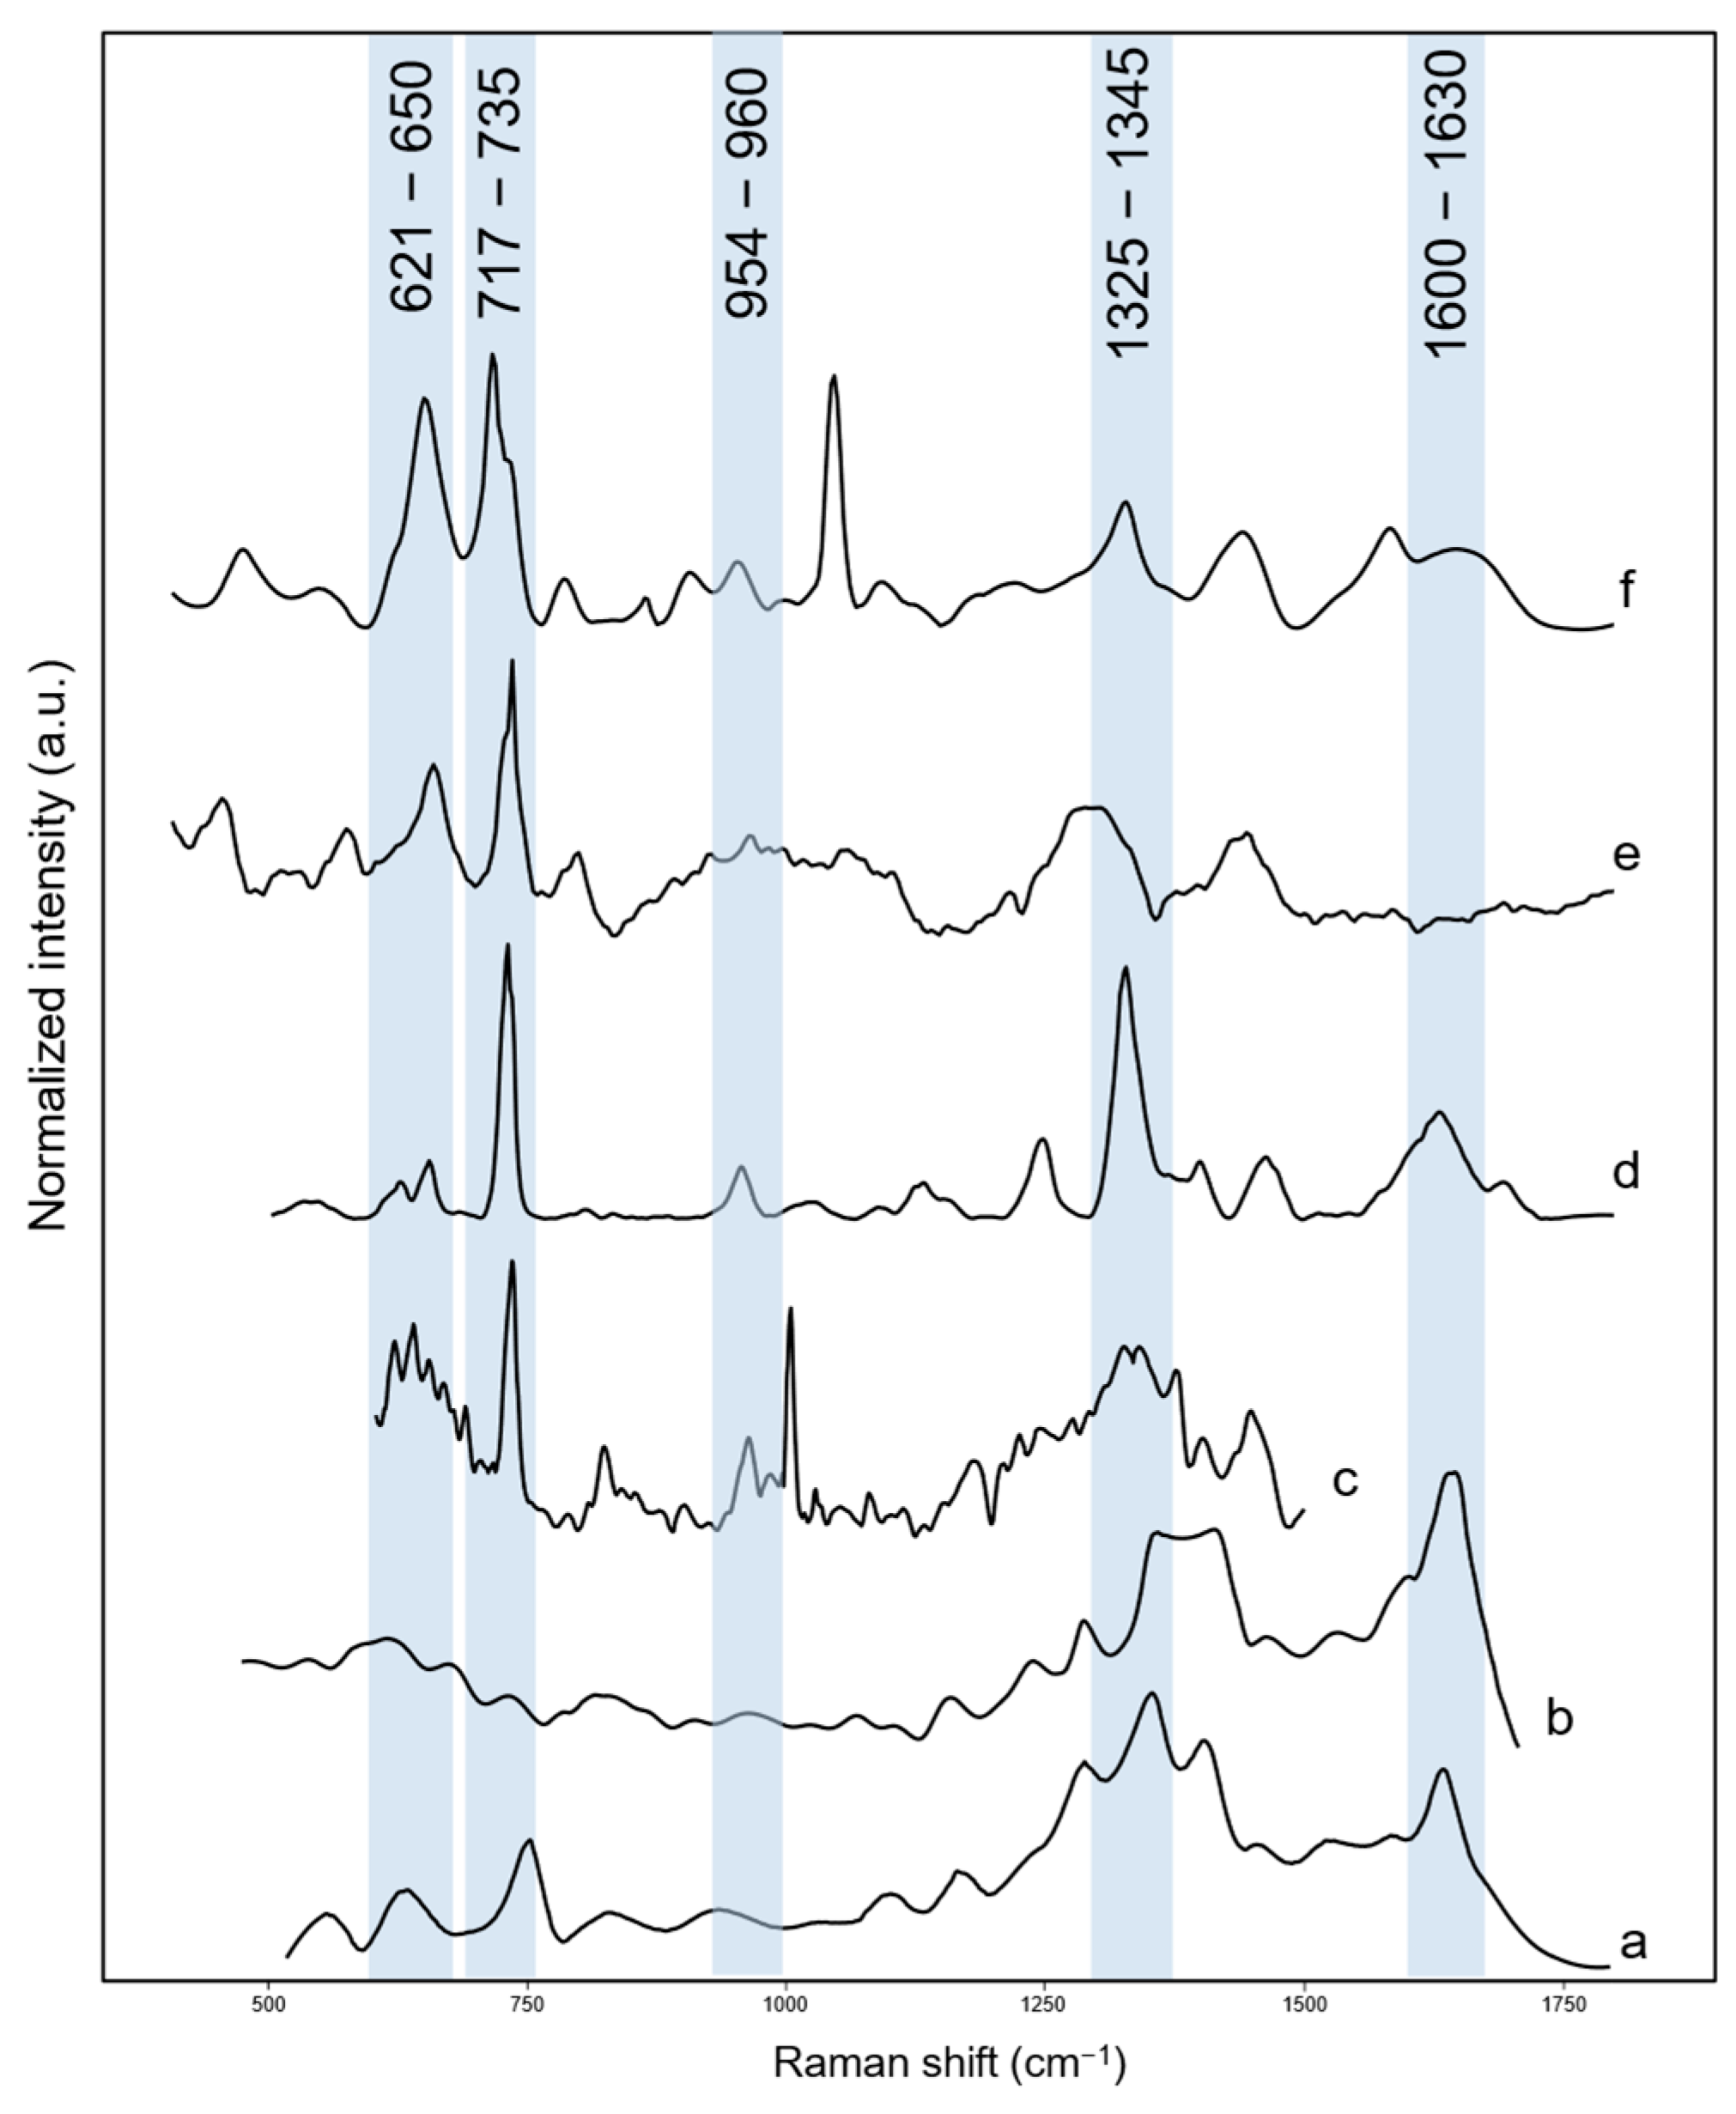
3.4. SERS Analysis
4. Conclusions and Practical Implications
4.1. Conclusive Remarks
- Are there any studies performed in a controlled and standardised system? SERS spectroscopy can be used to detect PBAPs and their chemical composition in the laboratory. However, the road to full deployment is still long, and more research is still required in this area.
- Are there any studies performed on real samples? In which environments? Some proof-of-concept studies for the detection of airborne pollen and bacteria using SERS were performed in the environment where these bioaerosols were present. The identification of pollen extracts was carried out using real pollen samples from different plant species. The detection of SARS-CoV-2 was also conducted on real breath aerosol samples.
- What nature of airborne bioanalytes/microorganism can be detected by SERS? How? SERS spectroscopy was used to detect various airborne bioanalytes, including bacteria, pollen, and viruses. This detection was achieved by adsorbing the microorganisms onto a substrate, typically silver or gold nanoparticles, which enhance the Raman signals and allow for the identification and characterisation of the bioanalytes based on their distinct spectral fingerprints.
- Which biological/environmental processes have been investigated? The research papers discussed the investigation of various biological and environmental processes related to bioaerosols, including the following: (i) the characterisation of airborne pollen and bacteria; (ii) the detection of bacterial contamination in indoor air; (iii) the characterisation and detection of aerosolised bacteria; (iv) the disinfection of airborne contaminants on mask filters; and (v) the detection of SARS-CoV-2 variants.
4.2. Road Map for Standardisation
Supplementary Materials
Author Contributions
Funding
Data Availability Statement
Conflicts of Interest
References
- Després, V.R.; Huffman, J.A.; Burrows, S.M.; Hoose, C.; Safatov, A.S.; Buryak, G.; Fröhlich-Nowoisky, J.; Elbert, W.; Andreae, M.O.; Pöschl, U.; et al. Primary Biological Aerosol Particles in the Atmosphere: A Review. Tellus B Chem. Phys. Meteorol. 2012, 64, 15598. [Google Scholar] [CrossRef]
- Cox, J.; Mbareche, H.; Lindsley, W.G.; Duchaine, C. Field Sampling of Indoor Bioaerosols. Aerosol Sci. Technol. 2020, 54, 572–584. [Google Scholar] [CrossRef]
- Delort, A.-M.; Amato, P. (Eds.) . Microbiology of Aerosols; John Wiley & Sons: Hoboken, NJ, USA, 2017; ISBN 978-1-119-13229-5. [Google Scholar]
- Tian, J.; Yan, C.; Alcega, S.G.; Hassard, F.; Tyrrel, S.; Coulon, F.; Nasir, Z.A. Detection and Characterization of Bioaerosol Emissions from Wastewater Treatment Plants: Challenges and Opportunities. Front. Microbiol. 2022, 13, 958514. [Google Scholar] [CrossRef] [PubMed]
- Duchaine, C. Indoor Bioaerosols: Progress and Challenges in the Study of the Invisible Entities That Changed Our World. In Proceedings of the 5th International Conference on Building Energy and Environment; Wang, L.L., Ge, H., Zhai, Z.J., Qi, D., Ouf, M., Sun, C., Wang, D., Eds.; Environmental Science and Engineering; Springer Nature: Singapore, 2023; pp. 2239–2241. ISBN 978-981-19-9821-8. [Google Scholar]
- Zhang, C.; Dai, X.; Gebrezgiabhier, T.; Wang, Y.; Yang, M.; Wang, L.; Wang, W.; Man, Z.; Meng, Y.; Tong, L.; et al. Navigating the Aerosolized Frontier: A Comprehensive Review of Bioaerosol Research Post-COVID-19. Atmosphere 2024, 15, 404. [Google Scholar] [CrossRef]
- Xie, W.; Li, Y.; Bai, W.; Hou, J.; Ma, T.; Zeng, X.; Zhang, L.; An, T. The Source and Transport of Bioaerosols in the Air: A Review. Front. Environ. Sci. Eng. 2021, 15, 44. [Google Scholar] [CrossRef] [PubMed]
- Huang, Z.; Yu, X.; Liu, Q.; Maki, T.; Alam, K.; Wang, Y.; Xue, F.; Tang, S.; Du, P.; Dong, Q.; et al. Bioaerosols in the Atmosphere: A Comprehensive Review on Detection Methods, Concentration and Influencing Factors. Sci. Total Environ. 2024, 912, 168818. [Google Scholar] [CrossRef]
- King, M.D.; Lacey, R.E.; Pak, H.; Fearing, A.; Ramos, G.; Baig, T.; Smith, B.; Koustova, A. Assays and Enumeration of Bioaerosols-Traditional Approaches to Modern Practices. Aerosol Sci. Technol. 2020, 54, 611–633. [Google Scholar] [CrossRef]
- Franchitti, E.; Pascale, E.; Fea, E.; Anedda, E.; Traversi, D. Methods for Bioaerosol Characterization: Limits and Perspectives for Human Health Risk Assessment in Organic Waste Treatment. Atmosphere 2020, 11, 452. [Google Scholar] [CrossRef]
- Huffman, J.A.; Perring, A.E.; Savage, N.J.; Clot, B.; Crouzy, B.; Tummon, F.; Shoshanim, O.; Damit, B.; Schneider, J.; Sivaprakasam, V.; et al. Real-Time Sensing of Bioaerosols: Review and Current Perspectives. Aerosol Sci. Technol. 2020, 54, 465–495. [Google Scholar] [CrossRef]
- Sivaprakasam, V.; Hart, M.B. Surface-Enhanced Raman Spectroscopy for Environmental Monitoring of Aerosols. ACS Omega 2021, 6, 10150–10159. [Google Scholar] [CrossRef]
- Fu, Y.; Kuppe, C.; Valev, V.K.; Fu, H.; Zhang, L.; Chen, J. Surface-Enhanced Raman Spectroscopy: A Facile and Rapid Method for the Chemical Component Study of Individual Atmospheric Aerosol. Environ. Sci. Technol. 2017, 51, 6260–6267. [Google Scholar] [CrossRef]
- Estefany, C.; Sun, Z.; Hong, Z.; Du, J. Raman Spectroscopy for Profiling Physical and Chemical Properties of Atmospheric Aerosol Particles: A Review. Ecotoxicol. Environ. Saf. 2023, 249, 114405. [Google Scholar] [CrossRef] [PubMed]
- Félix-Rivera, H.; Hernández-Rivera, S.P. Raman Spectroscopy Techniques for the Detection of Biological Samples in Suspensions and as Aerosol Particles: A Review. Sens. Imaging 2012, 13, 1–25. [Google Scholar] [CrossRef]
- Wang, X.; Huang, S.-C.; Hu, S.; Yan, S.; Ren, B. Fundamental Understanding and Applications of Plasmon-Enhanced Raman Spectroscopy. Nat. Rev. Phys. 2020, 2, 253–271. [Google Scholar] [CrossRef]
- Premasiri, W.R.; Moir, D.T.; Klempner, M.S.; Krieger, N.; Jones, G.; Ziegler, L.D. Characterization of the Surface Enhanced Raman Scattering (SERS) of Bacteria. J. Phys. Chem. B 2005, 109, 312–320. [Google Scholar] [CrossRef]
- Zong, C.; Xu, M.; Xu, L.-J.; Wei, T.; Ma, X.; Zheng, X.-S.; Hu, R.; Ren, B. Surface-Enhanced Raman Spectroscopy for Bioanalysis: Reliability and Challenges. Chem. Rev. 2018, 118, 4946–4980. [Google Scholar] [CrossRef] [PubMed]
- Han, X.X.; Rodriguez, R.S.; Haynes, C.L.; Ozaki, Y.; Zhao, B. Surface-Enhanced Raman Spectroscopy. Nat. Rev. Methods Primers 2022, 1, 87. [Google Scholar] [CrossRef]
- Yi, J.; You, E.-M.; Hu, R.; Wu, D.-Y.; Liu, G.-K.; Yang, Z.-L.; Zhang, H.; Gu, Y.; Wang, Y.-H.; Wang, X.; et al. Surface-Enhanced Raman Spectroscopy: A Half-Century Historical Perspective. Chem. Soc. Rev. 2025, 54, 1453–1551. [Google Scholar] [CrossRef]
- Piorek, B.D.; Andreou, C.; Moskovits, M.; Meinhart, C.D. Discrete Free-Surface Millifluidics for Rapid Capture and Analysis of Airborne Molecules Using Surface-Enhanced Raman Spectroscopy. Anal. Chem. 2014, 86, 1061–1066. [Google Scholar] [CrossRef]
- Dos Santos, D.P.; Sena, M.M.; Almeida, M.R.; Mazali, I.O.; Olivieri, A.C.; Villa, J.E.L. Unraveling Surface-Enhanced Raman Spectroscopy Results through Chemometrics and Machine Learning: Principles, Progress, and Trends. Anal. Bioanal. Chem. 2023, 415, 3945–3966. [Google Scholar] [CrossRef]
- Page, M.J.; McKenzie, J.E.; Bossuyt, P.M.; Boutron, I.; Hoffmann, T.C.; Mulrow, C.D.; Shamseer, L.; Tetzlaff, J.M.; Akl, E.A.; Brennan, S.E.; et al. The PRISMA 2020 Statement: An Updated Guideline for Reporting Systematic Reviews. BMJ 2021, 372, n71. [Google Scholar] [CrossRef] [PubMed]
- Aria, M.; Cuccurullo, C. Bibliometrix: An R-Tool for Comprehensive Science Mapping Analysis. J. Informetr. 2017, 11, 959–975. [Google Scholar] [CrossRef]
- Sengupta, A.; Laucks, M.L.; Dildine, N.; Drapala, E.; Davis, E.J. Bioaerosol Characterization by Surface-Enhanced Raman Spectroscopy (SERS). J. Aerosol Sci. 2005, 36, 651–664. [Google Scholar] [CrossRef]
- Sengupta, A.; Brar, N.; Davis, E.J. Bioaerosol Detection and Characterization by Surface-Enhanced Raman Spectroscopy. J. Colloid Interface Sci. 2007, 309, 36–43. [Google Scholar] [CrossRef]
- Schwarzmeier, K.; Knauer, M.; Ivleva, N.P.; Niessner, R.; Haisch, C. Bioaerosol Analysis Based on a Label-Free Microarray Readout Method Using Surface-Enhanced Raman Scattering. Anal. Bioanal. Chem. 2013, 405, 5387–5392. [Google Scholar] [CrossRef]
- Seifert, S.; Merk, V.; Kneipp, J. Identification of Aqueous Pollen Extracts Using Surface Enhanced Raman Scattering (SERS) and Pattern Recognition Methods. J. Biophotonics 2016, 9, 181–189. [Google Scholar] [CrossRef]
- Tahir, M.A.; Zhang, X.; Cheng, H.; Xu, D.; Feng, Y.; Sui, G.; Fu, H.; Valev, V.K.; Zhang, L.; Chen, J. Klarite as a Label-Free SERS-Based Assay: A Promising Approach for Atmospheric Bioaerosol Detection. Analyst 2020, 145, 277–285. [Google Scholar] [CrossRef]
- Choi, J.; Lee, J.; Jung, J.H. Fully Integrated Optofluidic SERS Platform for Real-Time and Continuous Characterization of Airborne Microorganisms. Biosens. Bioelectron. 2020, 169, 112611. [Google Scholar] [CrossRef]
- Diehn, S.; Zimmermann, B.; Tafintseva, V.; Seifert, S.; Bağcıoğlu, M.; Ohlson, M.; Weidner, S.; Fjellheim, S.; Kohler, A.; Kneipp, J. Combining Chemical Information From Grass Pollen in Multimodal Characterization. Front. Plant Sci. 2020, 10, 1788. [Google Scholar] [CrossRef]
- Su, X.; Ren, R.; Wu, Y.; Li, S.; Ge, C.; Liu, L.; Xu, Y. Study of Biochip Integrated with Microelectrodes Modified by Poly-Dopamine-Co-Chitosan Composite Gel for Separation, Enrichment and Detection of Microbes in the Aerosol. Biosens. Bioelectron. 2021, 176, 112931. [Google Scholar] [CrossRef]
- Bandarenka, H.; Burko, A.; Girel, K.; Laputsko, D.; Orel, E.; Mizgailo, A.; Sharopov, U.; Podelinska, A.; Shapel, U.; Pankratov, V.; et al. Improvement of Heat Dissipation in Ag/Ni Substrates for Testing Cu-TiO2/TiO2-Modified Filters Using SERS Spectroscopy. Crystals 2023, 13, 749. [Google Scholar] [CrossRef]
- Liu, J.; Liu, Y.; Zhang, Y.; Ruan, X.; Cheng, H.; Ge, Q.; Zhang, L. Efficient V-Shaped Substrate for Surface and Volume Enhanced Raman Spectroscopic Analysis of Bioaerosol: Prevention from Potential Health Risk. Environ. Health 2024, 2, 212–220. [Google Scholar] [CrossRef]
- Han, J.; Zhang, X.; Jones, R.R.; Sui, G.; Valev, V.K.; Zhang, L. Dual-Functional Au-Porous Anodic Alumina (PAA) Sensors for Enrichment and Label-Free Detection of Airborne Virus with Surface-Enhanced Raman Scattering. Build. Environ. 2024, 257, 111484. [Google Scholar] [CrossRef]
- Ryu, J.S.; Lee, S.H.; Kim, H.; Kang, H.; Li, P.; Lee, J.H.; Jang, H.; Kim, S.; Kwon, H.; Jung, H.S.; et al. Advancing SARS-CoV-2 Variant Detection with High Affinity Monoclonal Antibodies and Plasmonic Nanostructure. Adv. Funct. Mater. 2024, 34, 2405340. [Google Scholar] [CrossRef]
- Hwang, C.S.H.; Lee, S.; Lee, S.; Kim, H.; Kang, T.; Lee, D.; Jeong, K.-H. Highly Adsorptive Au-TiO2 Nanocomposites for the SERS Face Mask Allow the Machine-Learning-Based Quantitative Assay of SARS-CoV-2 in Artificial Breath Aerosols. ACS Appl. Mater. Interfaces 2022, 14, 54550–54557. [Google Scholar] [CrossRef]
- Alsved, M.; Bourouiba, L.; Duchaine, C.; Löndahl, J.; Marr, L.C.; Parker, S.T.; Prussin, A.J.; Thomas, R.J. Natural Sources and Experimental Generation of Bioaerosols: Challenges and Perspectives. Aerosol Sci. Technol. 2020, 54, 547–571. [Google Scholar] [CrossRef]
- Santarpia, J.L.; Ratnesar-Shumate, S.; Haddrell, A. Laboratory Study of Bioaerosols: Traditional Test Systems, Modern Approaches, and Environmental Control. Aerosol Sci. Technol. 2020, 54, 585–600. [Google Scholar] [CrossRef]
- Zhen, H.; Han, T.; Fennell, D.E.; Mainelis, G. A Systematic Comparison of Four Bioaerosol Generators: Affect on Culturability and Cell Membrane Integrity When Aerosolizing Escherichia Coli Bacteria. J. Aerosol Sci. 2014, 70, 67–79. [Google Scholar] [CrossRef]
- Ferguson, R.M.W.; Garcia-Alcega, S.; Coulon, F.; Dumbrell, A.J.; Whitby, C.; Colbeck, I. Bioaerosol Biomonitoring: Sampling Optimization for Molecular Microbial Ecology. Mol. Ecol. Resour. 2019, 19, 672–690. [Google Scholar] [CrossRef]
- Langer, J.; Jimenez de Aberasturi, D.; Aizpurua, J.; Alvarez-Puebla, R.A.; Auguié, B.; Baumberg, J.J.; Bazan, G.C.; Bell, S.E.J.; Boisen, A.; Brolo, A.G.; et al. Present and Future of Surface-Enhanced Raman Scattering. ACS Nano 2020, 14, 28–117. [Google Scholar] [CrossRef]
- Ghosh, B.; Lal, H.; Srivastava, A. Review of Bioaerosols in Indoor Environment with Special Reference to Sampling, Analysis and Control Mechanisms. Environ. Int. 2015, 85, 254–272. [Google Scholar] [CrossRef] [PubMed]
- Mainelis, G. Bioaerosol Sampling: Classical Approaches, Advances, and Perspectives. Aerosol Sci. Technol. 2020, 54, 496–519. [Google Scholar] [CrossRef] [PubMed]
- Lee, I.; Jeon, E.; Lee, J. On-Site Bioaerosol Sampling and Detection in Microfluidic Platforms. TrAC Trends Anal. Chem. 2023, 158, 116880. [Google Scholar] [CrossRef]
- Morawska, L.; Buonanno, G.; Mikszewski, A.; Stabile, L. The Physics of Respiratory Particle Generation, Fate in the Air, and Inhalation. Nat. Rev. Phys. 2022, 4, 723–734. [Google Scholar] [CrossRef]
- Caviezel, D.; Narayanan, C.; Lakehal, D. Adherence and Bouncing of Liquid Droplets Impacting on Dry Surfaces. Microfluid. Nanofluid 2008, 5, 469–478. [Google Scholar] [CrossRef]
- Bonifacio, A. Nanostrucured Substrates for Surface-Enhanced Raman Scattering Spectroscopy. In Nanomaterials for Theranostics and Tissue Engineering; Elsevier: Amsterdam, The Netherlands, 2020; pp. 137–174. ISBN 978-0-12-817838-6. [Google Scholar]
- Cialla-May, D.; Bonifacio, A.; Markin, A.; Markina, N.; Fornasaro, S.; Dwivedi, A.; Dib, T.; Farnesi, E.; Liu, C.; Ghosh, A.; et al. Recent Advances of Surface Enhanced Raman Spectroscopy (SERS) in Optical Biosensing. TrAC Trends Anal. Chem. 2024, 181, 117990. [Google Scholar] [CrossRef]
- Cialla-May, D.; Bonifacio, A.; Bocklitz, T.; Markin, A.; Markina, N.; Fornasaro, S.; Dwivedi, A.; Dib, T.; Farnesi, E.; Liu, C.; et al. Biomedical SERS—The Current State and Future Trends. Chem. Soc. Rev. 2024, 53, 8957–8979. [Google Scholar] [CrossRef] [PubMed]
- Magnusson, B.; Örnemark, U. Eurachem Guide: The Fitness for Purpose of Analytical Methods—A Laboratory Guide to Method Validation and Related Topics, 2nd ed.; Eurachem: Uppsala, Sweden, 2014; ISBN 978-91-87461-59-0. [Google Scholar]
- Premasiri, W.R.; Lee, J.C.; Sauer-Budge, A.; Théberge, R.; Costello, C.E.; Ziegler, L.D. The Biochemical Origins of the Surface-Enhanced Raman Spectra of Bacteria: A Metabolomics Profiling by SERS. Anal. Bioanal. Chem. 2016, 408, 4631–4647. [Google Scholar] [CrossRef]
- Chien, J.-Y.; Gu, Y.-C.; Chien, C.-C.; Chang, C.-L.; Cheng, H.-W.; Chiu, S.W.-Y.; Nee, Y.-J.; Tsai, H.-M.; Chu, F.-Y.; Tang, H.-F.; et al. Unraveling RNA Contribution to the Molecular Origins of Bacterial Surface-Enhanced Raman Spectroscopy (SERS) Signals. Sci. Rep. 2024, 14, 19505. [Google Scholar] [CrossRef]
- Rohatgi, A. Webplotdigitizer (4.5). Computer Software. 2021. Available online: https://automeris.io/WebPlotDigitizer (accessed on 18 February 2025).
- Horta-Velázquez, A.; Arce, F.; Rodríguez-Sevilla, E.; Morales-Narváez, E. Toward Smart Diagnostics via Artificial Intelligence-Assisted Surface-Enhanced Raman Spectroscopy. TrAC Trends Anal. Chem. 2023, 169, 117378. [Google Scholar] [CrossRef]
- Li, X.; Li, L.; Zhuo, Z.; Zhang, G.; Du, X.; Li, X.; Huang, Z.; Zhou, Z.; Cheng, Z. Bioaerosol Identification by Wide Particle Size Range Single Particle Mass Spectrometry. Atmosphere 2023, 14, 1017. [Google Scholar] [CrossRef]
- Kabir, E.; Azzouz, A.; Raza, N.; Bhardwaj, S.K.; Kim, K.-H.; Tabatabaei, M.; Kukkar, D. Recent Advances in Monitoring, Sampling, and Sensing Techniques for Bioaerosols in the Atmosphere. ACS Sens. 2020, 5, 1254–1267. [Google Scholar] [CrossRef]
- Liu, T.; Zhang, J.; Cao, J.; Zheng, H.; Zhan, C.; Liu, H.; Zhang, L.; Xiao, K.; Liu, S.; Xiang, D.; et al. Identification of Coexistence of Biological and Non-Biological Aerosol Particles with DAPI (4′,6-Diamidino-2-Phenylindole) Stain. Particuology 2023, 72, 49–57. [Google Scholar] [CrossRef]
- Harshitha, R.; Arunraj, D.R. Real-time Quantitative PCR: A Tool for Absolute and Relative Quantification. Biochem. Mol. Biol. Educ. 2021, 49, 800–812. [Google Scholar] [CrossRef]
- Sharma Ghimire, P.; Tripathee, L.; Chen, P.; Kang, S. Linking the Conventional and Emerging Detection Techniques for Ambient Bioaerosols: A Review. Rev. Environ. Sci. Biotechnol. 2019, 18, 495–523. [Google Scholar] [CrossRef]
- Fennelly, M.; Sewell, G.; Prentice, M.; O’Connor, D.; Sodeau, J. Review: The Use of Real-Time Fluorescence Instrumentation to Monitor Ambient Primary Biological Aerosol Particles (PBAP). Atmosphere 2017, 9, 1. [Google Scholar] [CrossRef]


| PBAP Type | Aerosol Generator | Generation Conditions | Sampling Method | Sampling Conditions | Refs |
|---|---|---|---|---|---|
| E. coli P aeruginosa S. enterica | nebuliser (Omron NE-C21) | 2.1 μm size; 5 min | impaction (custom collector) | na | [25] |
| E. coli Populus deltoides Sequoia sempervirens | nebuliser (Omron NE-C21) | 9 min | impaction (custom collector) | 9 min | [26] |
| E. coli | no name (custom for study) | 0.8–14.5 μm size; 4 L/min | wet cyclone (Coriolis μ) | 150 mL/min; 10 min; 5 mL PBS | [27] |
| Pollen (14 species) | na | na | nr | nr | [28] |
| E. coli | nr | 0.5–20 μm size; 10 min | impaction (Andersen cascade) | 28.3 L/min; 10 min | [29] |
| S. epidermidis M. luteus E. hirae B. subtilis E. coli | one-jet Collison nebuliser | 1 L/min | continuous optofluidic platform | 1 L/min; 5 min | [30] |
| Poa alpina | na | na | nr | nr | [31] |
| S. aureus E. coli Candida albicans | ultrasonic atomiser (BSW-2A) | 2 mL of microbial suspension (106 cfu/mL) for 5 min | filtration (biochip) | 1 L/min; 20 min | [32] |
| not specified | human breath | 4 h breathing | filtration | 4 h | [33] |
| E. coli S. epidermidis | no name (custom for study) | 1–5 μm size; 30–45 mL/h; 30 min | wet cyclone | 265 L/min 10 min; 2 mL DW | [34] |
| SARS-CoV-2 pseudovirus | nebuliser | 0.1 ng/mL; 5 min | swirling | 5 min; (filtration) | [35] |
| SARS-CoV-2 | nebuliser | 200 μL of viral lysate nebulised onto the face mask and dried for 1 h at 25 °C | filtration | na | [36] |
| SARS-CoV-2 | nebuliser | <10 μm size; 10 s | filtration | na | [37] |
| Substrate | Laser Line (nm) | Laser Power | Exposure Time (s) | LOD | Overall Time (min) | Refs |
|---|---|---|---|---|---|---|
| AgNPs | 514 | 250 mW | 60 | nr | 5 | [20] |
| AgNPs | 514 | 100 mW | 120 | ~102 CFU/mL | ~12 | [21] |
| AgNPs (immunoassay) | 633 | 7 mW | 6.25 | 144 particles/cm3 | 80 | [22] |
| AuNPs | 785 | 1.4 × 10⁶ W/cm2 | 500 | nr | ~9 | [23] |
| Klarite® | 785 | 10 mW | 100 | 109 CFU/mL | ~12 | [24] |
| AgNPs | 532 | nr | 60 | ~102 CFU/mL | 15 | [25] |
| AuNPs | 785 | 2.9 × 10⁵ W/cm2 | 1000 | nr | ~20 | [26] |
| AgNPs | 785 | 11.8 mW | 5 | 1.263 CFU/m3 | ~40 | [27] |
| Ag/Ni/macroPSi ss | 473 | nr | 1 | nr | ~15 | [28] |
| AgNPs on AAO | 785 | 1 mW | 150 | 103 cells/mL, 104 cells/mL | ~12 | [29] |
| AuNPs-PAA ss | 785 | nr | 300 | nr | ~7 | [30] |
| AuNPs-MGITC (immunoassay) | 633 | nr | nr | 2.30 pfu/mL | ~120 | [31] |
| Au-TiO2 | 633 | 5 mW | 1 | nr | ~60 | [32] |
Disclaimer/Publisher’s Note: The statements, opinions and data contained in all publications are solely those of the individual author(s) and contributor(s) and not of MDPI and/or the editor(s). MDPI and/or the editor(s) disclaim responsibility for any injury to people or property resulting from any ideas, methods, instructions or products referred to in the content. |
© 2025 by the authors. Licensee MDPI, Basel, Switzerland. This article is an open access article distributed under the terms and conditions of the Creative Commons Attribution (CC BY) license (https://creativecommons.org/licenses/by/4.0/).
Share and Cite
Fornasaro, S.; Semeraro, S.; Licen, S.; Barbieri, P. Surface-Enhanced Raman Scattering of Bioaerosol: Where Are We Now? A Systematic Review. Chemosensors 2025, 13, 86. https://doi.org/10.3390/chemosensors13030086
Fornasaro S, Semeraro S, Licen S, Barbieri P. Surface-Enhanced Raman Scattering of Bioaerosol: Where Are We Now? A Systematic Review. Chemosensors. 2025; 13(3):86. https://doi.org/10.3390/chemosensors13030086
Chicago/Turabian StyleFornasaro, Stefano, Sabrina Semeraro, Sabina Licen, and Pierluigi Barbieri. 2025. "Surface-Enhanced Raman Scattering of Bioaerosol: Where Are We Now? A Systematic Review" Chemosensors 13, no. 3: 86. https://doi.org/10.3390/chemosensors13030086
APA StyleFornasaro, S., Semeraro, S., Licen, S., & Barbieri, P. (2025). Surface-Enhanced Raman Scattering of Bioaerosol: Where Are We Now? A Systematic Review. Chemosensors, 13(3), 86. https://doi.org/10.3390/chemosensors13030086