Article

Cellulose-Based SERS Substrate for Vapor-Phase Thiol Detection with PCA for Enhanced Chemical Selectivity

by
Ba-Thong Trinh
1,
Sy Khiem Nguyen
1,
Dayeon Kim
1,
Huu-Quang Nguyen
1,
Jaebeom Lee
1,2,
Youngku Sohn
1 and
Ilsun Yoon
1,*
1
Department of Chemistry, Chungnam National University, Daejeon 34134, Republic of Korea
2
Department of Chemical Engineering, Chungnam National University, Daejeon 34134, Republic of Korea
*
Author to whom correspondence should be addressed.
Chemosensors 2025, 13(3), 101; https://doi.org/10.3390/chemosensors13030101
Submission received: 13 February 2025 / Revised: 5 March 2025 / Accepted: 7 March 2025 / Published: 10 March 2025

Abstract

:
In this work, we present a low-cost, label-free cellulose-based paper SERS (Surface-Enhanced Raman Scattering) substrate for the sensitive detection of thiol compounds. Uniform silver nanoparticles (AgNPs) were synthesized on cellulose filter paper via in situ reduction of a silver precursor under UVC irradiation, achieving a high SERS enhancement factor of 8.5 × 10⁶. The Ag-cellulose substrate demonstrated reliable detection of benzenethiol, capturing its characteristic SERS signals with remarkable sensitivity. Quantitative analysis was enabled by adjusting exposure times for accurate calibration. Furthermore, Principal Component Analysis (PCA) was successfully employed to distinguish mixed samples of benzenethiol, hexanethiol, and propanethiol, showcasing the substrate’s capability in separating complex mixtures. This cellulose-based AgNP platform offers a sustainable, cost-effective solution for rapid chemical detection, with significant potential for real-world applications such as environmental monitoring and food safety.

1. Introduction

Surface-enhanced Raman spectroscopy (SERS) is an advanced, sensitive technique for detecting chemical and biological analytes using vibrational spectroscopy, providing a powerful method for identifying molecules without additional labeling [1,2,3]. The high sensitivity mainly comes from electromagnetic enhancement at “hot spots”—high field regions between closely spaced nanoparticles or sharp particle edges—boosting the field and strengthening Raman signals [4,5,6]. To maximize the SERS effect, various nanoscale structures have been designed, particularly those using noble metals like silver [7,8] and gold [9,10,11].
In designing SERS substrates, researchers typically choose between colloidal and solid-state configurations. Colloidal substrates provide flexibility in nanoparticle shape and size for targeted analyte detection but often suffer from stability issues, such as aggregation or precipitation, which reduce reproducibility [12,13]. In contrast, solid-state substrates—made from materials such as paper [14,15,16], silicon [17,18], glass [15], and polymers [19] offer a stable base for nanoparticle immobilization and support higher hot spot densities across larger surfaces. Paper-based substrates, in particular, have drawn attention for their flexibility, cost-effectiveness, biocompatibility, and porosity, all of which enhance hot spot distribution, nanoparticle dispersion, and analyte adsorption. Additionally, paper’s microfluidic properties allow effective analyte transport and concentration, making it ideal for applications that require fast, on-site detection [20,21].
Recent studies highlight the effectiveness of cellulose-based paper as a SERS substrate [14,22,23,24]. The porous structure of cellulose enhances the density and uniformity of hot spots, increasing analyte adsorption and enabling nanoparticle network formation suitable for SERS. For instance, porous silicon and similar nanoporous materials show multiple-fold improvements in signal intensity over non-porous surfaces [25,26]. Similarly, polymer hydrogels embedded with nanoparticles offer high sensitivity and selective filtration for small molecules. These findings showed the potential of porous materials in advancing SERS technology, with paper-based substrates emerging as a versatile, low-cost option for developing stable, efficient SERS substrates.
Gas-phase detection using Surface-Enhanced Raman Spectroscopy (SERS) has gained increasing attention for its ability to identify volatile compounds with high sensitivity and molecular specificity [27,28,29,30]. Detecting gaseous analytes is more challenging than liquid or solid analytes due to their low concentration and weak surface interactions. However, the combination of porous materials, nanostructured substrates, and surface functionalization enhances analyte adsorption, improving signal intensity [31,32]. This makes SERS a promising tool for applications such as air quality monitoring, detection of hazardous chemicals, and breath-based diagnostics, offering rapid, non-destructive analysis in complex environments [33].
In this study, a cellulose-based surface-enhanced Raman scattering (SERS) substrate was employed to investigate its performance in detecting various thiol compounds in both liquid and vapor phases. The fabrication process offers a straightforward and cost-effective approach to synthesizing silver nanoparticles (AgNPs) uniformly distributed on cellulose paper, without the need for additional chemical reducing agents. UVC irradiation effectively reduces silver ions to AgNPs, enabling rapid formation of a stable and reproducible SERS substrate. This UVC-assisted reduction method provides precise control over nanoparticle size and distribution, which are critical factors for optimizing SERS sensitivity.
The high plasmonic activity of silver nanoparticles produced by UVC irradiation enhances SERS signals, allowing for the detection of low-concentration analytes. To analyze the SERS spectra obtained from vapor-phase thiol compounds—benzenethiol, hexanethiol, propanethiol, and their mixtures—Principal Component Analysis (PCA) was applied. PCA successfully distinguished between individual thiols and their mixtures, providing clear spectral separation and reliable classification. This demonstrates the robustness of the SERS platform in combination with multivariate analysis for the identification and discrimination of structurally similar thiol compounds in complex environments.

2. Materials and Methods

2.1. Materials and Reagents

Nitric acid (70%) was purchased from Daejung Chemicals (Siheung, Republic of Korea). Silver nitrate (≥99%), benzenethiol (≥99%), hexannethiol (97%), propanethiol (99%), and sodium bicarbonate (≥99.5%) were purchased from Sigma-Aldrich (Seoul, Republic of Korea). Ethanol (99.9%) was purchased from Samchun Chemicals (Seoul, Republic of Korea). Deionized (DI) water of 18.3 MΩ was obtained by a water purification system (Human Corporation, Seoul, Republic of Korea). All aqueous solutions were prepared using ethanol. All chemicals were used without further purification.

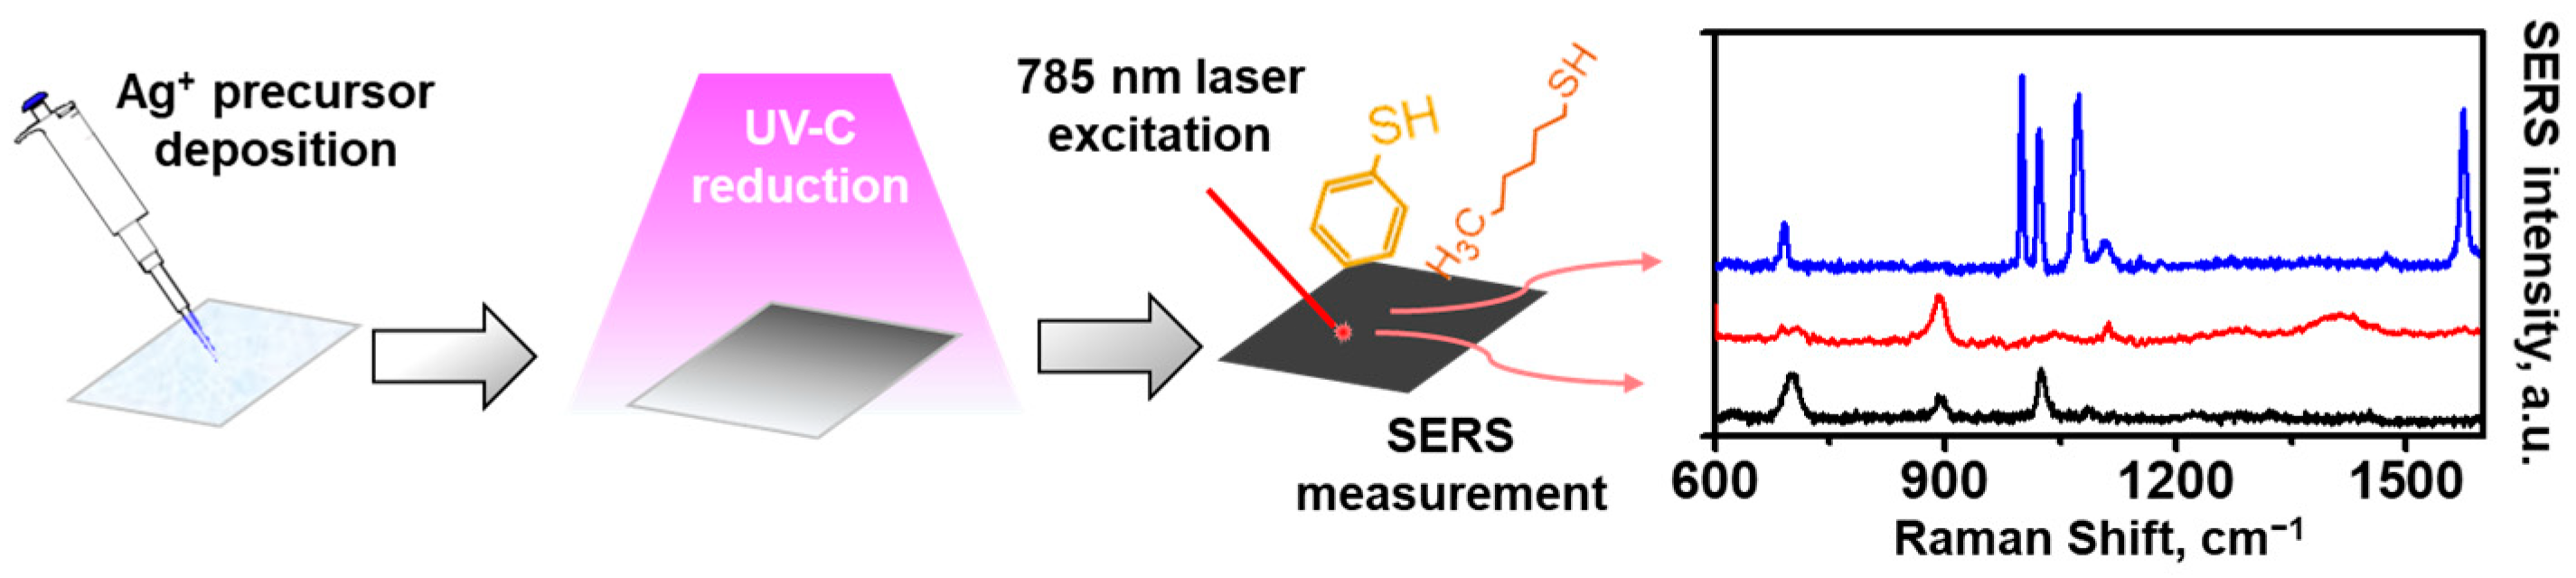
2.2. AgNPs/Cellulose SERS Substrate Fabrication

The AgNPs/cellulose SERS substrate was fabricated via UVC reduction process, as demonstrated in Scheme 1. The cellulose filter paper (1.5 × 1.5 cm2) (Whatman 42, GE Healthcare, IL, USA) was treated with 10% HNO3 solution for 12 h and washed with water. The cellulose paper was then treated with 5% NaHCO3 solution for 2 h and washed with water. The cleaned cellulose paper was dried in a vacuum oven at 40 °C. 30 µL of various concentration AgNO3 aqueous solution was dropped on cellulose paper and undergoes UVC irradiation, where high-energy photons interact with the silver precursor. This interaction breaks down the silver nitrate into its constituent parts, releasing silver ions (Ag+) into the surrounding environment. UVC light generates reactive oxygen species (ROS) like hydroxyl radicals (•OH) and hydrogen peroxide (H2O2) from moisture or organic compounds on cellulose paper, aiding in the reduction of silver ions [34]. These Ag+ ions are reduced to metallic silver (Ag0) through photoreduction or interaction with reactive species, initiating the formation of AgNPs on the cellulose substrate. The cellulose’s porous structure stabilizes and evenly distributes the nanoparticles, while its hydroxyl groups help maintain the AgNPs’ structural integrity [35]. The substrate changed from white color of filter paper to dark color of AgNPs on the substrate, indicating the successful completion of the UVC reduction process. After drying, the samples were kept in room condition for further SERS measurement.

2.3. Surface Morphologies and Optical Properties of AgNPs/Cellulose Substrate

The fibrous surface of the AgNPs/cellulose paper was examined by field-emission scanning electron microscopy (SEM, TESCAN (CLARA), Brno-Kohoutovice, Czech Republic), field-emission transmission electron microscopy (FE-TEM; JEM-2100F (HR), JEOL, Tokyo, Japan) at an accelerating voltage of 300 kV. The extinction spectra were obtained using a diffuse reflectance ultraviolet–visible–near-infrared (UV–vis–NIR) spectrometer (SolidSpec-3700, Kyoto, Japan).

2.4. Liquid Phase Sample Preparation

Ethanolic solutions of benzenethiol (BT) were prepared to investigate their interactions with the silver nanoparticle-impregnated SERS paper substrate. For each experiment, 1 mL of the respective thiol solution was applied to the Ag-impregnated SERS paper, allowing it to soak for 24 h at room temperature to facilitate effective adsorption of the thiol molecules onto the silver nanoparticle surface. After the soaking period, the samples were thoroughly rinsed with ethanol to remove any loosely bound thiol molecules, thus preventing interference during subsequent SERS measurements. The substrates were then dried under a stream of nitrogen gas to remove residual solvent, ensuring the SERS paper remained uncontaminated and optimized for signal quality. This preparation process was designed to enhance the interaction between the thiol compounds and the silver nanoparticles, supporting consistent and high-sensitivity SERS measurements.

2.5. Gas Phase Sample Preparation

A glass petri dish with a 30 mm bottom diameter was utilized as a gas chamber to facilitate controlled vapor-phase exposure of the thiol solution to the Ag-cellulose SERS substrate. The chamber was carefully sealed with parafilm to prevent any vapor leakage, ensuring a stable and consistent environment for the interaction between the thiol vapor and the silver nanoparticle-impregnated cellulose paper. Inside the chamber, 200 µL of a 1 mM ethanolic thiol solution was introduced alongside the Ag-cellulose paper substrate (0.75 × 0.50 cm2). The substrate was positioned to optimize its exposure to the thiol vapor during the incubation period.
Following the specified exposure time, which varied depending on the experimental conditions required to study adsorption dynamics, the substrate was promptly removed from the chamber. This immediate removal minimized any unintended post-exposure interactions with ambient air. Once removed, the SERS signal was measured directly, allowing for an accurate assessment of the interaction between the thiol compounds and the silver-decorated cellulose substrate under controlled vapor-phase conditions. This protocol was designed to standardize the exposure process, ensuring consistent thiol adsorption and reliable SERS measurements across all samples.

2.6. SERS Measurement and Signal Processing

SERS measurements were conducted using a High-Resolution Raman Spectrophotometer (Horiba, LabRAM HR-800, Horiba Advanced Techno, Co., Ltd., Kyoto, Japan) for its precision in detecting subtle Raman signals. A 785 nm laser minimized fluorescence and enhanced the SERS signal. The setup used a 600 grating for balanced spectral resolution and intensity, with a 10% neutral density filter to control laser power at 230 µW. Each measurement had a 10-s acquisition time and three accumulations to improve signal reliability. Measurements were taken at five random points on each substrate for reproducibility and repeated on four Ag-cellulose substrates for consistency. Peak intensities were calculated after baseline correction to remove background noise and ensure accurate quantitative analysis. For the measurement of Raman intensity of bulk BT, the setup used the laser power of 1.0 mW and the exposure time of 900 s.
The Principal Component Analysis (PCA), an unsupervised data analysis method, was utilized to enhance the interpretation of rapid SERS detection results obtained from the AgNPs/cellulose SERS substrate. The SIMCA software (SIMCA 11.0) was employed to calculate the principal component (PC) scores for each SERS spectrum (Supplementary Materials). These PC scores were visualized in a score plot, where each sample is represented according to its position in the principal component space, providing a clear distinction between the spectral data.

3. Results and Discussion

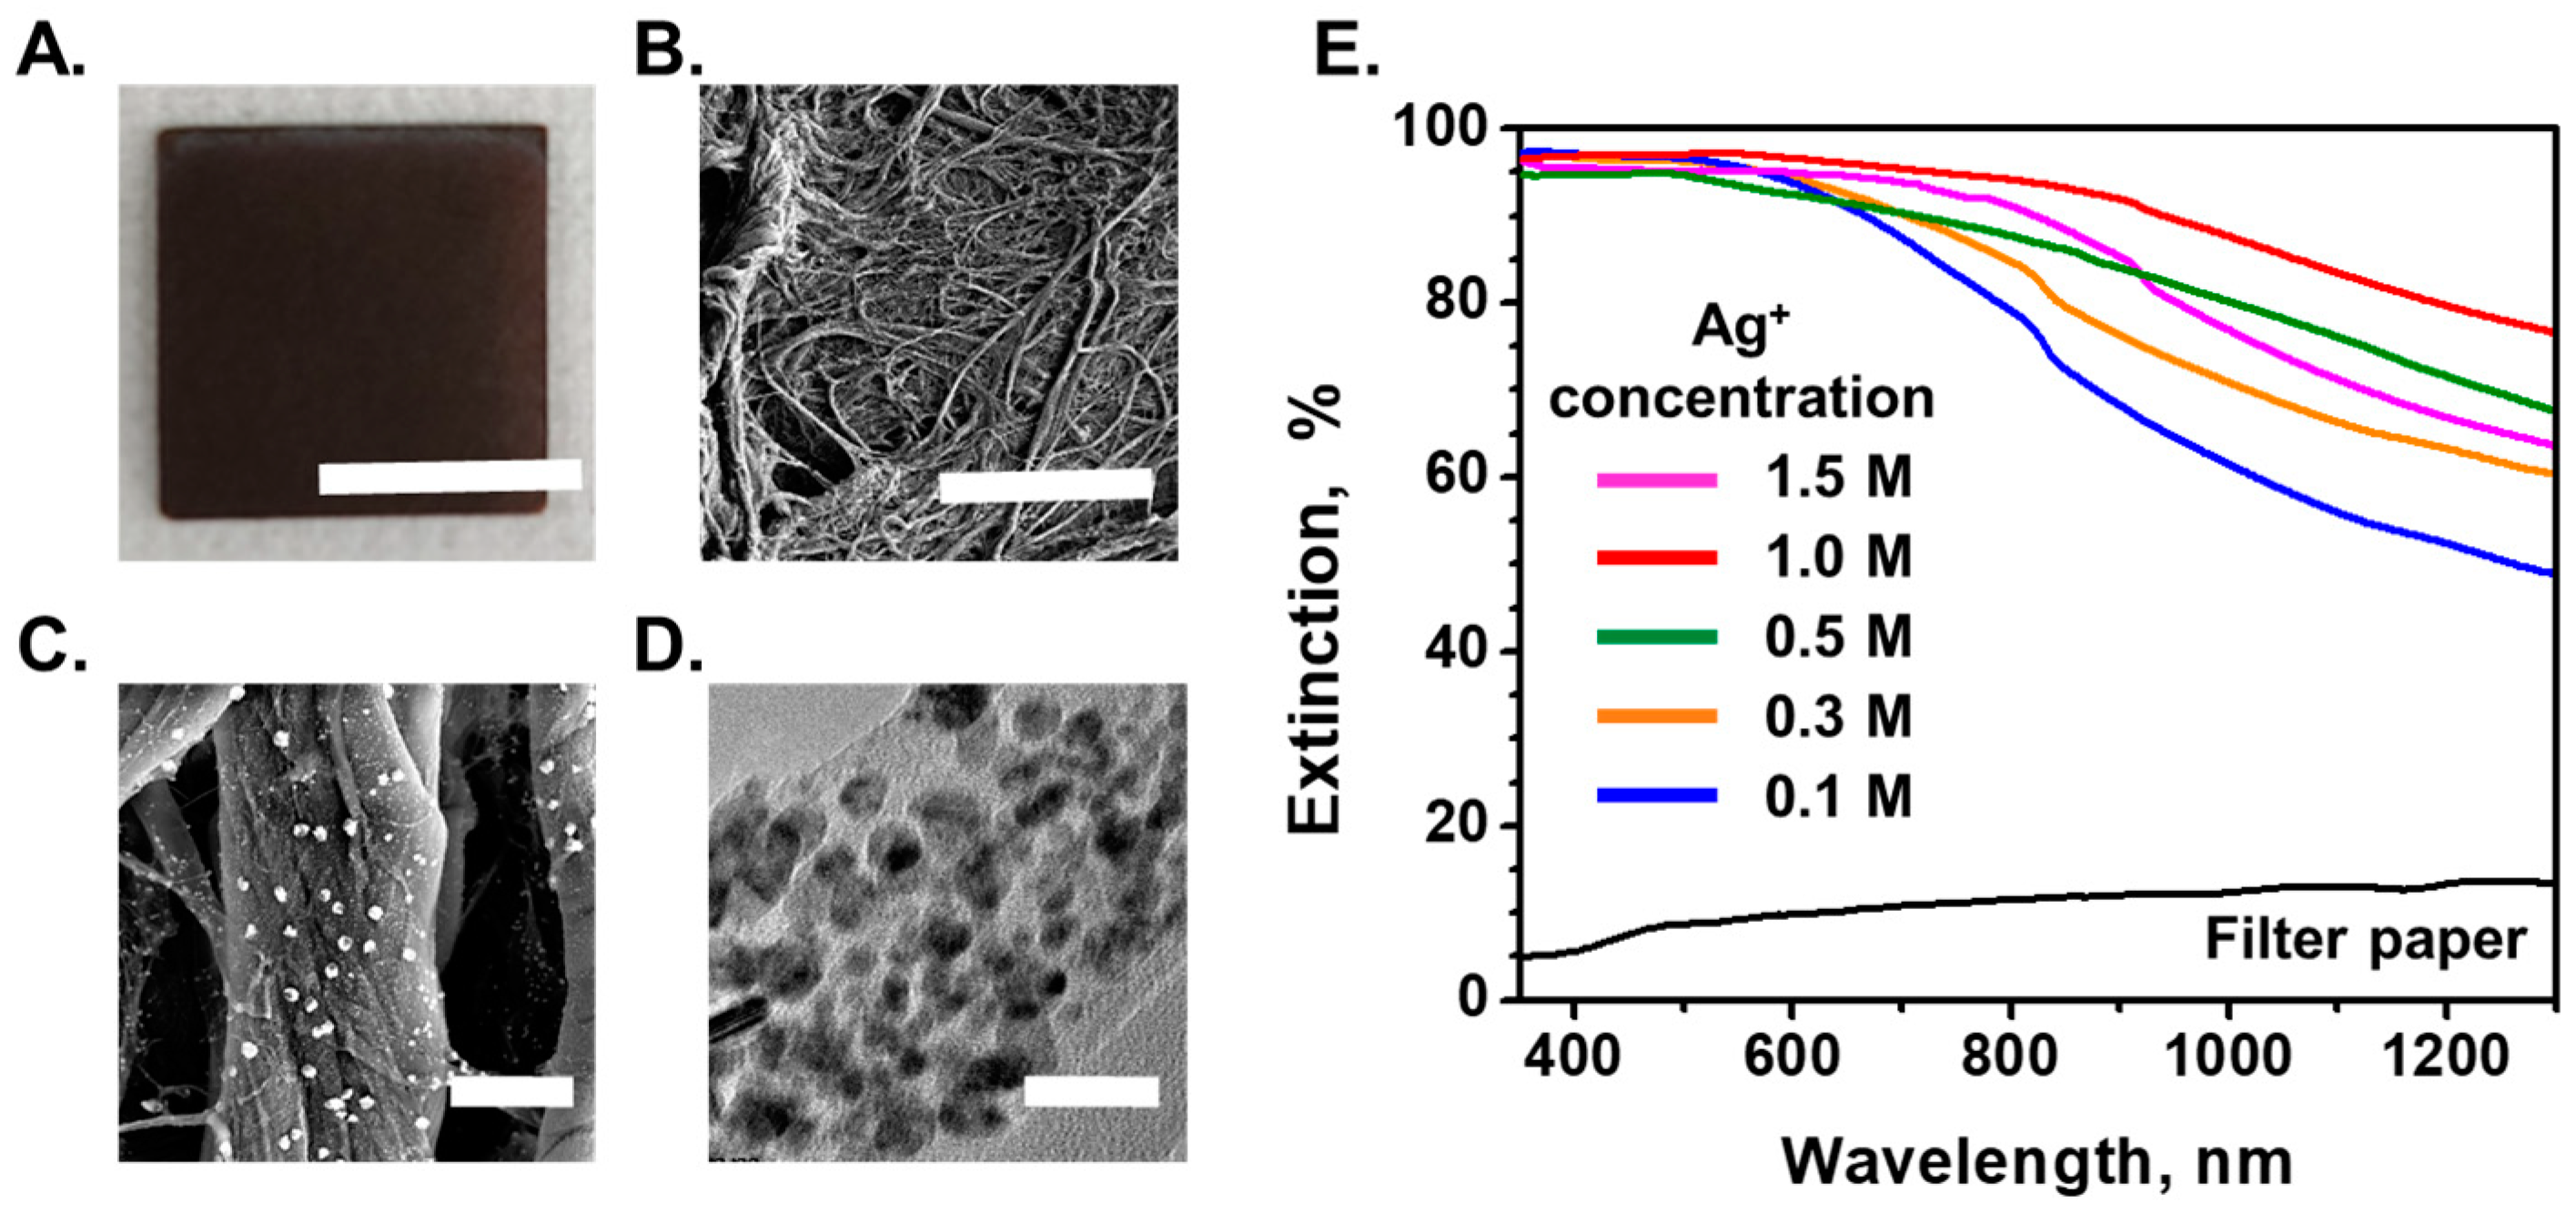
3.1. Surface Morphology and Optical Characterization

Figure 1A shows the optical image of AgNPs/cellulose SERS substrate after UVC reduction, with the uniform black color of AgNPs.
Figure 1B,C demonstrated the scanning electron microscopy (SEM) characterization of silver nanoparticles (AgNPs) onto the cellulose paper substrate, with the detailed EDS analysis was showed in Figures S1 and S2 and Table S1, Supplementary Materials. The images showed a uniformly AgNPs distributed across the cellulose surface, indicating effective loading during the fabrication process. The abundance of nanoparticles led to the formation of numerous nanoscale gaps between them, which are critical for enhancing electromagnetic fields in surface-enhanced Raman spectroscopy (SERS). This high density of gaps, in conjunction with the increased surface-to-volume ratio provided by the AgNPs, creates an optimal environment for enhancing Raman signals. As a result, the unique morphology of the AgNPs on the cellulose paper not only improves the overall sensitivity of the SERS substrate but also facilitates effective adsorption of analytes, allowing for more robust detection capabilities. The interconnected structure formed by the densely packed nanoparticles enhances the possibility of generating “hot spots”, where the electromagnetic field is significantly amplified, further contributing to the substrate’s performance in SERS applications.
Transmission electron microscopy (TEM) images in Figure 1D provide a detailed visualization of the silver nanoparticles (AgNPs) embedded within the cellulose substrate, revealing their distinct morphological characteristics. The nanoparticles are clearly defined, exhibiting a relatively uniform size distribution with an estimated average diameter ranging from approximately 10 to 20 nanometers. This size range is particularly advantageous for SERS applications, as smaller nanoparticles typically exhibit higher surface energy and enhanced plasmonic properties, leading to more effective signal amplification.
The extinction spectra were recorded for AgNPs/cellulose substrates created with different precursor concentrations under a 2-h UVC reduction process (Figure 1E). Extinction increased as the precursor concentration rose from 0.1 to 1.0 M, particularly in the NIR region. However, at a higher concentration of 1.5 M, extinction in the NIR region significantly decreased. The SERS intensity was found to correlate with the enhancement field at both laser and Stokes-shift wavelengths in the NIR region. As a result, substrates prepared with a 1.0 M precursor concentration likely provided higher SERS intensities.

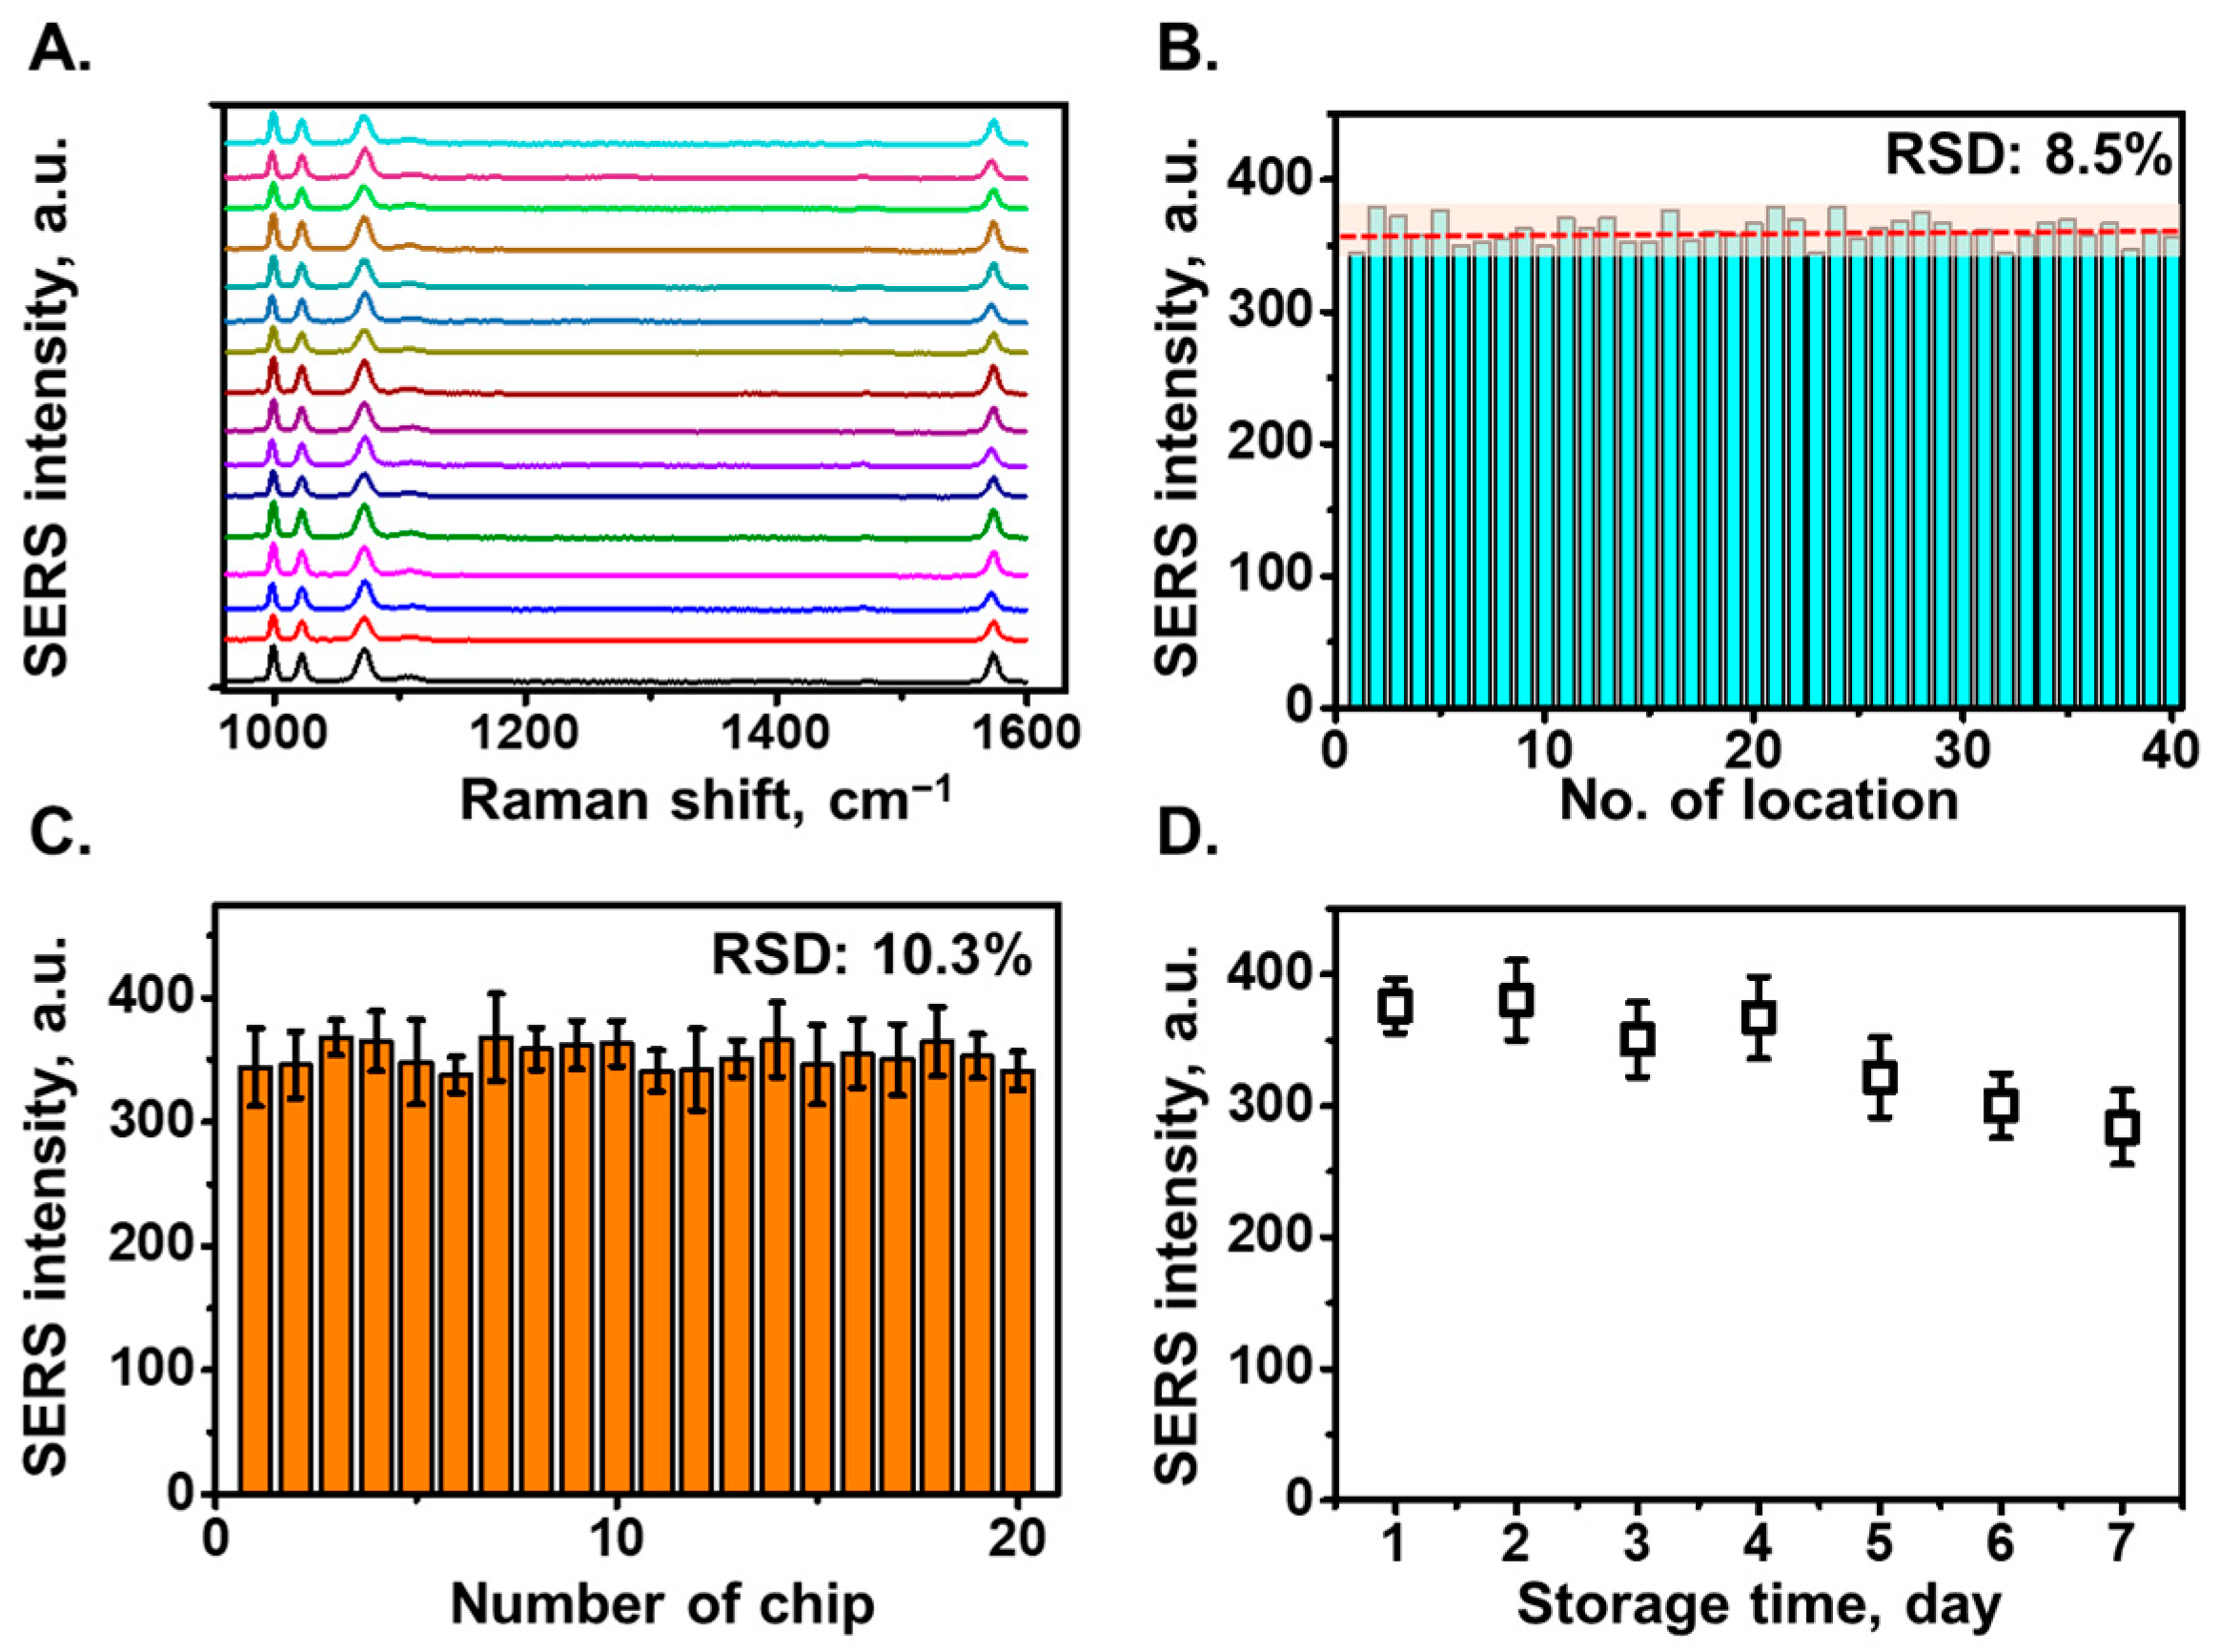
3.2. SERS Characterization

SERS spectra of monolayer BT on the AgNPs/cellulose SERS substrate with precursor concentrations ranging from 0.1 to 1.5 M were recorded (Figure 2A). The characteristic SERS intensities of BT increased progressively as the precursor concentration rose from 0.1 to 1 M. However, no significant increase in spectral intensities was observed at higher concentrations (1.5 M), suggesting that the optimal SERS enhancement for the paper substrates occurred at a precursor concentration of 1 M.
Figure 2B shows the SERS spectra of monolayer BT on the AgNPs/cellulose substrate prepared with the same precursor concentration but different UVC reduction times. As the reduction time increased, the characteristic SERS intensities of BT gradually enhanced. However, when the reduction time exceeded 2 h, the SERS intensity plateaued, with a slight increase in background signal. This may be due to the formation of an Ag thin film on the cellulose surface. Based on these SERS results, the sample prepared with a 1.0 M precursor and a 2-h UVC reduction time was selected for further experiments. Using the SERS intensity of monolayer BT, the SERS enhancement factor was calculated using the Raman band at 1071 cm−1 as follows [36]:
E F = I S E R S I R a m a n × N R a m a n N S E R S
where ISERS and IRaman are the SERS intensity and normal Raman intensity normalized to the acquisition time and excitation laser power, respectively, and NSERS and NRaman are the number of molecules probed within the laser spot and Raman detection volume, respectively. The normal Raman intensity of bulk liquid BT and the SERS intensity of BT on AgNPs/cellulose substrate were showed in Figure S3, Supplementary Materials. The ISERS and IRaman values were determined to be 0.34 and 1.4 × 10⁻⁴, respectively. For the NSERS calculation, a reference surface coverage value of BT [36] was used. With a reference surface coverage of approximately 3.3 × 1014 cm−2, the NSERS was found to be 3.8 × 10⁷. In the NRaman calculation, the detection volume was determined to be 23.1 μm3, taking into account the microscope objective (10×, NA: 0.25) and the Raman reservoir depth (2 μm). Using the density of BT (1.073 g/cm3), the NRaman value was calculated to be 1.4 × 10¹¹. Finally, the enhancement factor (EF) was estimated to be 8.5 × 10⁶. The EF value of the Raman band of BT at 1071 cm−1 was estimated to be 8.1 × 10⁶.
SERS spectra were collected for various concentrations of BT, ranging from 1 nM to 100 µM, using the AgNPs/cellulose SERS substrate. At the 1 nM concentration, a weak BT signal was observed, as shown in Figure 2C. The SERS intensities at the 1071 cm−1 peak for different BT concentrations are displayed in Figure 2D. A linear fit with an R² value of 0.98 between the SERS intensities and relative BT concentrations is also presented in Figure 2D. Based on this fitting function, the limit of detection (LOD) for BT concentration using the AgNPs/cellulose substrate was calculated to be 4.32 nM, derived from the blank noise’s three times the standard deviation (RSD) [37]. The low LOD and broad linear dynamic range achieved for BT underscore the potential of AgNPs/cellulose substrates as effective, label-free SERS platforms for detecting thiol compounds.
When evaluating SERS substrates, it is essential to consider not only high intensities and high enhancement factor (EF) values but also the reproducibility of the SERS signals. To assess this, the SERS spectra of BT monolayers were recorded at several random locations on the AgNPs/cellulose substrate to examine the homogeneity of the signals across the surface (Figure 3A).
The detailed SERS intensities at the 1071 cm−1 band from 40 random locations are shown in Figure 3B. The bar graphs indicate that the SERS intensities were quite consistent across the surface, with a relative standard deviation (RSD) of 8.5%.
The uniformity of the AgNPs/cellulose substrates was further tested across different chips. A total of 20 SERS chips (0.5 × 0.5 cm2), all fabricated under the same conditions, were used to measure the SERS intensities at the 1071 cm−1 band of BT. For each chip, spectra were taken from five different locations, and the average value was calculated. The SERS intensities across the 20 chips, shown in Figure 3C, demonstrated a small RSD of 10.3%, indicating good chip-to-chip uniformity.
Another critical factor for SERS substrates is the chemical stability on the surface. After depositing the BT monolayer onto the Ag/cellulose SERS substrate, the sample was stored at room temperature (20 °C) with a relative humidity between 35% and 40% for one week. The SERS intensities of BT on the substrate were measured daily (Figure 3D). The results showed that, after seven days, the SERS intensity at 1071 cm−1 had decreased by only 15%, indicating strong chemical bonding on the AgNPs/cellulose SERS substrates. This finding demonstrates excellent uniformity and stable chemical bonding on the substrate, attributed to the high density of SERS hot spots and the stable nanoparticle structure on the cellulose surface, which was achieved through the in situ growth of AgNPs via UVC reduction.

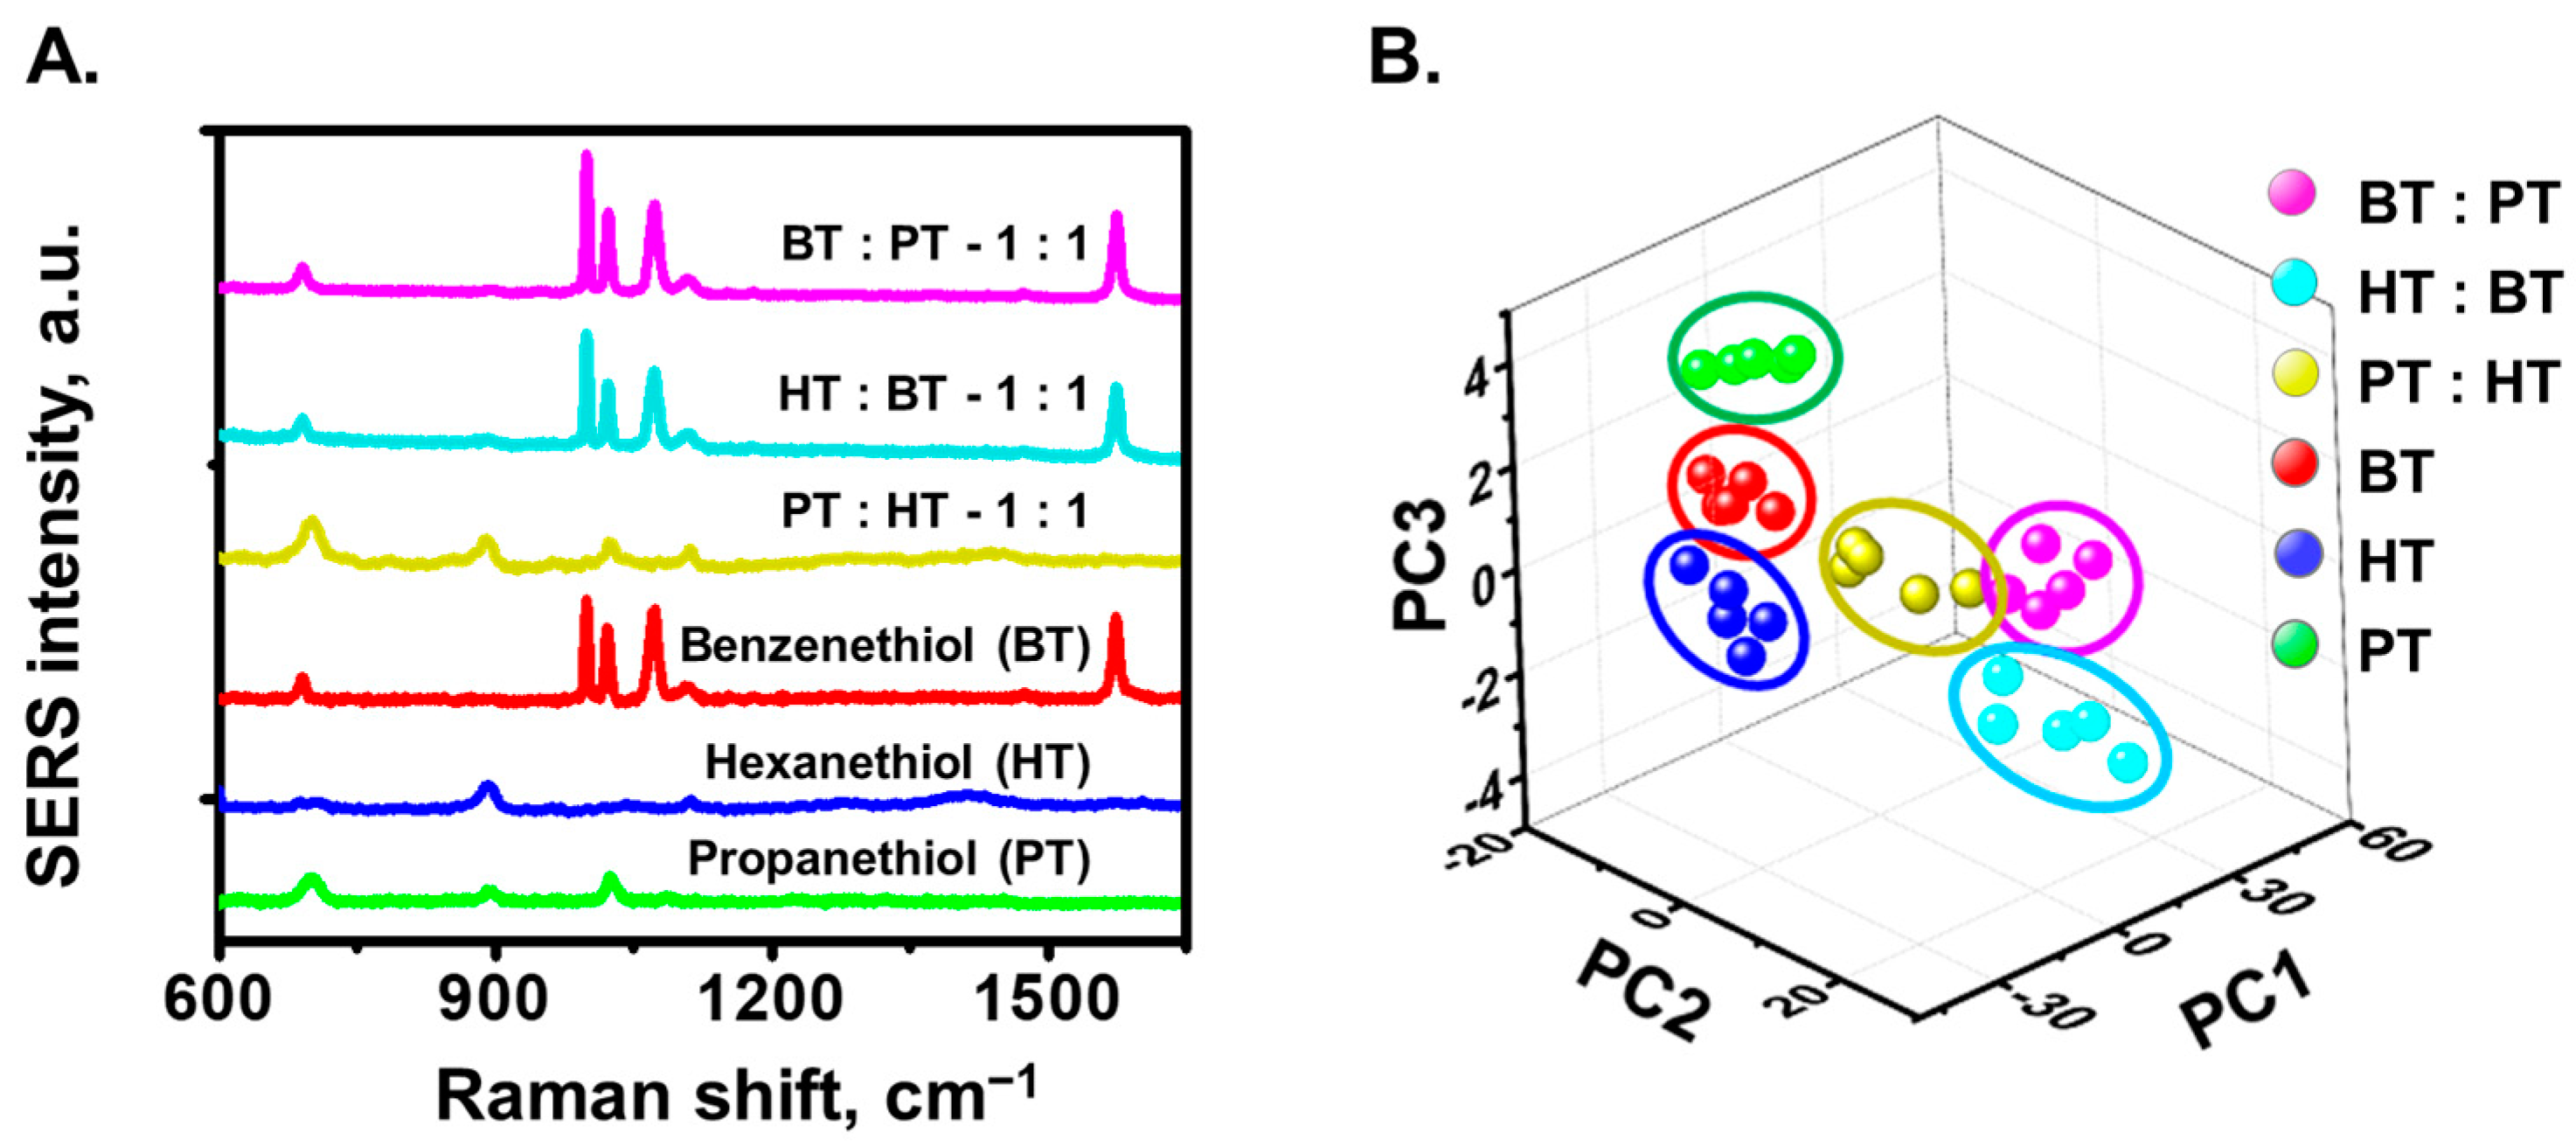
3.3. Vapor-Phase Detection of Thiols Compounds

The vapor-phase detection of thiol compounds using AgNPs/cellulose SERS substrates was performed by utilizing the natural vaporization of thiol compounds and their self-assembly onto the SERS substrate surface. This process was carried out in a closed Petri dish at room temperature, providing a controlled environment for the vaporization of the thiol compounds (Figure 4A). Within this setup, a small container with 200 µL of a 1 M BT solution in ethanol was placed inside the closed Petri dish alongside the AgNP/cellulose SERS substrate. Ethanol was chosen as the solvent to ensure rapid evaporation, enabling the thiol compounds to vaporize and adsorb onto the AgNPs embedded in the cellulose material.
As the thiol compounds vaporized, they spontaneously assembled onto the substrate’s surface. After various exposure times, the SERS intensity of BT was measured by removing the substrate from the closed environment and immediately analyzing it. Representative SERS spectra of vapor-phase BT at different exposure times are presented in Figure 4B, showing that the Raman signal became detectable after just 30 min of exposure to the thiol vapor. As the exposure time increased, the Raman signal’s intensity continued to rise, indicating a time-dependent accumulation of thiol molecules on the substrate.
The SERS intensities at the Raman band of 1071 cm−1 were plotted against exposure time in Figure 4C. As expected, the intensity increased steadily with longer exposure times, reaching a maximum value of 432 after 4 h of exposure. This intensity was comparable to that observed for BT at a concentration of 10−5 M in Figure 2D, demonstrating that the vapor-phase detection method produced signal intensities similar to those obtained with traditional liquid-phase concentrations.
However, after an exposure time of 4 h, a slight decrease in the SERS intensity was observed. This decline can be attributed to the high localized concentration of BT molecules on the substrate’s surface. As the thiol molecules densely packed onto the AgNPs, they likely covered the SERS hot spot regions, which are critical for enhancing the Raman signal. The occlusion of these hot spots due to molecular crowding resulted in a reduced overall SERS signal, as fewer available sites contributed to the enhanced Raman scattering effect.
This observation underscores the importance of optimizing exposure time to balance signal intensity and prevent overcrowding of the substrate surface, thereby ensuring maximum SERS enhancement. In conclusion, the results confirm the feasibility and effectiveness of using AgNPs/cellulose SERS substrates for vapor-phase detection of thiol compounds, with exposure time playing a crucial role in signal strength and substrate performance.
To further investigate the selectivity of the AgNPs/cellulose SERS substrate for vapor-phase thiol compounds, the substrate was used to measure the SERS intensity of three different chemicals: Benzenethiol (BT), Hexanethiol (HT), and Propanethiol (PT), along with their mixtures in the gas phase. The preparation process followed the same approach as the vapor-phase detection of BT described previously, with an exposure time of 4 h. Subsequently, the three thiol compounds were mixed pairwise in equal portions: PT and HT, HT and BT, and BT and PT, in a 1:1 ratio, with each mixture also exposed for 4 h. The resulting SERS spectra of the individual thiol compounds and their mixtures are displayed in Figure 5A. In these spectra, the characteristic peak of HT at 891 cm−1, PT at 675 cm−1 and 1021 cm−1, and the prominent SERS peak of BT were clearly observed. When the chemicals were mixed, the SERS intensity at the characteristic peak of BT dominated, making it difficult to distinguish between the individual BT spectrum and those of the mixtures containing BT.
To more clearly separate the SERS spectra of each chemical and their mixtures, Principal Component Analysis (PCA) was applied (Figure 5B). PCA is a powerful technique that reduces the dimensionality of the data while retaining the most significant variation between the spectra, making it ideal for distinguishing subtle differences in chemical compositions. In this study, the SERS data from all six chemical samples—three individual thiols (BT, HT, and PT) and their corresponding mixtures—were subjected to PCA.
A score plot based on the first three principal components (PC1, PC2, and PC3) was constructed, providing a visual representation of how the data points corresponding to each chemical and their mixtures relate to one another. Each point on the plot represents a specific chemical or mixture, and the distances between points reflect the differences in their spectral profiles. The PCA analysis successfully grouped the individual chemicals and their mixtures, with distinct clusters forming for each of the compounds and their corresponding combinations.
The PC2 and PC3 components showed distinct ability to separate the differences between the thiol types based on their peak profiles, such as the BT and these two compounds BT-PT and HT-BT can be separated from the different in the band at 900 cm1. The PC1 response positively toward the random errors and background noises, as observed in the component contribution plots (Figure S4, Supplementary Materials). In these cases, a 3D score-plot (Figure 5B) was more suitable to visualize the distribution and groupings of samples. The SERS spectra of the mixed samples containing BT tend to cluster nearby the PC1 = 0 axis, due to the dominant profiles with strong SERS peaks from BT. However, the mixtures containing HT and PT, as well as their mixture also showed some variation that could be captured by the PCA, allowing them to be separated from the other compounds. This clear separation was indicative of the sensitivity of the AgNPs/cellulose SERS substrate to the different thiol compounds, even in the presence of mixtures. This ability to differentiate between even similar mixtures highlights the power of PCA in enhancing the selectivity of the SERS substrate, making it a valuable tool for analyzing complex chemical systems.
Overall, the use of PCA greatly improved the interpretation of the SERS data by reducing the complexity of the information and emphasizing the most important spectral features for distinguishing between the thiol compounds and their mixtures. This method demonstrates the potential for using PCA alongside SERS to achieve highly selective detection of chemical compounds in complex mixtures, enhancing the reliability and accuracy of the AgNPs/cellulose SERS substrate for vapor-phase analysis.

4. Conclusions

In this study, we successfully developed a cellulose-based surface-enhanced Raman spectroscopy (SERS) substrate for the sensitive and reliable detection of thiol compounds in both liquid and vapor phases. By employing UVC-assisted in situ reduction, we synthesized highly uniform silver nanoparticles (AgNPs) on cellulose filter paper, achieving a remarkable SERS enhancement factor of 8.5 × 10⁶. The substrate demonstrated excellent sensitivity, with a limit of detection (LOD) of 4.32 nM for benzenethiol, and maintained strong reproducibility and stability over time. The chip-to-chip RSD was 10.3%, confirming the high consistency of the fabrication process across multiple substrate batches Our vapor-phase detection approach expands the application of SERS beyond traditional liquid-phase sensing, enabling real-time monitoring of volatile compounds. By integrating Principal Component Analysis (PCA), we enhanced the selectivity and discrimination of closely related thiol compounds and their mixtures, further validating the robustness and versatility of our platform. This eco-friendly, cost-effective, and scalable SERS substrate offers significant potential for practical applications in environmental monitoring, food safety, and on-site chemical detection systems. Future research will focus on optimizing the fabrication process to expand the detection range and improve performance under more complex environmental conditions. Additionally, integrating this platform with portable Raman devices could pave the way for real-world deployment in field analysis.

Supplementary Materials

The following supporting information can be downloaded at: https://www.mdpi.com/article/10.3390/chemosensors13030101/s1, Figure S1: SEM with the EDS mapping image of Ag/cellulose SERS substrate of 3 major elements C, Ag and O of the substrate, the Pt is used as coating materials to enhance SEM resolution; Figure S2: EDS spectroscopy of AgNPs/cellulose SERS substrate; Figure S3: Comparison between Raman spectra of liquid BT and the self-assembly monolayer of BT on the AgNPs/cellulolse SERS substrate; Figure S4: PC1, PC2 and PC3 loading plot; Table S1: EDS analysis of AgNPs/cellulose SERS substrate.

Author Contributions

Conceptualization, B.-T.T. and I.Y.; data curation, B.-T.T., S.K.N., D.K. and I.Y.; formal analysis, B.-T.T., S.K.N. and I.Y.; investigation, B.-T.T., S.K.N. and I.Y.; methodology, B.-T.T., S.K.N., D.K. and I.Y.; software, B.-T.T., H.-Q.N., J.L. and I.Y., visualization, B.-T.T., S.K.N., D.K., H.-Q.N. and I.Y.; writing-original draft, B.-T.T. and I.Y.; writing-review and editing, B.-T.T., S.K.N., D.K., H.-Q.N., Y.S. and I.Y.; funding acquisition, I.Y.; supervision, I.Y. All authors have read and agreed to the published version of the manuscript.

Funding

This work was supported by the research fund of Chungnam National University.

Data Availability Statement

Data available on request.

Conflicts of Interest

The authors declare no conflicts of interest.

Abbreviations

The following abbreviations are used in this manuscript:
SERSSurface-enhanced Raman scattering
UVCUltraviolet C
NPNanoparticle
EFEnhancement factor
PCAPrincipal component analysis
BTBenzenethiol
HTHexanethiol
PTPropanethiol
RSDRelative standard deviation

References

  1. Langer, J.; Jimenez De Aberasturi, D.; Aizpurua, J.; Alvarez-Puebla, R.A.; Auguié, B.; Baumberg, J.J.; Bazan, G.C.; Bell, S.E.J.; Boisen, A.; Brolo, A.G.; et al. Present and Future of Surface-Enhanced Raman Scattering. Acs Nano 2020, 14, 28–117. [Google Scholar] [CrossRef] [PubMed]
  2. Ma, H.; Pan, S.-Q.; Wang, W.-L.; Yue, X.; Xi, X.-H.; Yan, S.; Wu, D.-Y.; Wang, X.; Liu, G.; Ren, B. Surface-Enhanced Raman Spectroscopy: Current Understanding, Challenges, and Opportunities. Acs Nano 2024, 18, 14000–14019. [Google Scholar] [CrossRef] [PubMed]
  3. Dieringer, J.A.; Mcfarland, A.D.; Shah, N.C.; Stuart, D.A.; Whitney, A.V.; Yonzon, C.R.; Young, M.A.; Zhang, X.; Van Duyne, R.P. Introductory Lecture Surface enhanced Raman spectroscopy: New materials, concepts, characterization tools, and applications. Faraday Discuss. 2006, 132, 9–26. [Google Scholar] [CrossRef] [PubMed]
  4. Shiohara, A.; Wang, Y.; Liz-Marzán, L.M. Recent approaches toward creation of hot spots for SERS detection. J. Photochem. Photobiol. C Photochem. Rev. 2014, 21, 2–25. [Google Scholar] [CrossRef]
  5. Kang, T.; Yoo, S.M.; Yoon, I.; Lee, S.Y.; Kim, B. Patterned Multiplex Pathogen DNA Detection by Au Particle-on-Wire SERS Sensor. Nano Lett. 2010, 10, 1189–1193. [Google Scholar] [CrossRef]
  6. Eom, G.; Kim, H.; Hwang, A.; Son, H.-Y.; Choi, Y.; Moon, J.; Kim, D.; Lee, M.; Lim, E.-K.; Jeong, J.; et al. Nanogap-Rich Au Nanowire SERS Sensor for Ultrasensitive Telomerase Activity Detection: Application to Gastric and Breast Cancer Tissues Diagnosis. Adv. Funct. Mater. 2017, 27, 1701832. [Google Scholar] [CrossRef]
  7. Abu Bakar, N.; Shapter, J.G. Silver nanostar films for surface-enhanced Raman spectroscopy (SERS) of the pesticide imidacloprid. Heliyon 2023, 9, e14686. [Google Scholar] [CrossRef]
  8. Lu, J.; Cai, Z.; Zou, Y.; Wu, D.; Wang, A.; Chang, J.; Wang, F.; Tian, Z.; Liu, G. Silver Nanoparticle-Based Surface-Enhanced Raman Spectroscopy for the Rapid and Selective Detection of Trace Tropane Alkaloids in Food. ACS Appl. Nano Mater. 2019, 2, 6592–6601. [Google Scholar] [CrossRef]
  9. Taylor, R.W.; Esteban, R.; Mahajan, S.; Aizpurua, J.; Baumberg, J.J. Optimizing SERS from Gold Nanoparticle Clusters: Addressing the Near Field by an Embedded Chain Plasmon Model. J. Phys. Chem. C 2016, 120, 10512–10522. [Google Scholar] [CrossRef]
  10. Park, S.; Lee, J.; Ko, H. Transparent and Flexible Surface-Enhanced Raman Scattering (SERS) Sensors Based on Gold Nanostar Arrays Embedded in Silicon Rubber Film. Acs Appl. Mater. Interfaces 2017, 9, 44088–44095. [Google Scholar] [CrossRef]
  11. Yoon, I.; Kang, T.; Choi, W.; Kim, J.; Yoo, Y.; Joo, S.-W.; Park, Q.H.; Ihee, H.; Kim, B. Single Nanowire on a Film as an Efficient SERS-Active Platform. J. Am. Chem. Soc. 2009, 131, 758–762. [Google Scholar] [CrossRef] [PubMed]
  12. Díez, A.G.; Rincón-Iglesias, M.; Lanceros-Méndez, S.; Reguera, J.; Lizundia, E. Multicomponent magnetic nanoparticle engineering: The role of structure-property relationship in advanced applications. Mater. Today Chem. 2022, 26, 101220. [Google Scholar] [CrossRef]
  13. Mercadal, P.A.; Encina, E.R.; Coronado, E.A. Colloidal SERS Substrate for the Ultrasensitive Detection of Biotinylated Antibodies Based on Near-Field Gradient within the Gap of Au Nanoparticle Dimers. J. Phys. Chem. C 2019, 123, 23577–23585. [Google Scholar] [CrossRef]
  14. Zeng, F.; Duan, W.; Zhu, B.; Mu, T.; Zhu, L.; Guo, J.; Ma, X. Paper-Based Versatile Surface-Enhanced Raman Spectroscopy Chip with Smartphone-Based Raman Analyzer for Point-of-Care Application. Anal. Chem. 2019, 91, 1064–1070. [Google Scholar] [CrossRef]
  15. Zhao, P.; Liu, H.; Zhang, L.; Zhu, P.; Ge, S.; Yu, J. Paper-Based SERS Sensing Platform Based on 3D Silver Dendrites and Molecularly Imprinted Identifier Sandwich Hybrid for Neonicotinoid Quantification. ACS Appl. Mater. Interfaces 2020, 12, 8845–8854. [Google Scholar] [CrossRef] [PubMed]
  16. Trinh, B.-T.; Akter, R.; Cho, H.; Omelianovych, O.; Jo, K.; Kim, H.; Kang, T.; Nguyen, H.-Q.; Lee, J.; Seo, K.; et al. Rapid and sensitive melamine detection via paper-based surface-enhanced Raman scattering substrate: Plasma-assisted in situ growth of closely packed gold nanoparticles on cellulose paper. Appl. Surf. Sci. Adv. 2025, 26, 100717. [Google Scholar] [CrossRef]
  17. Golubewa, L.; Klimovich, A.; Timoshchenko, I.; Padrez, Y.; Fetisova, M.; Rehman, H.; Karvinen, P.; Selskis, A.; AdomavičiūTė-Grabusovė, S.; Matulaitienė, I.; et al. Stable and Reusable Lace-like Black Silicon Nanostructures Coated with Nanometer-Thick Gold Films for SERS-Based Sensing. ACS Appl. Nano Mater. 2023, 6, 4770–4781. [Google Scholar] [CrossRef]
  18. Pham, X.-H.; Seong, B.; Bock, S.; Hahm, E.; Huynh, K.-H.; Kim, Y.-H.; Kim, W.; Kim, J.; Kim, D.-E.; Jun, B.-H. Nonenzymatic Hydrogen Peroxide Detection Using Surface-Enhanced Raman Scattering of Gold–Silver Core–Shell-Assembled Silica Nanostructures. Nanomaterials 2021, 11, 2748. [Google Scholar] [CrossRef]
  19. Tarannum, N.; Khatoon, S.; Yadav, A.; Yadav, A.K. SERS-based molecularly imprinted polymer sensor for highly sensitive norfloxacin detection. J. Food Compos. Anal. 2023, 119, 105281. [Google Scholar] [CrossRef]
  20. Kim, E.J.; Kim, H.; Park, E.; Kim, T.; Chung, D.R.; Choi, Y.-M.; Kang, M. Paper-Based Multiplex Surface-Enhanced Raman Scattering Detection Using Polymerase Chain Reaction Probe Codification. Anal. Chem. 2021, 93, 3677–3685. [Google Scholar] [CrossRef]
  21. Yadav, A.; Yadav, A.K.; Tarannum, N.; Kumar, D. Paper-Based Flexible Nanoparticle Hybrid Substrate for Qualitative and Quantitative Analysis of Melamine in Powder Milk by SERS. ACS Omega 2024, 9, 2687–2695. [Google Scholar] [CrossRef] [PubMed]
  22. Kim, W.; Lee, S.H.; Kim, J.H.; Ahn, Y.J.; Kim, Y.-H.; Yu, J.S.; Choi, S. Paper-Based Surface-Enhanced Raman Spectroscopy for Diagnosing Prenatal Diseases in Women. Acs Nano 2018, 12, 7100–7108. [Google Scholar] [CrossRef] [PubMed]
  23. Kang, Y.; Kim, H.J.; Lee, S.H.; Noh, H. Paper-Based Substrate for a Surface-Enhanced Raman Spectroscopy Biosensing Platform—A Silver/Chitosan Nanocomposite Approach. Biosensors 2022, 12, 266. [Google Scholar] [CrossRef]
  24. Trinh, B.T.; Cho, H.; Lee, D.; Omelianovych, O.; Kim, T.; Nguyen, S.K.; Choi, H.-S.; Kim, H.; Yoon, I. Dual-Functional Solar-to-Steam Generation and SERS Detection Substrate Based on Plasmonic Nanostructure. Nanomaterials 2023, 13, 1003. [Google Scholar] [CrossRef] [PubMed]
  25. Khinevich, N.; Bandarenka, H.; Zavatski, S.; Girel, K.; Tamulevičienė, A.; Tamulevičius, T.; Tamulevičius, S. Porous silicon—A versatile platform for mass-production of ultrasensitive SERS-active substrates. Microporous Mesoporous Mater. 2021, 323, 111204. [Google Scholar] [CrossRef]
  26. Pham, X.-H.; Hahm, E.; Kang, E.; Ha, Y.N.; Lee, S.H.; Rho, W.-Y.; Lee, Y.-S.; Jeong, D.H.; Jun, B.-H. Gold-silver bimetallic nanoparticles with a Raman labeling chemical assembled on silica nanoparticles as an internal-standard-containing nanoprobe. J. Alloys Compd. 2019, 779, 360–366. [Google Scholar] [CrossRef]
  27. Biggs, K.B.; Camden, J.P.; Anker, J.N.; Duyne, R.P.V. Surface-Enhanced Raman Spectroscopy of Benzenethiol Adsorbed from the Gas Phase onto Silver Film over Nanosphere Surfaces: Determination of the Sticking Probability and Detection Limit Time. J. Phys. Chem. A 2009, 113, 4581–4586. [Google Scholar] [CrossRef]
  28. Kim, H.; Trinh, B.T.; Kim, K.H.; Moon, J.; Kang, H.; Jo, K.; Akter, R.; Jeong, J.; Lim, E.-K.; Jung, J.; et al. Au@ZIF-8 SERS paper for food spoilage detection. Biosens. Bioelectron. 2021, 179, 113063. [Google Scholar] [CrossRef]
  29. Lafuente, M.; Sanz, D.; Urbiztondo, M.; Santamaría, J.; Pina, M.P.; Mallada, R. Gas phase detection of chemical warfare agents CWAs with portable Raman. J. Hazard. Mater. 2020, 384, 121279. [Google Scholar] [CrossRef]
  30. Sun, J.; Zhang, Z.; Li, H.; Yin, H.; Hao, P.; Dai, X.; Jiang, K.; Liu, C.; Zhang, T.; Yin, J.; et al. Ultrasensitive SERS Analysis of Liquid and Gaseous Putrescine and Cadaverine by a 3D-Rosettelike Nanostructure-Decorated Flexible Porous Substrate. Anal. Chem. 2022, 94, 5273–5283. [Google Scholar] [CrossRef]
  31. Lafuente, M.; Pellejero, I.; Sebastián, V.; Urbiztondo, M.A.; Mallada, R.; Pina, M.P.; Santamaría, J. Highly sensitive SERS quantification of organophosphorous chemical warfare agents: A major step towards the real time sensing in the gas phase. Sens. Actuators B Chem. 2018, 267, 457–466. [Google Scholar] [CrossRef]
  32. Lafuente, M.; Almazán, F.; Bernad, E.; Urbiztondo, M.A.; Santamaría, J.; Mallada, R.; Pina, M.P. SERS Detection of Neurotoxic Agents in Gas Phase Using Microfluidic Chips Containing Gold-Mesoporous Silica as Plasmonic-Sorbent. In Proceedings of the 2019 20th International Conference on Solid-State Sensors, Actuators and Microsystems & Eurosensors XXXIII (TRANSDUCERS & EUROSENSORS XXXIII), Berlin, Germany, 23–27 June 2019; pp. 1313–1316. [Google Scholar] [CrossRef]
  33. Lafuente, M.; De Marchi, S.; Urbiztondo, M.; Pastoriza-Santos, I.; Pérez-Juste, I.; Santamaría, J.; Mallada, R.; Pina, M. Plasmonic MOF Thin Films with Raman Internal Standard for Fast and Ultrasensitive SERS Detection of Chemical Warfare Agents in Ambient Air. ACS Sens. 2021, 6, 2241–2251. [Google Scholar] [CrossRef] [PubMed]
  34. Hou, A.; Feng, G.; Zhuo, J.; Sun, G. UV Light-Induced Generation of Reactive Oxygen Species and Antimicrobial Properties of Cellulose Fabric Modified by 3,3′,4,4′-Benzophenone Tetracarboxylic Acid. Acs Appl. Mater. Interfaces 2015, 7, 27918–27924. [Google Scholar] [CrossRef]
  35. Rehan, M.; Barhoum, A.; Van Assche, G.; Dufresne, A.; Gätjen, L.; Wilken, R. Towards multifunctional cellulosic fabric: UV photo-reduction and in-situ synthesis of silver nanoparticles into cellulose fabrics. Int. J. Biol. Macromol. 2017, 98, 877–886. [Google Scholar] [CrossRef] [PubMed]
  36. Oh, Y.-J.; Jeong, K.-H. Glass Nanopillar Arrays with Nanogap-Rich Silver Nanoislands for Highly Intense Surface Enhanced Raman Scattering. Adv. Mater. 2012, 24, 2234–2237. [Google Scholar] [CrossRef]
  37. Cha, H.; Kim, H.; Joung, Y.; Kang, H.; Moon, J.; Jang, H.; Park, S.; Kwon, H.-J.; Lee, I.-C.; Kim, S.; et al. Surface-enhanced Raman scattering-based immunoassay for severe acute respiratory syndrome coronavirus 2. Biosens. Bioelectron. 2022, 202, 114008. [Google Scholar] [CrossRef]
Scheme 1. The fabrication method of AgNPs/cellulose paper using UV-C reduction and SERS sensing process. The graph showed SERS spectra of BT (blue line), HT (red line) and PT (black line) in vapor-phase.
Chemosensors 13 00101 sch001
Figure 1. (A) Optical image of the AgNPs/cellulose SERS substrate after UV-C reduction. The scale bar denoted 5 mm. (B,C) SEM images of AgNPs/cellulose SERS substrate prepare with the Ag+ precursor of 1 M and UV reduction time of 2 h. The scale bars denoted 20 µm in (B) and 10 µm in (C). (D) TEM image of AgNPs/cellulose SERS substrate prepare with the Ag+ precursor of 1 M and UV reduction time of 2 h. The scale bar denoted 20 nm. (E) Extinction spectra in wavelength range (λ = 350 to 1300 nm) of the AgNPs/cellulose SERS substrate with different Ag+ concentration loading.
Chemosensors 13 00101 g001
Figure 2. (A) SERS spectra of BT monolayer on the AgNPs/cellulose SERS substrate fabricated with various concentration of Ag+ precursor solution, the UV reduction time were kept at 2 h. (B) SERS spectra of BT monolayer on the AgNPs/cellulose SERS substrate fabricated with various UV reduction time, the concentration of Ag+ precursor solution were kept at 1.0 M. (C) SERS spectra of BT at various concentrations from 100 µM to 1 nM, obtained with AuNPs/cellulose substrate. (D) Calibration plot of SERS intensity of B with peak at 1071 cm−1.
Chemosensors 13 00101 g002
Figure 3. (A) Representative SERS spectra of BT monolayer, obtained in random locations on the AgNPs/cellulose substrate. (B) SERS intensity of peak at 1071 cm−1, from random locations figure (A). (C) SERS intensity of the peak at 1071 cm−1 of BT monolayer spectra on 20 different AgNPs/cellulose substrates. (D) SERS intensity of the peak at 1071 cm−1 on the AgNPs/cellulose substrates with long time storage in room condition.
Chemosensors 13 00101 g003
Figure 4. (A) Schematic demonstrated the system using in vapor-phase detection of thiols compose. The ethanolic solution of thiols were kept in the closed petri dish with the AgNPs/cellulose substrate at room temperature of 20 °C. (B) Representative SERS spectra of vapor-phase BT on AgNPs/cellulose substrate with different exposure time. (C) Plots of SERS intensity at peak of 1071 cm−1 with different vapor exposure time.
Chemosensors 13 00101 g004
Figure 5. (A) Representative SERS spectra of vapor-phase BT, HT, PT and the mixture of each couple of thiols obtained via AgNPs/cellulose SERS substrate with the exposure time of 4 h. (B) The principle component analysis (PCA) plots of the first 3 PCs for different vapor-phase detection in (A).
Chemosensors 13 00101 g005
Disclaimer/Publisher’s Note: The statements, opinions and data contained in all publications are solely those of the individual author(s) and contributor(s) and not of MDPI and/or the editor(s). MDPI and/or the editor(s) disclaim responsibility for any injury to people or property resulting from any ideas, methods, instructions or products referred to in the content.

