Abstract
Potassium iodate and potassium iodide are commonly fortified in iodized table salt, which must be continuously monitored to maintain quality. Our study reported an optimized detection method for total iodine in iodized table salt using 0.5 M sodium bisulfite as the reducing agent. The iodized table salt (0.5 g) was dissolved in 0.5 M sodium bisulfite solution prior to injection in ultra-high-performance liquid chromatography (UHPLC) coupled with a diode array detector using a weak anion-exchange column (2.1 mm × 150 mm, 5 μm). Iodide was eluted at 9.92 ± 0.06 min (λ = 223 nm) when an isocratic mobile phase of 1:1 (v/v) methanol/120 mM phosphate buffer mixed with tetrasodium pyrophosphate (pH 3.0) was running at 0.20 mL/min (15 min). Iodide was detected as total iodine from 10.0 to 50.0 mg/kg with a limit of detection (LOD) of 1.2 mg/kg and a limit of quantification (LOQ) of 3.7 mg/kg. The method was validated with relative standard deviations (RSDs) of 4.2%, 0.4%, 1.6%, and 0.8% for accuracy, repeatability, intermediate precision, and robustness, respectively. The determination of total iodine was successful on six (6) samples (n = 3), which recovered 87.2–106.9% of iodate and iodide spike. Thus, this study provides a validated protocol for the determination of total iodine in iodized table salt using 0.5 M sodium bisulfite.
1. Introduction
Since the early 20th century, iodine deficiency disorder (IDD) has been a major problem due to the manifestation of diseases such as goiter or cretinism [1]. However, this was not fully understood until 1819, when chronic goiter was linked to iodine deficiency [2]. Initially, iodine-deficient patients were treated by taking oral iodine tablets [3]. Nowadays, the most common intervention for IDD is the consumption of iodine through an iodine-fortified cooking salt or table salt [4], which eventually formed the basis of the Universal Salt Iodization (USI) program [5,6]. The fortification of iodine in table salt involves adding iodine, typically in the form of potassium iodate and potassium iodide. However, the use of potassium iodide is less common due to its instability [7].
Despite the worldwide implementation of USI, IDD remains a significant public health challenge, especially among pregnant women and children. During pregnancy, insufficient iodine can result in poor health outcomes including congenital hypothyroidism [8] and increased risk of stillbirth [9]. For children, low iodine intake can lead to mental development delay [10], affecting their overall development and educational outcomes. Moreover, geographical factors, such as living in rural areas, often hinder the assessment of adequate levels of iodine due to logistical and infrastructural barriers [11,12]. Therefore, addressing IDD requires continuous monitoring, public awareness, and targeted interventions to ensure that populations receive adequate iodine intake.
Monitoring iodine is crucial to make sure that fortified iodine is consumed within the recommended levels. For instance, Malaysia has implemented an allowable range of iodine in fortified iodized table salt, set within 20 to 40 mg/kg, as stated in the Malaysia Food Regulations 1985. Consistent iodine monitoring is necessary to ensure compliance with the regulation and ultimately prevent IDD.
Currently, the most common and affordable method for iodine level monitoring in iodized table salt is using the titration technique. However, this approach suffers from a highly laborious method, requires a skilled technician, and could encounter human error. Although these can be prevented with an automated titrator, a large sample size could lead to a varying degree of reproducibility and poor robustness of the method. The use of techniques such as inductively coupled plasma mass spectrometry (ICP-MS) would easily solve this problem, but the use of plasma to burn the samples, especially salt samples, could lead to a formation of crystals in the capillary tubing of the system [13,14] and damage the machines used for measurement in the long run.
Alternatively, the use of more common and reliable techniques such as ultra-high-performance liquid chromatography (UHPLC) can be advantageous since UHPLC is more affordable and used by many laboratories. Recently, there has been more widespread usage of non-polar mixed-mode columns with weak anion-exchange functionality [15,16], which allows the separation of ionic compounds such as iodide. For instance, ammonium-based functional groups have weak anion-exchange properties that would interact with negatively charged analytes in the mobile phase at high pH and interact with positively charged analytes at low pH [17].
This study developed and optimized a method for the detection of iodine in table salt using UHPLC with a diode array detector due to the ability of the instrument to have high accuracy, robustness, and great reproducibility, as well as high throughput due to the use of automated sample injection. UHPLC instruments are also more common to have in laboratories compared to other instruments. The objective of this study was to produce a protocol for a method of detecting total iodine in iodized table salt in a sodium bisulfite medium. Sodium bisulfite was used to reduce the iodate form to its iodide form so that it could be detected by the UHPLC system. Moreover, the reduction of iodate into converted iodide would solve the overlapping iodate peak (retention time at 5.21 min, [18]) with the interference baseline of real samples of table salt (observed from 1.90 min to 9.50 min) by converting all iodate into its iodide form so that it can be detected as iodide. However, the effect of sodium bisulfite on the iodide form of table salt also needs to be observed.
2. Materials and Methods
2.1. Chemicals and Reagents
Deionized water (18.2 MΩ grade, Sartorius, Göttingen, Germany) was used throughout this study. All chemicals and reagents were obtained from Sigma-Aldrich (St. Louis, MO, USA). Except for solvents, all other chemicals and reagents used were American Chemical Society (ACS)-grade. This list includes sodium chloride, sodium bisulfite, sodium phosphate monohydrate, sodium pyrophosphate decahydrate, phosphoric acid, potassium iodide, and potassium iodate. Gradient-grade solvents were used for methanol and acetonitrile.
2.2. Instrumentation
This study was performed using an ultra-high-performance liquid chromatography (UHPLC) instrument with a diode array detector (Ultimate 3000, Thermo Scientific, Waltham, MA, USA). The system was paired with the analytical column of Thermo Scientific Acclaim® Mixed-Mode WAX-1, 2.1 mm × 150 mm, with a 5 μm particle size. All chromatographic data were recorded and processed using Chromeleon software, version 7.2.
2.3. Procedures
2.3.1. Chromatographic Conditions
The iodine in iodized salt was determined by the detection of iodide in the samples. The chromatographic condition for iodide detection was performed according to the previously reported studies with minor modification [18,19]. The isocratic conditions of mobile phase A (120 mM sodium phosphate, monobasic pH 3.0) and mobile phase B (methanol) enabled the separation at a 1:1 (v/v) ratio with the flow rate of 0.2 mL/min. The chromatograms were observed at a 223 nm wavelength after 50 μL of sample injection at a 30 °C column temperature. The total run time was 15 min with an observed symmetrical peak of iodide which could be noted at 10.11 min.
2.3.2. Column Flushing
To prolong the lifespan of the column, it was stored in a 1:1 (v/v) ratio of acetonitrile and 150 mM phosphate buffer (pH 3.0) by flushing the system each day, for 30 min at 0.50 mL/min.
2.3.3. Standard Preparation
The standard solutions were prepared by dissolving 0.5 g sodium chloride in a total volume of 10.00 mL which consisted of 2.50 mL of 2 M sodium bisulfite, with a certain volume of 100 mg/L iodide stock and a certain volume of deionized water. For instance, iodide concentrations of 0.5, 1.0, 1.5, 2.0, 2.5, and 3.0 mg/L, required volumes of 0.5, 1.0, 1.5, 2.0, 2.5, and 3.00 mL of 10 mg/L iodide stock, respectively, and were finally diluted with deionized water to the final volume of 10.00 mL.
2.3.4. Sample Preparation
The iodized table salt samples were weighed, and 0.5 g samples were placed in 15 mL tubes. The samples were then dissolved in 2.50 mL of 2 M sodium bisulfite solution and 7.50 mL deionized water for a final volume of 10.00 mL. Then, the sample solution was ready for UHPLC analysis.
2.4. Method Validation
This protocol was validated according to the International Council for Harmonization (ICH) guidelines (validation of analytical procedures). Our study included the validation of accuracy, linearity, limit of detection (LOD), limit of quantification (LOQ), specificity, precision repeatability, intermediate precision, and robustness. This was to ensure the reliability of the method when performed periodically and in different laboratory setups.
2.4.1. Accuracy
Three iodine concentrations, 1.0 mg/L, 1.5 mg/L, and 2.0 mg/L, were tested, and each of the concentrations was injected three times. The relative standard deviation (RSD) was obtained to check the accuracy of the method.
2.4.2. Linearity, LOD, and LOQ
The absorbance response of the iodide signal was studied in terms of the peak area at different total iodine concentrations. The concentrations were 0.50 mg/L, 1.0 mg/L, 1.5 mg/L, 2.0 mg/L, and 2.5 mg/L in 5% (w/v) sodium chloride and 0.5 M sodium bisulfite medium. Each concentration level was repeated in triplicate. The mean value of the peak area was plotted against its respective iodine concentration, forming a regression line. The LOD and LOQ were obtained by the standard deviation (SD) of the y-intercept of a linear response and a slope, which is expressed as follows:
where σ is the SD of the y-intercept of linear response and S is the slope of the calibration curve.
2.4.3. Specificity
The study of specificity was performed by comparing the chromatograms of each component used in the standards, including the injection of a blank of 50% (v/v) mobile phase A and B, the injection of 5% (w/v) sodium chloride, the injection of 5% (w/v) sodium chloride mixed with 0.5 M sodium bisulfite, and the injection of 1.50 mg/L iodide in 5% (w/v) sodium chloride mixed with 0.5 M sodium bisulfite. The chromatograms were then overlayed to see any effect of the solution composition on the detection of iodide.
2.4.4. Precision Repeatability and Intermediate Precision
Seven (7) replicates of iodine at the concentration of 1.0 mg/L, 1.5 mg/L, and 2.0 mg/L were determined to test the RSD of the method’s repeatability in 5% (w/v) sodium chloride and 0.5 M sodium bisulfite medium. This procedure was also repeated on the second day using freshly prepared standard samples to check the intermediate precision’s RSD.
2.4.5. Robustness
Two factors of robustness were investigated, including the column temperature of 40 °C against the default setting of 30 °C and the concentration of sodium bisulfite at 0.25 M against its existing concentration at 0.5 M.
2.5. Sodium Bisulfite Stability Study
Sodium bisulfite was used to convert the iodate form to its iodide form through a reduction reaction. In a 15 mL tube, 2.50 mL of 2 M sodium bisulfite solution was added to dissolve 0.5 g of sodium chloride. Iodate with concentrations of 1.38 mg/L and 3.45 mg/L was prepared by adding 1.38 mL and 3.45 mL of 100 mg/L of iodate stock to the solution, respectively. Finally, deionized water was then added to each of the 15 mL tubes to a final homogeneous volume of 10.00 mL. The prepared solutions were repeated every day for ten (10) days prior to the UHPLC injections using the same 2 M sodium bisulfite stock that was kept refrigerated at 8 °C.
2.6. Sample Spike and Recovery
Individually, 0.5 g of iodized table salt with a pre-determined iodine concentration was placed in a 15 mL tube. Then, 2.50 mL of 2 M sodium bisulfite solution was added to dissolve the sample. Afterward, the samples were spiked with 0.50 mL, 1.00 mL, and 1.50 mL of 10.0 mg/L iodide solution, equivalent to the concentration of 10.0 mg/kg, 20.0 mg/kg, and 30.0 mg/kg of iodine in the samples, respectively. Similarly, for the iodate spike, 0.69 mL, 1.38 mL, and 2.07 mL of 10.0 mg/L iodate solution were added to the samples to reach the equivalent concentration of 10.0 mg/kg, 20.0 mg/kg, and 30.0 mg/kg of iodine in the samples, respectively. Finally, the spiked solutions were topped up with deionized water to the final total volume of 10.00 mL. The spiked samples were then ready for UHPLC analysis.
3. Results
3.1. Method Development
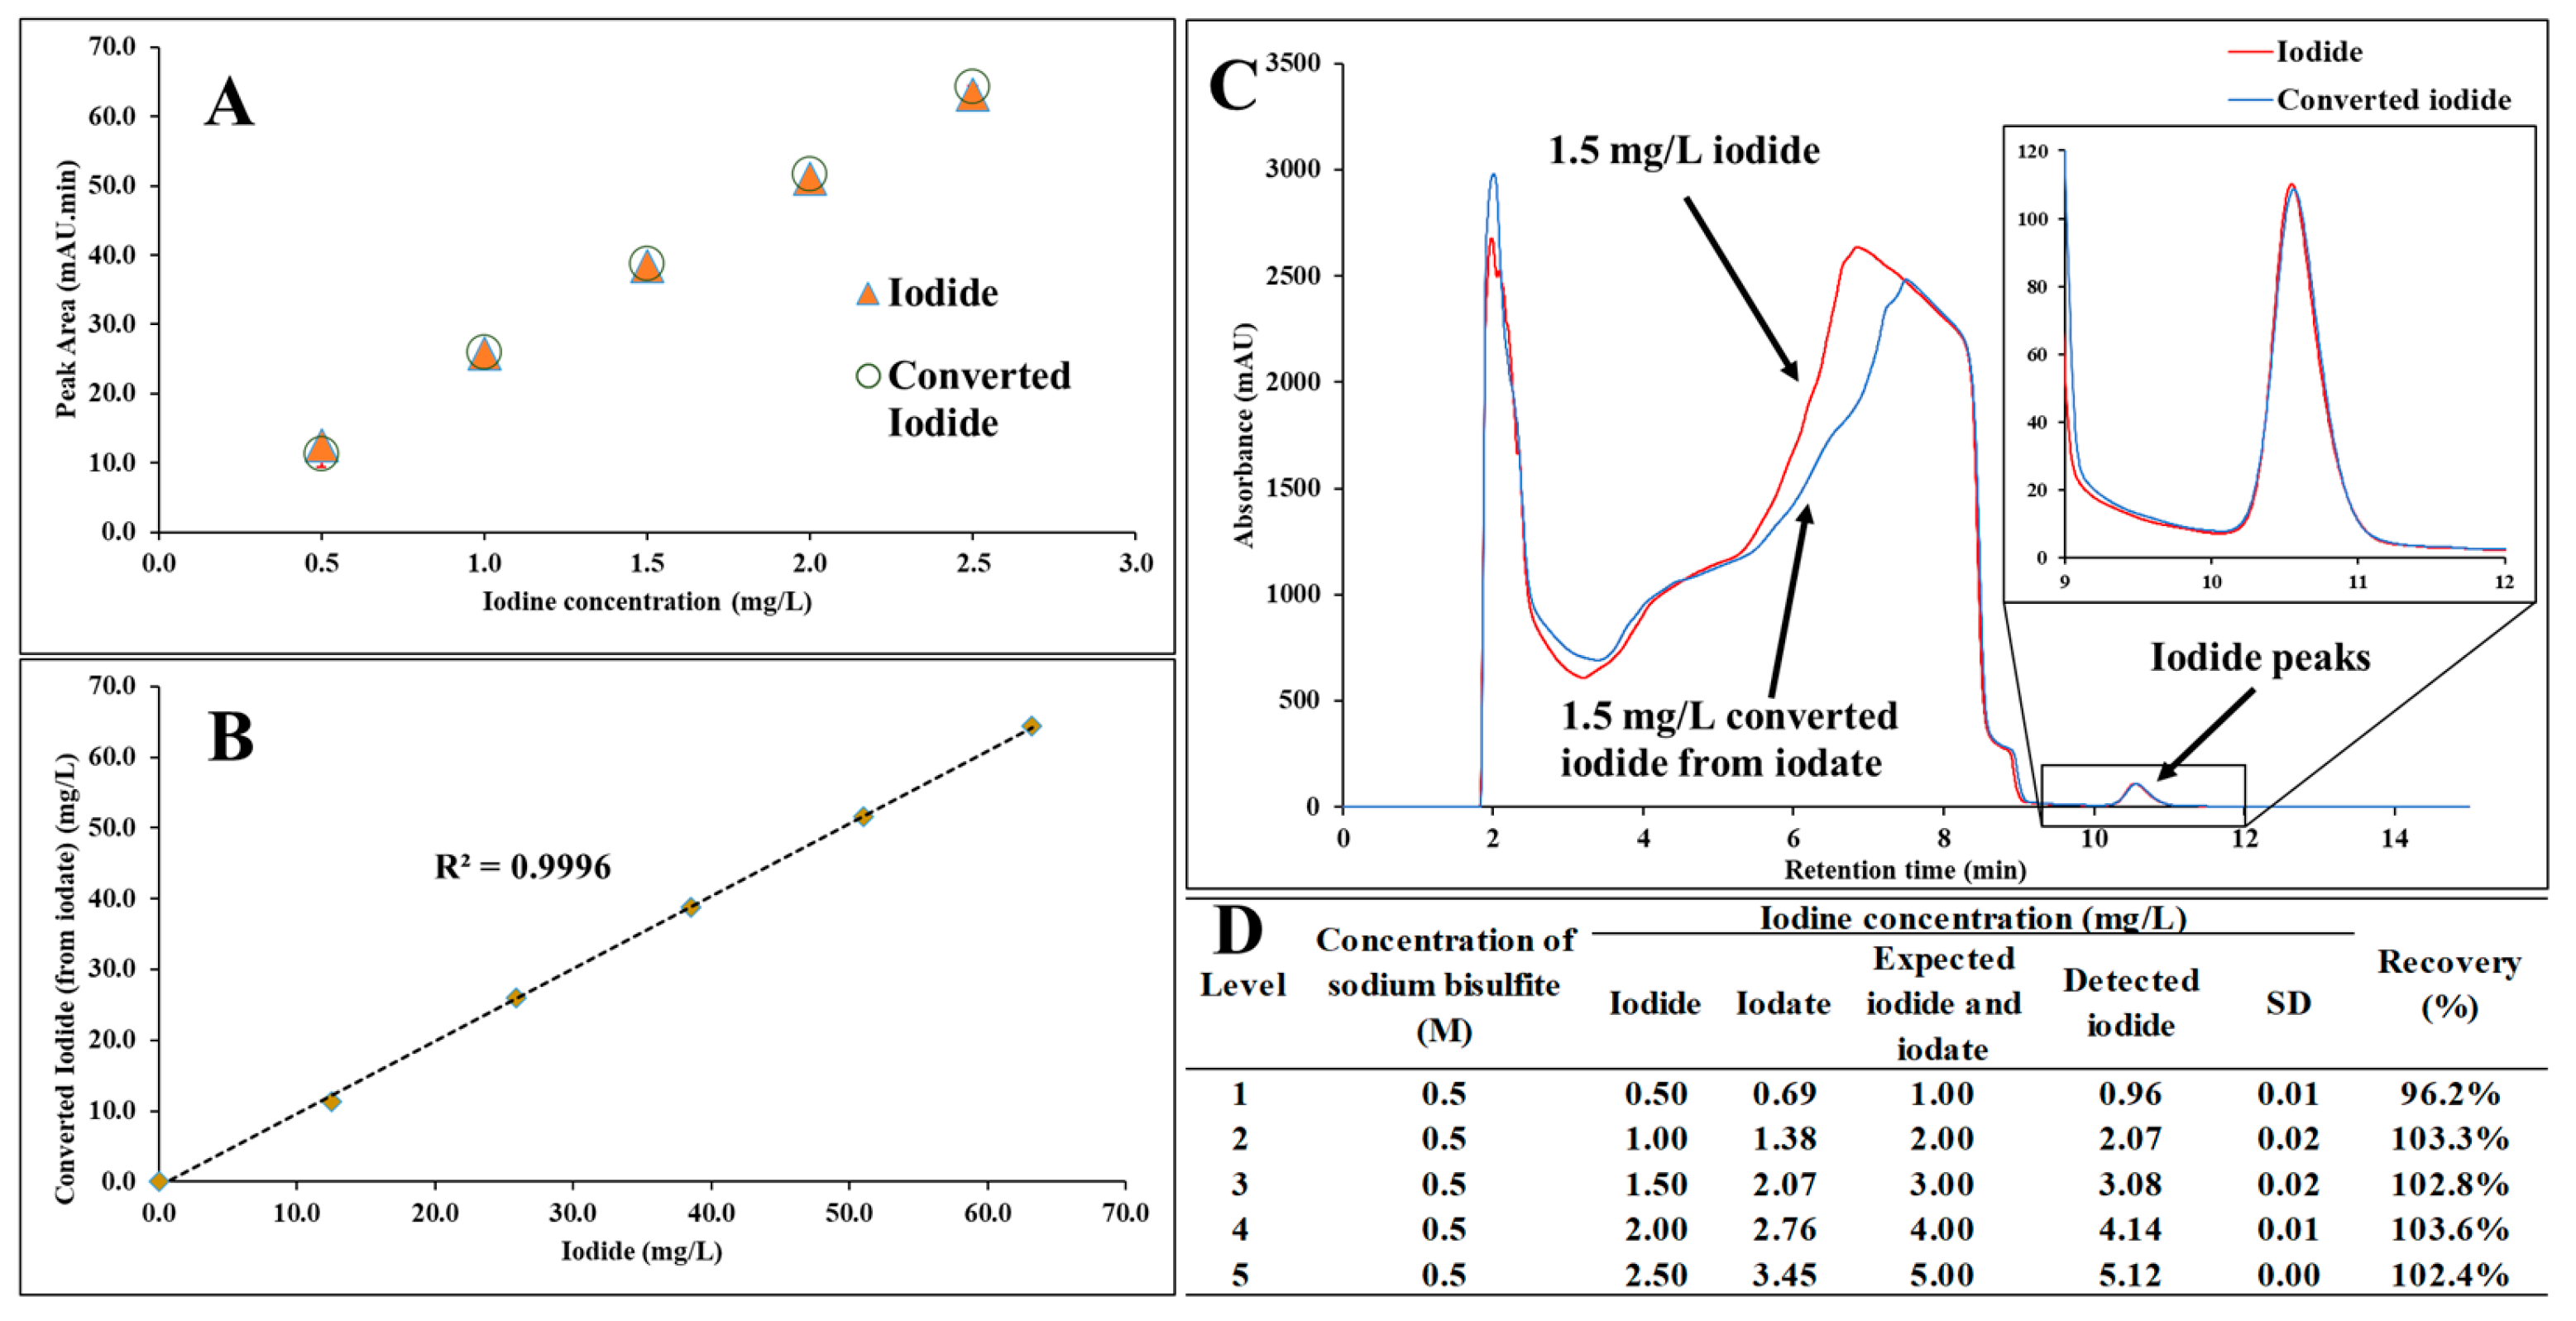
The effect of 0.5 M sodium bisulfite addition to the iodized table salt samples was investigated for the total iodine concentration of 0.5 mg/L to 2.5 mg/L, with respect to both iodide and iodate forms. From here onward, the reduced iodate after its reaction with sodium bisulfite will be denoted as “converted iodide”. It was found that the individual absorbance intensity was similar between iodide and converted iodide (Figure 1A). A linear correlation was observed between iodide and converted iodide at R2 of 0.9996 (Figure 1B). Furthermore, the chromatogram overlay showed similar retention time and peak intensity for both iodide and converted iodide (Figure 1C). Additionally, both iodate and iodide were mixed at equal levels of iodine concentration, in 0.5 M sodium bisulfite medium, from 0.5 mg/L to 2.5 mg/L, and it was found that an excellent recovery was calculated from 96.2% to 103.6% (Figure 1D).
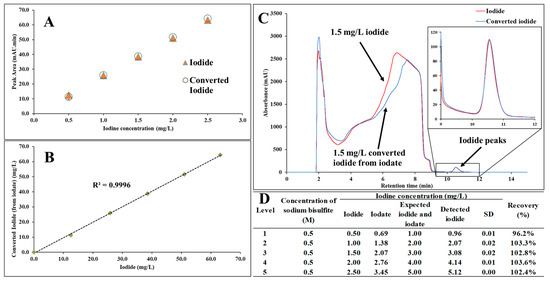
Figure 1.
Development of iodide detection by comparing iodide form and iodate form that was converted to iodide (termed as converted iodide) in 0.5 M sodium bisulfite medium. (A) Comparison of peak area for each level of iodine concentration from iodide against converted iodide from iodate for iodine concentrations of 0.5–2.5 mg/L. (B) A highly correlated graph between converted iodide from iodate versus iodide for iodine concentrations of 0.5–2.5 mg/L resulting in R2 = 0.9996. (C) Overlayed chromatograms of iodide and converted iodide from iodate; both show an iodide peak at 10.52 min with the same absorbance intensity. (D) Detection of iodine concentrations from 0.5 mg/L to 2.5 mg/L with excellent recovery ranging from 96.2% to 103.6%.
3.2. Method Validation
3.2.1. Accuracy
Three iodine concentrations were investigated for their accuracy at 1.0, 1.5, and 2.0 mg/L. The three samples were prepared in 5% (w/v) sodium chloride to mimic the matrix of real samples. It was found that the relative standard deviation (RSD) varied from 3.3% to 4.8% (Table 1), indicating an excellent accuracy.

Table 1.
The tabulated data show a good recovery of three levels of iodine concentration for the accuracy study which averagely recovered from 97.8 ± 4.2%.
3.2.2. Linearity
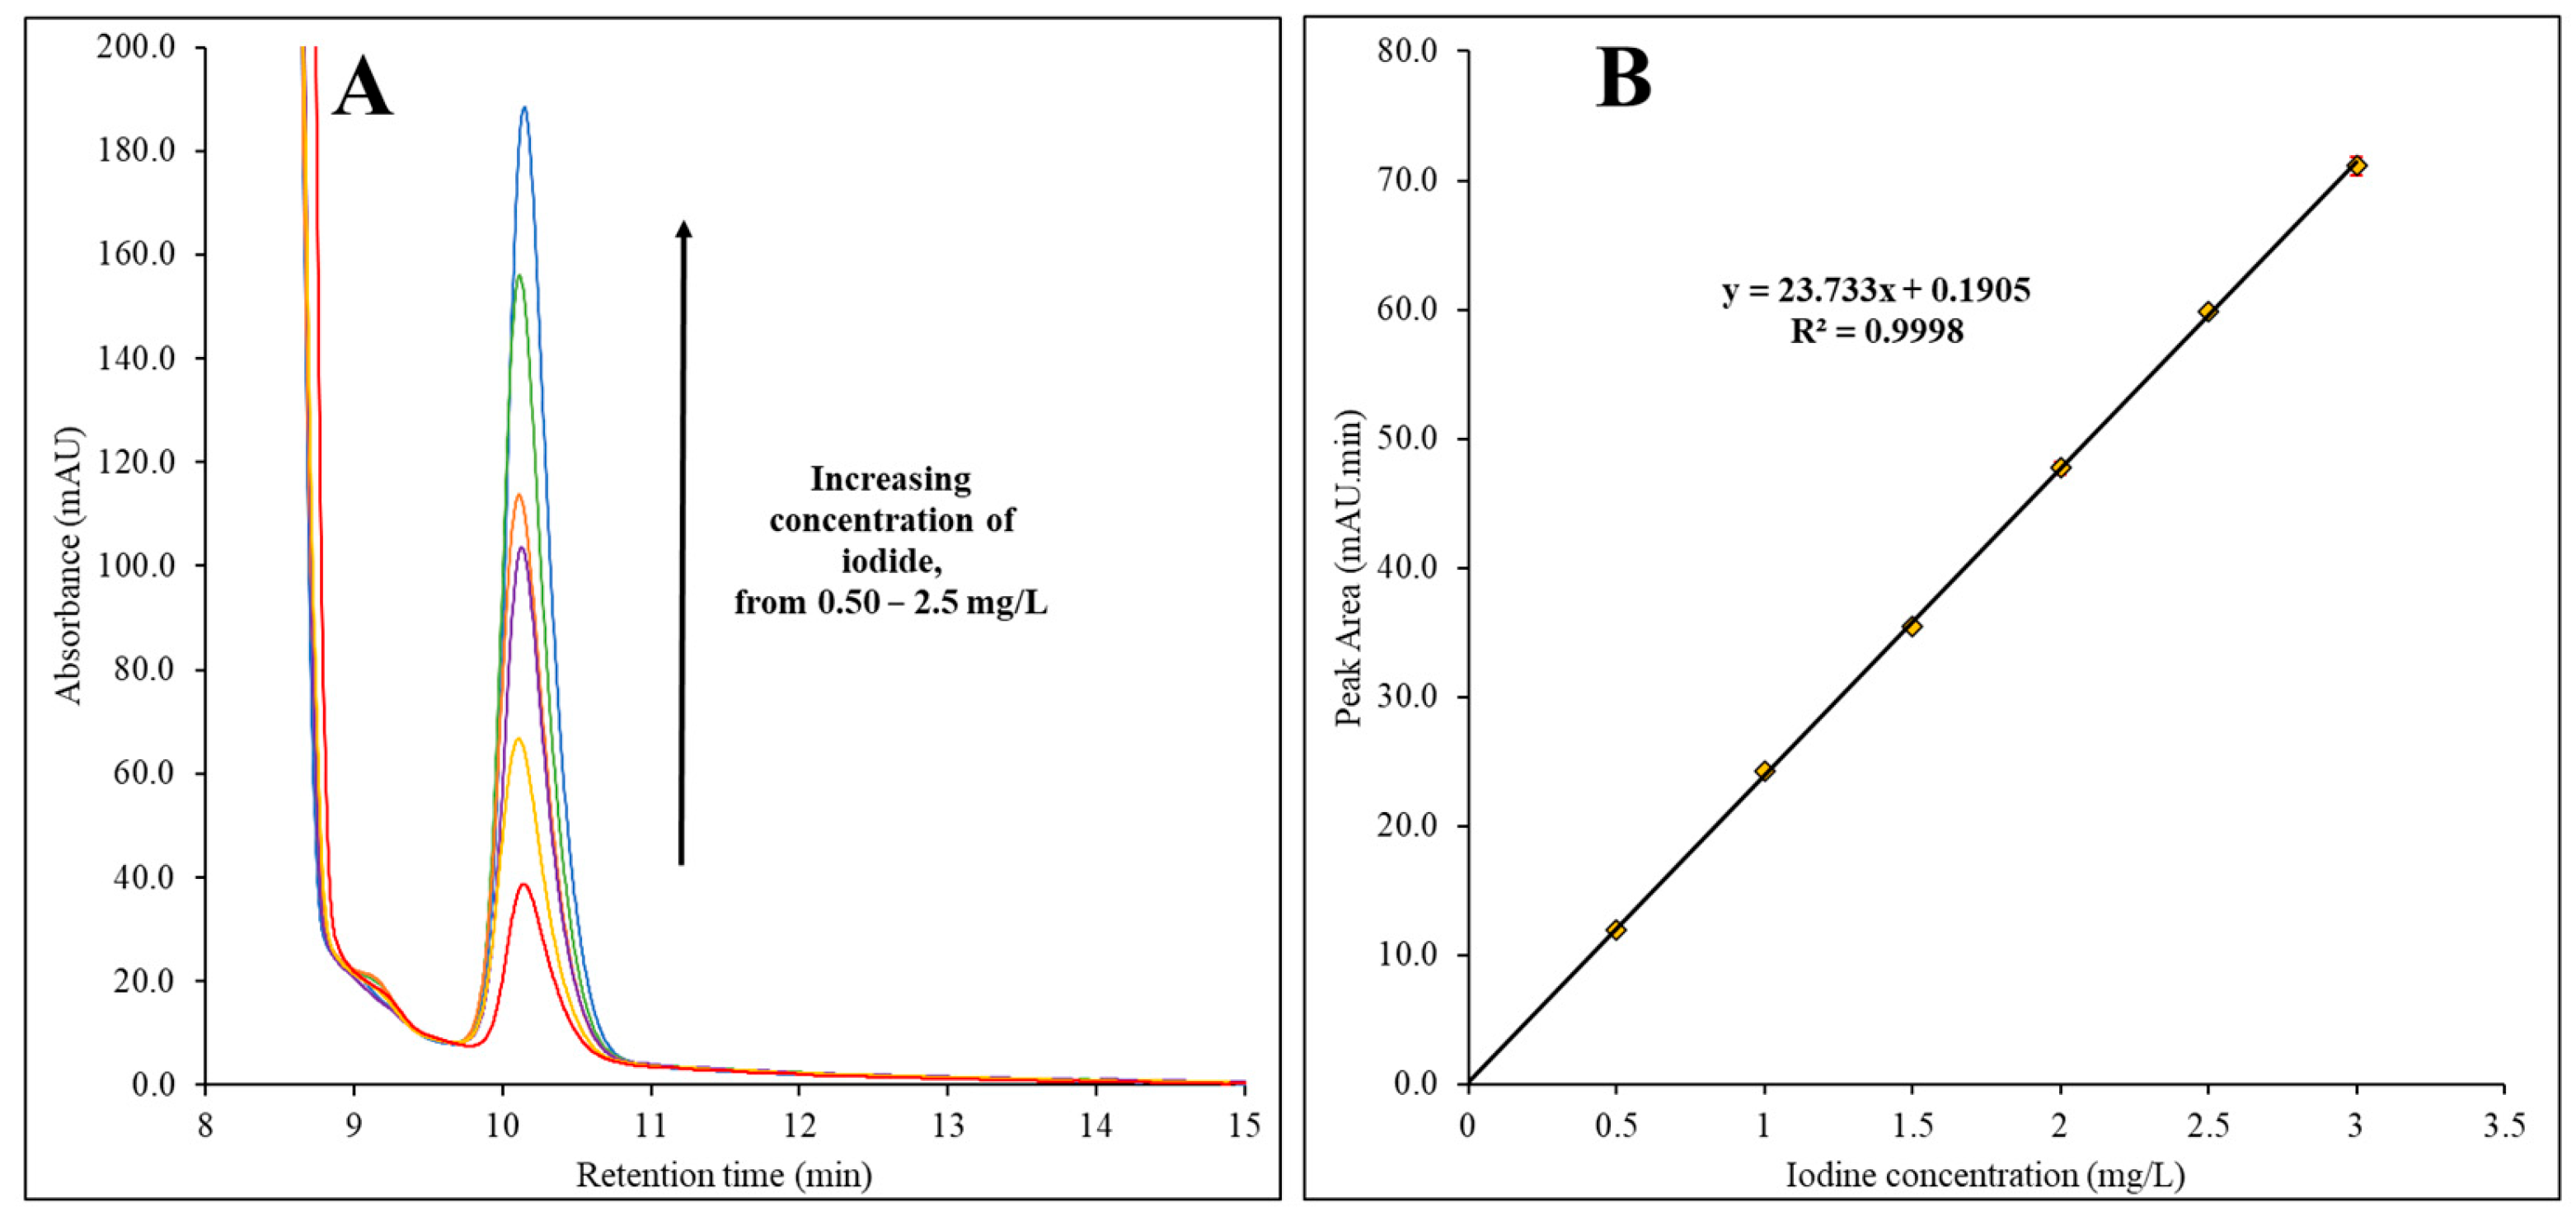
Different concentrations of iodine including 0.50 mg/L, 1.0 mg/L, 1.5 mg/L, 2.0 mg/L, and 2.5 mg/L were analyzed using UHPLC in 0.5 M sodium bisulfite medium (Figure 2). Each of the concentration levels was prepared in triplicate. Based on the observed chromatogram overlay (Figure 2A), the peak intensity of iodide at 10.11 min increased when the concentration increased. It was found that a linear calibration was formed when the peak area was plotted against the iodine concentration, which resulted in an R2 of 0.9998 (Figure 2B). Based on the plotted calibration curve, the calculated limit of detection (LOD) and limit of quantification (LOQ) were iodine concentrations of 0.06 mg/L and 0.18 mg/L, which were equivalent to 1.2 mg/kg and 3.7 mg/kg of total iodine in iodized table salt, respectively.
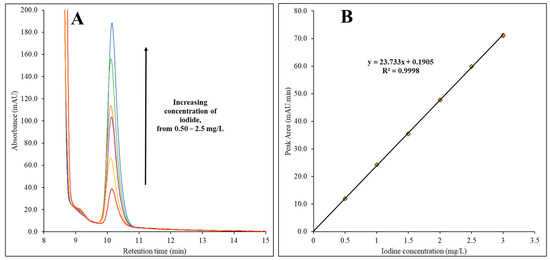
Figure 2.
Investigation of linearity of peak area of absorbance against the concentration of iodide. (A) A consistent retention time was observed for iodide peaks from 0.50 mg/L to 2.5 mg/L. (B) It was shown that the peak area was linearly correlated with iodide concentration from 0.50 to 2.5 mg/L with R2 = 0.9998.
3.2.3. Specificity
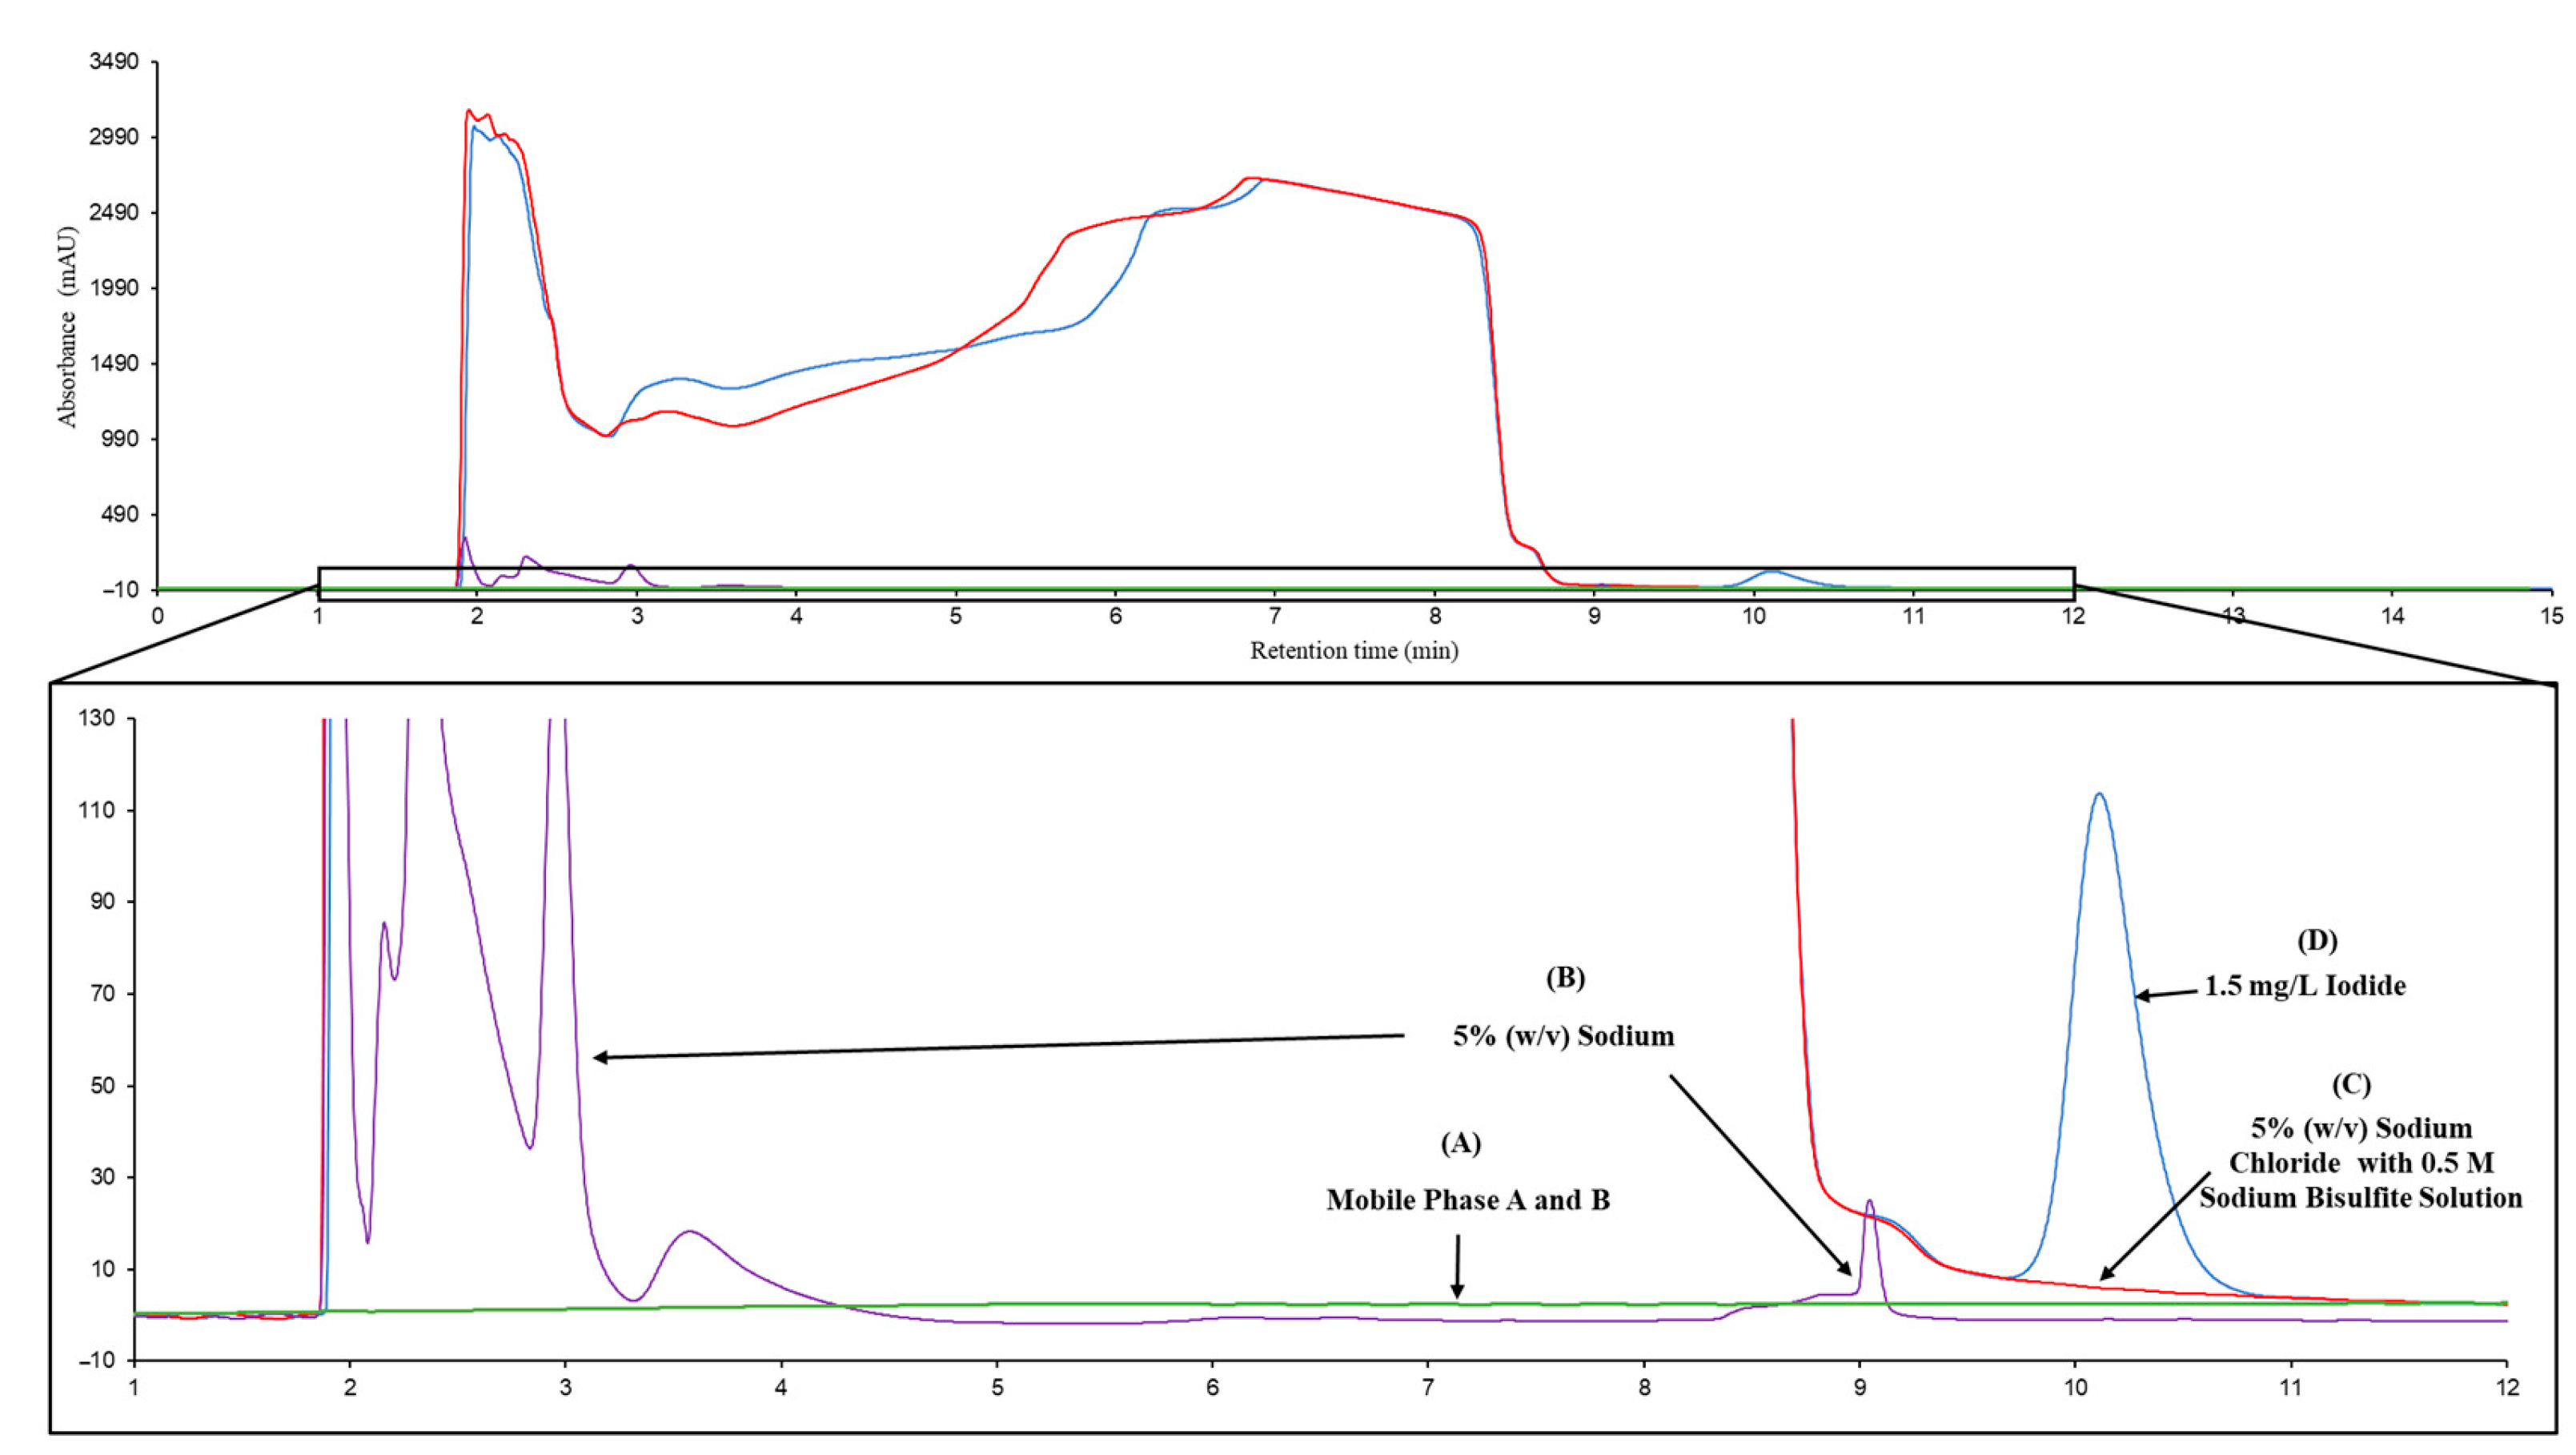
Several sample matrices were studied for the effect of iodide signals in the chromatograms (Figure 3), including (1) a blank of mobile phase A and B at 50% (v/v) (Figure 3A), (2) 5% (w/v) sodium chloride (Figure 3B), (3) 5% (w/v) sodium chloride mixed with 0.5 M sodium bisulfite (Figure 3C), and (4) 1.50 mg/L iodide in 5% (w/v) sodium chloride mixed with 0.5 M sodium bisulfite (Figure 3D). No obvious interference was observed when a blank injection was performed. On the other hand, small foreign peaks were observed in the retention time from 1.90 min to 4.00 min and 9.10 min when 5% (w/v) sodium chloride was injected. Very large and bulky peaks were also observed in the chromatograms of 5% (w/v) sodium chloride mixed with 0.5 M sodium bisulfite and 1.50 mg/L iodide in 5% (w/v) sodium chloride mixed with 0.5 M sodium bisulfite with the retention time between 1.90 min and 9.50 min, indicating the addition of 0.5 M sodium bisulfite in the solution affected the chromatogram.
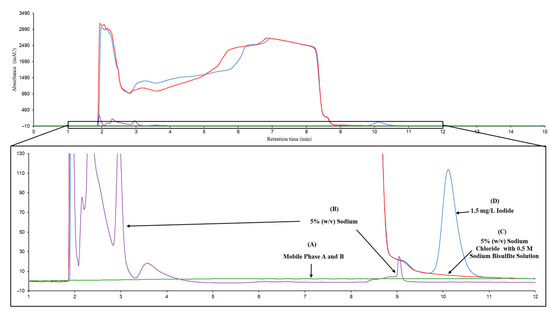
Figure 3.
The overlays of several chromatograms for the study of specificity. Specificity study shows the overlays of chromatograms between (A) mobile phase A and B at 50%:50%, (B) 5% (w/v) sodium chloride solution, (C) 5% (w/v) sodium chloride mixed with 0.5 M sodium bisulfite solutions, and (D) 1.5 mg/L iodide in 5% (w/v) sodium chloride mixed with 0.5 M sodium bisulfite solutions. A very well separated individual peak of iodide was shown at the retention time of 10.11 min.
3.2.4. Precision
The precision study was performed, including repeatability and intermediate precision (Table 2). The study of repeatability was performed by injecting triplicates of each sample at 1.0 mg/L, 1.5 mg/L, and 2.0 mg/L iodine concentrations in 5% (w/v) sodium chloride. Each of the triplicate samples was injected seven (7) times, and the average RSD for 1.0 mg/L, 1.5 mg/L, and 2.0 mg/L iodine concentrations was 0.3%, 0.5%, and 0.4%, respectively. On the other hand, the study of intermediate precision was performed for two (2) different days using 1.0 mg/L, 1.5 mg/L, and 2.0 mg/L iodine concentrations in 5% (w/v) sodium chloride, which was performed in triplicate. It was found that the two (2)-day average RSD for 1.0 mg/L was 1.0%, 1.5 mg/L was 2.0%, and 2.0 mg/L was 1.7%. Overall, the RSD for repeatability and intermediate precision was 0.4% and 1.6%, respectively.
Table 2.
Data compilation of repeatability and intermediate precision study which found an averagely low RSD of 0.4% and 1.6%, respectively.
3.2.5. Robustness
Several different conditions were applied to the method setup, including changing the column temperature to 40 °C and decreasing the concentration of sodium bisulfite by half to 0.25 M (Table 3). The robustness study was performed using 1.0 mg/L, 1.5 mg/L, and 2.0 mg/L iodine concentrations in 5% (w/v) sodium chloride. It was found that the retention time of the iodide peak was changed to 9.28 ± 0.11 min when the column temperature was increased to 40 °C, while a retention time of 10.02 ± 0.01 min was the shifted peak of iodide when 0.25 M sodium bisulfite was used. Nevertheless, the average RSD for the three levels of iodine was 1.2% and 0.8% for a 40 °C column temperature and 0.25 M sodium bisulfite, respectively. It was shown that the overall RSD averaged 0.8%, showing a highly robust method.
Table 3.
Table of RSD at different setting conditions of the method including a different column temperature and a different sodium bisulfite concentration.
3.3. Stability Study for Sodium Bisulfite as Reducing Agent
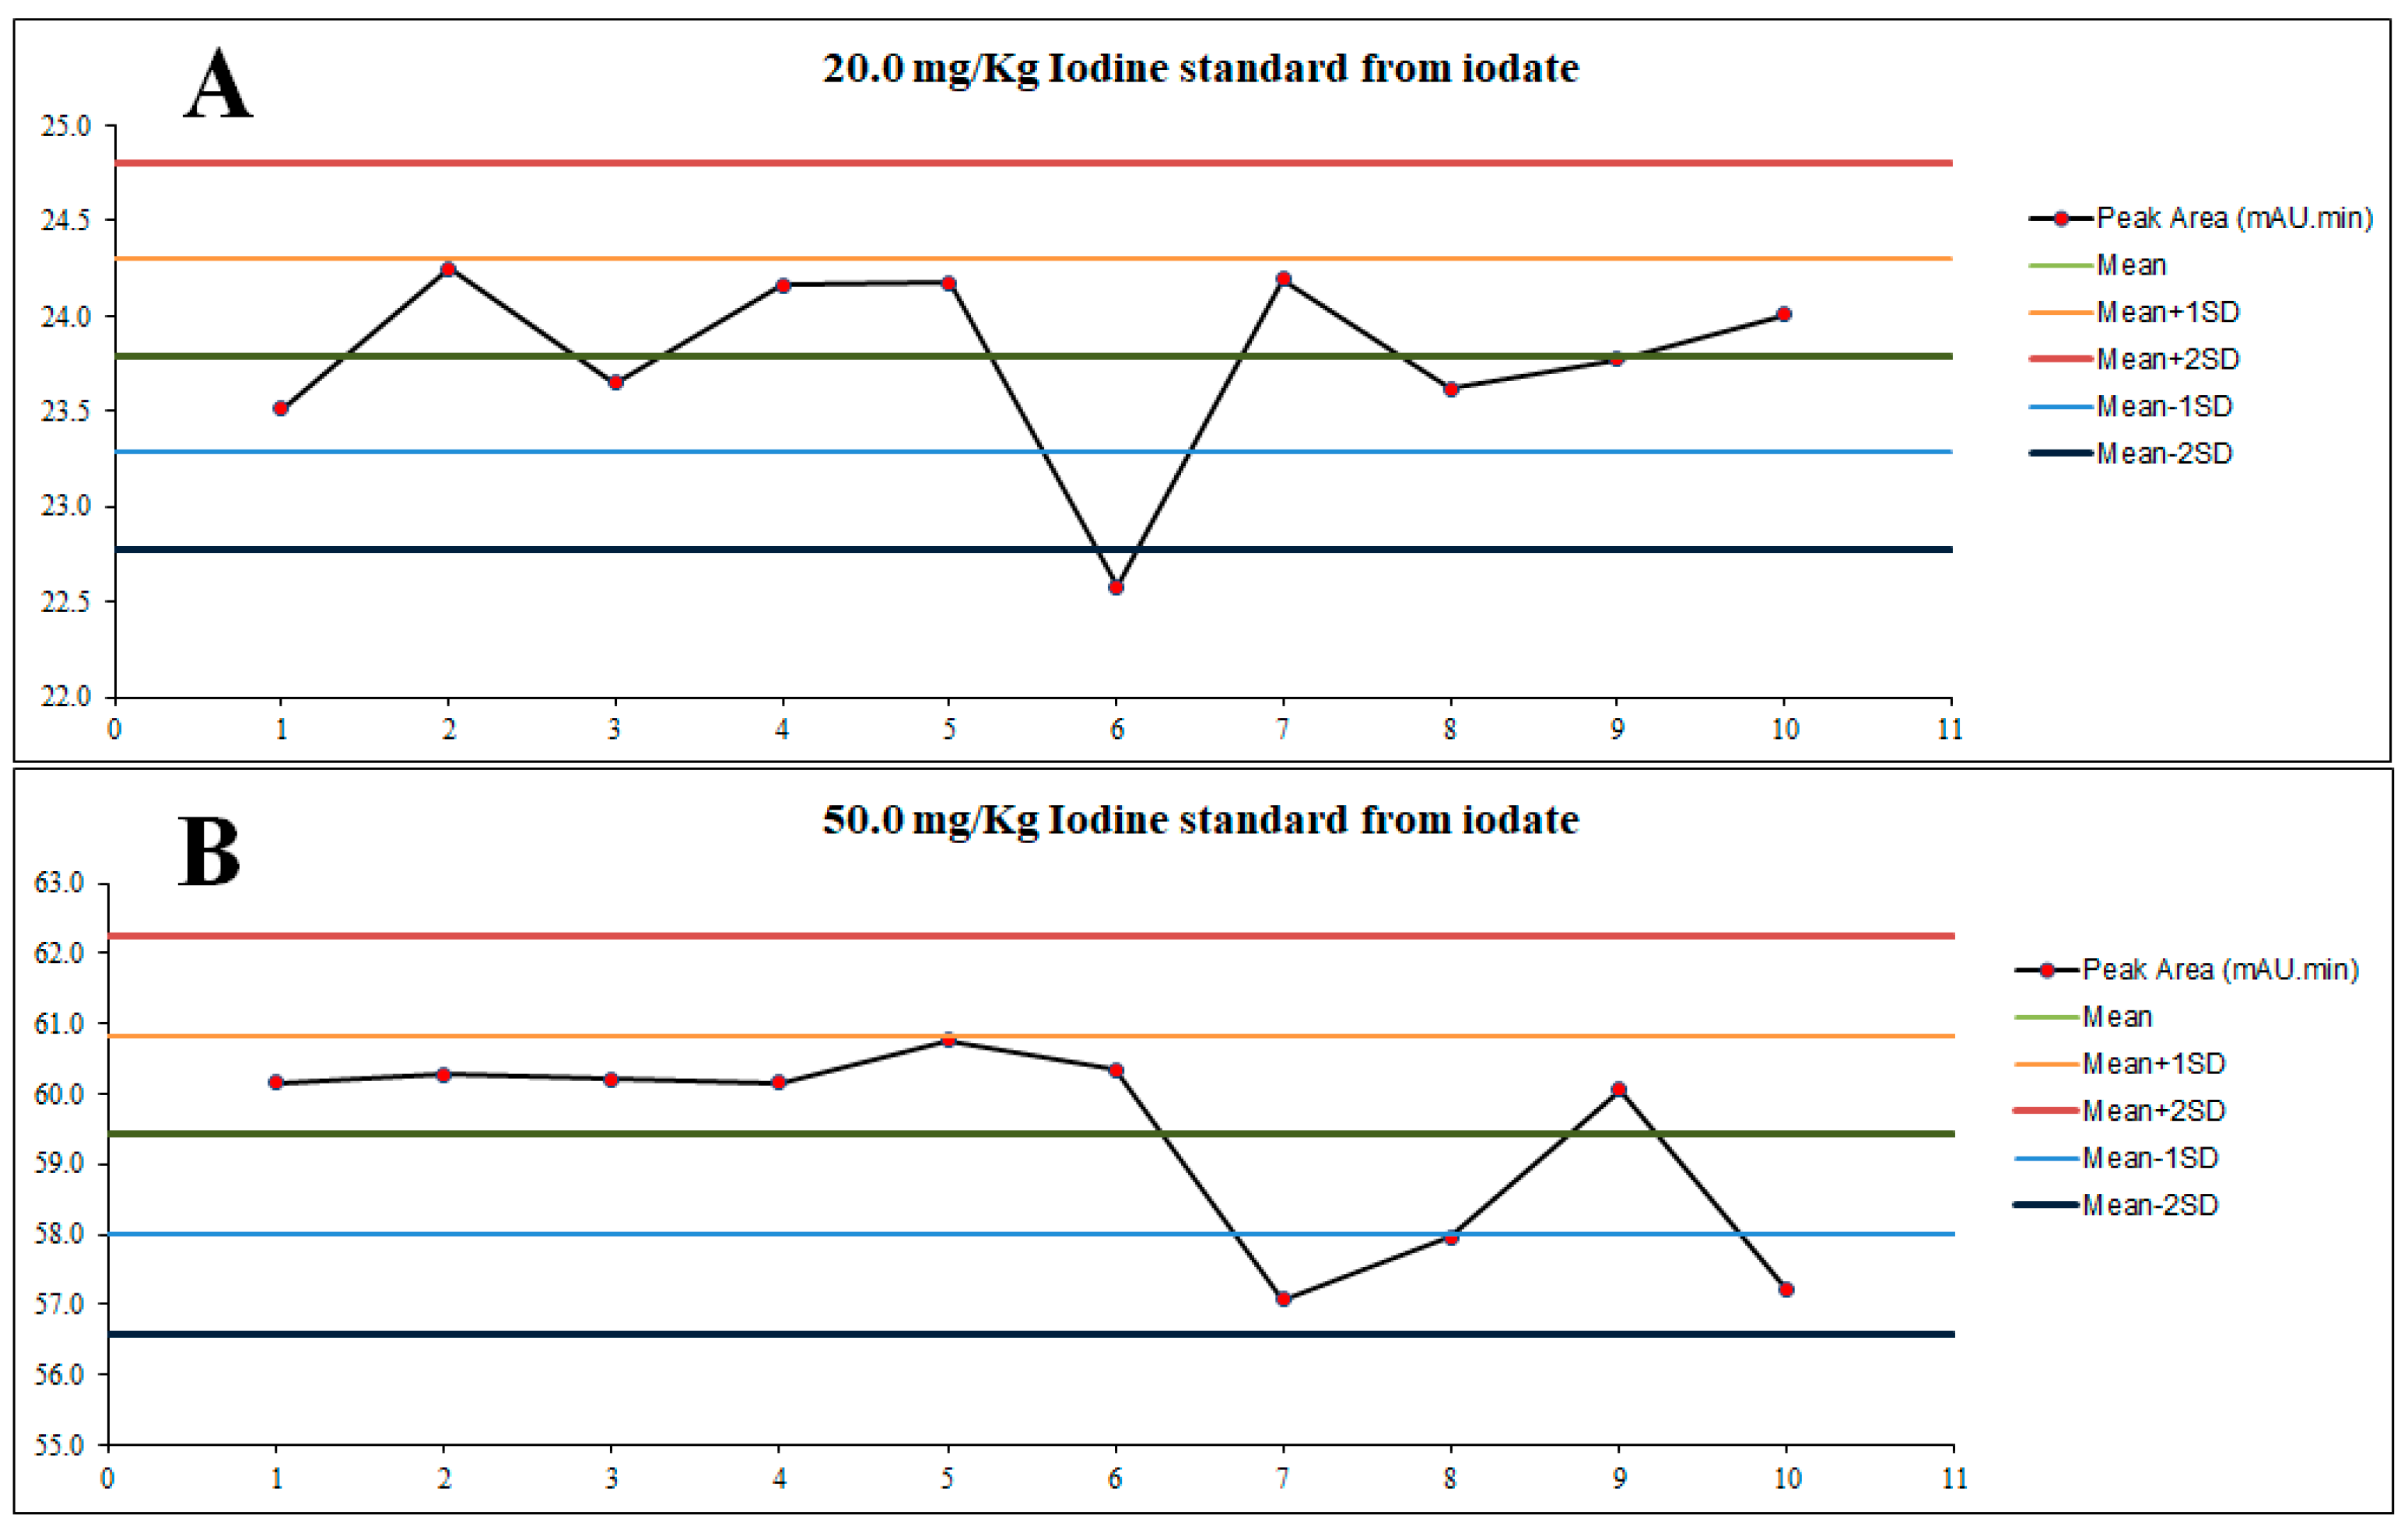
An equivalent sample concentration was prepared using an iodate standard in 5% (w/v) sodium chloride and 0.5 M sodium bisulfite medium at a total iodine concentration of 20.0 mg/kg and 50.0 mg/kg, respectively. The stability of 0.5 M sodium bisulfite was observed based on the peak area produced by the converted iodide (from iodate) at the concentration of 20.0 mg/kg and 50.0 mg/kg of total iodine, respectively, for ten (10) different days. It was found that the peak area remained stable within mean ± 2SD for both concentrations, 23.79 ± 1.02 mAU.min for 20.0 mg/kg and 59.42 ± 2.84 mAU.min, except for day 6 for 20.0 mg/kg, which was slightly below the allowable limit (22.58 mAU.min), calculated at only a 5.1% relative difference (Figure 4).
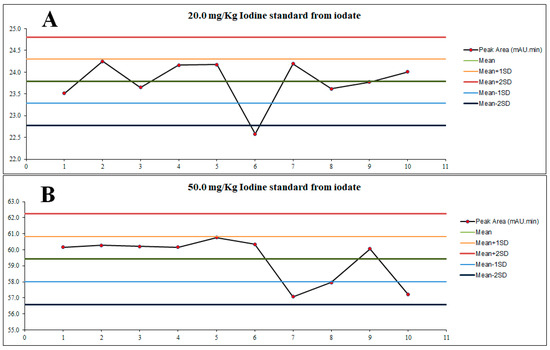
Figure 4.
Overview of 10-day observation of peak area for (A) 20.0 mg/kg and (B) 50.0 mg/kg iodine concentration originated from iodate. The samples were observed after the addition of the same 0.5 M sodium bisulfite on ten (10) different days by observing the peak area stability.
3.4. Sample Spike and Recovery
Six iodized table salt samples were analyzed and individually spiked with both iodide and iodate as shown in the tabulated data (Table 4). It was shown that the method was able to detect the iodine concentration, and the total iodine concentration ranged from 7.4 mg/kg to 24.2 mg/kg. The spiked samples showed a very good recovery from 89.8% to 101.8% for the iodide spike and from 87.2% to 106.9% for the iodate spike.
Table 4.
Six iodized table salt samples are tabulated with respective iodine concentrations. The samples were spiked with both iodide and iodate, individually at pre-determined concentrations.
4. Discussion
Typically, ionic compounds such as iodide are analyzed by ion chromatography since the separation principle is based on the ion-exchange properties of the compounds [20,21]. Nowadays, new column technology has emerged, and thus the introduction of weak-anion-exchange columns for UHPLC separation is meant for ionic compound separation [16]. The use of UHPLC is preferable due to its versatility compared to ion chromatography [22]. Due to this, experts in handling UHPLC are generally common, making it suitable for mass adoption. Our study developed and optimized a UHPLC technique for detecting total iodine concentration in the form of iodide. However, most iodized table salt is fortified with potassium iodate. Hence, a conversion of iodate to its iodide form was required, and this was performed by reducing all the iodate form in the samples to its iodide form by a reaction with sodium bisulfite.
During the method development, evidently, iodate was completely converted to its iodide form when 0.5 M sodium bisulfite was added from 0.5 mg/L to 2.5 mg/L iodine concentration due to the observed similar intensity of iodide and the converted iodide at 10.11 min. The complete conversion of iodate was further supported by the data of a linear correlation between iodide and converted iodide at R2 of 0.9996. The addition of 0.5 M sodium bisulfite (in excess) showed no effect on the peak of iodide, suggesting a suitable standardization method for sodium bisulfite in the standard and iodized table salt samples. Therefore, the standardization of 0.5 M sodium bisulfite addition was introduced in the sample preparation steps despite not knowing the form of iodine in the iodized table salt.
The method validation showed an excellent accuracy due to the RSD, which was in the range of 3.3% to 4.8%. Different concentrations of iodine from 0.5 to 2.5 mg/L in 0.5 M sodium bisulfite medium were found to be linearly correlated (R2 of 0.9998), with an LOD and LOQ of 0.06 mg/L and 0.18 mg/L, respectively. It is worth mentioning that the concentrations of iodine for 0.5 mg/L, 1.0 mg/L, 1.5 mg/L, 2.0 mg/L, and 2.5 mg/L are equivalent to 10.0 mg/kg, 20.0 mg/kg, 30.0 mg/kg, 40.0 mg/kg and 50.0 mg/kg in the iodized table salt samples, respectively, after they were dissolved in the solution for sample preparation prior to the injection in UHPLC.
The comparison of chromatograms of a blank of the mobile phase, 5% (w/v) sodium chloride, 5% (w/v) sodium chloride mixed with 0.5 M sodium bisulfite, and 1.50 mg/L iodide in 5% (w/v) sodium chloride mixed with 0.5 M sodium bisulfite showed that all of the solutions did not affect the peak intensity of iodide except the addition of 5% (w/v) sodium chloride mixed with 0.5 M sodium bisulfite which affected the chromatogram from 1.90 to 9.50 min. Nevertheless, the peak of iodide was clearly distinguished at 10.11 min, suggesting the separation method had good specificity for iodide detection.
The method was also found to be very precise due to the resulting RSD of 0.3–0.5% for repeatability and RSD of 1.0–2.0% for intermediate precision.
The robustness of the method was tested by changing the column temperature to 40 °C and decreasing the concentration of sodium bisulfite to 0.25 M; changing the column temperature caused the retention time of iodine to be shifted to 9.28 ± 0.11 min, while decreasing the sodium bisulfite concentration shifted the retention time to 10.02 ± 0.01 min. These effects were expected due to the properties of weak anion exchange which can be affected by different temperatures and different pH levels, where the pH would slightly change due to the change in the concentration of sodium bisulfite [23,24]. Even so, the RSD still suggested an excellent robustness that ranged from 0.8 to 1.2%.
In excess, sodium bisulfite functioned as a reducing agent to convert all available iodate in the table salt samples into its iodide form. This can be expressed in the following chemical reaction [19]:
where , , , , and represent an iodate ion, a bisulfite ion, an iodide ion, a sulfate ion, and a hydrogen ion, respectively. However, the addition of excess sodium bisulfite, i.e., at 0.5 M, might be degraded over time due to its instability when exposed to the air because of its nature as a very good antioxidant [25]. Thus, the stability test was crucial to determine the availability of the reagent to convert any possible iodate form existing in the iodized table salts. It was shown that the peak area of iodide in the chromatograms remained stable within the mean ± 2SD at 20.0 mg/kg and 50.0 mg/kg iodine concentrations when observed for ten (10) days, except for day 6 for 20.0 mg/kg, where the peak area was observed to be 5.1%, 0.1% below the allowable limit. The fact that only one day showed an outlier suggested that the cause of the problem was due to external factors, such as the instrumentation error or the laboratory environment [26]. The reason was further supported by the peak area result of 50.0 mg/kg monitoring on day 6, which was observed to remain stable within the allowable limit. The aim was to study the stability of sodium bisulfite if it is not prepared fresh daily. Thus, the results indicate that the use of 0.5 M sodium bisulfite remains stable for at least ten (10) consecutive days for the total iodine concentrations of 20.0 mg/kg and 50.0 mg/kg.
Finally, the method successfully analyzed six iodized table salt samples individually spiked with both iodide and iodate standards. Good recovery was concluded due to the results of 89.8–101.8% recovered when spiked with iodide and 87.2–106.9% when spiked with iodate, indicating that the sample matrix did not affect the detection of iodide.
5. Conclusions
We have successfully determined and validated the total iodine in iodized table salt. The form of iodine for the UHPLC detection is iodide in which the addition of 0.5 M sodium bisulfite enabled the reduction of iodate into its converted iodide forms (recovered from 96.25 to 103.6%). The method was validated with an accuracy of 4.2% RSD and linearity from 0.5 to 2.5 mg/L, which is equivalent to 10.0–50.0 mg/kg of total iodine in iodized table salt, with an LOD and LOQ of 0.06 mg/L (1.2 mg/kg) and 0.18 mg/L (3.7 mg/kg), respectively. The chromatograms showed great specificity when several sample matrices were introduced. Moreover, the precision was at 0.4% RSD for repeatability and 1.6% RSD for intermediate precision, whereas robustness was at 0.8% RSD. The use of sodium bisulfite for the conversion of iodate to iodide form was observed to remain stable for at least 10 days. Six (6) samples were analyzed in triplicate, and it was found that the samples were recovered greatly from 87.2 to 106.9% when spiked with individual iodate and iodate standard at equivalent concentrations of 10.0, 20.0, and 30.0 mg/kg, respectively. This study concluded that this method was suitable to be used as a laboratory protocol for the determination of total iodine in iodized table salt.
Author Contributions
Conceptualization, M.A.J.; methodology, M.A.J.; software, M.A.J.; validation, M.A.J., A.A.R. and M.F.M.N.; formal analysis, M.A.J.; investigation, M.A.J.; resources, A.A.R.; data curation, M.A.J.; writing—original draft preparation, M.A.J.; writing—review and editing, A.A.R. and M.F.M.N.; visualization, M.A.J.; supervision, M.F.M.N.; project administration, A.A.R.; funding acquisition, M.F.M.N. All authors have read and agreed to the published version of the manuscript.
Funding
This project was funded by the Ministry of Health Malaysia, grant number NMRR-14-502-21091.
Informed Consent Statement
Not applicable.
Data Availability Statement
The original contributions presented in this study are included in the article; further inquiries can be directed to the corresponding author.
Acknowledgments
We would like to thank the Director General of Health Malaysia for his permission to publish this article.
Conflicts of Interest
The authors declare no conflicts of interest.
References
- Zimmermann, M.B.; Jooste, P.L.; Pandav, C.S. Iodine-Deficiency Disorders. Lancet 2008, 372, 1251–1262. [Google Scholar] [CrossRef] [PubMed]
- Zimmermann, M.B. Research on Iodine Deficiency and Goiter in the 19th and Early 20th Centuries. J. Nutr. 2008, 138, 2060–2063. [Google Scholar] [CrossRef] [PubMed]
- Speeckaert, M.M.; Speeckaert, R.; Wierckx, K.; Delanghe, J.R.; Kaufman, J.-M. Value and Pitfalls in Iodine Fortification and Supplementation in the 21st Century. Br. J. Nutr. 2011, 106, 964–973. [Google Scholar] [CrossRef] [PubMed]
- Mannar, M.G.V.; Dunn, J.T. Salt Iodization for the Elimination of Iodine Deficiency; International Council for Control of Iodine Deficiency Disorders: The Hague, The Netherlands, 1995; ISBN 9070785137. [Google Scholar]
- Codling, K.; Rudert, C.; Bégin, F.; Peña-Rosas, J.P. The Legislative Framework for Salt Iodization in Asia and the Pacific and Its Impact on Programme Implementation. Public Health Nutr. 2017, 20, 3008–3018. [Google Scholar] [CrossRef] [PubMed]
- Gorstein, J.L.; Bagriansky, J.; Pearce, E.N.; Kupka, R.; Zimmermann, M.B. Estimating the Health and Economic Benefits of Universal Salt Iodization Programs to Correct Iodine Deficiency Disorders. Thyroid 2020, 30, 1802–1809. [Google Scholar] [CrossRef] [PubMed]
- Chavasit, V.; Malaivongse, P.; Judprasong, K. Study on Stability of Iodine in Iodated Salt by Use of Different Cooking Model Conditions. J. Food Compos. Anal. 2002, 15, 265–276. [Google Scholar] [CrossRef]
- Zimmermann, M.B. The Role of Iodine in Human Growth and Development. Semin. Cell Dev. Biol. 2011, 22, 645–652. [Google Scholar] [CrossRef] [PubMed]
- Chaouki, M.L.; Benmiloud, M. Prevention of Iodine Deficiency Disorders by Oral Administration of Lipiodol during Pregnancy. Eur. J. Endocrinol. 1994, 130, 547–551. [Google Scholar] [CrossRef] [PubMed]
- Zimmermann, M.B. Iodine Deficiency. Endocr. Rev. 2009, 30, 376–408. [Google Scholar] [CrossRef] [PubMed]
- Rasmussen, L.B.; Andersen, S.; Ovesen, L.; Laurberg, P. Iodine Intake and Food Choice. In Comprehensive Handbook of Iodine; Academic Press: Burlington, MA, USA, 2009; pp. 332–337. ISBN 9780123741356. [Google Scholar]
- Yun, A.J.; Doux, J.D. Iodine in the ecosystem. In Comprehensive Handbook of Iodine; Elsevier: Amsterdam, The Netherlands, 2009; pp. 119–123. ISBN 9780123741356. [Google Scholar]
- Falk, H.; Geerling, R.; Hattendorf, B.; Krengel-Rothensee, K.; Schmidt, K.P. Capabilities and Limits of ICP-MS for Direct Determination of Element Traces in Saline Solutions. Fresenius. J. Anal. Chem. 1997, 359, 352–356. [Google Scholar] [CrossRef]
- Flores, E.M.M.; Mello, P.A.; Krzyzaniak, S.R.; Cauduro, V.H.; Picoloto, R.S. Challenges and Trends for Halogen Determination by Inductively Coupled Plasma Mass Spectrometry: A Review. Rapid Commun. Mass Spectrom. 2020, 34, e8727. [Google Scholar] [CrossRef] [PubMed]
- Jennings, W.G.; Majors, R.E.; Kirkland, J.J.; Unger, K.K.; Engelhardt, H.; Schomburg, G.; Pirkle, W.H.; Welch, C.J.; Armstrong, D.W.; Porath, J.O.; et al. History and Developments in Chromatographic Column Technology and Validation to 2001. In Chromatography: A Science of Discovery; Wixom, R.L., Gehrke, C.W., Eds.; John Wiley & Sons, Inc.: Hoboken, NJ, USA, 2010; pp. 199–267. ISBN 978-0-470-28345-5. [Google Scholar]
- Lämmerhofer, M.; Nogueira, R.; Lindner, W. Multi-Modal Applicability of a Reversed-Phase/Weak-Anion Exchange Material in Reversed-Phase, Anion-Exchange, Ion-Exclusion, Hydrophilic Interaction and Hydrophobic Interaction Chromatography Modes. Anal. Bioanal. Chem. 2011, 400, 2517–2530. [Google Scholar] [CrossRef] [PubMed]
- Nogueira, R.; Lämmerhofer, M.; Lindner, W. Alternative High-Performance Liquid Chromatographic Peptide Separation and Purification Concept Using a New Mixed-Mode Reversed-Phase/Weak Anion-Exchange Type Stationary Phase. J. Chromatogr. A 2005, 1089, 158–169. [Google Scholar] [CrossRef] [PubMed]
- Dionex. Determination of Iodide and Iodate in Seawater and Iodized Table Salt by HPLC with UV Detection; Application Note 236; Dionex: Chelmsford, MA, USA, 2009; pp. 1–7. [Google Scholar]
- Rebary, B.; Paul, P.; Ghosh, P.K. Determination of Iodide and Iodate in Edible Salt by Ion Chromatography with Integrated Amperometric Detection. Food Chem. 2010, 123, 529–534. [Google Scholar] [CrossRef]
- Buchberger, W.; Czizsek, B.; Hann, S.; Stingeder, G. Preliminary Comparison of Inductively Coupled Plasma Mass Spectrometry and Electrospray Mass Spectrometry Hyphenated with Ion Chromatography for Trace Analysis of Iodide. J. Anal. At. Spectrom. 2003, 18, 512–514. [Google Scholar] [CrossRef]
- Stärk, H.-J.; Mattusch, J.; Wennrich, R.; Mroczek, A. Investigation of the IC-ICP-MS Determination of Iodine Species with Reference to Sample Digestion Procedures. Fresenius. J. Anal. Chem. 1997, 359, 371–374. [Google Scholar] [CrossRef]
- Pomeranz, Y.; Meloan, C.E. High-performance liquid chromatography and ion chromatography. In Food Analysis; Springer US: Boston, MA, USA, 1994; Volume 6, pp. 324–351. ISBN 978-1-4615-7000-4. [Google Scholar]
- Staby, A.; Jensen, R.H.; Bensch, M.; Hubbuch, J.; Dünweber, D.L.; Krarup, J.; Nielsen, J.; Lund, M.; Kidal, S.; Hansen, T.B.; et al. Comparison of Chromatographic Ion-Exchange Resins. J. Chromatogr. A 2007, 1164, 82–94. [Google Scholar] [CrossRef] [PubMed]
- Martin, B.B.; Martin, D.F.; Martin, B.B.; Feliciano, D.; Acıkara, Ö.B.; Citoglu, G.S.; Özbilgin, S.; Ergene, B.; Amaral, A.C.F. Column Chromatography; InTech Open Access Publisher: Rijeka, Croatia, 2013; ISBN 9789535110743. [Google Scholar]
- Shi, Y.; Zhan, X.; Ma, L.; Li, L.; Li, C. Evaluation of Antioxidants Using Oxidation Reaction Rate Constants. Front. Chem. China 2007, 2, 140–145. [Google Scholar] [CrossRef]
- Reckling, M.; Ahrends, H.; Chen, T.-W.; Eugster, W.; Hadasch, S.; Knapp, S.; Laidig, F.; Linstädter, A.; Macholdt, J.; Piepho, H.-P.; et al. Methods of Yield Stability Analysis in Long-Term Field Experiments. A Review. Agron. Sustain. Dev. 2021, 41, 27. [Google Scholar] [CrossRef]
Disclaimer/Publisher’s Note: The statements, opinions and data contained in all publications are solely those of the individual author(s) and contributor(s) and not of MDPI and/or the editor(s). MDPI and/or the editor(s) disclaim responsibility for any injury to people or property resulting from any ideas, methods, instructions or products referred to in the content. |
© 2025 by the authors. Licensee MDPI, Basel, Switzerland. This article is an open access article distributed under the terms and conditions of the Creative Commons Attribution (CC BY) license (https://creativecommons.org/licenses/by/4.0/).