Article

Electrospun WO3/TiO2 Core–Shell Nanowires for Triethylamine Gas Sensing

by
Wenhao Li
1,
Bo Zhang
1,*,
Xiangrui Dong
1,
Qi Lu
1,
Hao Shen
2,3,*,
Yi Ni
1,
Yuechen Liu
3 and
Haitao Song
2,3
1
Engineering Research Center of IoT Technology Applications (Ministry of Education), School of Integrated Circuits, Jiangnan University, Wuxi 214122, China
2
Shanghai Artificial Intelligence Research Institute Co., Ltd., Shanghai 200240, China
3
Artificial Intelligence Technology Center, Institute of Translational Medicine, Shanghai Jiao Tong University, Shanghai 200240, China
*
Authors to whom correspondence should be addressed.
Chemosensors 2025, 13(2), 45; https://doi.org/10.3390/chemosensors13020045
Submission received: 10 January 2025 / Revised: 28 January 2025 / Accepted: 30 January 2025 / Published: 2 February 2025
(This article belongs to the Special Issue Recent Progress in Nano Material-Based Gas Sensors)

Abstract

:
In this work, WO3/TiO2 core–shell (C-S) nanowires (NWs) were successfully synthesized by the coaxial electrospinning method and subsequent high-temperature calcination treatment. After some microscopic structural characterizations, although the prepared WO3–TiO2 and TiO2–WO3 C-S NWs displayed quite different surface morphologies, both of the shell coatings were uniform and their typical shell thicknesses were extremely close, with mean values of 22 and 20 nm, respectively. In gas sensing tests, WO3/TiO2 C-S NWs exhibited good selectivity towards triethylamine (TEA) without significant interfering gases. Compared with bare WO3 and TiO2 NWs, WO3/TiO2 C-S NWs showed better gas sensing performance. Specifically, the optimal operating temperature and response of TiO2–WO3 C-S NWs to 100 ppm TEA were 130 °C and 106, which were reduced by 70 °C and increased by 5.73 times compared to bare WO3, respectively. Obviously, the C-S nanostructures contributed to improving the gas sensing performance of materials towards TEA. Finally, some hypothetical sensing mechanisms were proposed, which were expected to have important reference significance for the design of target products applied to TEA sensing.

1. Introduction

TEA is one kind of volatile organic compound (VOC) with a strong ammonia odor, which can be used as a catalyst for the production of polycarbonate by the phosgene method, a solvent or a raw material in organic synthesis, and also as a preservative, bactericide, polymerization inhibitor, and liquid rocket propellant [1,2,3]. Nevertheless, TEA causes strong irritation to the human respiratory tract and can cause pulmonary edema and even death after inhalation. Moreover, eye and skin contact with TEA can cause chemical burns. According to the U.S. Occupational Safety and Health Administration (OSAH), the upper limit of TEA allowed in the air is 10 ppm [4]. Therefore, it is necessary to develop sensors that can efficiently detect TEA gas.
In recent years, metal oxide semiconductor (MOS) gas sensors have attracted a lot of attention in the field of gas sensors due to their ease of manufacture and outstanding performance for toxic gas detection. Among them, gas sensors prepared based on WO3, SnO2, and other materials have been successfully used in TEA-detection scenarios. For TEA gas sensor applications, Zhai et al. [5] reported the preparation of WO3 hollow microspheres by nanosheet assembly. The product exhibited a 16 response to 50 ppm TEA at 220 °C and a very short response time (~1.5 s). Wang et al. [6] synthesized WO3 microflowers having different crystal facet ratios using alcohol solvents with different C chains. The results indicated that the sensor based on the sample with a low-intensity ratio of the (002) WO3 facet showed a high response, good selectivity, and low detection limit for TEA at 325 °C. Wang et al. [7] prepared single-crystalline SnO2 nanorods through the molten-salt method, whose response was 64.8 to 50 ppm TEA at 350 °C. Notably, the sensor could still achieve a response of 3 to as low as 1 ppm TEA.
It is reported that the gas sensing performance of MOS gas sensors is closely related to material characteristics such as their morphology, composition, and specific surface area [8,9,10,11]. In the process of exploring how to improve the gas sensing performance of MOS gas sensors, researchers have gradually found that preparing gas sensing materials into nanorods (NRs), NWs, nanosheets (NSs), or other specific morphologies, or modulating their internal carrier levels through doping, or introducing heterojunction or homojunction contacts on the material surface through compounding methods, are all very effective.
At present, C-S nanostructures are a research hotspot. Their prominent properties such as versatility, tunability, and stability make them widely used in optics [12,13,14], biomedicine [15,16,17], catalysis [18,19,20], energy [21,22,23], and sensors [24,25,26,27,28,29]. Lys et al. [14] found that ZnFe2O4/ZnO C-S nanofibers (NFs) showed enhanced visible-light photoelectrochemical performance. Compared with ZnFe2O4/ZnO C-S nanoparticles (NPs), ZnFe2O4/ZnO C-S NFs had elevated donor concentrations and displayed better photocurrent response and photoconversion efficiency. Monodispersed C-S hybrid NPs consisting of CoFe2O4 and biopolymers (polyvinylpyrrolidone (PVP) or polyethylene glycol (PEG)) were fabricated by Covaliu et al. [15] in a two-step method; the antioxidant properties of the two products were strengthened through different methods, which empowered them as multifunctional tools in cancer therapy besides their application in traditional magnetic uses. FeS@C C-S NPs were synthesized by Srinivas et al. [20] through supporting atomically dispersed Fe-Nx sites on N/S-doped mesoporous carbon, which promoted oxygen catalysis in rechargeable Zn–air batteries. A two-step electrodeposition method was adopted by Nair et al. [22] to generate bifunctional CuO@CoV C-S heterostructures, which were used as supercapacitor (SC) electrodes for electrochemical energy storage. Electrospun BTO@MWCNTs C-S NFs were employed by Zhou et al. [29] as flexible dual-mode pressure sensor materials which displayed an ultra-high sensitivity.
In addition, there are a large number of studies on the application of C-S nanomaterials in gas sensing, which exhibit unique advantages and potential for gas detection. For example, Shan et al. [30] fabricated a TEA sensor based on C-S ZnS@ZnO, which showed enhanced sensitivity and anti-humidity properties due to the excellent electrical properties of the electron depletion layers (EDLs) at the n-n heterojunction interfaces. Zhang et al. [31] synthetized Mn2O3@In2O3 C-S structures by hydrothermal reaction, which exhibited a response of 47 to 100 ppm TEA at 180 °C and good long-term stability. The enhanced sensing performance over pure In2O3 was attributed to the p-n heterojunctions generated at the C-S interfaces. Zhang et al. [32] prepared flower-like ZnO@ZIF-8 C-S heterostructures through the sacrificial template method and the optimal configured sample displayed a high response, good selectivity, fast response–recovery speed, and low detection limit in formaldehyde detection. The above performance improvement was considered to be due to the high adsorption energy and selective gas screening of the ZIF-8 surface. Huang et al. [33] reported an ethanol sensor based on ZnO@In2O3 C-S NFs, which demonstrated a response of 31.87 to 100 ppm ethanol at 225 °C. The improved sensing performance of the ZnO@In2O3 C-S sensor was deemed to result from the depletion modulation in charge transfer inside the EDLs of the In2O3 shell. Furthermore, the heterojunctions at the C-S interfaces were confirmed by UV photoelectron spectroscopy.
C-S nanomaterials possess both morphological and interfacial characteristics, making them ideal candidates for gas-sensitive materials due to their inherent advantages [34]. Visibly, a large number of heterojunctions or homojunctions will form at the interfaces between the cores and shells, due to their different Fermi energy levels, which are abundant, oriented, and easy to regulate. If the shell electrons flow to the core layer, an EDL will be formed in the shell layer, and vice versa, an electron accumulation layer (EAL) will be formed. As the main body that directly contacts and reacts with gas, the carrier concentration in the shell layer can be selectively controlled by adjusting the work function of the core layer material, thereby affecting the adsorbed oxygen content on the sensitive material surface and the response value of the sensor.
Since its pioneering work in the early 1970s, titanium dioxide (TiO2) has been widely applied in many fields, such as solar cells, photocatalysts, electronic ceramic materials, food and medicine, pigments, and gas sensors. There exist three crystalline structures in TiO2, with significant differences among them. Anatase TiO2 is prepared at low temperatures. When the temperature rises above 800 °C, anatase TiO2 transforms into rutile TiO2. Typically, rutile TiO2 is the most thermodynamically stable and the most common phase [35]. However, brookite TiO2 can only form under specific pressure conditions and its crystal structure is rather unstable. Similarly to anatase TiO2, an irreversible exothermic reaction occurs to brookite TiO2, which also ultimately transforms into the stable rutile TiO2 phase, after heating treatment. In both anatase and rutile TiO2, though the centrally located Ti4+ is coordinated by six O2− ions at the vertexes of an octahedral unit cell, the distortion and position of two unit cells differ from each other [36]. Subtle differences in unit cell structures result in differences in physical parameters such as crystal density and band gap. When electrons are excited from the valence band to the conduction band, electron/hole pairs will generate. After the charges are transferred to other species, many surface reactions will occur, which is the basic characteristic of TiO2, and endow the TiO2 with enormous potential and excellent performance in various application fields, including gas sensors. For example, Cao et al. [37] separately prepared rutile, anatase, and brookite TiO2 nanostructures by hydrothermal reactions. The results indicated that rutile TiO2 NRs showed higher responses to acetone compared to the other two crystal phases, which was attributed to the optimization of the band gap and oxygen-adsorptive capacity through crystal structure modulation. Zhou et al. [38] reported some similar experimental results. Aligned TiO2 NWs with different crystal phases were synthesized and tested, and the product containing 27% rutile phase by mass exhibited a better overall performance in ethanol sensing.
In this work, two n-type MOSs with different work functions (WFs) were selected: WO3 (WF: 5.24 eV) and TiO2 (WF: 4.20 eV) [39,40]. By switching the composition of the core and shell layers, two C-S NWs with inverted structures were successfully prepared: WO3–TiO2 and TiO2–WO3 C-S NWs. Taking the shell material as a reference, the response of both C-S nanomaterials to TEA was improved, and also the magnitude of the response improvement was closely related to the characteristics of the bulk material and the mode of its charge carrier change. Furthermore, based on the resistance changes in the sensitive materials, the corresponding gas sensing mechanism was provided. This work has important implications for directional design and improving the gas sensing performance of sensitive materials.

2. Experimental Section

2.1. Materials

Ammonium metatungstate ((NH4)6H2W12O40·xH2O) and tetrabutyl titanate (C16H36O4Ti) were purchased from Innochem Technology Co., Ltd., Beijing, China. N,N-dimethylformamide (DMF), absolute ethanol (C2H5OH), and acetic acid (CH3COOH) were purchased from Sinopharm Chemical Reagent Co., Ltd., Beijing, China. PVP (Mw = 1,300,000) was purchased from Aladdin Biochemical Technology Co., Ltd., Shanghai, China.

2.2. Synthesis of Sensitive Materials

A total of four types of NWs were prepared as sensing materials in this work, all of which were synthetized by electrospinning or the coaxial electrospinning method, following the standard process. The synthesis process of each sample is described as follows.
For the pure WO3 NWs, 0.51 g of ammonium metatungstate and 0.53 g of PVP were dissolved into 4 mL of DMF, which was stirred by a magnetic mixer for 10 h to form a uniform viscous colorless solution. For the pure TiO2 NWs, 0.97 mL of tetrabutyl titanate and 0.49 g of PVP were dissolved into a mixed solution of 2 mL of DMF, 2 mL of ethanol, and 0.2 mL of acetic acid, which was stirred for 10 h on a magnetic mixer to form a uniform viscous yellowish solution. Acetic acid can inhibit the hydrolysis and polymerization reactions of tetrabutyl titanate, preventing the white precipitate caused by its rapid hydrolysis, thus hindering the formation of a transparent solution. For the WO3–TiO2 C-S NWs, the core solution was composed of 0.51 g of ammonium metatungstate, 0.45 g of PVP, and 4 mL of DMF. The shell solution consisted of 0.2 mL of tetrabutyl titanate, 0.49 g of PVP, 2 mL of DMF, 2 mL of ethanol, and 0.2 mL of acetic acid. For the TiO2–WO3 C-S NWs, the shell solution was composed of 0.2 g of ammonium metatungstate, 0.53 g of PVP, and 4 mL of DMF. The core solution consisted of 0.97 mL of tetrabutyl titanate, 0.42 g of PVP, 2 mL of DMF, 2 mL of ethanol, and 0.2 mL of acetic acid. It should be noted that in the precursor solutions of the two types of C-S NWs, the molar ratios of metal atoms in the shell solution (Ti atoms for WO3–TiO2 C-S NWs, for example) to those in the core solution (W atoms for WO3–TiO2 C-S NWs, for example) were both 1:3.5.
Then, the obtained precursor solutions were extracted by 5 mL disposable syringes with different needle specifications. For the pure WO3 and TiO2 NWs, 22 G needles were used. For the WO3/TiO2 C-S NWs, a 22 G core needle and a customized 17 G coaxial shell needle were employed, respectively. The above syringes with installed needles were fixed to the propeller of the electrospinning machine, and the needles and roller collectors were connected to the high-voltage power supply and ground separately.
The parameters for the electrospinning experiments were generally set as follows, and dynamically adjusted throughout the entire experimental processes: the distance between the electrospinning needle and the drum collector at 15 cm, the ambient temperature at 25 °C, the ambient humidity at 30% RH, the DC supply voltage at 10 kV, the syringe advance rate for pure WO3 and TiO2 NWs at 0.3 mL/h, and for the core and shell solutions of WO3/TiO2 C-S NWs at 0.2 and 0.3 mL/h, respectively.
After 4 h of electrospinning, the obtained non-woven films were carefully peeled off into square porcelain boats with tweezers, sealed with a cover plate, and placed in the muffle furnace. The parameter settings for the calcination processes were as follows: the heating rate at 2 °C/min, the calcination temperature at 550 °C, and the calcination time at 2 h. When the muffle furnace dropped to room temperature, the products were taken out. Compared to the soft film precursors before calcination, the calcined products shrank in volume and became hard and brittle while maintaining the overall frameworks of the films. The pure WO3 NWs were white flake powders, and the other three products were all yellowish flake powders.

2.3. Characterization

X-ray powder diffraction (XRD) data were obtained on the D2 PHASER X-ray diffractometer (AXS, Bruker, Germany). The field emission scanning electron microscopy (FESEM) images were obtained on the ZEISS GX1669 microscope (Carl Zeiss AG, Oberkochen, Germany). Data from transmission electron microscopy (TEM) were acquired using the JEM-2100F microscope (Japan Electronics Co., Ltd., Osaka, Japan). X-ray photoelectron spectroscopy (XPS) data were obtained on the Escalab 250Xi system (Thermo Fisher Scientific, Waltham, MA, USA).

2.4. Gas Sensor Fabrication and Test

Tubular devices were adopted to manufacture gas sensors as in our previous work [41,42], and the device structure is shown in Figure S1 in the Supporting Information. The main structure of the device is an alumina ceramic tube (4 mm in length, 1.2 mm in external diameter, and 0.8 mm in internal diameter), with a pair of annular Au electrodes wound symmetrically on both sides. One Pt wire is led out from each side of each Au electrode. First, an appropriate amount of deionized water was dropped into the sample powder in a clean mortar and the mixture was gently ground into a paste. Then, several tubular devices were fixed on a needle. The paste was dipped in with a brush and evenly coated onto the ceramic tubes. After several coatings, the tubular devices were placed under an infrared lamp to remove moisture from the attached paste, which increased the adhesion between the sensing materials and the Au electrodes. Finally, the surface of the ceramic tubes was fully covered by a tight and uniformly thick sensing layer. Next, devices coated with sensing materials were transferred into a clean porcelain boat and moved together to an oven and dried at 200 °C for 2 h. After cooling to room temperature, a Ni-Cr alloy coil was inserted into the cavity of one ceramic tube to act as the heat source for a sensor. The sensor temperature will be determined and regulated by the current flowing through the alloy coil. The gas sensor fabrication process was completed after welding the Pt wires and alloy coil onto the hexagonal socket correspondingly.
The gas sensing performance of the fabricated gas sensors was tested on a commercial gas sensing test platform (Weisheng Electronic Technology Co., Ltd., model WS-30A, Zhengzhou, China) in a laboratory environment (30% RH, 25 °C).
In the chemical fume hood, the test board and virtual resistance board based on device resistance were inserted into the test instrument.
After setting parameters such as test time and sampling frequency, the voltage value of the alloy coil was adjusted to change the test temperature. The test started when the sensor resistance tended to dynamically stabilize at the resistance of the sensor in air (Ra), and the sensor metrics were automatically recorded by the testing software. Taking TEA, for example, a calculated volume of TEA was extracted by a microsyringe and quickly injected onto the evaporator of the instrument. After closing the cover plate, the switches of the evaporator and fans were opened, and TEA droplets on the evaporator quickly turned into steam, diffusing and evenly filling the entire test chamber. At the same time, the resistance of the sensor would first change rapidly and then slowly until it became dynamically stable again at the resistance of the sensor in gas (Rg) [43]. At last, the cover plate was opened and the gas in the test chamber was released. The sensor was then in the air atmosphere again, and its resistance could gradually recover to Ra.
In the humidity impact test, the temperature of the constant temperature and humidity incubator (50 L in volume) was set to be 25 °C, and its humidity value could be set arbitrarily in the range of 20~100% RH. In the real test, two identical 1 L wide-mouthed bottles were placed with the bottle mouth open in the humidity chamber which was set to stabilize at a certain humidity value for a period of time. Then, the two bottles were sealed and taken out. A certain amount of TEA was injected into one of them. After the TEA evaporated completely, the sensor device was first stabilized in the air bottle (containing humidity) and then transferred to the gas bottle at the same humidity, during which process its resistance change was recorded.
For n-type sensing materials (WO3 and TiO2, for example) and reducing gases (TEA, for example), the sensor response was defined as S = Ra/Rg. The response–recovery time was defined as the time when the response changed by 90% during the response or recovery process.

3. Results and Discussion

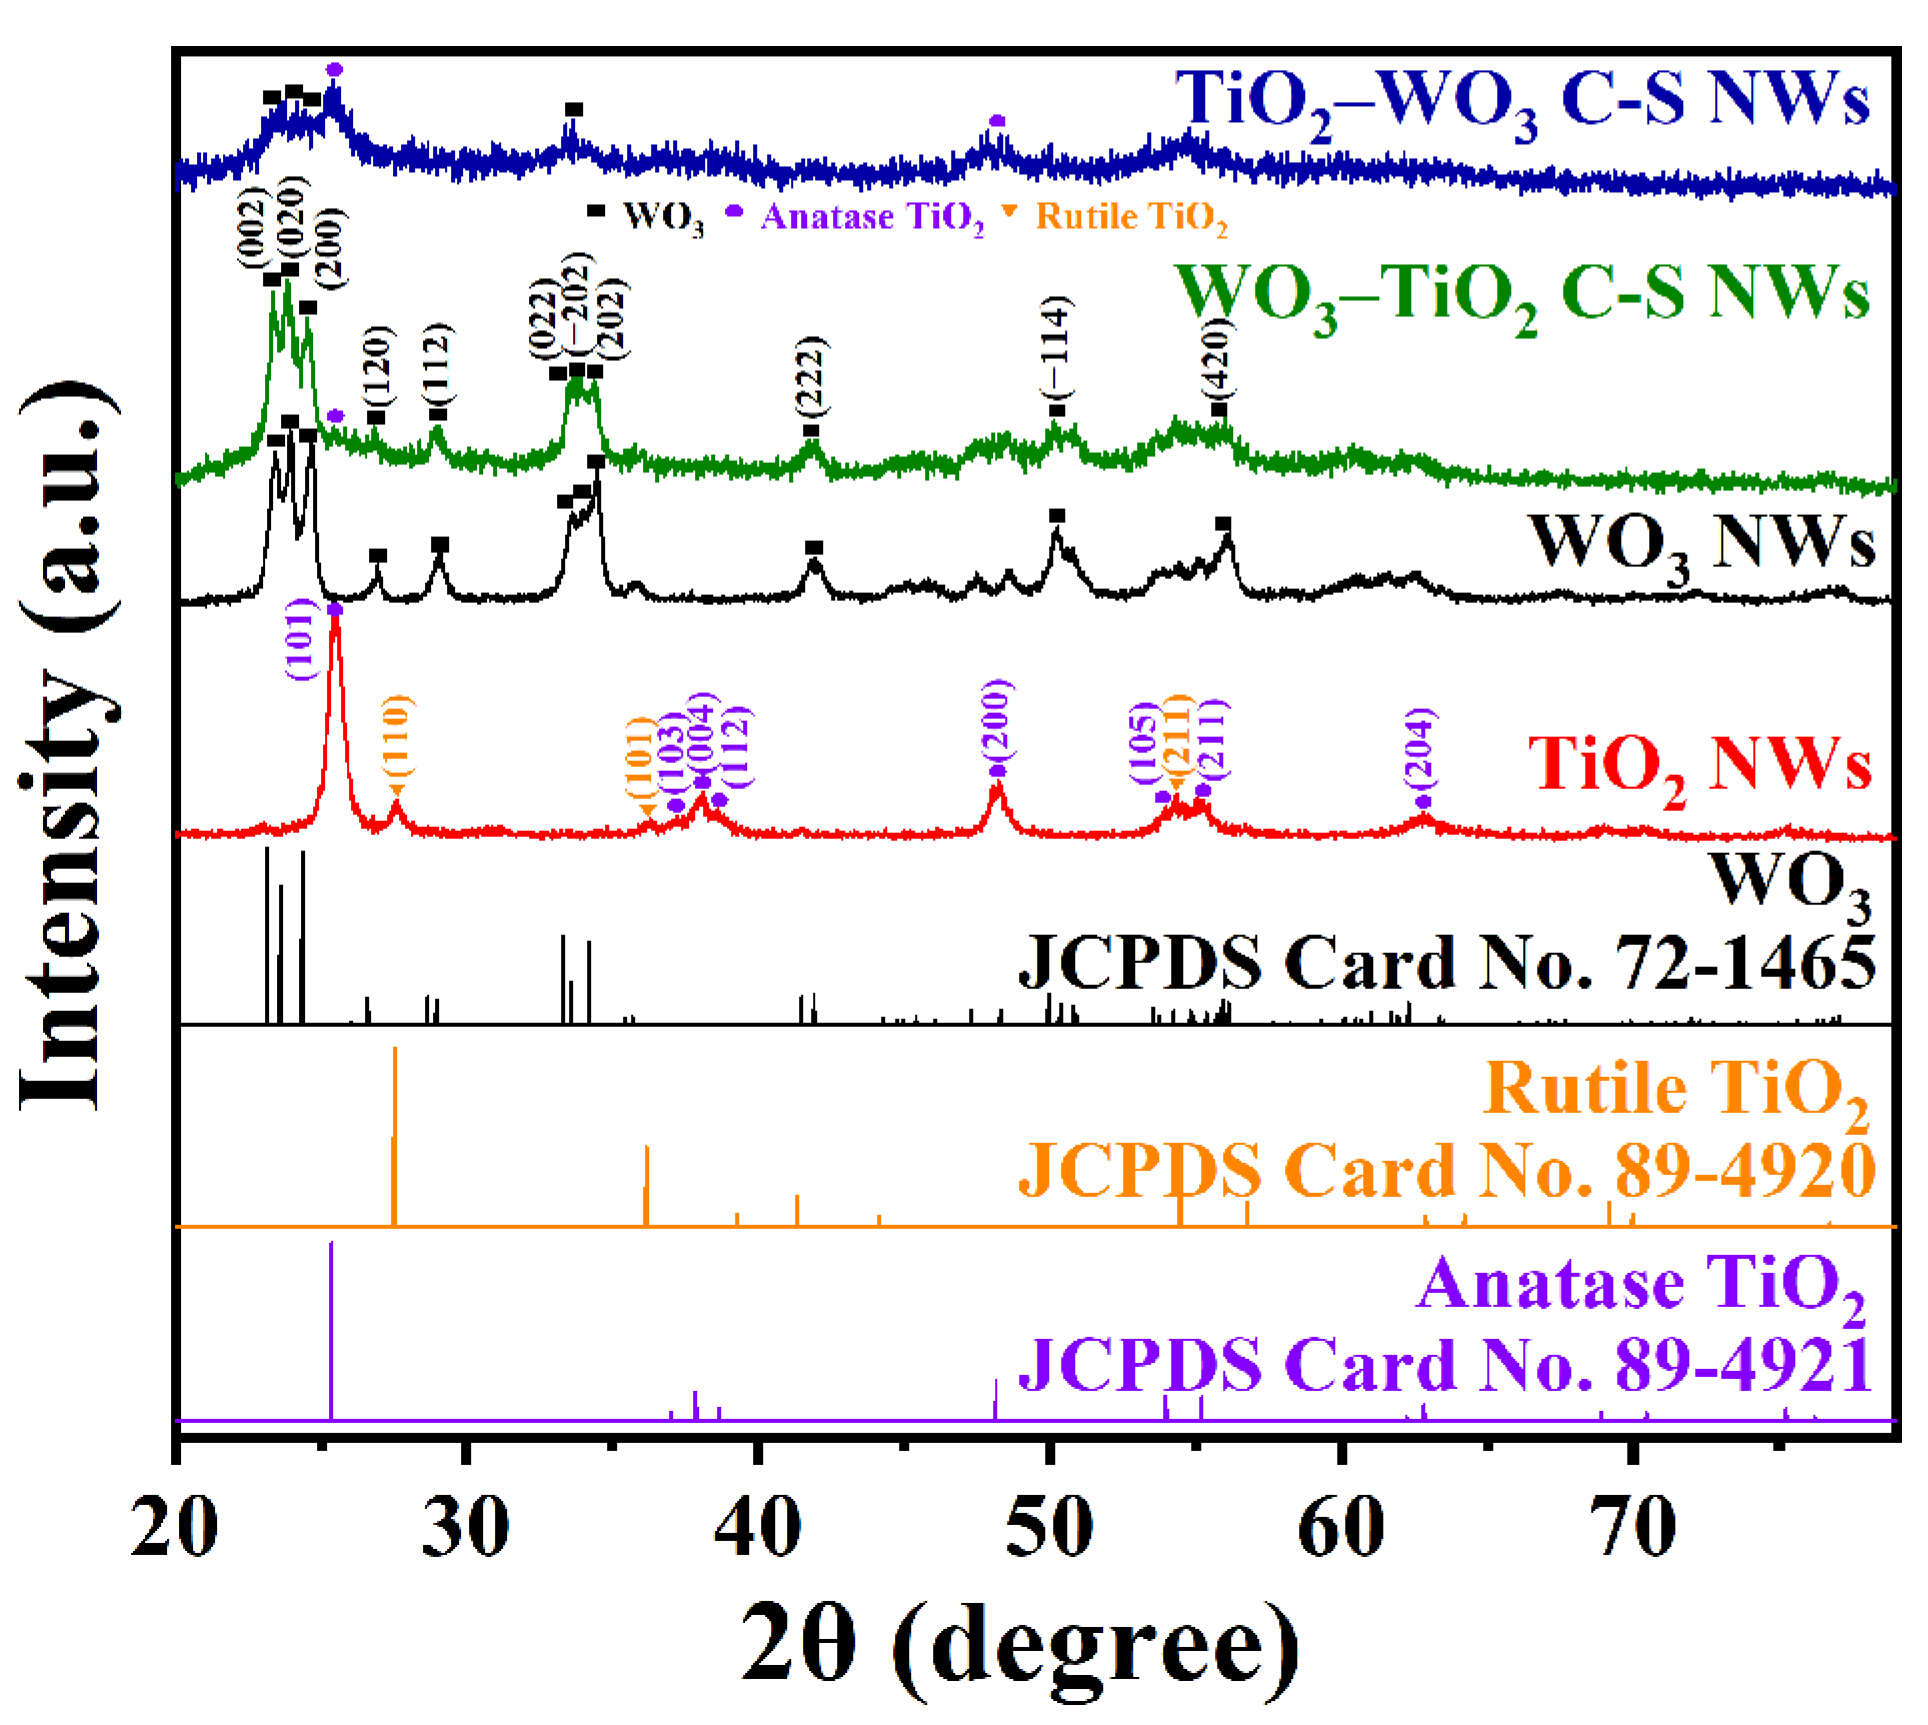
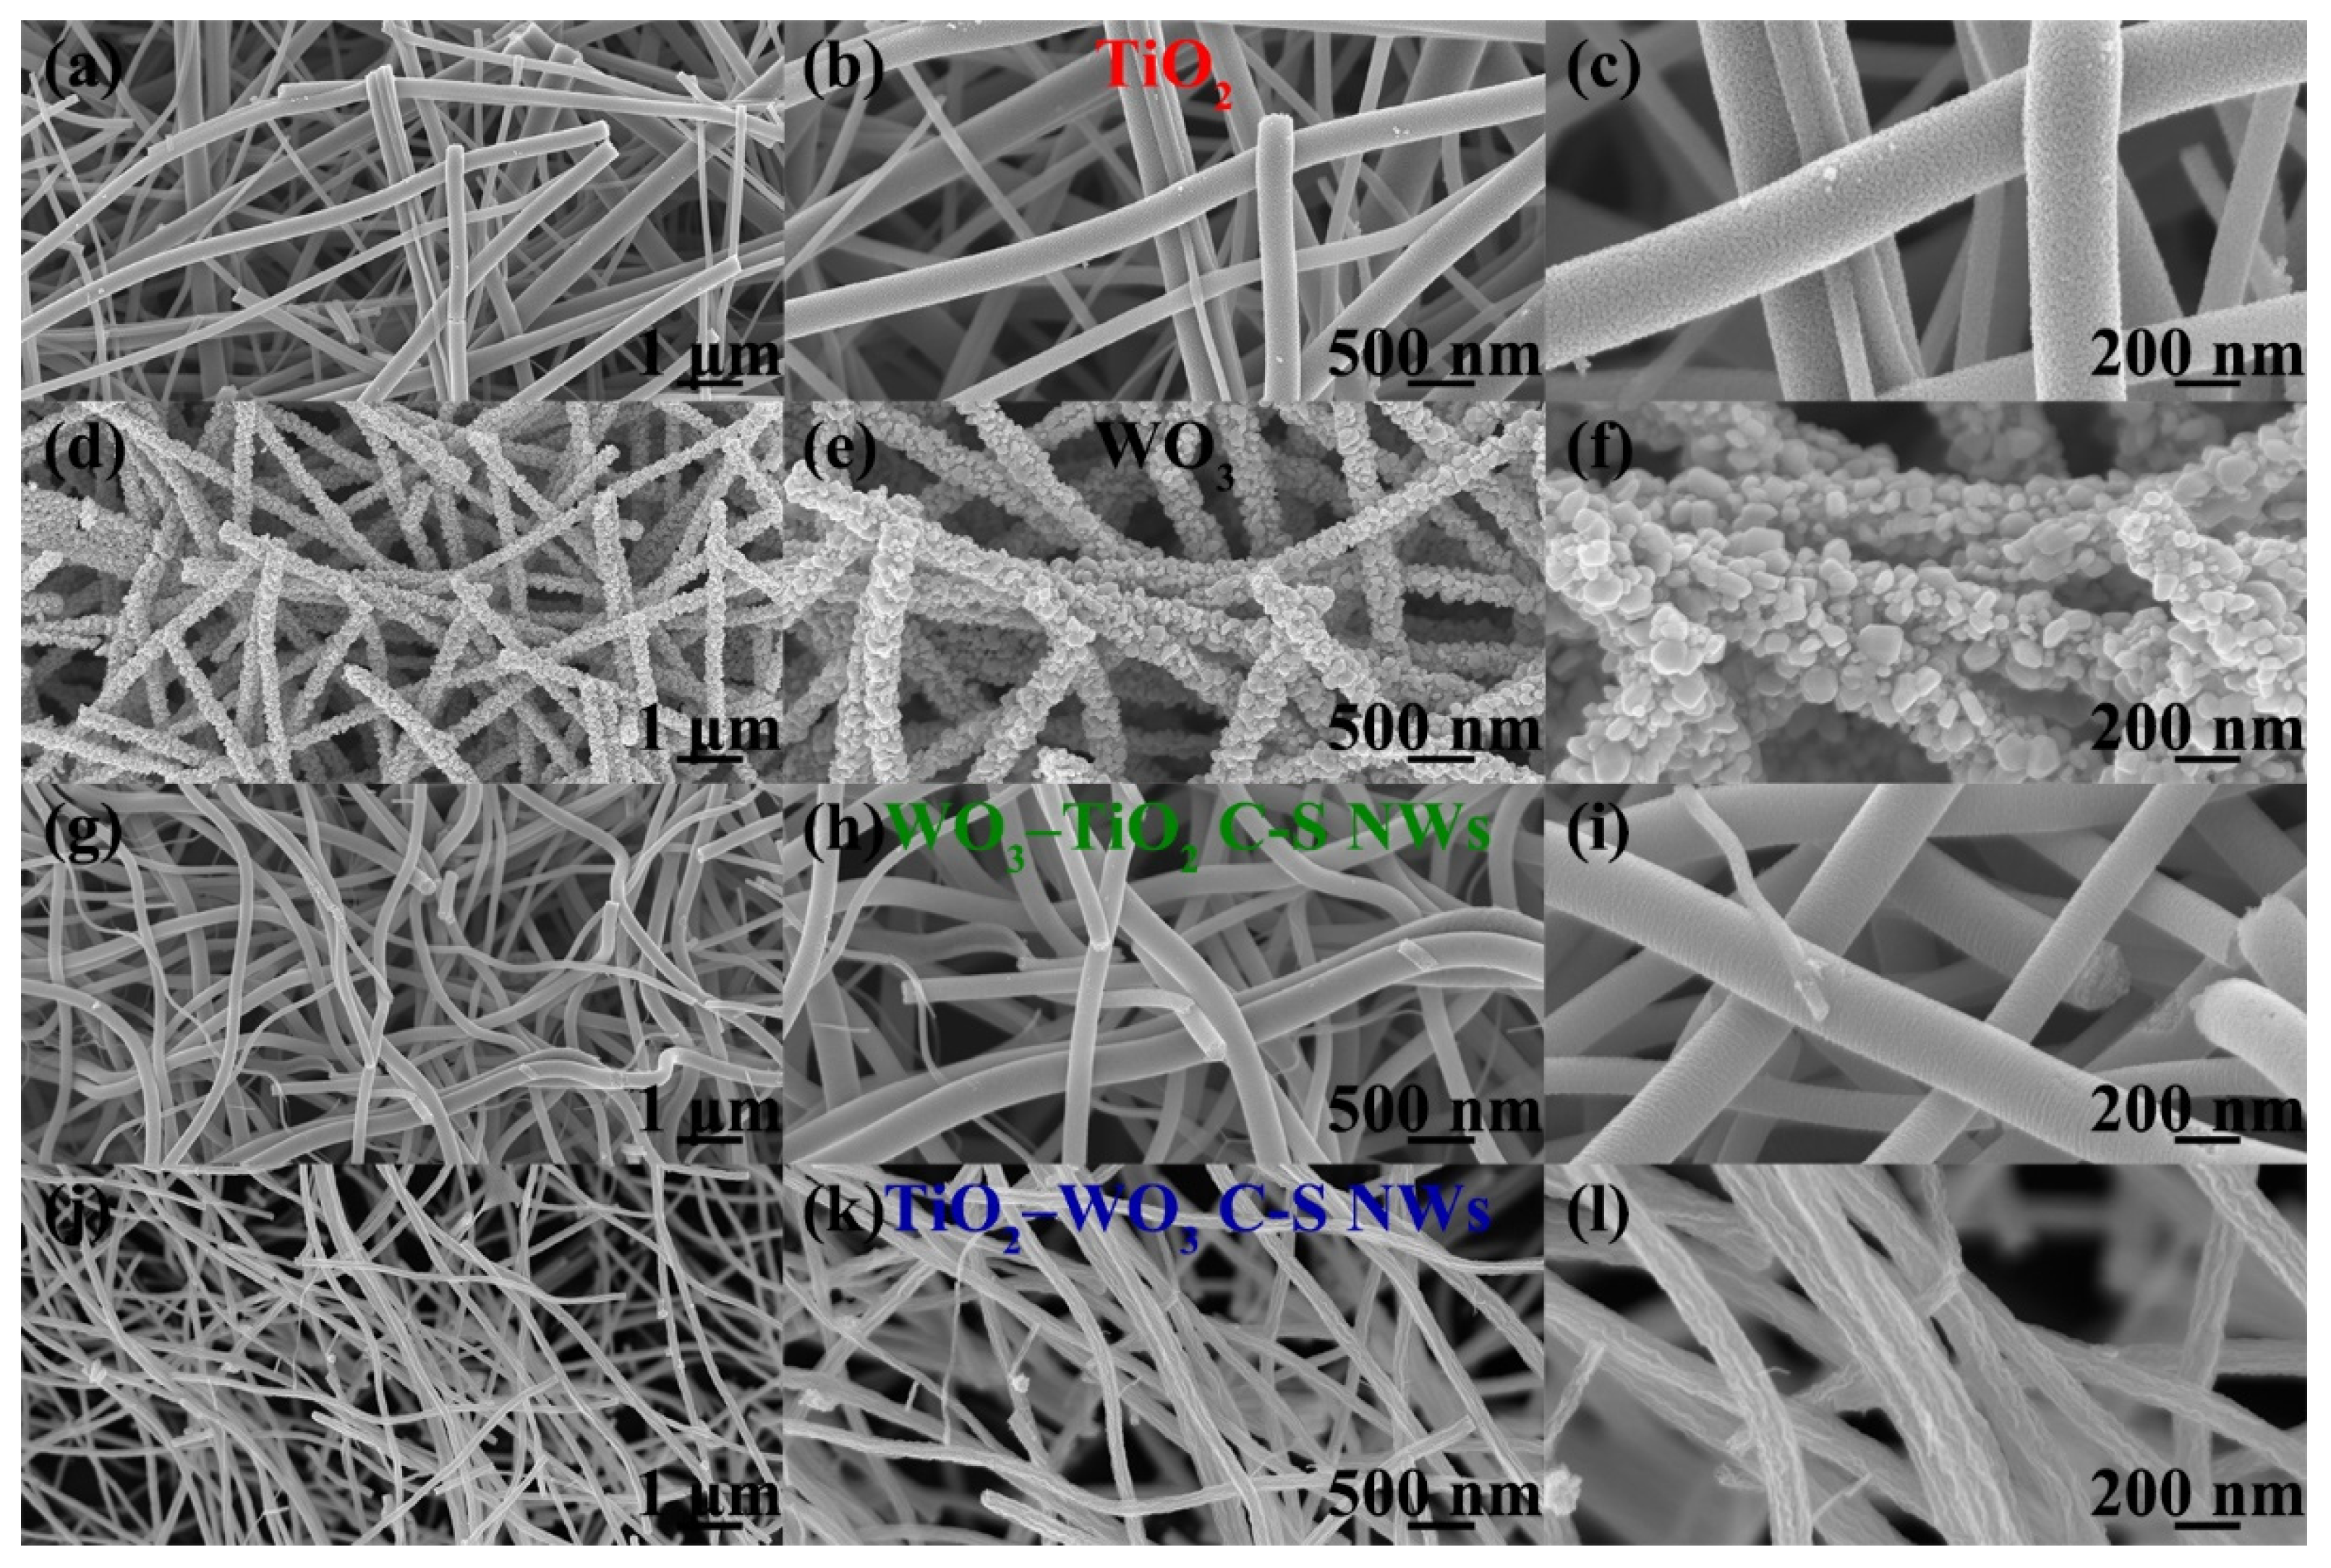
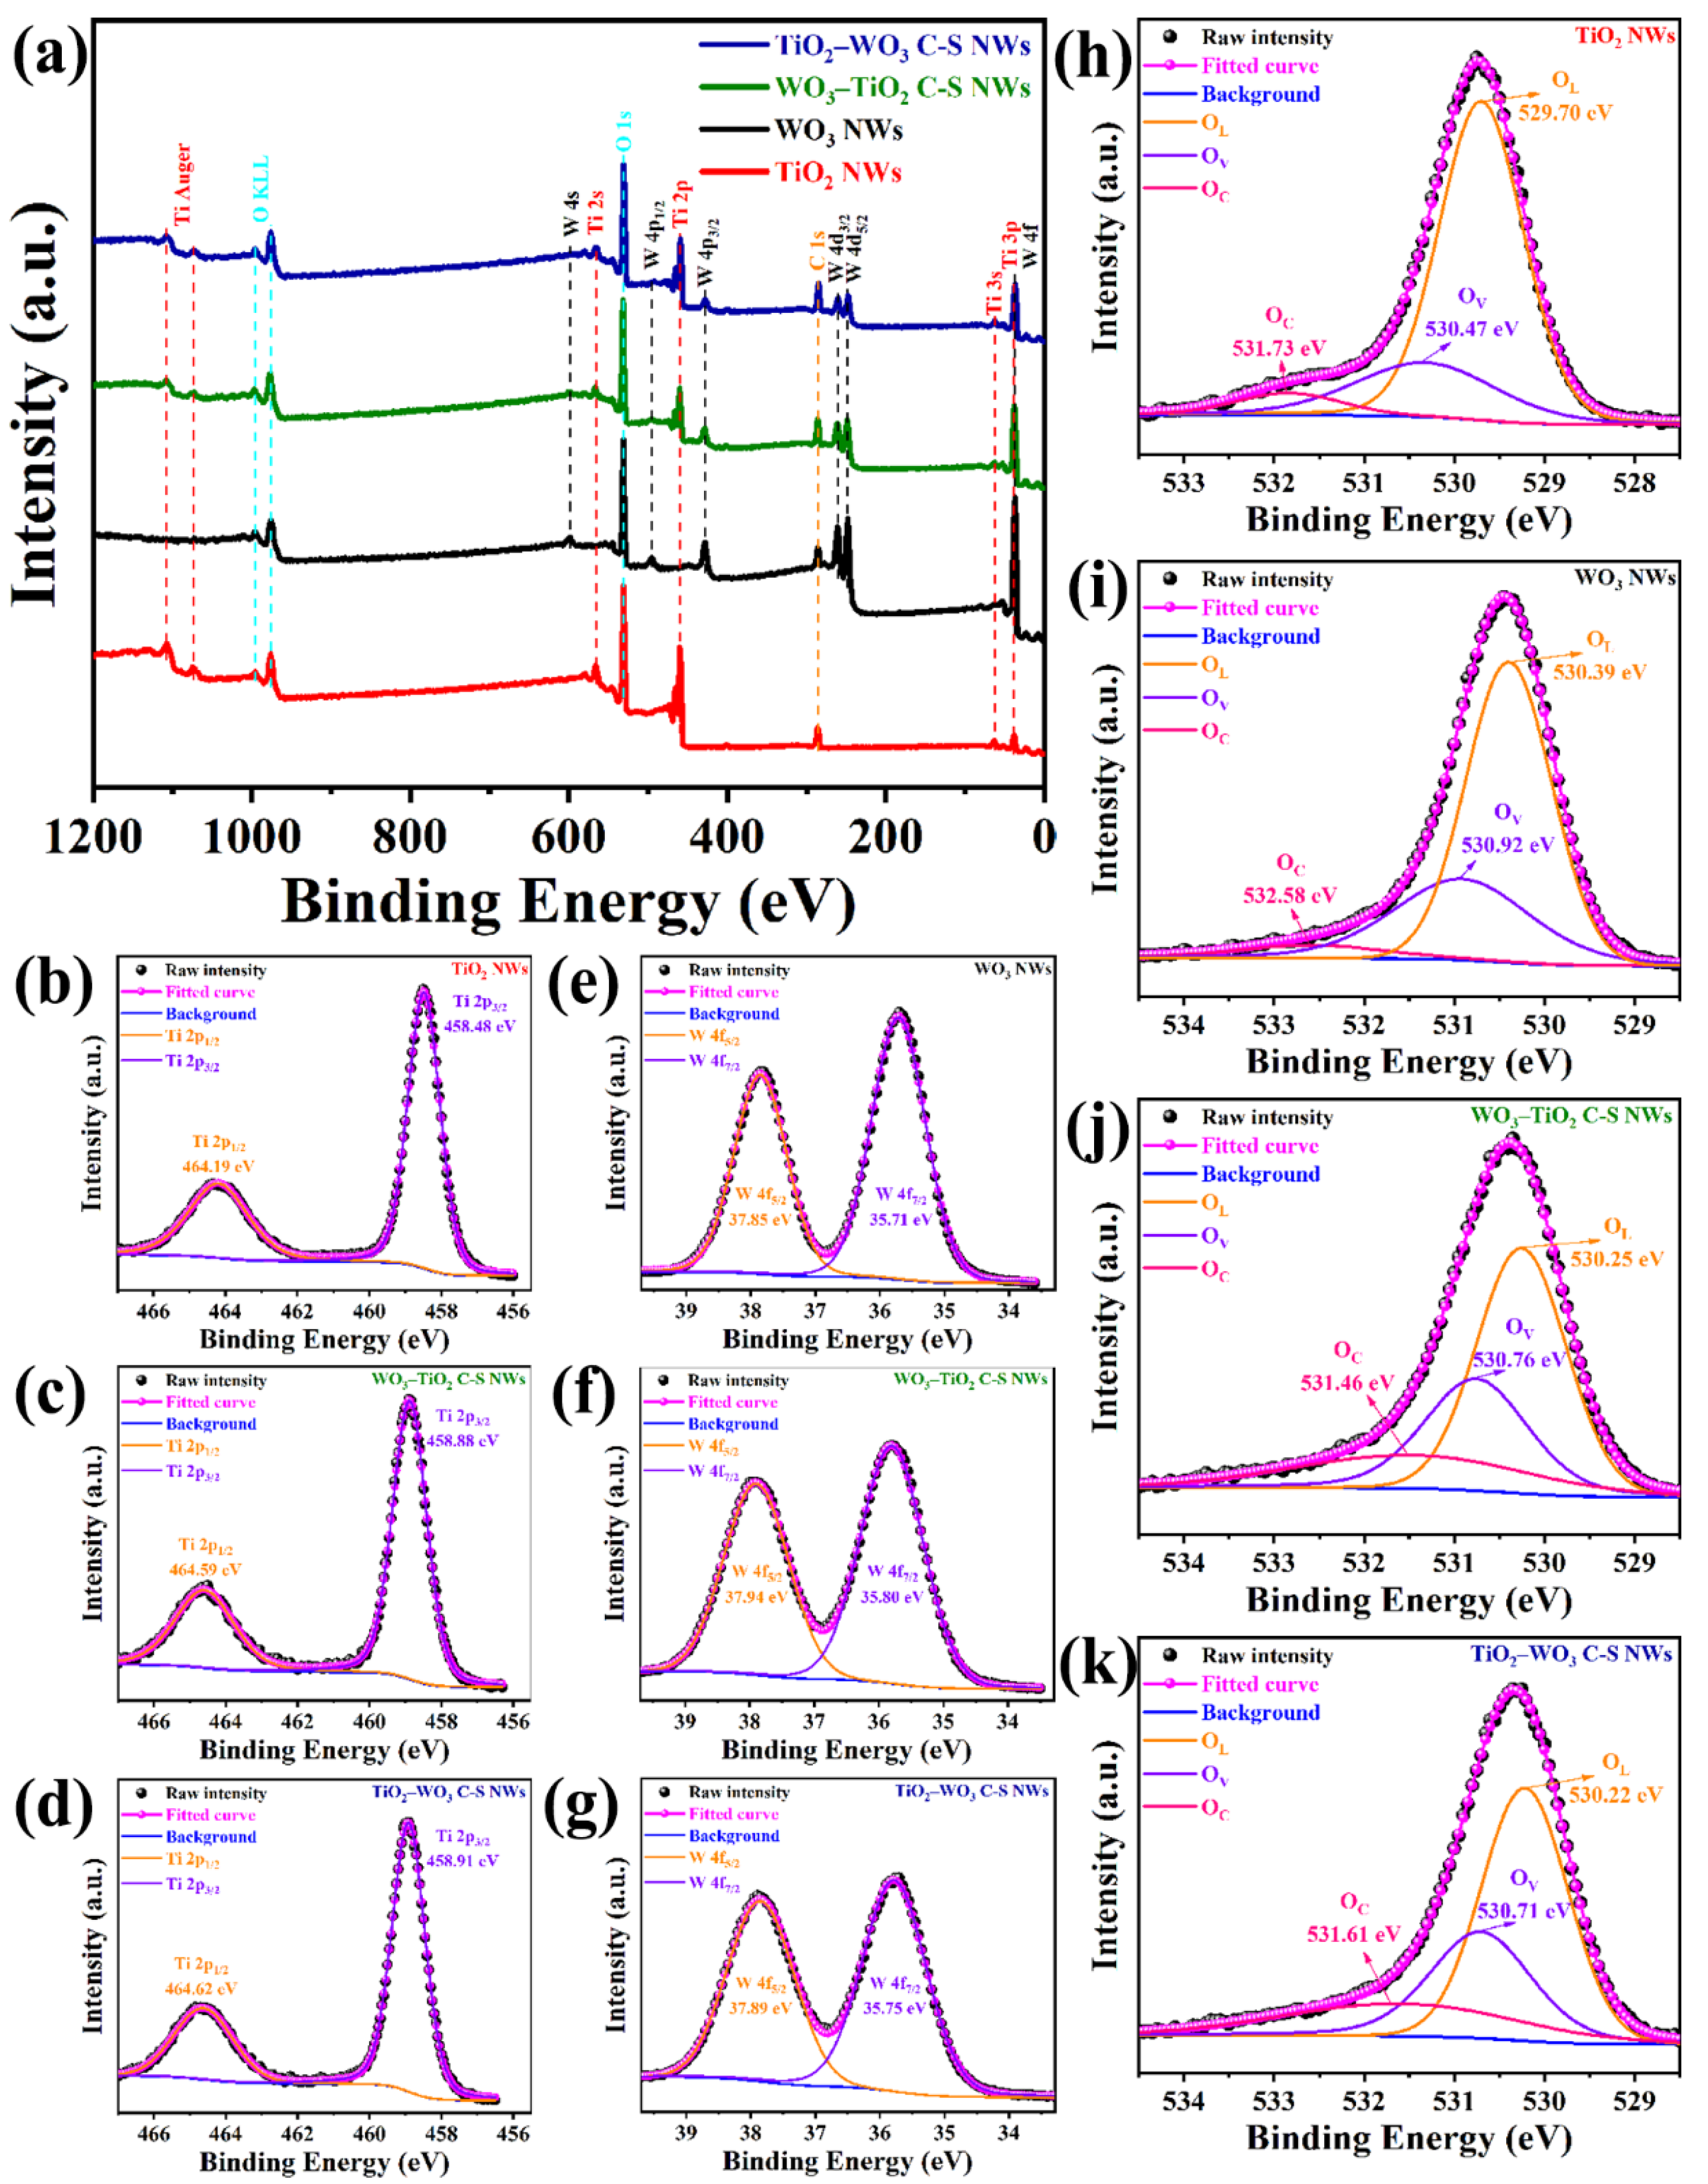
3.1. Structural and Morphological Features

XRD is mainly used to confirm the material composition and crystallinity of a material. As shown in Figure 1, the obtained diffraction peaks of pure WO3 NWs correspond well to the cubic phase of WO3 with the lattice constant of a = 7.3 Å, b = 7.53 Å, and c = 7.68 Å, displayed by the standard JCPDS Card No. 72-1465. However, two phases coexist in pure TiO2 NWs but show significant differences in content. Apparently, diffraction peaks originating from anatase TiO2 (JCPDS Card No. 89-4921) are sharp and strong, which occupy a dominant position. In contrast, rutile TiO2 (JCPDS Card No. 89-4920) owns a quite small proportion. As reported [44], the composition and proportion of the TiO2 crystal phase are closely related to the sintering temperature. When sintered below 500 °C, the products are all anatase-phase. When the temperature is higher than 500 °C, the rutile phase begins to appear and gradually increases with the increase in temperature. When the sintering temperature is above 800 °C, the products are all rutile-phase. In WO3/TiO2 C-S NWs, the core oxides (TiO2 in TiO2–WO3 C-S NWs, for example) with higher proportions contribute to the main diffraction peaks. In the two C-S NWs, the peak positions of the two sets of diffraction peaks do not shift to the left or right, indicating no occurrence of the doping process. No diffraction peaks derived from other substances are detected in all products, indicating their high purity. It is worth mentioning that the peak intensities of the two C-S NWs, especially for the TiO2–WO3 C-S NWs, weaken and the half-peak widths increase, indicating a decrease in their crystallinity, which may be caused by the mutual interference between the crystallization processes of the two MOSs at the interfaces.
SEM testing was performed to explore the topographic characteristics of the four as-prepared NWs. As shown in Figure 2a–c, on the whole, the TiO2 NWs are radially uniform, with axial lengths of over ten micrometers, but there are slight differences in the radial dimensions between different NWs. In the enlarged Figure 2c, the surface of the TiO2 NWs presents densely arranged small particles. However, a smooth and dense surface is clearly not conducive to the adsorption and diffusion of gas molecules, which indicates a dim prospect for TiO2 NWs in gas sensing. In stark contrast, WO3 NWs exhibit a significantly different appearance. Although approaching TiO2 NWs in the axial (Figure 2d) and radial (Figure 2e) dimensions, WO3 NWs have a significantly better homogeneity between each other. In high-resolution Figure 2f, particles of different sizes are tightly stacked together to form the whole WO3 NWs material. It can be inferred that the rough surface of WO3 NWs and numerous pores between particles will greatly increase the material’s specific surface area and permeability, which contribute a lot to the attachment, permeation, and reaction of the target gas. For the WO3–TiO2 C-S NWs in Figure 2g–i, whose shell material is TiO2, their surface precisely exhibits a similar morphology to pure TiO2, smooth and dense. In Figure 2i, parallel concentric circular ripples appear on the surface, which is a rare difference between WO3–TiO2 C-S NWs and pure TiO2. Analogously, in Figure 2j–l, TiO2–WO3 C-S NWs, with WO3 as the shell material, and pure WO3 have a common rough surface. Differently, the surface of TiO2–WO3 C-S NWs exhibits a wrinkled shape and is not composed of numerous particles like pure WO3. It can be seen that the surface morphology of the C-S NWs in this work mainly depends on the exposed outer shell material. The slight differences from pure shell NWs reflect the interaction between the core and shell materials during the crystalline growth. Structurally speaking, pure WO3 and TiO2–WO3 C-S NWs, with rough outer surfaces, have more advantages and potential in gas sensing.
TEM characterization was made to further confirm the microstructures of two C-S products, taking two randomly selected single NWs as an example. As depicted in Figure 3a–d, the solid structures with uniform thickness are consistent with those in Figure 2g–i. As the image resolution increases, the boundary between the shell and core layers becomes increasingly clear. In Figure 3c, the coating of the shell is proven to be very uniform, with almost equal thickness on both sides of the cross-sections, which confirms the precise preparation of the WO3–TiO2 C-S NW structure. Thanks to the wrinkled appearance on the surface of TiO2–WO3 C-S NWs, their C-S structures are more distinct in Figure 3e–h. The typical thickness of the shell layer is measured to be about 20 nm in Figure 3g. It can be observed that both types of prepared C-S NWs have complete, uniform, and continuous shell coatings, and the thicknesses of the shell layers are roughly equivalent.
XPS testing was conducted to verify the element types and their chemical states on the material surface, and all peak positions were calibrated against the standard C 1s peak (284.8 eV). Figure 4a displays the full XPS spectra of the four as-synthesized NWs. It is obvious that the types and distributions of elements are in line with experimental expectations. For example, WO3/TiO2 C-S NWs contain orbital peaks related to all three elements, namely W, Ti, and O. It is worth mentioning that the peak positions of Ti 3p (~32.4 eV) and W 4f (~32.3 eV) are too close, so that the peaks of Ti 3p are completely enclosed by W 4f in WO3/TiO2 C-S NWs. The Gaussian-fitted peaks in Figure 4b–d belong to the Ti 2p1/2 and 2p3/2 of the TiO2 and WO3/TiO2 C-S NWs. Although the peak positions of each group of peaks vary due to the different internal chemical environment of the three materials, the splitting energy of the two groups of peaks in each material remains unchanged, i.e., 5.71 eV, which coincides with the energy splitting value of tetravalent Ti. Similarly, the splitting energy of 2.14 eV in Figure 4e–g can be indexed to the energy differences for the W 4f5/2 and 4f7/2 of hexavalent W in WO3 and WO3/TiO2 C-S NWs. Generally, the O1s peak can be divided into three Gaussian-fitted components: lattice oxygen (OL), oxygen vacancy (OV), and chemisorbed oxygen (OC). It is universally acknowledged that OL species are stable and do not participate in electron transfer. OV species can provide active sites for the reaction gas, and OC species directly participate in the redox reactions on the material’s surface.
In Figure 4h–k and Table 1, the proportions of OC and OV in WO3–TiO2 C-S NWs and TiO2–WO3 C-S NWs are significantly higher than those in TiO2 NWs and WO3 NWs. The results show that the C-S structures increase the amount of OC and OV species. It is worth noting that the increase in the proportion of reactive oxygen species is only one of the signals that may enhance the sensor response. The response of sensors is influenced by multiple factors, and there is often no simple proportional relationship between the response value and the ratio of reactive oxygen species [45,46].

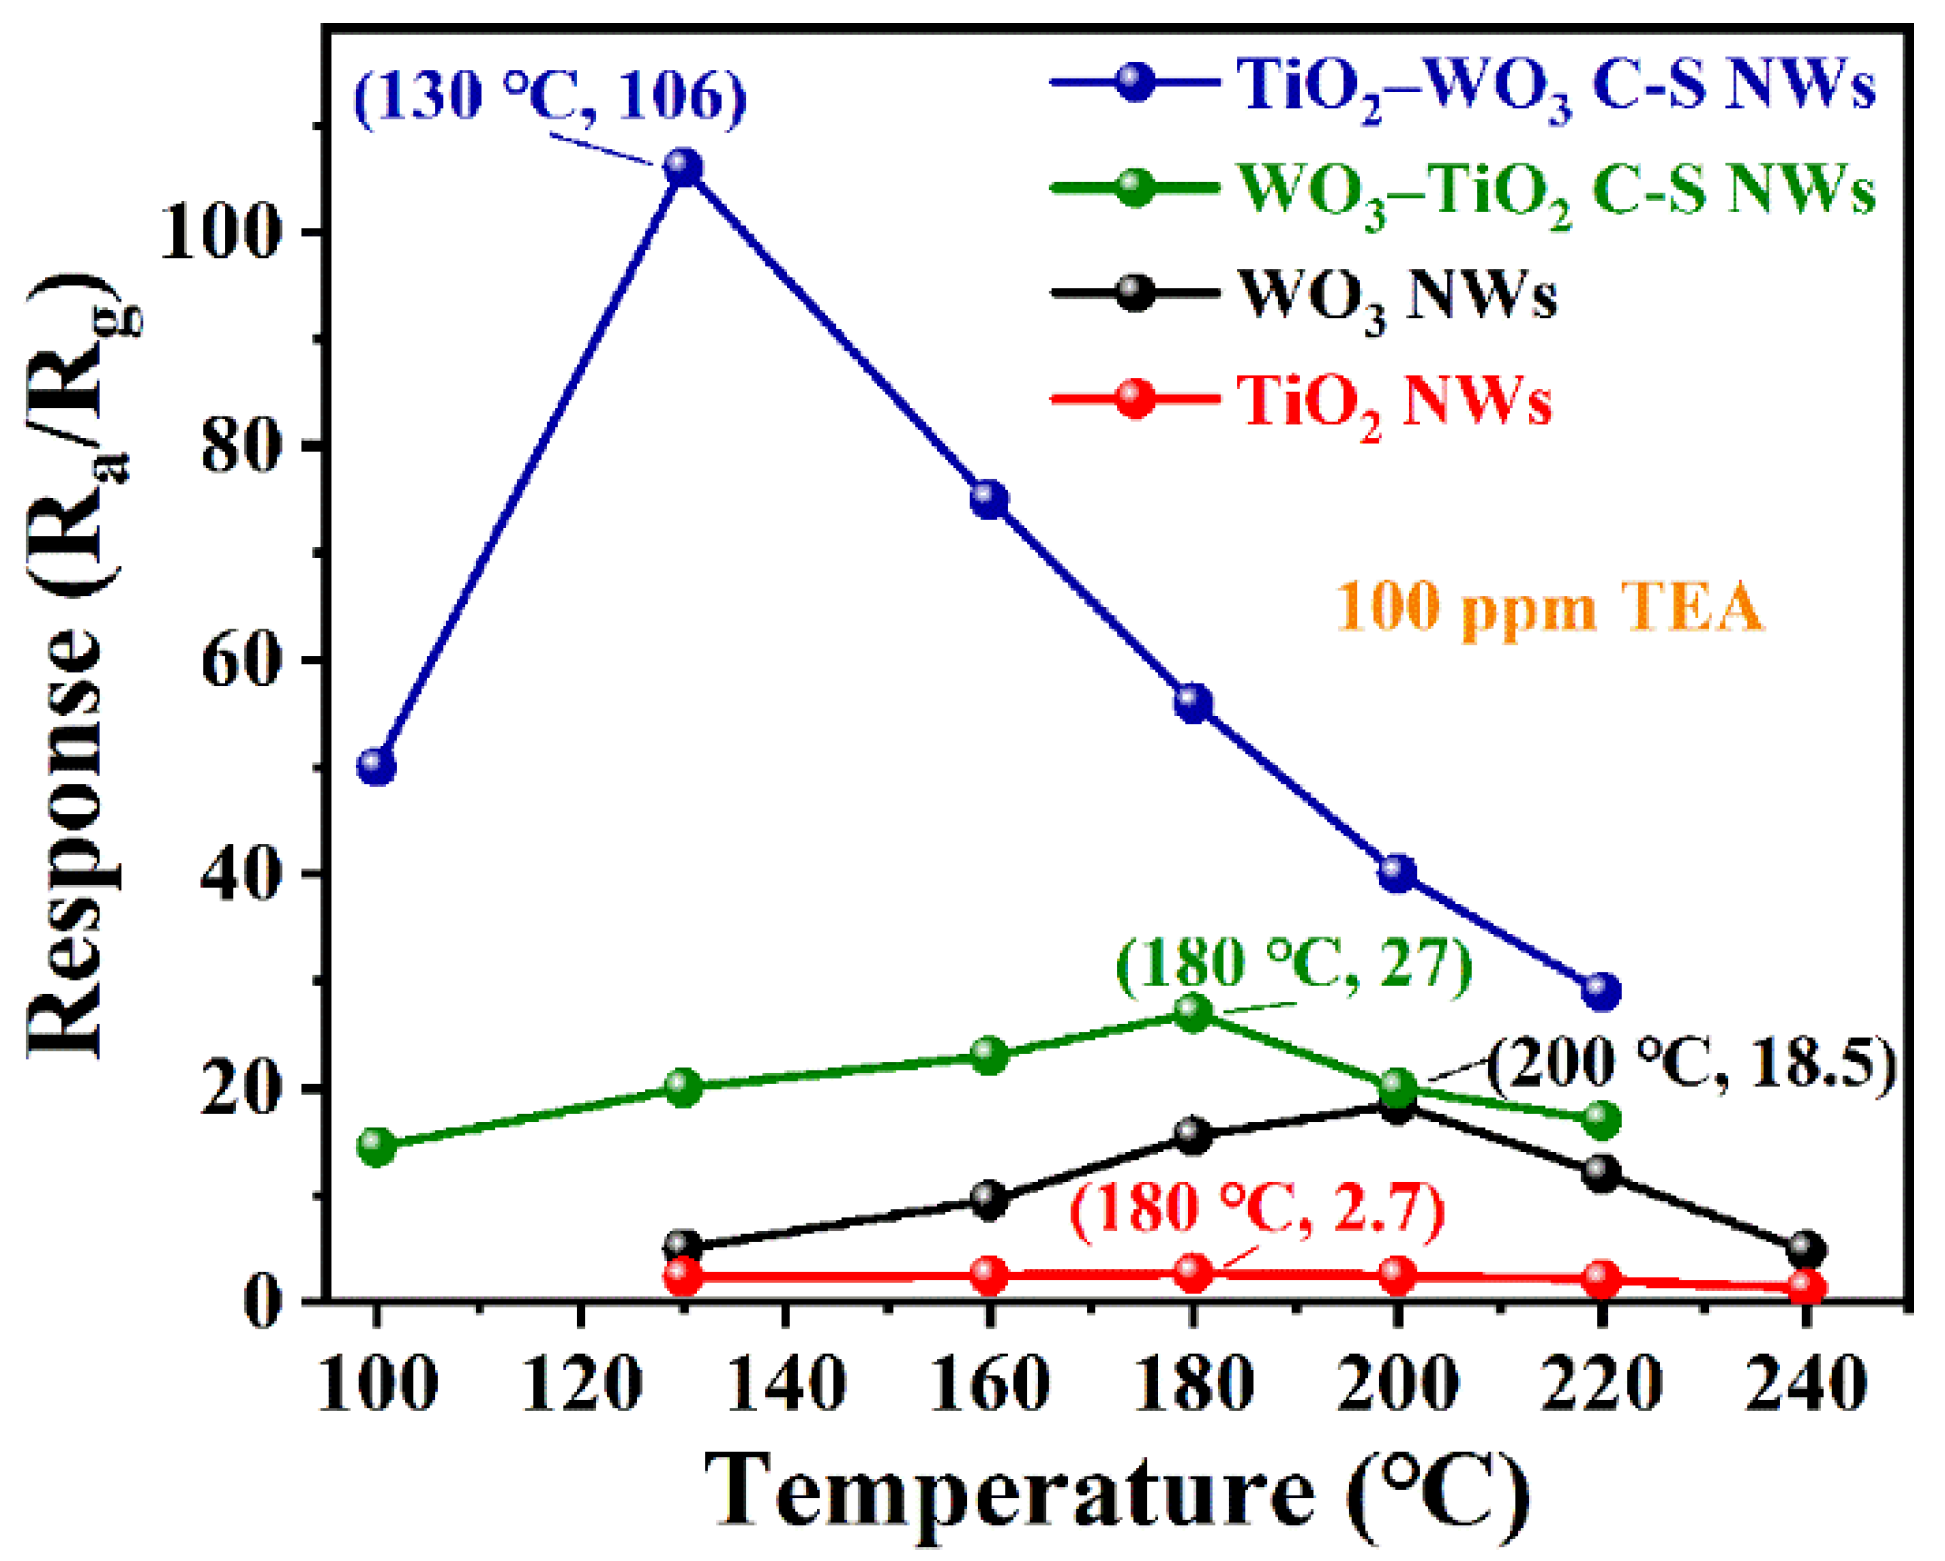
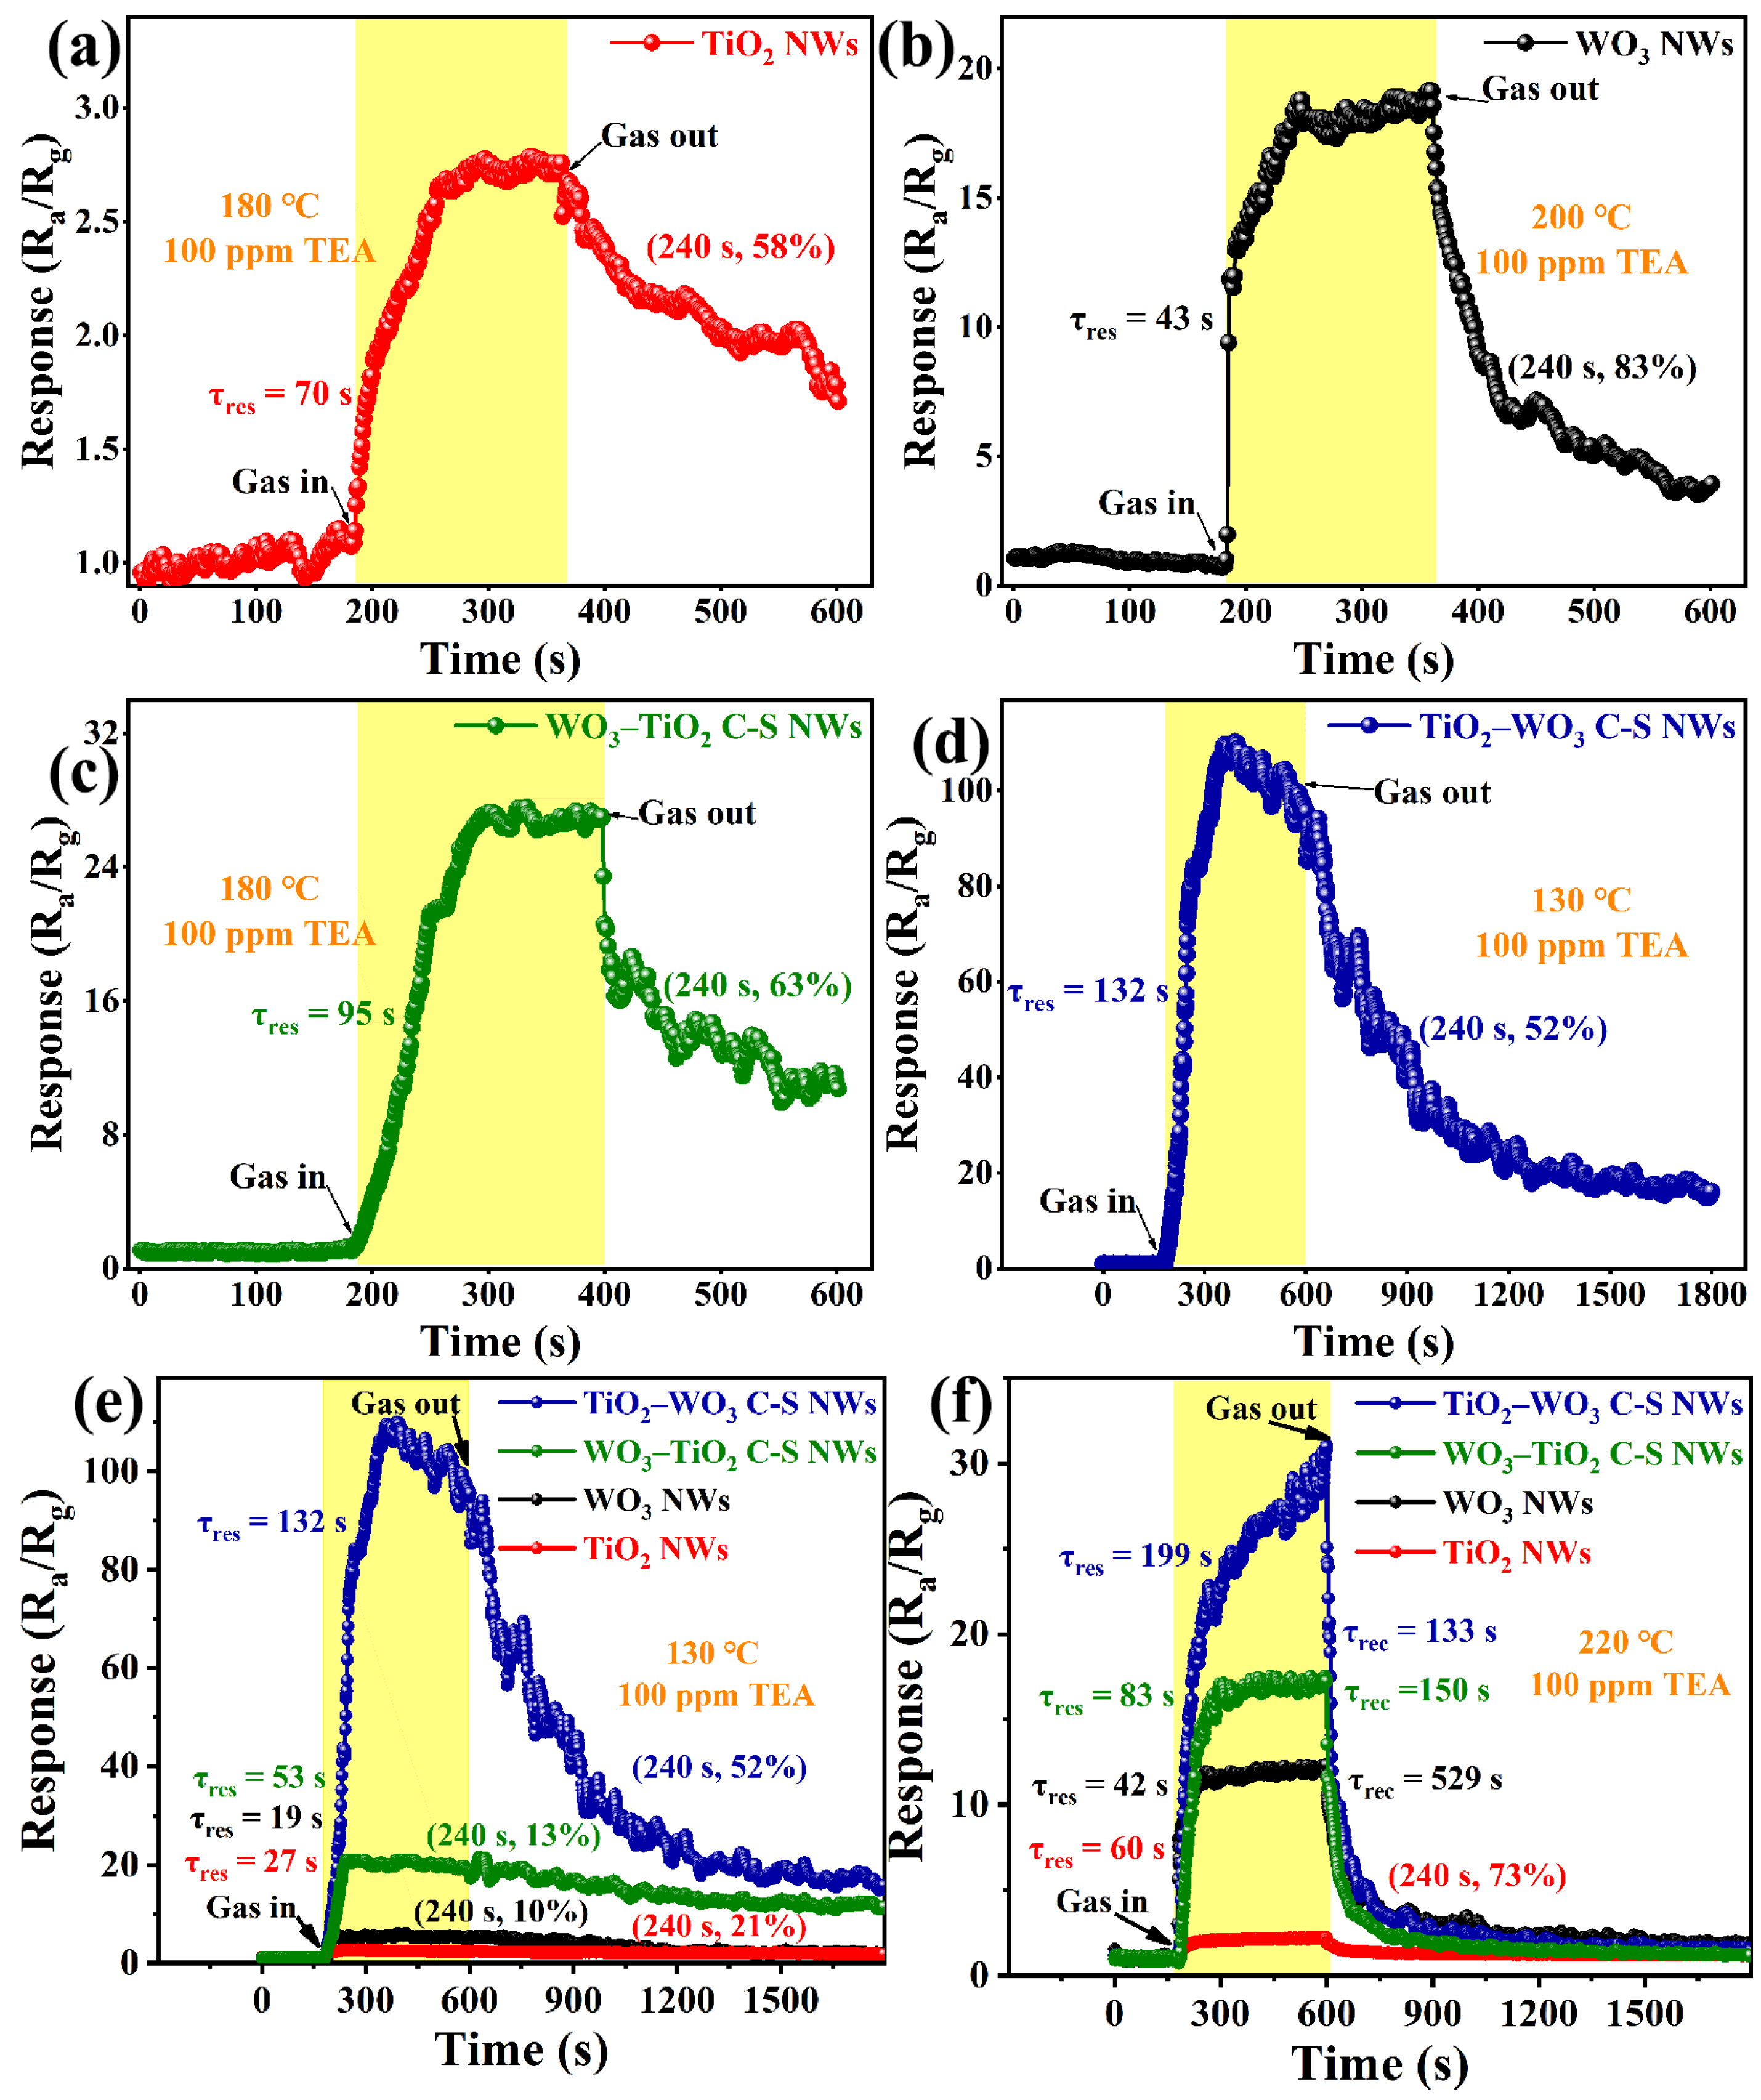
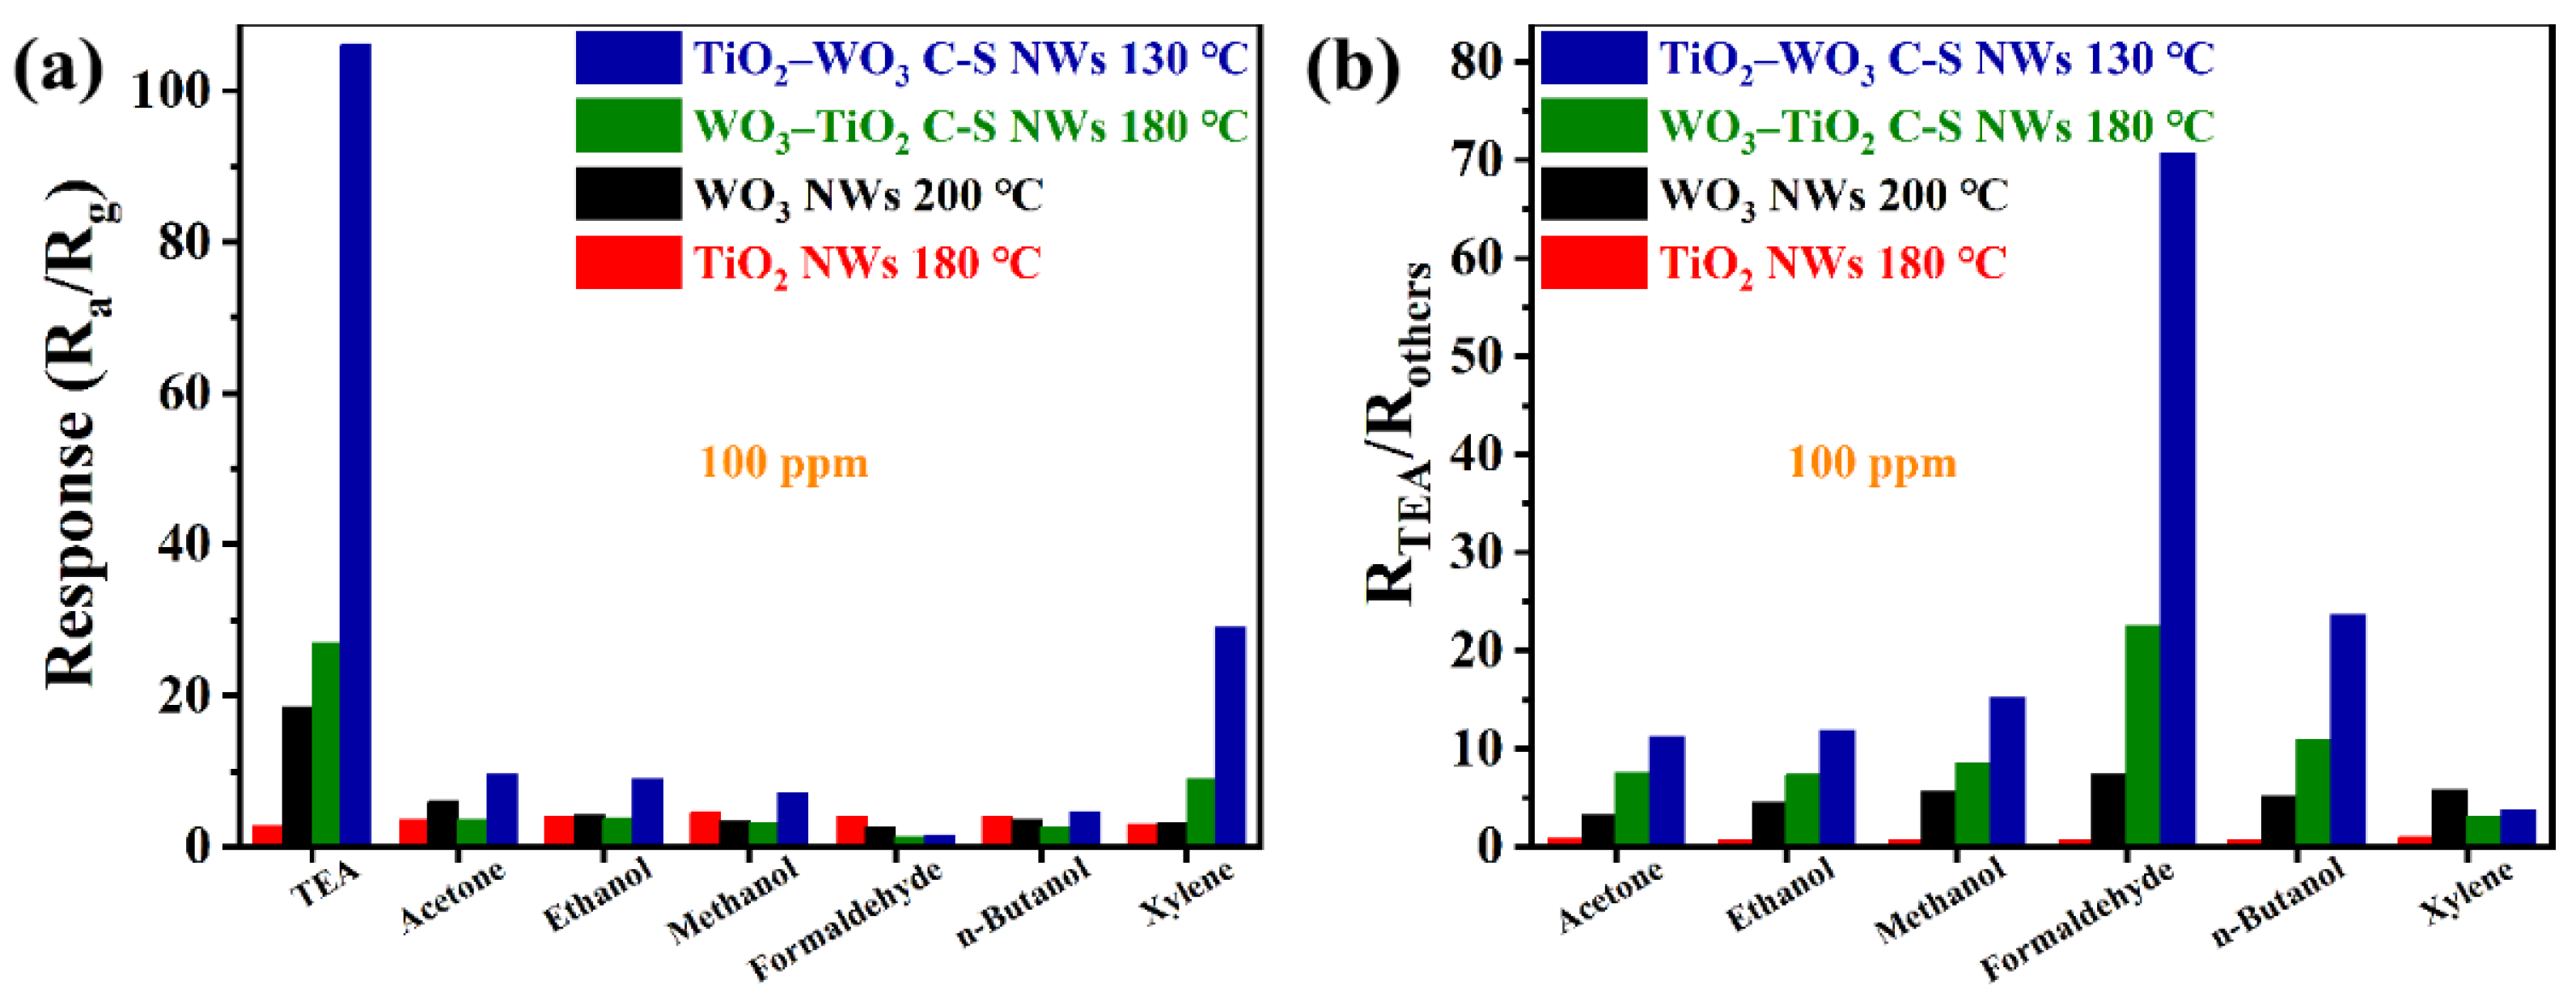
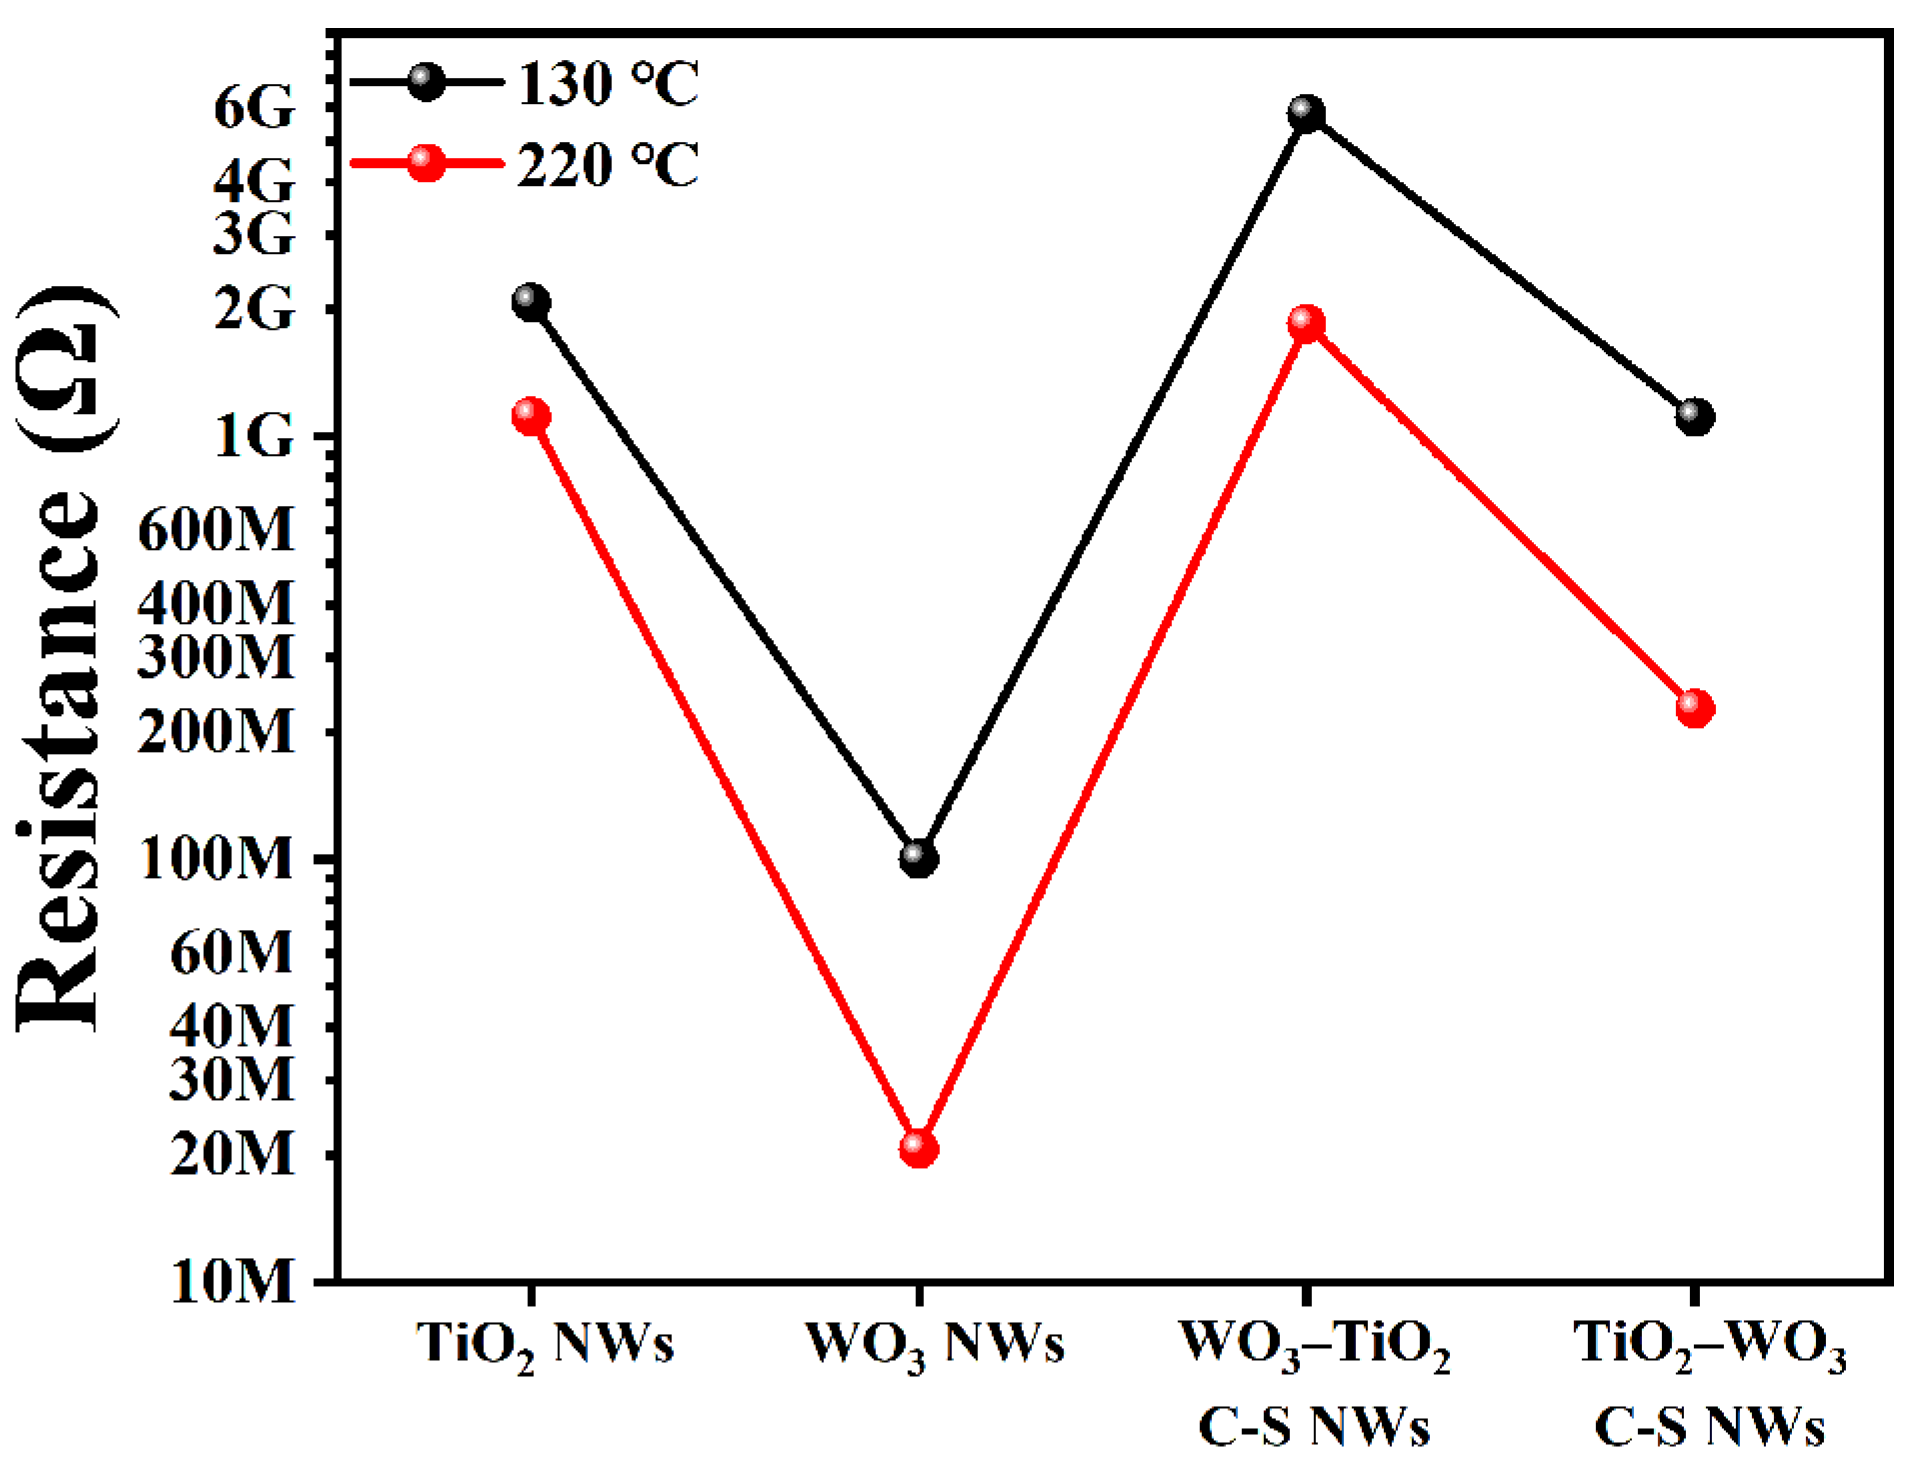
3.2. Gas Sensing Properties

As shown in Figure 5, the response values of the four sensors toward TEA all first rise and then decrease as the operating temperature increases. Temperature has a great influence on the electron mobility and conductivity of semiconductor materials. Generally speaking, gas molecules will overcome the activation energy barrier of the surface reaction. Thus, sensor response will rise as temperature increases. After reaching the optimal operating temperature, a reduced response will be brought by the lower gas adsorption capacity than the desorption capacity [47]. Bare TiO2 NWs exhibit extremely weak response toward TEA, and the maximum response value can only reach 2.7 at 180 °C. After forming a C-S structure, the introduction of the WO3 core material increases the response of the WO3–TiO2 C-S NW sensor toward 100 ppm TEA to 27 at the same operating temperature. For bare WO3 NWs, the highest response of 18.5 toward 100 ppm TEA appears at 200 °C. Analogically, the response of TiO2–WO3 C-S NW sensor toward 100 ppm TEA is significantly enhanced to 106. The optimal working temperature of TiO2–WO3 C-S NW sensor is as low as 130 °C, which is reduced by 70 °C compared with that of the WO3 NW sensor. Obviously, the C-S structure helps to improve the response and also may lower the optimal working temperature of the sensor. Among them, the overall sensing performance of TiO2–WO3 C-S NW sensor is particularly outstanding.
The response–recovery characteristic is another important indicator of gas sensors, and, therefore, the one-cycle response–recovery curves of the four groups of fabricated sensors to TEA at their respective optimal operating temperatures have been provided. In Figure 6a–d, the response time of all four sensors is relatively short and at a considerable level. However, the recovery process of the four sensors appears to be very lengthy, indicating that TEA is difficult to desorb from the materials’ surface at a moderate temperature. From the results, it appears that the desorption rate of TEA is directly related to the operating temperature of the sensor. For example, the recovery percentages of TEA of the TiO2 and WO3–TiO2 C-S NWs in Figure 6a,c are basically equivalent within 240 s at 180 °C. In contrast, the recovery percentages are much better for WO3 NWs at a slightly higher temperature in Figure 6b or much worse for TiO2–WO3 C-S NWs at a much lower temperature in Figure 6d. To eliminate the influence of the temperature variable, the recovery characteristics of the four sensors at the same low (130 °C) or high (220 °C) operating temperatures were compared, and the results are shown in Figure 6e,f, respectively. Apparently, the recovery percentage of TiO2–WO3 C-S NWs, which originally appears very low, leaps to the most prominent position among the four sensors at 130 °C in Figure 6e. Further, the recovery processes of sensors based on WO3 NWs, WO3–TiO2 C-S NWs, and TiO2–WO3 C-S NWs become complete at 220 °C in Figure 6f, and the recovery times for them are 529, 150, and 133 s, respectively. Although TiO2 NWs still cannot achieve a thorough recovery, the recovery ratio increases from 58% at 180 °C to 73% at 220 °C. The results in Figure 6f indicate that the C-S structure exhibits significant advantages in the recovery performance of TEA, and the performance of TiO2–WO3 C-S NWs remains the most prominent. For the sake of data visualization, the curves of the sensors’ resistance over time are also shown in Figure S2a–f in the Supporting Information.
In Figure 7a–d, the responses of the four sensors toward TEA with increasing concentrations grow gradually. Furthermore, scatter plots of response–concentration changes for the four sensors are given in Figure 7e to provide some details. The response growth rate of the TiO2 NWs is too slow, to the extent that its response to TEA up to 200 ppm does not exceed 4. For WO3 NWs, the responses toward TEA within the concentration range of 1 to 20 ppm grow rapidly. However, the responses quickly reach saturation when the concentration of TEA exceeds 20 ppm. For WO3–TiO2 C-S NWs, the responses toward TEA within the concentration range of 1 to 20 ppm grow slowly, which are much lower even than those of the WO3 NWs. Differently, the responses maintain a steady growth and surpass those of WO3 NWs when the concentrations of TEA are no less than 50 ppm. Lastly, the responses of TiO2–WO3 C-S NWs toward TEA keep ahead among the four sensors within the whole test concentration range and are especially noticeable when the concentrations of TEA are larger than 20 ppm. Moreover, the response and recovery parameters of the four sensors to different concentrations of TEA at their respective optimal operating temperatures have been summarized in Table S1 in the Supporting Information. In Figure 7f, the linear response–concentration fitting curves of the bare TiO2 and WO3 NWs are given within the TEA concentration range of 1 to 20 ppm. Within a larger linear interval, the fitting curves of WO3/TiO2 C-S NWs are displayed in Figure 7g. According to the equations RMSnoise (ppm−1) = (R2s/(N − 1))1/2 and LOD = (3 × RMSnoise)/Slope, where R2s is the sum of squares of the standard residuals, RMSnoise is the root mean square deviation of the baseline, and Slope is the slope of the linear fit, the theoretical limit of detection (LOD) of the sensors can be finally calculated [48,49]. As shown in Figure S3 and Tables S2–S6 in the Supporting Information, the LODs of TiO2 NWs, WO3 NWs, WO3–TiO2 C-S NWs, and TiO2–WO3 C-S NWs toward TEA are 363.93, 287.15, 177.12, and 40.86 ppb, respectively. Evidently, the two C-S NWs possess significant advantages in detecting low concentrations of TEA, and TiO2–WO3 C-S NWs still perform the most prominently.
The repeatability of the sensors has also been evaluated, and the results are shown in Figure 8a–d. It should be noted that due to the difficulty of TEA desorption by all four sensors at their respective optimal operating temperatures, for ease of comparison, the times of the recovery processes of each sensor were restricted the same. Before the next response process began, the TEA desorption was accelerated by heating to ensure the sensors were able to restore their original resistance values. Clearly, both the response values and response–recovery properties of the four sensors maintain a dynamic consistency in five continuous test cycles, indicating the good performance repeatability of the prepared sensors.
The responses of the four sensors toward 100 ppm TEA and other typical VOCs at their respective optimal working temperatures were measured. As shown in Figure 9a, except for the TiO2 NWs, the other three sensors all exhibit the highest responses toward TEA compared to other interfering gases. In fact, no target gas was definitely determined for the sensor based on TiO2 NWs, whose responses toward all common gases are too low to be meaningful. For WO3/TiO2 C-S NWs, xylene is the leading interfering gas. In Figure 9b, the other three sensors except TiO2 NWs display the clearest superiority to formaldehyde when detecting TEA. In addition, for all other interfering gases except xylene, the sensor selectivity toward TEA gets increasingly better from WO3 NWs to TiO2–WO3 C-S NWs. Thus, the C-S structure contributes to the enhancement of sensor selectivity toward TEA, and the sensor based on TiO2–WO3 C-S NWs has an outstanding TEA selectivity among the four sensors on the whole.
As is well known, humidity can affect the performance of sensors. Generally speaking, when the humidity of the target gas increases, water molecules will cover the active sites of the sensing material on one hand, and compete with the target gas molecules for adsorption on the other hand, usually serving as electron donors [42,46,50,51,52]. As shown in Figure S4 in the Supporting Information, with the increase in moisture in the test atmosphere, the baseline resistance of the TiO2–WO3 C-S NW sensor in the air rapidly decreases, and the response of the sensor toward TEA is also severely affected. When the relative humidity of the test gas reaches 100% RH, the response of the sensor toward 100 ppm TEA is only equal to 61% of the initial value (sensor response at 30% RH), indicating the adverse effect of water vapor on the performance of the sensor.
The long-term stability of sensors is also an important indicator that determines their practical application prospects. As shown in Figure S5 in the Supporting Information, the response of the TiO2–WO3 C-S NW sensor to 100 ppm TEA remains relatively stable in the early stage of test, but begins to enter a decline zone after half a month. According to calculations, the sensor response to 100 ppm TEA decreases by 7.1% within one month and 20.1% within 73 days. The long-term placement of sensors in air or target gases is equivalent to an aging process, and the active components of the sensing materials will gradually become deactivated compared with those at the fresh preparation stage, and this process is irreversible [45].
In conclusion, TiO2–WO3 C-S NWs perform the best in sensor response, response–recovery properties, detection limit, and selectivity among the four as-prepared sensors. Compared with other reported TEA sensors in Table 2, the TiO2–WO3 C-S NW sensors in this work have significant advantages in working temperature and response, but a disadvantage in sensor recovery performance, which will be the improvement direction for our future work.

3.3. Gas Sensing Mechanism

The surface control model is most commonly used to describe the gas sensing mechanism of MOS-type gas sensors. Oxygen molecules in the air will spontaneously adsorb onto the surface of semiconductor materials. At different temperatures, physisorbed oxygen will capture electrons from the semiconductor conduction band, forming corresponding types of chemisorbed oxygen. The above process determines the initial state of the semiconductor sensing materials in the environment. When the sensor is exposed to the target gas atmosphere, taking TEA as an example, TEA molecules will undergo redox reactions with the chemisorbed oxygen on the surface of the sensing material. The degree of reaction depends on the characteristics of the material and the type of gas. The electrons released during the reaction will return to the semiconductor conduction band, resulting in a change in the conductivity of the sensor. The above process can be briefly summarized using the following equations.
O2(gas) → O2(ads)
O2(ads) + e → O2(ads)   (T < 100 °C)
O2(ads) + e → 2O(ads)  (100 °C ≤ T ≤ 300 °C)
O(ads) + e → O2−(ads)  (T > 300 °C)
2(C2H5)3N(ads) + 43O(ads) → 12CO2 + 15H2O + 2NO2 + 43e
For WO3–TiO2 C-S NWs, due to the lower WF of the TiO2 shell (4.20 eV) compared to that of the WO3 core (5.24 eV), electrons will flow from the shell layer to the core layer (Figure 10a), forming an EDL in the TiO2 shell [39,40]. In addition, oxygen molecules in the air will extract electrons from the shell layer to form chemisorbed oxygen ions, which will further deplete the electrons in the TiO2 shell. Overall, electron transfer in C-S-structured materials needs to cross the homojunction energy barrier at the intersections of the NWs, the heterojunction energy barrier at the C-S interfaces, and the energy barrier formed after oxygen adsorption (Figure 10b), which makes the bulk resistance of WO3–TiO2 C-S NWs (5.8 GΩ at 130 °C, Figure 11) greater than that of the original TiO2 (2.1 GΩ at 130 °C). The situation is exactly the opposite for TiO2–WO3 C-S NWs, where electrons flow from the TiO2 core to the WO3 shell, generating an EAL in the shell layer. Meanwhile, oxygen molecules in the air still extract electrons from the shell layer to form oxygen anions. Considering the extremely high bulk resistance of the TiO2 core itself, the resistance of TiO2–WO3 C-S NWs (1.1 GΩ at 130 °C) appears much larger than that of WO3 NWs (100 MΩ at 130 °C).
Due to the thin shells in Figure 3, the electrons in the TiO2 shell of WO3–TiO2 C-S NWs may be severely depleted. Thus, a greater sensor conductivity variation will happen when an equal or even smaller amount of electrons are injected after WO3–TiO2 C-S NWs are exposed to TEA gas compared to the bare TiO2 situation [57]. This explains why the response of the WO3–TiO2 C-S NWs (27) in Figure 5 has increased to 10 times that of pure TiO2 (2.7). WO3 is a typical acidic oxide that tends to adsorb alkaline gases. The nitrogen atom of TEA acts as a Lewis alkaline site adsorbed by WO3, which is beneficial for the sensor’s ability to produce significant response and selectivity [58]. As shown in Figure 5, pure WO3 (18.5) exhibits a much higher response to TEA compared with TiO2 (2.7). For TiO2–WO3 C-S NWs, the accumulation of more electrons in the WO3 shell can lead to more adsorbed oxygen species participating in the reactions. Therefore, the response of TiO2–WO3 C-S NWs to TEA (106) is the highest among the four sensing materials. However, its response improvement (5.73 times) compared to pure WO3 is still weaker than the above case (10 times) of shell electron depletion.
As reported, for C-S structures, if electrons flow from the core to the shell layer, the recovery speed of the sensor will be faster than that of pure-shell metal oxide due to the increase in shell electrons [33,59]. On the contrary, the recovery speed of C-S materials will become lower. This phenomenon has also been partially reflected in this work, as shown in Figure 6e,f, for example.

4. Conclusions

In summary, C-S NWs with two transposed structures were prepared based on two types of matrix oxides, WO3 and TiO2. The composition and structural characteristics of two types of C-S NWs were successfully confirmed through various means. The gas sensing test results indicated that the two C-S NWs exhibited better sensitivity to TEA compared to pure-shell materials. By combining the WFs of two oxides, the electron flow direction and the resistance changes in the two C-S materials were analyzed, based on which the corresponding sensitive mechanisms were provided. This work provides a novel approach for customizing and optimizing sensing materials to achieve ideal gas sensing performance, expanding the application scope of TiO2-based sensing materials. However, there are still shortcomings in this work, such as the slow recovery speed of the TiO2–WO3 C-S NW sensor due to the decrease in operating temperature, which urgently needs to be addressed in the next step of research. Due to the fast switching speeds of memristors, memristor-based gas sensors, also known as gasistors, can achieve the ultra-fast recovery of sensor parameters at extremely low power consumption [60,61,62]. In addition, TiO2 has received relatively extensive research in memristor-based gas sensors, which undoubtedly provides great inspiration for future plans in this work.

Supplementary Materials

The following supporting information can be downloaded at: https://www.mdpi.com/article/10.3390/chemosensors13020045/s1. Figure S1. The structure diagram of the tubular device used in this work. Figure S2. Resistance curves over time of sensors based on (a) TiO2 NWs, (b) WO3 NWs, (c) WO3–TiO2 C-S NWs, and (d) TiO2–WO3 C-S NWs to 100 ppm TEA at the optimal working temperatures. Resistance curves over time of four sensors to 100 ppm TEA at (e) 130 °C and (f) 220 °C. Figure S3. The fifth order polynomial fitting of (a) TiO2 NWs, (b) WO3 NWs, (c) WO3–TiO2 C-S NWs, and (d) TiO2–WO3 C-S NWs based sensors at baseline before TEA exposure. Figure S4. The influence of humidity on the baseline resistance and response of the TiO2–WO3 C-S NWs sensor. Figure S5. Long-term stability test of TiO2–WO3 C-S NWs sensor. Table S1. The response–recovery characteristics of the four sensors to different concentrations of TEA at their respective optimal operating temperatures. Table S2. The fifth order polynomial fitting data of TiO2 NWs sensor. Table S3. The fifth order polynomial fitting data of WO3 NWs sensor. Table S4. The fifth order polynomial fitting data of WO3–TiO2 C-S NWs sensor. Table S5. The fifth order polynomial fitting data of TiO2–WO3 C-S NWs sensor. Table S6. Calculation of RMSnoise and LOD of four sensors.

Author Contributions

Conceptualization, B.Z. and W.L.; methodology, W.L., X.D. and Y.L.; software, Y.L. and W.L.; validation, B.Z., H.S. (Haitao Song) and Q.L.; formal analysis, W.L. and Q.L.; investigation, B.Z. and Y.N.; resources, B.Z. and H.S. (Hao Shen); data curation, B.Z. and X.D.; writing—original draft preparation, B.Z. and W.L.; writing—review and editing, Q.L. and Y.L.; visualization, B.Z., X.D. and W.L.; supervision, Y.N. and H.S. (Haitao Song); project administration, B.Z. and H.S. (Hao Shen); funding acquisition, B.Z., H.S. (Hao Shen) and Q.L. All authors have read and agreed to the published version of the manuscript.

Funding

This work was supported by the Yangtze River Delta Innovation and Entrepreneurship Joint Carrier Demonstration Project (23002430100), the Wuxi Science and Technology Development Fund Project (K20241036), the National Natural Science Foundation of China (61903159), and the Natural Science Foundation of Jiangsu Province (BK20190617).

Institutional Review Board Statement

Not applicable.

Informed Consent Statement

Not applicable.

Data Availability Statement

The data that support the findings of this study are available from the first author or corresponding authors upon reasonable request.

Conflicts of Interest

Authors Hao Shen and Haitao Song were employed by the company Shanghai Artificial Intelligence Research Institute Co., Ltd. The remaining authors declare that the research was conducted in the absence of any commercial or financial relationships that could be construed as a potential conflict of interest.

References

  1. Yao, L.Q.; Zhao, Z.H.; Chen, C.; Shao, Z.G.; Wu, L. Fabrication of Bi2S3/ZnO nanocomposites for TEA gas sensors operating at room temperature: Towards seafood freshness detection during storage. Microchem. J. 2024, 207, 112239. [Google Scholar] [CrossRef]
  2. Li, X.B.; Hu, X.; Yang, B.; Zheng, L.H.; Ren, Y.Y.; Wang, F.P.; Sun, S.; Wang, Y.J.; Liu, D.N.; Xu, H.H.; et al. Heterostructure engineering of In2O3/ErVO4 hairy curd for high-performance TEA gas sensors. Ceram. Int. 2024, 50, 29590–29602. [Google Scholar] [CrossRef]
  3. Ma, Y.T.; Chen, X.W.; Shi, J.; Zhao, Y.; Wang, Y. The preparation of Bi3+ quantum dots modified SnS nanosheets gas sensor for detecting TEA. Vacuum 2023, 207, 111594. [Google Scholar] [CrossRef]
  4. Liu, J.J.; Zhu, B.C.; Zhang, L.Y.; Fan, J.J.; Yu, J.G. 0D/2D CdS/ZnO composite with n-n heterojunction for efficient detection of triethylamine. J. Colloid Interface Sci. 2021, 600, 898–909. [Google Scholar] [CrossRef] [PubMed]
  5. Zhai, C.B.; Zhu, M.M.; Jiang, L.N.; Yang, T.Y.; Zhao, Q.; Luo, Y.; Zhang, M.Z. Fast triethylamine gas sensing response properties of nanosheets assembled WO3 hollow microspheres. Appl. Surf. Sci. 2019, 463, 1078–1084. [Google Scholar] [CrossRef]
  6. Wang, X.; Han, W.J.; Yang, J.Q.; Jiang, B.; Cheng, P.F.; Wang, Y.L.; Sun, P.; Zhang, H.; Sun, Y.F.; Lu, G.Y. Facet effect on diverse WO3 morphologies and ideal work function for ppb-level triethylamine detection. Sens. Actuators B 2022, 363, 131849. [Google Scholar] [CrossRef]
  7. Wang, D.; Chu, X.F.; Gong, M.L. Gas-sensing properties of sensors based on single-crystalline SnO2 nanorods prepared by a simple molten-salt method. Sens. Actuators B 2006, 117, 183–187. [Google Scholar] [CrossRef]
  8. Li, S.M.; Zhang, W.L.; Wang, C.W.; Li, G. Au nanoparticles decorated ZnIn2S4/WO3 core-shell heterostructures as highly sensitive and selective ethylene glycol gas sensors. J. Alloys Compd. 2024, 998, 175027. [Google Scholar] [CrossRef]
  9. Yan, S.; Yang, F.; Dong, X.H.; Zhang, C.; Xu, X.D.; Chi, Z.T.; Yang, W.; Xie, W.F. Rational construction of α-MoO3@WO3 nanosheets and its triethylamine sensing performances. Ceram. Int. 2024, 50, 14238–14246. [Google Scholar] [CrossRef]
  10. Zhang, S.M.; Zhang, H.; Yao, H.Y.; Wang, P.J.; Zhu, M.; Shi, X.R.; Xu, S.S. Recent advances in metal oxide semiconductor heterojunctions for the detection of volatile organic compounds. Chemosensors 2024, 12, 244. [Google Scholar] [CrossRef]
  11. Hu, K.C.; Cai, Y.H.; Wang, Z.R.; Zhang, Z.W.; Xian, J.Y.; Zhang, C. A review on metal oxide semiconductor-based chemo-resistive ethylene sensors for agricultural applications. Chemosensors 2024, 12, 13. [Google Scholar] [CrossRef]
  12. Guo, J.; Zhang, Y.; Wang, Z.H.; Shu, Y.Q.; He, Z.W.; Zhang, F.; Gao, L.F.; Li, C.; Wang, C.; Song, Y.F.; et al. Tellurium@Selenium core-shell hetero-junction: Facile synthesis, nonlinear optics, and ultrafast photonics applications towards mid-infrared regime. Appl. Mater. Today 2020, 20, 100657. [Google Scholar] [CrossRef]
  13. Li, D.D.; Ren, Z.X.; Fan, Q.; Wang, C.; She, J.B. NIR dual-wavelengths excited upconversion photoluminescence of the core–shell luminescent material for anti-counterfeiting recognition. Microchem. J. 2023, 193, 109213. [Google Scholar] [CrossRef]
  14. Lys, A.; Zabolotnii, V.; Čaplovičová, M.; Tepliakova, I.; Berzins, A.; Sahul, M.; Čaplovič, Ľ.; Pogrebnjak, A.; Iatsunskyi, I.; Viter, R. Core-shell nanofibers of ZnFe2O4/ZnO for enhanced visible-light photoelectrochemical performance. J. Alloys Compd. 2024, 984, 173885. [Google Scholar] [CrossRef]
  15. Covaliu, C.I.; Jitaru, I.; Paraschiv, G.; Vasile, E.; Biriş, S.-Ş.; Diamandescu, L.; Ionita, V.; Iovu, H. Core–shell hybrid nanomaterials based on CoFe2O4 particles coated with PVP or PEG biopolymers for applications in biomedicine. Powder Technol. 2013, 237, 415–426. [Google Scholar] [CrossRef]
  16. Covaliu, C.I.; Paraschiv, G.; Biriş, S.-Ş.; Jitaru, I.; Vasile, E.; Diamandescu, L.; Velickovic, T.C.; Krstic, M.; Ionita, V.; Iovu, H.; et al. Maghemite and poly-dl-alanine based core–shell multifunctional nanohybrids for environmental protection and biomedicine applications. Appl. Surf. Sci. 2013, 285, 86–95. [Google Scholar] [CrossRef]
  17. Rashidi Dafeh, S.; Iranmanesh, P.; Salarizadeh, P. Fabrication, optimization, and characterization of ultra-small superparamagnetic Fe3O4 and biocompatible Fe3O4@ZnS core/shell magnetic nanoparticles: Ready for biomedicine applications. Mater. Sci. Eng. C 2019, 98, 205–212. [Google Scholar] [CrossRef] [PubMed]
  18. Eurov, D.A.; Kirilenko, D.A.; Sharonova, L.V.; Shvidchenko, A.V.; Smirnov, A.N.; Tomkovich, M.V.; Yagovkina, M.A.; Kurdyukov, D.A. Formation of stable microporous core-shell V2O5/SiO2 colloidal particles potential for heterogeneous catalysis. Mater. Today Commun. 2023, 35, 106047. [Google Scholar] [CrossRef]
  19. Ma, Y.S.; Liu, X.L.; Zhao, M.Y.; Du, K.F.; Yin, H.Y.; Mao, X.H.; Wang, D.H. New insights into engineering the core size and carbon shell thickness of Co@C core–shell catalysts for efficient and stable Fenton-like catalysis. J. Colloid Interface Sci. 2023, 634, 521–534. [Google Scholar] [CrossRef] [PubMed]
  20. Srinivas, K.; Chen, Z.; Chen, A.; Ma, F.; Zhu, M.Q.; Chen, Y.F. Fe-Nx sites coupled with core-shell FeS@C nanoparticles to boost the oxygen catalysis for rechargeable Zn-air batteries. J. Energy Chem. 2024, 90, 565–577. [Google Scholar] [CrossRef]
  21. Kour, P.; Deeksha; Kour, S.; Sharma, A.L.; Yadav, K. MoS2-based core-shell nanostructures: Highly efficient materials for energy storage and conversion applications. J. Energy Storage 2023, 66, 107393. [Google Scholar] [CrossRef]
  22. Nair, A.R.; Vetrikarasan, B.T.; Shinde, S.K.; Kim, D.-Y.; Sawant, S.N.; Jagadale, A.D. Bifunctional CuO@CoV layered double hydroxide (LDH) core–shell heterostructure for electrochemical energy storage and electrocatalysis. Fuel 2024, 358, 130217. [Google Scholar] [CrossRef]
  23. Nanda, O.P.; Veeralingam, S.; Badhulika, S. Fabrication of ZnSnO3@In2O3 core-shell based 1D microfiber heterostructure for high energy density asymmetric supercapacitors. J. Alloys Compd. 2023, 969, 172338. [Google Scholar] [CrossRef]
  24. Chen, B.; Guo, H.; Liu, C.J.; Shang, L.; Ye, X.; Chen, L.; Feng, C.H.; Hayashi, K. Molecularly imprinted sol-gel/Au@Ag core-shell nano-urchin localized surface plasmon resonance sensor designed in reflection mode for detection of organic acid vapors. Biosens. Bioelectron. 2020, 169, 112639. [Google Scholar] [CrossRef]
  25. Chen, Y.Q.; Liu, Y.; Ren, J.; Yang, W.Z.; Shang, E.; Ma, K.X.; Zhang, L.H.; Jiang, J.; Sun, X.H. Conformable core-shell fiber tactile sensor by continuous tubular deposition modeling with water-based sacrificial coaxial writing. Mater. Des. 2020, 190, 108567. [Google Scholar] [CrossRef]
  26. Güler, M.; Zengin, A.; Alay, M. Fabrication of glucose bioelectrochemical sensor based on Au@Pd core-shell supported by carboxylated graphene oxide. Anal. Biochem. 2023, 667, 115091. [Google Scholar] [CrossRef]
  27. Katowah, D.F.; Hussein, M.A.; Alam, M.M.; Ismail, S.H.; Osman, O.I.; Sobahi, T.R.; Asiri, A.M.; Ahmed, J.; Rahman, M.M. Designed network of ternary core-shell PPCOT/NiFe2O4/C-SWCNTs nanocomposites. A Selective Fe3+ ionic sensor. J. Alloys Compd. 2020, 834, 155020. [Google Scholar] [CrossRef]
  28. Rafique, N.; Hannan Asif, A.; Hirani, R.a.K.; Wu, H.; Shi, L.; Zhang, S.; Sun, H.Q. Binder free 3D core–shell NiFe layered double hydroxide (LDH) nanosheets (NSs) supported on Cu foam as a highly efficient non-enzymatic glucose sensor. J. Colloid Interface Sci. 2022, 615, 865–875. [Google Scholar] [CrossRef] [PubMed]
  29. Zhou, B.Z.; Li, C.C.; Zhou, Y.F.; Liu, Z.X.; Gao, X.; Wang, X.Q.; Jiang, L.; Tian, M.W.; Zhou, F.L.; Jerrams, S.; et al. A flexible dual-mode pressure sensor with ultra-high sensitivity based on BTO@MWCNTs core-shell nanofibers. Compos. Sci. Technol. 2022, 224, 109478. [Google Scholar] [CrossRef]
  30. Shan, L.X.; Li, Y.; Wang, R.C.; Lian, X.X. Sensing properties of ZnS@ZnO core-shell based triethylamine sensor fabricated using solvothermal and sintering methods. J. Alloys Compd. 2023, 944, 169223. [Google Scholar] [CrossRef]
  31. Zhang, Z.K.; Wu, R.; Chen, X.T.; Mu, Y.; Yang, Z.G.; Liu, Z.Y.; Yue, C.; Dastan, D.; Yin, X.T.; Liu, T. Enhancement of TEA gas-sensitive properties by Mn2O3@In2O3 core-shell structured p-n heterojunction. J. Alloys Compd. 2024, 976, 173340. [Google Scholar] [CrossRef]
  32. Zhang, Y.; Wang, M.; San, X.; Zhang, L.; Wang, N.; Wang, G.; Meng, D.; Shen, Y. Highly selective gas sensors for formaldehyde detection based on ZnO@ZIF-8 core-shell heterostructures. Sens. Actuators B 2024, 398, 134689. [Google Scholar] [CrossRef]
  33. Huang, B.Y.; Zhang, Z.X.; Zhao, C.H.; Cairang, L.M.; Bai, J.L.; Zhang, Y.X.; Mu, X.M.; Du, J.W.; Wang, H.; Pan, X.J.; et al. Enhanced gas-sensing performance of ZnO@In2O3 core@shell nanofibers prepared by coaxial electrospinning. Sens. Actuators B 2018, 255, 2248–2257. [Google Scholar] [CrossRef]
  34. Wang, L.L.; Lou, Z.; Deng, J.N.; Zhang, R.; Zhang, T. Ethanol gas detection using a yolk-shell (core-shell) α-Fe2O3 nanospheres as sensing material. ACS Appl. Mater. Interfaces 2015, 7, 13098–13104. [Google Scholar] [CrossRef]
  35. Liao, Y.L.; Que, W.X.; Jia, Q.Y.; He, Y.C.; Zhang, J.; Zhong, P. Controllable synthesis of brookite/anatase/rutile TiO2 nanocomposites and single-crystalline rutile nanorods array. J. Mater. Chem. 2012, 22, 7937–7944. [Google Scholar] [CrossRef]
  36. Diebold, U. The surface science of titanium dioxide. Surf. Sci. Rep. 2003, 48, 53–229. [Google Scholar] [CrossRef]
  37. Cao, S.; Sui, N.; Zhang, P.; Zhou, T.T.; Tu, J.C.; Zhang, T. TiO2 nanostructures with different crystal phases for sensitive acetone gas sensors. J. Colloid Interface Sci. 2022, 607, 357–366. [Google Scholar] [CrossRef] [PubMed]
  38. Zhou, M.; Liu, Y.Y.; Wu, B.Z.; Zhang, X.T. Different crystalline phases of aligned TiO2 nanowires and their ethanol gas sensing properties. Phys. E Low-Dimens. Syst. Nanostruct. 2019, 114, 113601. [Google Scholar] [CrossRef]
  39. Li, F.; Gao, X.; Wang, R.; Zhang, T. Design of WO3-SnO2 core-shell nanofibers and their enhanced gas sensing performance based on different work function. Appl. Surf. Sci. 2018, 442, 30–37. [Google Scholar] [CrossRef]
  40. Li, F.; Gao, X.; Wang, R.; Zhang, T.; Lu, G.Y. Study on TiO2-SnO2 core-shell heterostructure nanofibers with different work function and its application in gas sensor. Sens. Actuators B 2017, 248, 812–819. [Google Scholar] [CrossRef]
  41. Zhang, B.; Bao, N.; Wang, T.; Xu, Y.; Dong, Y.; Ni, Y.; Yu, P.P.; Wei, Q.F.; Wang, J.; Guo, L.L.; et al. High-performance room temperature NO2 gas sensor based on visible light irradiated In2O3 nanowires. J. Alloys Compd. 2021, 867, 159076. [Google Scholar] [CrossRef]
  42. Zhang, B.; Wang, J.; Yu, P.P.; Guo, L.L.; Xu, Y.; Dong, Y.; Ni, Y.; Ao, J.P.; Wei, Q.F.; Xia, Y. In/Fe cospinning nanowires for triethylamine gas sensing. ACS Appl. Nano Mater. 2022, 5, 9554–9566. [Google Scholar] [CrossRef]
  43. Li, Y.; Zhang, B.Y.; Li, J.; Duan, Z.H.; Yang, Y.J.; Yuan, Z.; Jiang, Y.D.; Tai, H.L. Pd-decorated ZnO hexagonal microdiscs for NH3 sensor. Chemosensors 2024, 12, 43. [Google Scholar] [CrossRef]
  44. Lal, M.; Sharma, P.; Ram, C. Calcination temperature effect on titanium oxide (TiO2) nanoparticles synthesis. Optik 2021, 241, 166934. [Google Scholar] [CrossRef]
  45. Liu, N.; Bu, W.Y.; Zhou, Y.; Zhang, Y.; Chuai, X.H.; Lu, G.Y. Hetero-interface enabled highly responsive acetone gas sensor based on MOF-derived Co3O4/In2O3 composite. Vacuum 2025, 233, 113974. [Google Scholar] [CrossRef]
  46. Kong, D.L.; Hong, B.; Xu, J.C.; Peng, X.L.; Li, J.; Chen, H.W.; Qiu, S.; Zhang, N.; Wang, X.Q. P–n heterojunction construction and interfacial interaction mechanism: NiO/In2O3 formaldehyde gas sensors with excellent sensitivity and selectivity. Appl. Surf. Sci. 2025, 688, 162442. [Google Scholar] [CrossRef]
  47. Zhang, H.Y.; Tao, X.W.; Yi, L.N.; Zhao, Z.G.; Yang, Q. Transamidation and decarbonylation of n-phthaloyl-amino acid amides enabled by palladium-catalyzed selective C–N bond cleavage. J. Org. Chem. 2022, 87, 231–242. [Google Scholar] [CrossRef] [PubMed]
  48. Liu, W.; Gu, D.; Li, X.G. Detection of Ppb-level NO2 using mesoporous ZnSe/SnO2 core-shell microspheres based chemical sensors. Sens. Actuators B 2020, 320, 128365. [Google Scholar] [CrossRef]
  49. Wu, J.; Feng, S.L.; Li, Z.; Tao, K.; Chu, J.; Miao, J.M.; Norford, L.K. Boosted sensitivity of graphene gas sensor via nanoporous thin film structures. Sens. Actuators B 2018, 255, 1805–1813. [Google Scholar] [CrossRef]
  50. Sun, C.X.; Liu, H.Y.; Shao, J.K.; Pan, G.F.; Yang, X.L.; Wang, M.J.; Dong, J.Y.; Zhu, M.Y.; Qi, Y.H. Au-loaded Zn2SnO4/SnO2/ZnO nanosheets for fast response and highly sensitive TEA gas sensors. Sens. Actuators B 2023, 376, 132951. [Google Scholar] [CrossRef]
  51. Wang, Y.; Xiao, D.K.; Zhang, D.X.; Liu, Y.M.; Sun, M.L.; Sun, M.J.; Li, J. Construction of Ag2O/WO3-based hollow microsphere p-n heterojunction for continuous detection of ppb-level H2S gas sensor. J. Alloys Compd. 2024, 1003, 175735. [Google Scholar] [CrossRef]
  52. Duan, X.H.; Jiang, Y.D.; Liu, B.H.; Duan, Z.H.; Zhang, Y.J.; Yuan, Z.; Tai, H.L. Enhancing the carbon dioxide sensing performance of LaFeO3 by Co doping. Sens. Actuators B 2024, 402, 135136. [Google Scholar] [CrossRef]
  53. Pan, M.Q.; Shi, Z.M.; Liu, J.Z.; Wang, Y.J. Study on the process of micro-arc oxidation TiO2 film for rapid detection of triethylamine. Mater. Sci. Semicond. Process. 2022, 146, 106679. [Google Scholar] [CrossRef]
  54. Zhang, B.; Li, Y.W.; Luo, N.; Xu, X.T.; Sun, G.; Wang, Y.; Cao, J.L. TiO2/ZnCo2O4 porous nanorods: Synthesis and temperature-dependent dual selectivity for sensing HCHO and TEA. Sens. Actuators B 2020, 321, 128461. [Google Scholar] [CrossRef]
  55. Zhai, C.B.; Luo, Z.B.; Liang, X.; Song, X.Y.; Zhang, M.Z. A superior selective and anti-jamming performance triethylamine sensing sensor based on hierarchical WO3 nanoclusters. J. Alloys Compd. 2021, 857, 157545. [Google Scholar] [CrossRef]
  56. Ma, Q.; Li, H.; Liu, Y.; Liu, M.L.; Fu, X.H.; Chu, S.S.; Li, H.; Guo, J. Facile synthesis of flower-like α-Fe2O3/ZnFe2O4 architectures with self-assembled core-shell nanorods for superior TEA detection. Curr. Appl. Phys. 2021, 21, 161–169. [Google Scholar] [CrossRef]
  57. Mirzaei, A.; Kim, J.-H.; Kim, H.W.; Kim, S.S. How shell thickness can affect the gas sensing properties of nanostructured materials: Survey of literature. Sens. Actuators B 2018, 258, 270–294. [Google Scholar] [CrossRef]
  58. Hu, Q.; He, J.Q.; Chang, J.Y.; Gao, J.M.; Huang, J.H.; Feng, L. Needle-shaped WO3 nanorods for triethylamine gas sensing. ACS Appl. Nano Mater. 2020, 3, 9046–9054. [Google Scholar] [CrossRef]
  59. Li, F.; Gao, X.; Wang, R.; Zhang, T.; Lu, G.Y.; Barsan, N. Design of core–shell heterostructure nanofibers with different work function and their sensing properties to trimethylamine. ACS Appl. Mater. Interfaces 2016, 8, 19799–19806. [Google Scholar] [CrossRef] [PubMed]
  60. Ahmad, I.; Lee, D.; Chae, M.; Kim, H.D. Advanced recovery and enhanced humidity tolerance of CNTs gas sensor using a filament heater. Chem. Eng. J. 2024, 496, 154014. [Google Scholar] [CrossRef]
  61. Vidiš, M.; Plecenik, T.; Moško, M.; Tomašec, S.; Roch, T.; Satrapinskyy, L.; Grančič, B.; Plecenik, A. Gasistor: A memristor based gas-triggered switch and gas sensor with memory. Appl. Phys. Lett. 2019, 115, 093504. [Google Scholar] [CrossRef]
  62. Ali, M.; Lee, D.; Ahmad, I.; Kim, H.D. Recent progress in memristor-based gas sensors (Gasistor; gas sensor + memristor): Device modeling, mechanisms, performance, and prospects. Sens. Actuators Rep. 2025, 9, 100269. [Google Scholar] [CrossRef]
Figure 1. XRD patterns of TiO2 NWs, WO3 NWs, WO3–TiO2 C-S NWs, and TiO2–WO3 C-S NWs.
Chemosensors 13 00045 g001
Figure 2. FESEM images under different magnifications of (ac) TiO2 NWs, (df) WO3 NWs, (gi) WO3–TiO2 C-S NWs, and (jl) TiO2–WO3 C-S NWs.
Chemosensors 13 00045 g002
Figure 3. TEM images under different resolutions of (ad) WO3–TiO2 C-S NWs and (eh) TiO2–WO3 C-S NWs.
Chemosensors 13 00045 g003
Figure 4. (a) XPS full spectra of four products; high-resolution Ti 2p spectra of (b) TiO2 NWs, (c) WO3–TiO2 C-S NWs, and (d) TiO2–WO3 C-S NWs; high-resolution W 4f spectra of (e) WO3 NWs, (f) WO3–TiO2 C-S NWs, and (g) TiO2–WO3 C-S NWs; high-resolution O 1s spectra of (h) TiO2 NWs, (i) WO3 NWs, (j) WO3–TiO2 C-S NWs, and (k) TiO2–WO3 C-S NWs.
Chemosensors 13 00045 g004
Figure 5. Response curves of sensors based on TiO2 NWs, WO3 NWs, WO3–TiO2 C-S NWs, and TiO2–WO3 C-S NWs to 100 ppm TEA at different temperatures.
Chemosensors 13 00045 g005
Figure 6. (a) Response–recovery curves of sensors based on (a) TiO2 NWs, (b) WO3 NWs, (c) WO3–TiO2 C-S NWs, and (d) TiO2–WO3 C-S NWs to 100 ppm TEA at their respective optimal working temperatures. Comparison of response–recovery properties of four sensors to 100 ppm TEA at (e) 130 °C and (f) 220 °C.
Chemosensors 13 00045 g006
Figure 7. Sensing tests of sensors based on (a) TiO2 NWs, (b) WO3 NWs, (c) WO3–TiO2 C-S NWs, and (d) TiO2–WO3 C-S NWs to TEA under the set concentration gradients at their respective optimal working temperatures. (e) Response–concentration correlation curves of our four sensors. Linear response–concentration fitting curves of (f) TiO2 and WO3 NWs and (g) WO3/TiO2 C-S NWs to TEA at their respective optimal operating temperatures.
Chemosensors 13 00045 g007
Figure 8. Cyclic test curves of sensors based on (a) TiO2 NWs, (b) WO3 NWs, (c) WO3–TiO2 C-S NWs, and (d) TiO2–WO3 C-S NWs to 100 ppm TEA at their respective optimal working temperatures.
Chemosensors 13 00045 g008
Figure 9. (a) The responses of the four sensors to 100 ppm of different kinds of VOCs at their respective optimal operating temperatures. (b) A comparison of the response ratios of TEA to other interfering VOCs for the four sensors.
Chemosensors 13 00045 g009
Figure 10. (a) Energy band diagrams of TiO2 and WO3. (b) Types and variations of energy barriers in TiO2–WO3 C-S NWs.
Chemosensors 13 00045 g010
Figure 11. A comparison of the four prepared materials’ resistances at the same temperature.
Chemosensors 13 00045 g011
Table 1. Holistic fitting results of O 1s XPS spectra of four as-synthesized samples.
Mater.Oxy.B.E. (eV)Perc. (%)OV + OC (%)
TiO2 NWsOL (Ti–O)529.772.7627.24
OV (vacancy)530.4721.39
OC (chemisorbed)531.735.85
WO3 NWsOL (W–O)530.3963.9136.09
OV (vacancy)530.9230.49
OC (chemisorbed)532.585.60
WO3–TiO2 C-S NWsOL (Ti–O and W–O)530.2551.7648.24
OV (vacancy)530.7630.05
OC (chemisorbed)531.4618.19
TiO2–WO3 C-S NWsOL (Ti–O and W–O)530.2252.6647.34
OV (vacancy)530.7129.07
OC (chemisorbed)531.6118.27
Mater.: materials; Oxy.: oxygen species; B.E.: binding energy; Perc.: relative percentage.
Table 2. A comparison of the performance of the TiO2–WO3 C-S NWs-based sensor in this work with other TEA gas sensors.
Mater.Temp. (°C)Conc. (ppm)Res.τresrecov (s)Ref.Y.
TiO2 film2251007.25/52[53]2022
TiO2/ZnCo2O4 porous nanorods220100159/77[54]2020
WO3 nanoclusters280501371.5/1275[55]2021
WO3 hollow microspheres22050161.5/22[5]2019
WO3 microflowers32510061.8-/-[6]2022
Fe2O3@ZnFe2O4280100141-/-[56]2021
ZnS@ZnO20010074.653/176[30]2023
Mn2O3@In2O31801004779/24[31]2024
TiO2–WO3 C-S NWs130100106132/>1200this work-
Mater.: materials; Temp.: operating temperature; Conc.: gas concentration; Res.: response; τresrecov: response–recovery time; Ref.: references; Y.: publication year.
Disclaimer/Publisher’s Note: The statements, opinions and data contained in all publications are solely those of the individual author(s) and contributor(s) and not of MDPI and/or the editor(s). MDPI and/or the editor(s) disclaim responsibility for any injury to people or property resulting from any ideas, methods, instructions or products referred to in the content.

