Article

NO2 Detection Using Hierarchical WO3 Microflower-Based Gas Sensors: Comprehensive Study of Sensor Performance

Department of Physics and Mathematics, São Paulo State University (UNESP), Araraquara 14800-060, SP, Brazil
*
Author to whom correspondence should be addressed.
Chemosensors 2025, 13(11), 390; https://doi.org/10.3390/chemosensors13110390
Submission received: 19 September 2025 / Revised: 30 October 2025 / Accepted: 31 October 2025 / Published: 6 November 2025
(This article belongs to the Special Issue Functional Nanomaterial-Based Gas Sensors)

Abstract

Monitoring nitrogen dioxide (NO2) in various scenarios is crucial due to its significant environmental impact as a hazardous gas which is emitted by several industrial sectors. This study reports the optimized synthesis of WO3 flower-like structures using the microwave-assisted hydrothermal method under various experimental conditions, resulting in the optimized sample designated MF-WO3-K2. Structural, morphological, and chemical characterizations revealed that WO3 microflowers (MF-WO3-K2) exhibit a hexagonal crystalline phase, a bandgap of 2.4 eV, and a high specific surface area of 61 m2/g. The gas-sensing performance of WO3 microflowers was investigated by electrical measurements of six similarly fabricated MF-WO3-K2 sensors. The MF-WO3-K2 sensors demonstrated a remarkable sensor signal of 225 for 5 ppm NO2 at 150 °C and response/recovery times of 14.5/2.4 min, coupled with outstanding selectivity against potential interfering gases such as CO, H2, C2H2, and C2H4. Additionally, the sensors achieved a low detection limit of 65 ppb for NO2 at 150 °C. The exceptional sensing properties of WO3 microflowers are attributed to the abundance of active sites on the surface, large specific surface area, and the presence of pores in the material that facilitate the diffusion of NO2 molecules into the structure. Overall, the WO3 microflowers demonstrate a promising ability to be used as a sensitive layer in high-performance chemiresistive gas sensors due to their high sensor performance and good reproducibility for NO2 detection.

Graphical Abstract

1. Introduction

Industrial and technological progress has promoted rapid social advancements across numerous areas. However, the gas emissions from industrial waste have simultaneously led to environmental pollution and degraded air quality. Among these gases, NO2 is a polluting and toxic compound that can contribute to the formation of photochemical smog and acid rain when it reacts with atmospheric water vapor. Additionally, NO2 can adversely affect human health, even at parts per million (ppm) levels, impacting the respiratory and nervous systems. The Conference on Industrial Hygiene established tolerable short-term and long-term exposure levels to NO2 for humans: 5 ppm for 15 min and 3 ppm for 8 h, respectively [1]. Meanwhile, the World Health Organization (WHO) guideline set a limit of 0.1 ppm for 1 h of exposure to NO2 [2].
Gas sensors based on semiconducting metal oxides (SMOx) have been extensively studied, and the findings reveal their great potential for application in monitoring systems for industrial processes [3] automotive emissions [4], and human health tracking [5,6]. Recent advances in NO2 sensing have focused on both n-type (ZnO, SnO2, In2O3, TiO2, WO3) and p-type (CuO, NiO, Co3O4) metal oxide semiconductors (MOS), which have demonstrated high sensitivity, fast response, and potential for room-temperature operation. In particular, n-type MOS materials such as ZnO nanowalls, SnO2 nanotubes, mesoporous In2O3, and TiO2 nanoparticles exhibit short response/recovery times, low detection limits (down to ppb levels), and enhanced performance due to large surface areas and abundant defect sites that facilitate NO2 adsorption and charge transfer. Similarly, p-type oxides including CuO, NiO, and Co3O4 show promising results, mainly attributed to their hierarchical and porous morphologies, which promote efficient gas diffusion and high surface reactivity. Despite these significant advances, challenges persist in achieving high selectivity, long-term stability, and resistance to environmental cross-sensitivity. These limitations continue to drive efforts toward heterojunction engineering, surface functionalization, and composite nanostructures aimed at developing reliable, low-power NO2 sensors suitable for practical air-quality monitoring. [7]
SnO2 is widely recognized as a benchmark material for gas sensing applications; however, WO3 has demonstrated superior potential as a sensing element in the active layers of SMOx sensors [1,8,9,10]. WO3 is an alternative n-type semiconductor to SnO2 with several advantages, including low toxicity, cost-effectiveness, scalability for miniaturization, and good performance for real-time sensing [11]. The benefits of the material include an enhanced surface-to-volume ratio, the ability to modulate band structure, and increased surface reactivity, which favors oxygen adsorption from the atmosphere and enables efficient redox reactions with target gas molecules [12]. Several WO3-based nanomaterials, each presenting unique characteristics such as surface area, optical bandgap, and crystalline structure, have been examined for gas sensing, with particular emphasis on NO2 detection. These materials include porous and hollow spherical architectures [13,14,15], nanowires [16], nanorods [17], nanoplates [18], and surface-functionalized arrangements [19]. Despite the extensive number of studies on WO3-based materials for gas-sensing applications, this material remains a topic of considerable scientific interest, with many recent works still being published in this field [20,21,22,23,24,25,26,27,28,29,30,31]. Recently, we have reported the synthesis of WO3 nanofibers via the electrospinning technique and their application as gas sensing elements. This material achieved exceptional sensor response for NO2 detection, coupled with high selectivity against potential interferents such as H2 and CO [10].
Hierarchical structures, composed of tiny nanocrystals as building blocks, have attracted significant attention due to their shorter gas diffusion length, higher charge carrier mobility, and relatively larger specific surface area compared to agglomerated nanoparticles. Consequently, the development of 3D hierarchical micro- and nanostructures offers promising alternative materials for manufacturing efficient gas-sensing devices. Several studies have reported the synthesis of WO3 nanostructures using various chemical and physical methods, including solvothermal and hydrothermal techniques [32,33], chemical bath deposition [34], chemical vapor deposition [35], RF sputtering [36], and the colloidal chemical method [37]. The microwave-assisted hydrothermal method (MAHM) has advantages over the conventional hydrothermal approach, such as higher yield, shorter synthesis time, reduced solvent usage [38,39], and improved control over morphology and crystalline structure [40]. The sensor performance of WO3 can be enhanced by adjusting the synthesis parameters to refine its morphology, resulting in an effective response to target gases [41]. In particular, hierarchical flower-like structures prepared via solvothermal and hydrothermal methods have shown promising results in detecting multiple gases, including NO2 [1,32,42,43,44,45,46].
Although numerous studies have reported the synthesis of WO3 morphologies via hydrothermal routes, the microwave-assisted hydrothermal method (MAHM) enables faster synthesis with tunable morphological and structural properties, resulting in enhanced gas-sensing performance. Most previous reports have focused either on synthesis or on sensor application; in contrast, our study integrates both aspects, offering a comprehensive understanding that may guide future developments. Furthermore, the use of self-heating devices provides a promising strategy for compact and integrable gas sensor systems, in contrast to conventional externally heated configurations.
This work presents the gas sensing performance of WO3 flower-like microstructures synthesized via the microwave-assisted hydrothermal method. The morphological and crystalline characteristics of the microflowers, prepared under several synthesis parameters, were investigated using appropriate techniques. The gas sensing performance was evaluated for detecting several target gases, such as NO2, CO, H2, C2H2, and C2H4, at different operating temperatures (ranging from 100 to 300 °C) using a self-heating system. Key performance metrics, including sensor signal, response/recovery time, selectivity, limit of detection, and reproducibility, were determined. Based on the results, a conduction mechanism related to the reception and transduction phenomena occurring on the surface of the hierarchical WO3 structures was proposed.

2. Materials and Methods

2.1. Synthesis of WO3 Microflowers by the Microwave-Assisted Hydrothermal Method

The synthesis of WO3 microflowers was carried out in five steps: (I) 1.0 g of tungstic acid (H2WO4, 99% purity, Sigma Aldrich, St. Louis, MO, USA) was dissolved in 10 mL of hydrogen peroxide (H2O2, 30%) for 30 min using an ultrasonic bath; (II) 2.0 g of potassium sulfate (K2SO4, 99% purity, Synth, Rio Verde, Brazil) was dissolved in 40 mL of deionized water under vigorous stirring until a homogeneous solution was obtained; (III) the solutions from steps (I) and (II) were mixed, followed by the addition of 20 mL of a 2M hydrochloric acid solution (HCl); (IV) the resulting solution from step (III) was placed in a Teflon reactor, and the synthesis was conducted using a modified microwave system (Panasonic, Kadoma-shi, Japan; model Piccolo Style NN-ST341WRUK, 850 Watts) at 150 °C for 30 min with a heating rate of 10 °C/min; (V) the as-synthesized material was washed with deionized water and centrifuged at 10,000 rpm, followed by drying at 80 °C for 12 h. Subsequently, a heat treatment at 400 °C in air was performed with heating and cooling rates of 10 °C/min. The resulting material was named MF-WO3-K2. The influence of the synthesis parameters on the WO3 materials was studied by varying the amount of K2SO4, HCl concentration, and synthesis time. The experimental parameters were as follows:
(a)
Different amounts of K2SO4 (0 g, 1 g, 2 g, 3 g, and 4 g; referred to as MF-WO3-K0, MF-WO3-K1, MF-WO3-K2, MF-WO3-K3, and MF-WO3-K4, respectively) were used. The HCl concentration was 3M, and the synthesis time was 30 min.
(b)
Different HCl concentrations (0 M, 1 M, 2 M, 3 M, and 4 M; referred to as MF-WO3-H0, MF-WO3-H1, MF-WO3-H2, MF-WO3-H3, and MF-WO3-H4, respectively) were tested. The amount of K2SO4 used was 2 g, and the synthesis time was 30 min.
(c)
Different synthesis times (15 min, 30 min, 60 min, 90 min, and 120 min; referred to as MF-WO3-T15, MF-WO3-T30, MF-WO3-T60, MF-WO3-T90, and MF-WO3-T120, respectively) were examined. The amount of K2SO4 used was 2 g, and the HCl concentration was 3 M.

2.2. Structural, Morphological, and Thermal Characterization of the WO3 Microflowers

The crystallinity of the synthesized materials was analyzed using X-ray diffraction (XRD; Rigaku, Akishima-shi, Japan, Rint 2000) with Cu radiation and Raman spectroscopy (Horiba Jobin Yvon, Villeneuve d’Ascq, France, model Lab Ram HR) with a 632 nm excitation source. The optical bandgap was estimated by ultraviolet-visible spectroscopy (UV-Vis; Lambda 1050, PerkinElmer, Waltham, MA, USA). The specific surface area and pore size distribution were determined through the N2 adsorption/desorption experiments using the Brunauer-Emmett-Teller (BET) method (Micromeritics instrument, Norcross, GA, USA, model ASAP 2000). Thermogravimetric analysis (TG; TA Instruments, New Castle, DE, USA, model SDT 2960) was performed to monitor mass changes in the as-synthesized material over a temperature range of 25 °C to 500 °C, with a heating rate of 10 °C/min. Morphological and structural characterizations were conducted using field-emission scanning electron microscopy (FE-SEM; JEOL, Akshima, Japan, model JSM-7500F), dual-beam microscopy (FIB-SEM; FEI, Eindhoven, The Netherlands, model Helios NanoLab 600i), and high-resolution transmission electron microscopy (HRTEM, Philips, Eindhoven, The Netherlands, model CM200).

2.3. Methods for Gas Sensor Measurements

The sensor devices were fabricated by dropping a solution containing WO3 microflowers dispersed in isopropyl alcohol (30 mg/mL) onto alumina substrates coated with interdigitated platinum electrode arrays (200 μm Pt fingers spaced 150 μm apart). 200 μL of the solution was used, distributed in 10 μL aliquots. On the opposite side of the substrate, a platinum circuit was used to heat the sensors within an operating temperature range of 100 °C to 300 °C. Gas sensing measurements were conducted in a stainless-steel chamber by monitoring the electrical resistance of the materials using a multichannel system with a data acquisition unit (Agilent, Santa Rosa, CA, USA; model 34972A). Additionally, synthetic dry air was used as the baseline gas, the analyte gases (NO2, H2, CO, C2H2, and C2H4) were diluted in synthetic dry air to a concentration of 100 ppm, and the gases were introduced into the chamber using mass-flow controllers (MFC; MKS, Andover, MA, USA, model GV50A). The sensors were initially equilibrated in dry air for 12 h, followed by exposures to several concentrations (ranging from 2 to 100 ppm) of NO2, H2, CO, C2H2, and C2H4 in 20 min cycles. After each exposure, 60 min dry air cycles were performed, maintaining a constant total gas flow of 100 sccm throughout all the experiments. The sensor signals were calculated using the following equations:
S o x i = R g a s R a i r
S r e d = R a i r R g a s ,
where S o x i and S r e d represent the sensor signals for oxidizing and reducing gases, respectively. R g a s and R a i r correspond to the electrical resistance of the materials in the presence of the analytes and dry air, respectively. In addition, the response time and recovery time were calculated. The response time corresponds to the time required to reach 90% of the maximum resistance in the presence of the analyte gas. The recovery time is defined as the time needed to reach 90% of the resistance in dry air after the analyte’s removal [47].

3. Results and Discussion

3.1. Structural, Morphological, Chemical, and Thermal Characterization of the WO3 Microflowers

Figures S1–S3 show the SEM images of multiple samples synthesized by varying the synthesis parameters. Figure S1 presents hierarchical flower-like structures assembled from nanostructures on their surface, which were obtained using different amounts of K2SO4 (0 g, 1 g, 2 g, 3 g, and 4 g), a 3M HCl concentration, and a synthesis time of 30 min. The SEM images revealed a progressive increase in the size of microflowers along with a simultaneous refinement of the nanostructures on the surface with the incremental addition of K2SO4. The MF-WO3-K1 sample consists of microflowers with smaller diameters and nanorods on their surface. In contrast, sample MF-WO3-K2 contains larger microflowers with nanostructured plates. The MF-WO3-K3 sample shows greater and agglomerated microflowers resembling urchin-like nanostructures. The MF-WO3-K4 sample results in clusters with irregular shapes composed of nanostructures of varying thickness. Figure S2 illustrates the effect of changing HCl concentrations (0 M to 4 M) on samples synthesized with 2 g of K2SO4 and a 30 min synthesis time. Clusters of microflowers were obtained for HCl concentrations between 0 M and 2 M, showing improved shape patterns as the HCl concentration increased. Microflowers with well-defined spherical shapes were produced with 3 M HCl, whereas irregular nanostructures were observed at 4 M HCl. Figure S3 shows SEM images of materials synthesized at different synthesis times (15, 30, 60, 90, and 120 min) using 2 g of K2SO4 and a 3 M HCl concentration. Clusters of microstructures with thin nanostructures were observed after 15 min of synthesis. However, well-defined microflowers formed at 30 and 60 min. Longer synthesis times (90 and 120 min) led to the formation of different flower morphologies and the breakdown of the microflower structure into dispersed nanostructures.
To understand the formation of the observed structures, it is essential to consider the role of the precursor, tungstic acid (H2WO4). In aqueous solution, H2WO4 can generate several polytungstate ions, including the following:
H + + W O 4 2 = H W O 4 ,
7 H + + 6 W O 4 2 = H W 6 O 21 5 ,
For pH > 7, the W O 4 2 species predominates, whereas for pH < 7, H W 6 O 21 5 becomes the dominant species. The latter can dissociate into W O 4 2 , maintaining reaction equilibrium [48,49]. According to Bai et al. [48], the controlled addition of an inorganic acid, such as 3M HCl, to an aqueous solution containing W O 4 2 gradually induces gelation of these ions and the subsequent formation of WO3 nanoparticles during the hydrothermal reaction, which can lead to the formation of unique structures depending on the synthesis conditions.
The SEM analysis (Figures S1–S3) revealed the influence of synthesis parameters on the characteristics of the obtained microflowers. Previous studies have reported that ions act as selective adsorption agents on specific crystalline faces, favoring growth in particular directions [42,50,51]. Increasing the HCl concentration decreases the size of the microflowers, highlighting the relationship between the microflowers nucleation and HCl concentration. Additionally, the acid concentration may affect the thickness of plate-like nanostructures on the microflowers surface. Regarding the synthesis time, SEM images indicate that longer reaction times result in smaller microflowers. Conversely, particle aggregation increases, forming thicker plates, likely due to the dissociation and recrystallization of the structures [52]. Based on the SEM images, the MF-WO3-K2 sample was considered the optimized material, presenting a well-defined microflower structure with nanoplates on its surface.
Figure 1A shows a SEM image of the as-synthesized microflowers (MF-WO3-K2), exhibiting a spherical shape with diameters ranging from 1 μm to 3 μm. A zoom-in image (Figure 1B) reveals nanometric plates on the surface of these structures. After heat treatment at 400 °C, the microflowers maintained their morphology, as indicated in Figure 1C,D. Figure S4 presents the energy-dispersive X-ray spectra (EDS) with peaks corresponding only to oxygen and tungsten, which indicates the absence of impurities in the MF-WO3-K2 sample. SEM images were used to determine the distributions of microflower diameters and nanoplate thicknesses. Gaussian curves fitted to these distributions yielded diameter and thickness values of 1.78 μm and 18.2 nm, respectively (Figure 1G,H). The cross-section of a single microflower (MF-WO3-K2) was studied, revealing a predominantly solid core with a surface covered by plates (Figure 1E). Tiny pores were also observed near the surface, possibly due to the spaces between the plates. Figure 1F displays a high-resolution TEM image of plates on the surface of the WO3 microflowers. The image reveals a high crystalline material, with plates exhibiting an interplanar distance of 3.2 Å, corresponding to the (200) growth direction. Additionally, the plane (200) is associated with the concentric ring observed in the selected-area electron diffraction (SAED) pattern, shown in the inset of Figure 1F.
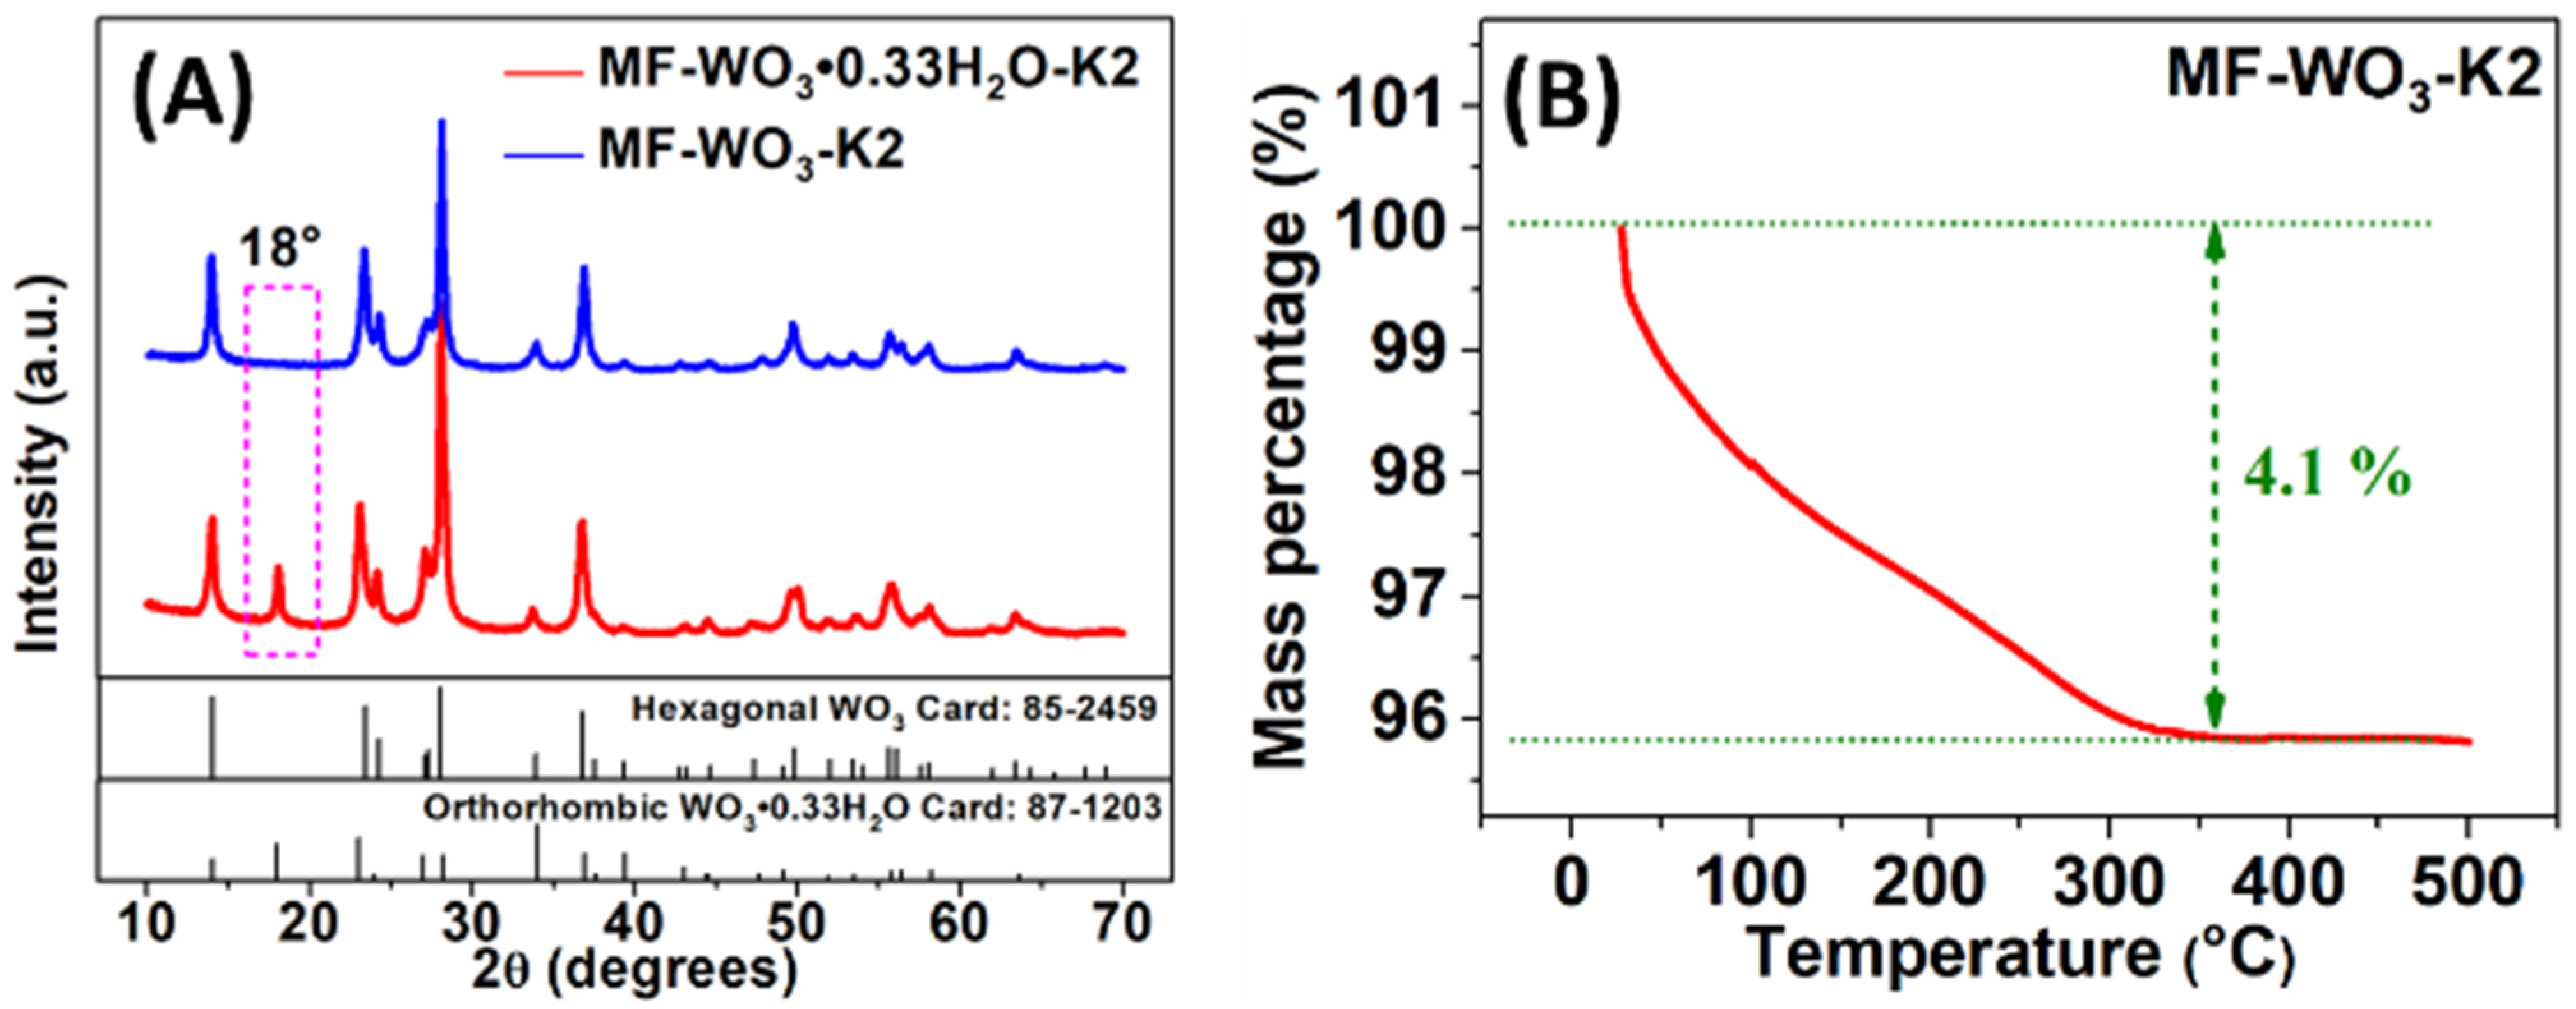
XRD analyses (Figure 2A) were conducted to investigate the crystalline phase of the synthesized material. The results revealed that the as-synthesized microflowers consisted of hydrated tungsten oxide composition ( W O 3 0.33 H 2 O ), which crystallized in an orthorhombic structure (JCPDS card nº 87-1203). However, heat treatment at 400 °C caused water removal from the structure, leading to a phase transition to hexagonal tungsten trioxide (WO3) (JCPDS card nº 85-2459). This transition was confirmed by the disappearance of the peak at 18° in the diffractogram [11]. The TG analysis (Figure 2B) indicates the water removal, showing a mass loss of 4.1% between 28 °C and 360 °C, which is attributed to two processes: (I) the removal of adsorbed H2O molecules from room temperature to 210 °C [11], and (II) the elimination of H2O molecules from the oxide structure between 210 °C and 360 °C, which occurs concurrently with the crystallization process. The condensation of adjacent W O H groups led to the formation of water molecules and W O W bonds, resulting in the hexagonal phase transition observed in the XRD analysis [11]. Additionally, a 2.5% mass loss related to the crystalline phase change was estimated based on the chemicals used in the synthesis. No further mass loss was observed between 360 °C and 490 °C.
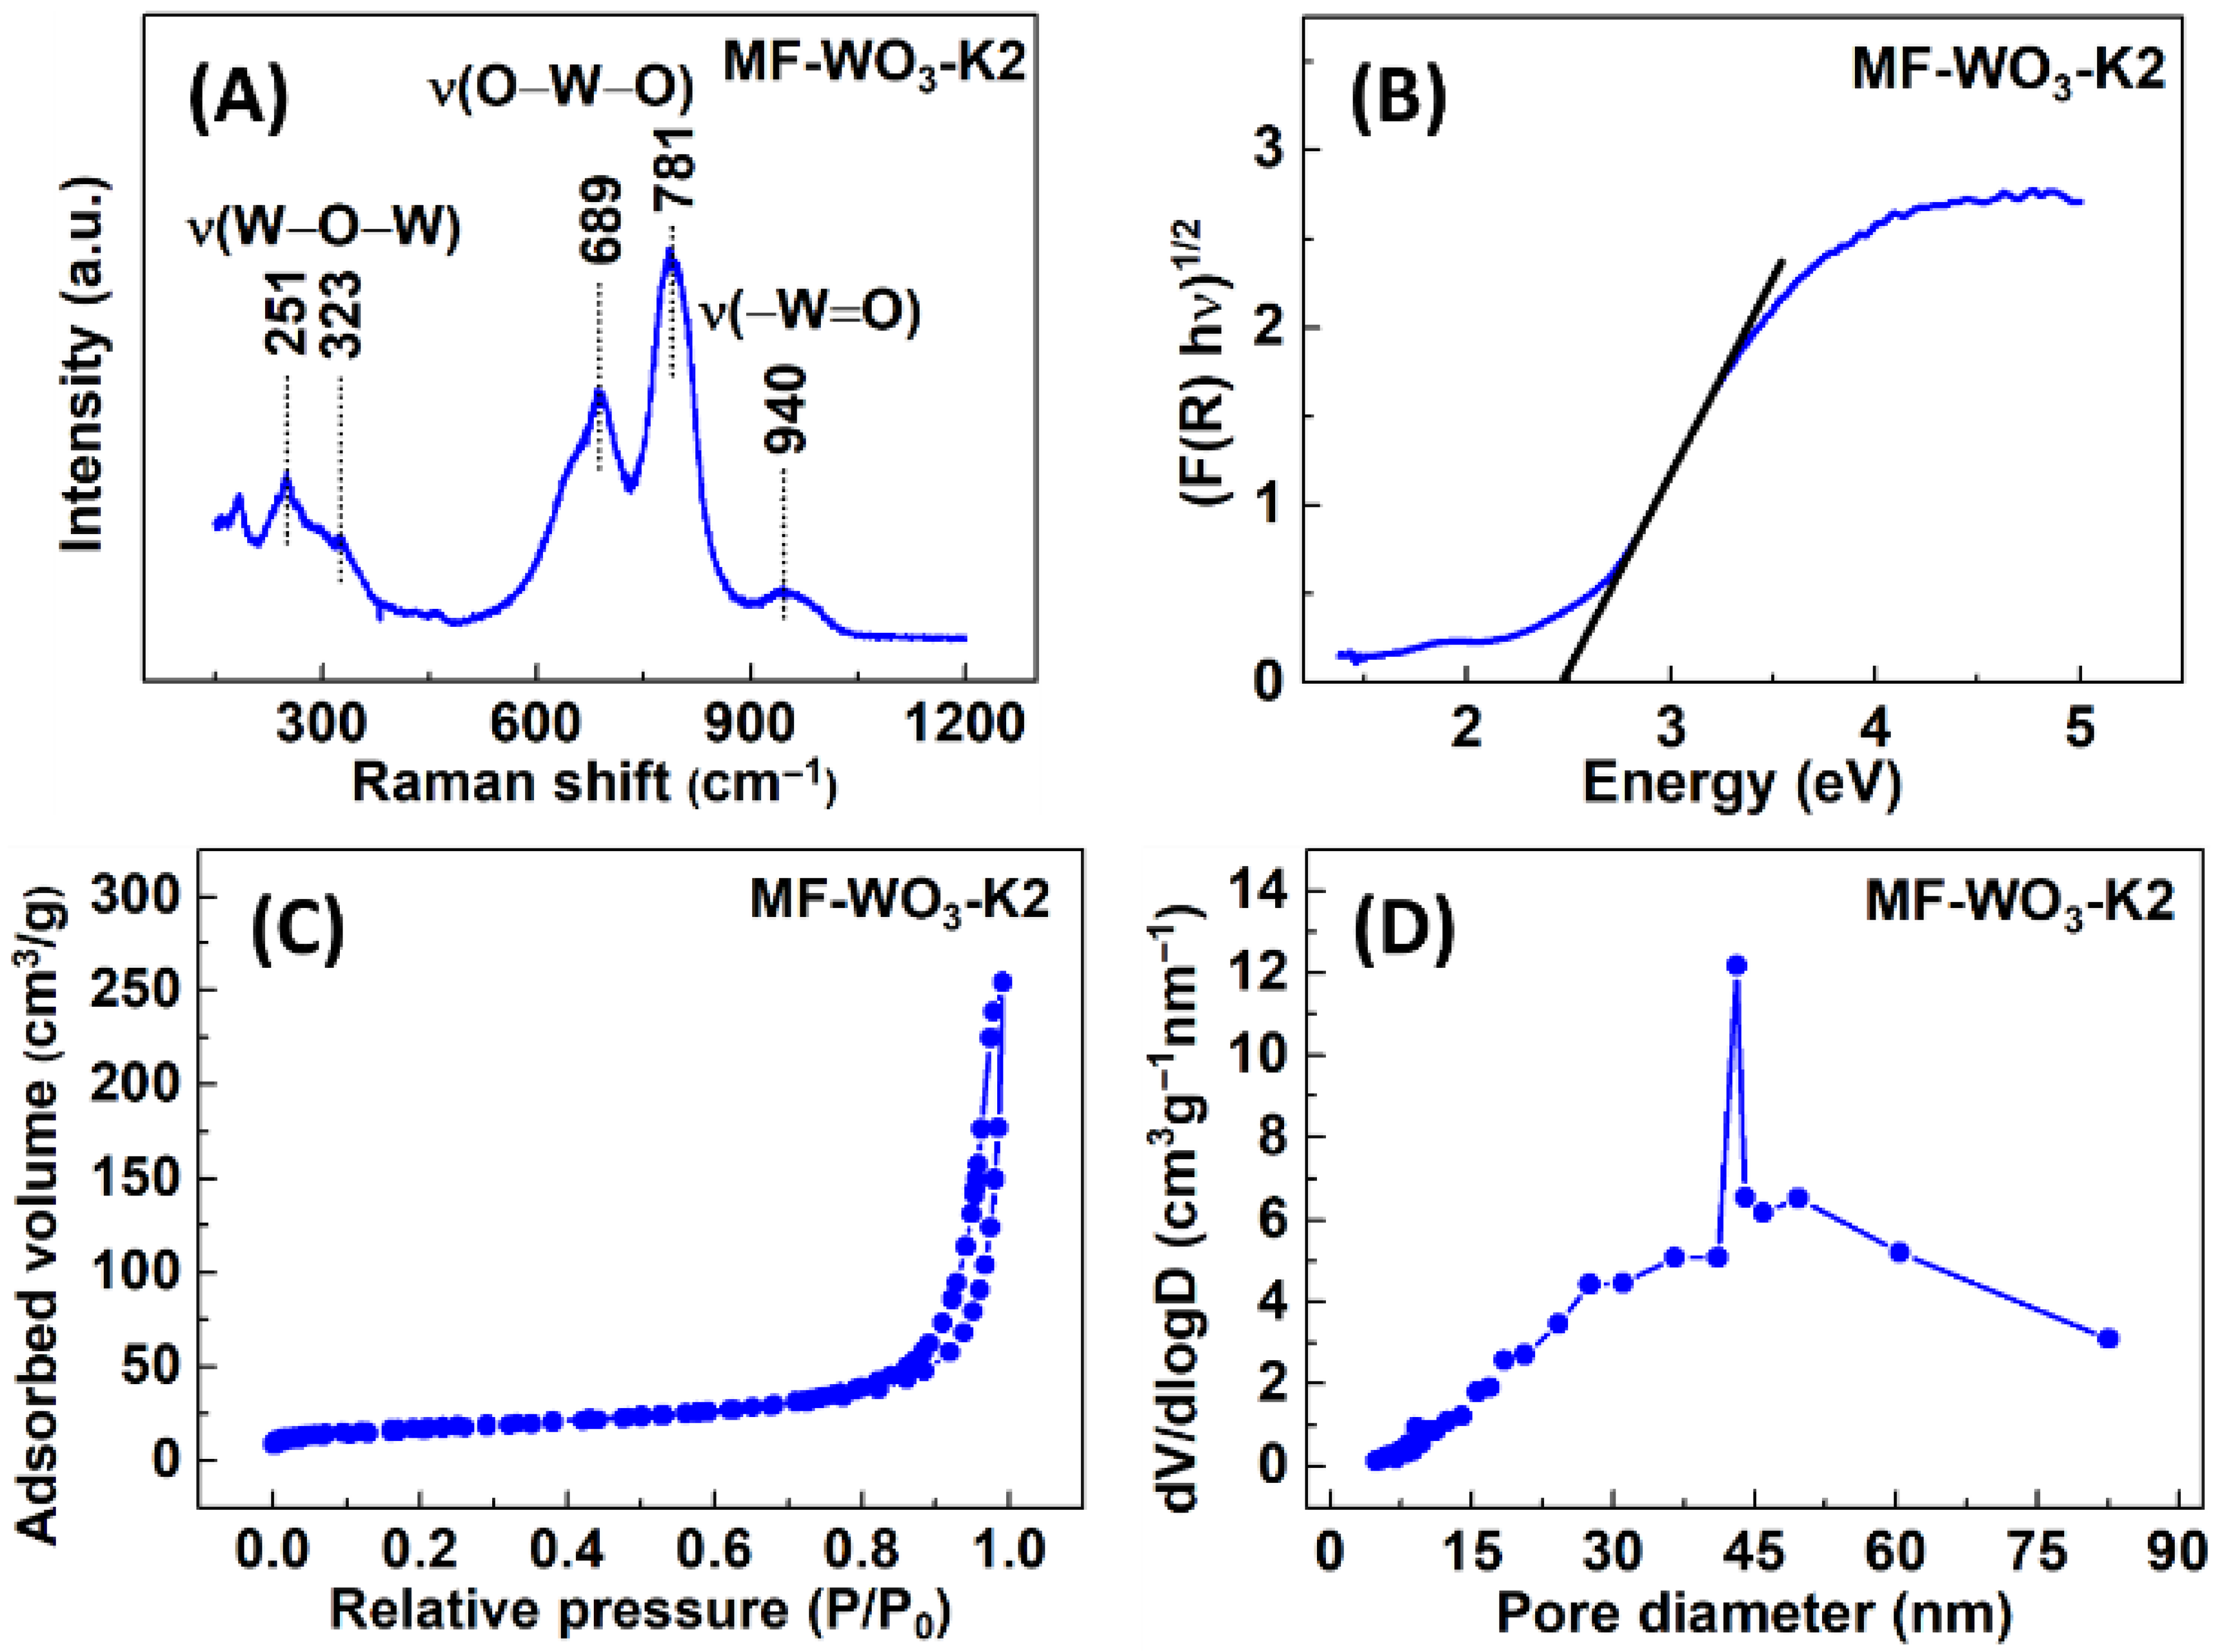
Figure 3A shows the Raman spectra of the MF-WO3-K2, exhibiting the bands associated with the stretching vibrations of tungsten-oxygen bonds. The bands at 251 cm−1 and 323 cm−1 correspond to the v W O W vibrations [53], while those at 689 cm−1 and 781 cm−1 are related to v O W O vibrations [53]. Additionally, the band at 940 cm−1 is assigned to v W 6 + = O [54]. The bands below 200 cm−1 are typically attributed to crystal lattice vibrations [55]. Furthermore, diffuse reflectance measurements were performed using the Kubelka-Munk function, and a bandgap of 2.4 eV was estimated (Figure 3B). From BET (Figure 3C) and BJH adsorption methods (Figure 3D), the specific surface area and mean pore size were calculated to be 61 m2/g and 43 nm, respectively.

3.2. Gas Sensing Measurements

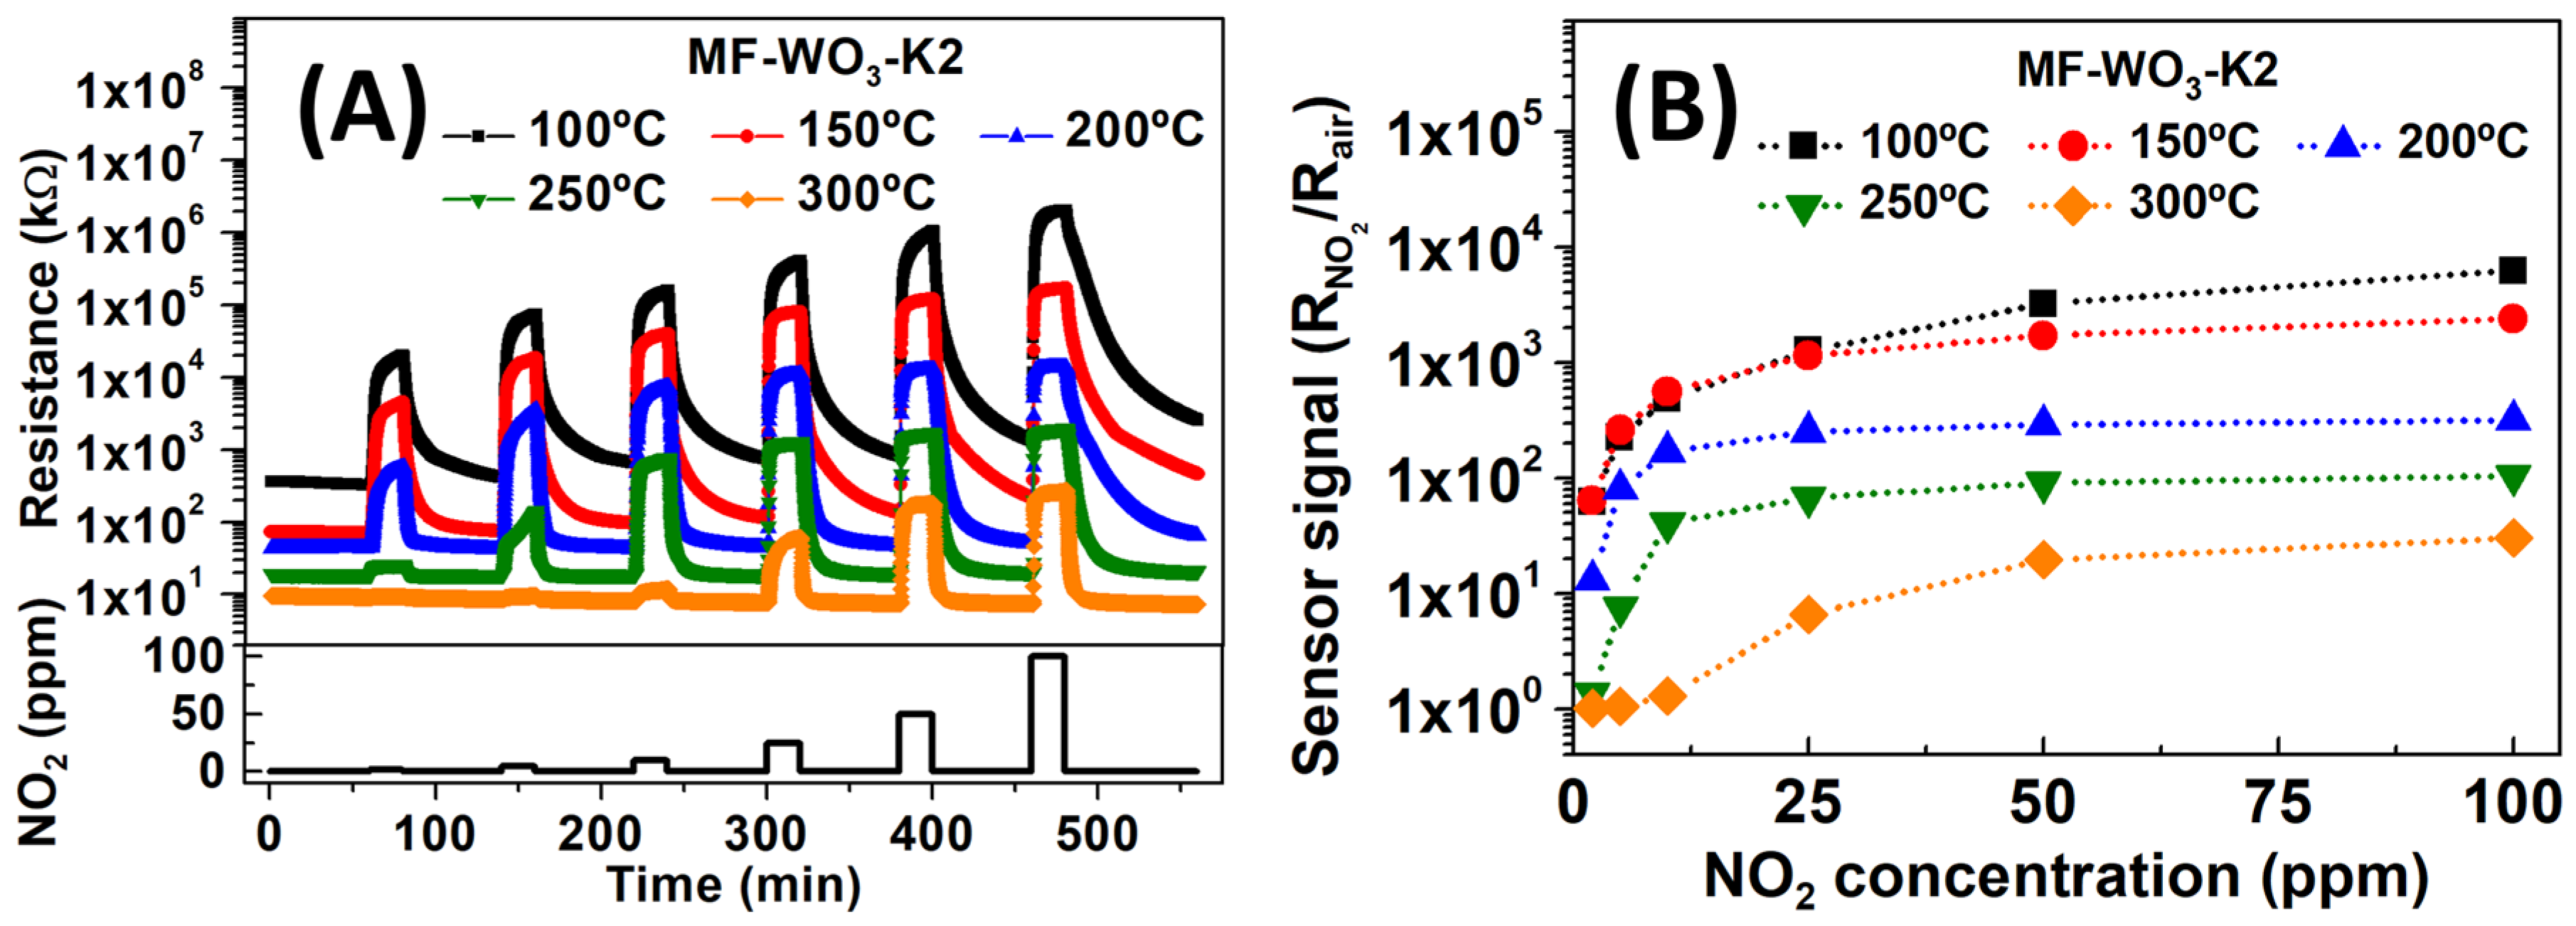
Figure 4A shows the resistance of the MF-WO3-K2 sensor over time during exposure to NO2 concentrations ranging from 2 ppm to 100 ppm at operating temperatures between 100 °C and 300 °C. The baseline resistance in dry air decreased as the temperature increased. This phenomenon arises from two competing processes: (i) exponential thermal excitation of electrons, which promotes them to the semiconductor’s conduction band as temperature increases, and (ii) oxygen ionosorption under heating, leading to the formation of ionic species on the oxide surface, thereby reducing conductivity [9,56]. Under NO2 exposure, the sensor resistance increased with higher gas concentrations. This behavior is typical of n-type semiconductors and results from electron trapping in the conduction band due to interactions between NO2 and the WO3 surface [57]. The sensor signals were calculated from the resistance data using Equation (1), and the calibration curves are shown in Figure 4B. The sensor signals increased with rising NO2 concentration at all operating temperatures, with the highest responses obtained at 100 °C and 150 °C. The decrease in sensor response at elevated operating temperatures is attributed to the increased desorption rate and reduced diffusion depth of NO2 on the WO3 surface. At 100 °C and 150 °C, the sensor showed similar sensor signals below 50 ppm (approximately 62, 250, 500, and 1200 for 2, 5, 10, and 25 ppm of NO2, respectively). However, at 50 ppm and 100 ppm, the sensor response was higher at 100 °C than at 150 °C. Specifically, for NO2 concentrations of 50 and 100 ppm, the sensor signals were 3225/6250 and 1711/2400 at 100 °C and 150 °C, respectively.
The high sensor response achieved in the range of NO2 concentrations studied can be attributed to several factors: (I) the structure formed by well-aligned nanoplates, which offer abundant active sites on the surface. Furthermore, the spaces on the surface due to the loosely connected nanoplates facilitate the diffusion of NO2 molecules into the microstructure, improving the sensor response [58]; (II) the ratio between the electron-depleted volume and the total volume directly affects the sensor response, especially for thin nanoplates [58]; and (III) the high crystallinity of the material, which ensures favorable conditions for electronic transport by minimizing electron traps such as crystal defects, enabling more efficient electron transfer [57].
For further analysis, the gas sensing measurements were performed at 150 °C. The MF-WO3-K2 device exhibited similar sensor signals at 100 °C and 150 °C; however, at 150 °C, smaller response and recovery times were obtained. The selectivity of the MF-WO3-K2 device towards potential interferent gases was also evaluated. In Figure 5A, the sensor resistance at 150 °C is plotted over time during exposures to reducing gases such as CO, H2, C2H2, and C2H4, with concentrations ranging from 2 to 100 ppm. The sensor signals for 5 ppm of reducing gases and NO2 were comparatively analyzed, and the results are presented in Figure 5B. The sensor signal for NO2 ( S S N O 2 ) is over 200-fold higher than those for the reducing gases ( S S N O 2 / S S H 2 = 223 ; S S N O 2 / S S H 2 = 221 ; S S N O 2 / S S C 2 H 2 = 208 ; and S S N O 2 / S S C 2 H 4 = 211 ). These findings demonstrate the exceptional selectivity of the MF-WO3-K2 device for detecting NO2 in the presence of potential interfering gases. The sensor responses for reducing gases can be improved by both increasing the partial pressure of the reducing gases and the oxygen gases [59]. Furthermore, semiconductor materials such as WO3, when exposed to humidity, typically exhibit a decrease in the sensor’s baseline resistance, which in turn reduces the response toward oxidizing gases such as NO2. In this process, water molecules are adsorbed onto the WO3 surface and release electrons back into the conduction band [60,61].
To examine the reproducibility of the results under optimized operating conditions, six MF-WO3-K2 sensors were analyzed at 150 °C for NO2 concentrations ranging from 2 to 100 ppm. The sensors exhibited a consistent resistance profile in response to varying NO2 concentrations (Figure 6A). The average sensor signals (S) versus NO2 concentrations on a linear scale (Figure 6B) followed the power-law function [47]:
S = a · c N O 2 b
where S is the sensor signal, a and b are constants, and c N O 2 is the analyte concentration. Table 1 summarizes the average sensor signals, along with their respective standard deviations. The interaction between the gas and the semiconductor, which follows a power-law relationship, can be readily identified from the log–log plot of the sensor signal versus gas concentration from the linearization of Equation (4) [62,63]. In this case, Figure 6C shows a log-log plot for log (S) versus c N O 2 , and the calibration curve with an R-square value of 0.98. The calibration curve function corresponds to the following equation:
log S = log a + b · log c N O 2
The values of a and b are 39.21 and 0.90, respectively.
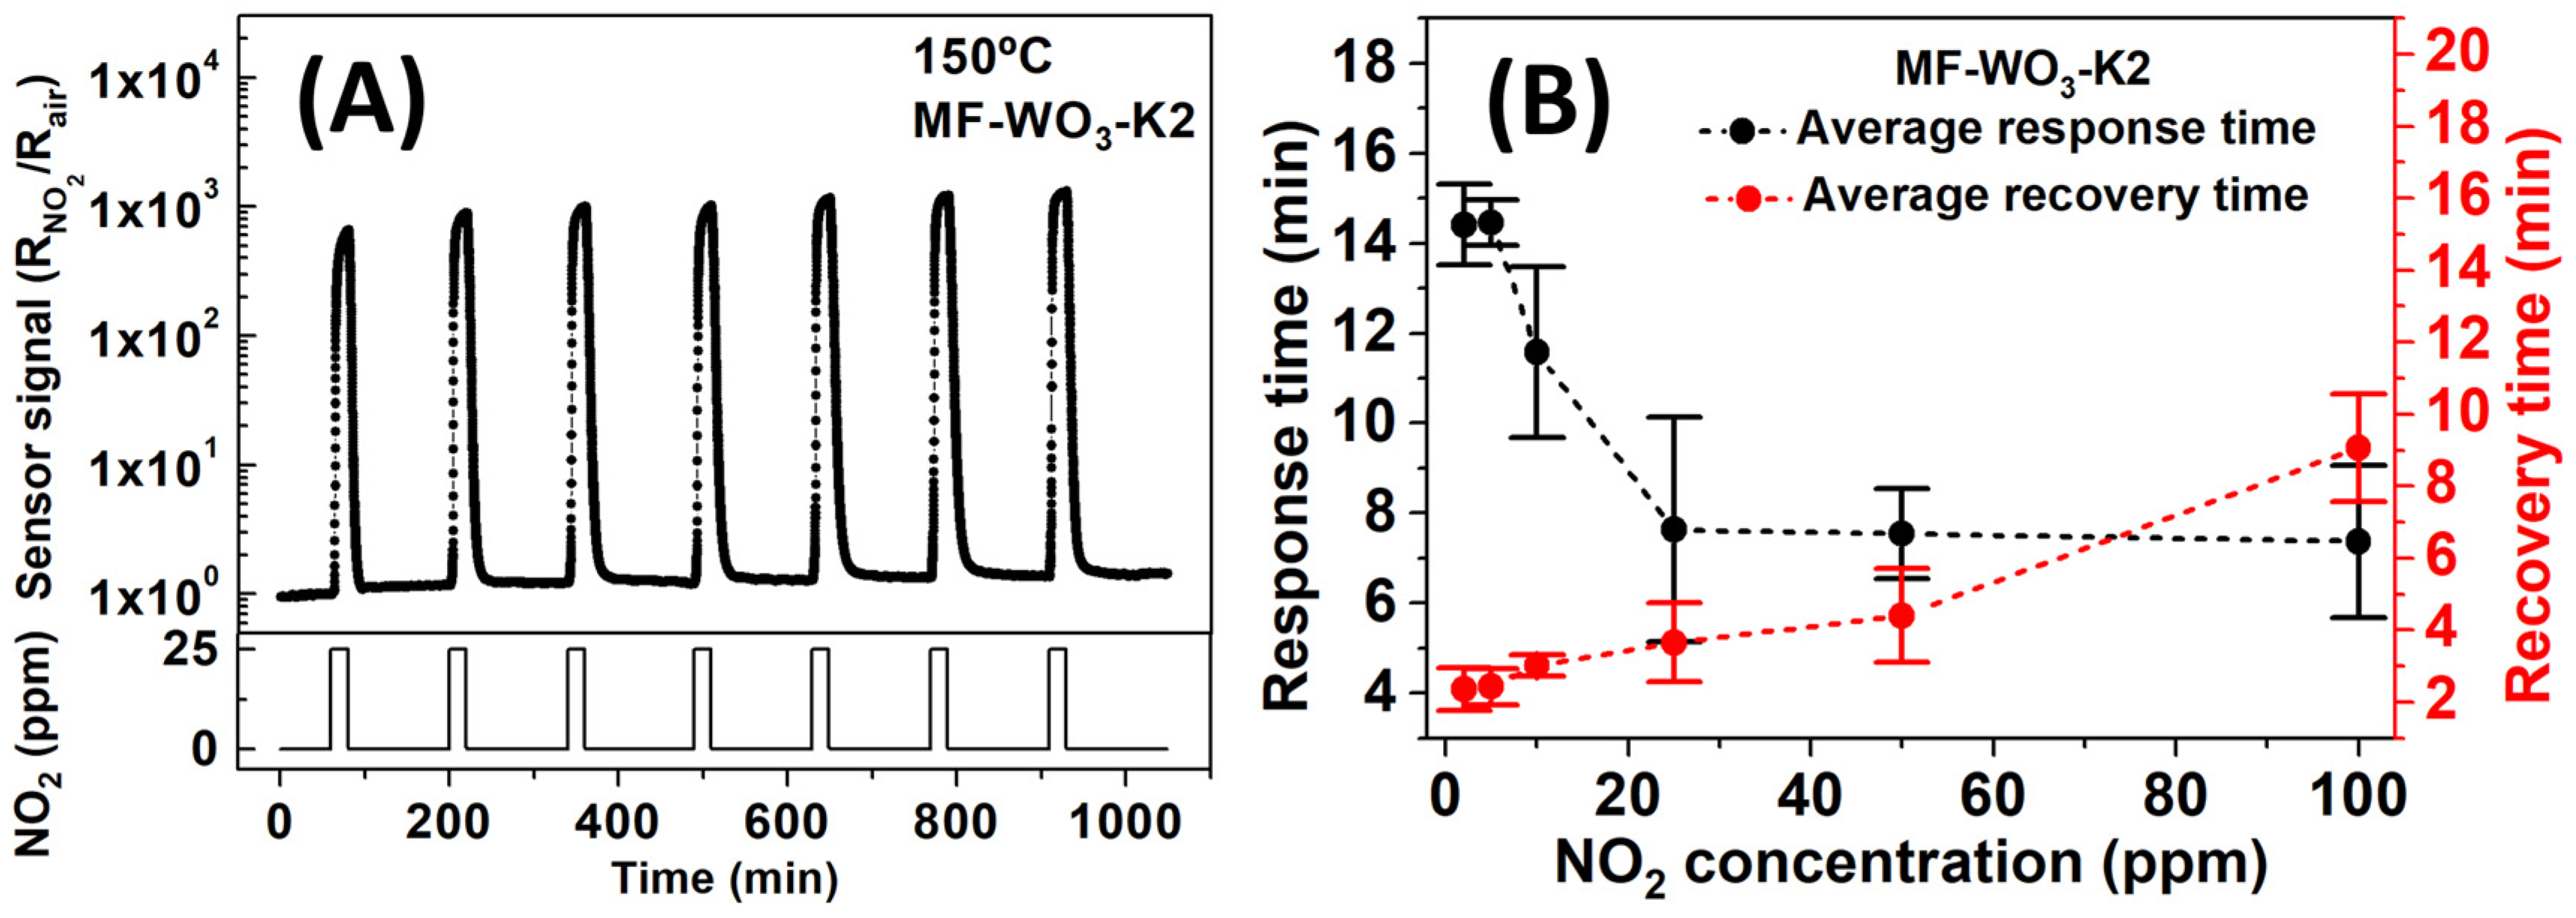
Figure 7A shows curves of stability tests at 150 °C for 25 ppm of NO2. For the tests, the sensors were stabilized under 120 min of dry air and 20 min of NO2 exposure, maintaining a constant total gas flow of 100 sccm. The MF-WO3-K2 sensor exhibited an average sensor signal of 1014 (192), which is similar to the sensor signal value presented in Table 1. The average response and recovery times for the six MF-WO3-K2 sensors at 150 °C were calculated from the sensor response curves while varying NO2 concentrations from 2 to 100 ppm (Figure S5), and the results are shown in Figure 7 and summarized in Table 2. The analysis revealed that the response times decreased with increasing NO2 concentration, changing from 14.4 min (for 2 ppm) to 7.4 min (for 100 ppm). In contrast, recovery times increased from 2.3 min (2 ppm) to 9.1 min (100 ppm). The decrease in response times and increase in recovery times may be related to enhanced sensor responses at higher NO2 concentrations, indicating a faster depletion of charge carriers of microflowers and slower desorption of NO2 molecules from the surface. The response and recovery times can be decreased by increasing the gas flow rate in the test chamber or by decreasing the thickness of the sensing layer through deposition of a smaller amount of WO3 microflowers. Table 2 summarizes the obtained response and recovery times.
The limit of detection (LOD) for the MF-WO3-K2 sensor was estimated from the resistance curve [47] and represents the lowest NO2 concentration that the sensor can detect. Figure 8A shows the average resistance of six MF-WO3 sensors as a function of NO2 concentrations at 150 °C on a linear axis, which follows a power-law relationship (Equation (4)). The corresponding log-log plot (Figure 8B) shows a linear relationship ( R 2 = 0.99 ) described by the following equation:
l o g R = l o g a + b · log c N O 2
where R is the resistance of sensor response, a and b are constants, and c N O 2 is the analyte concentration.
The LOD was calculated using Equation (5) by replacing R with R ¯ 0 + 3 · σ 0 , resulting in Equation (6) [47]. Here, R ¯ 0 corresponds to the mean baseline resistance for the six MF-WO3 sensors, and σ 0 is the standard deviation of R ¯ 0 (see Table 3). Consequently, the calculated LOD of the MF-WO3-K2 sensor reached 65 ppb of NO2 at 150 °C, which is much lower than the values reported by the Conference on Industrial Hygiene (3 ppm) [1] and the WHO (0.1 ppm) [2].
f 1 R = l o g c N O 2 = log R ¯ 0 + 3 · σ 0 log a b
Table 4 summarizes the sensor performance of the MF-WO3-K2 device for a NO2 concentration of 5 ppm at 150 °C and compares it with current WO3 sensors with various morphologies and other SMOx presented in the literature. The comparison reveals that the MF-WO3-K2 device exhibited the highest sensor signal and a lower limit of detection than most of the sensors. Additionally, the response and recovery times of the MF-WO3-K2 device were higher than those reported in other studies, which can be attributed to its high sensor response. Thus, the MF-WO3-K2 device exhibited excellent sensor performance.

3.3. Gas Sensing Mechanisms

Tungsten trioxide exposed to a synthetic air environment without humidity undergoes oxidation due to the ionosorption of oxygen on its surface, which can occur predominantly through molecular oxygen species ( O 2 , at 150 °C) [77,78,79,80]. Thus, at the operating temperature of 150 °C, the oxygen adsorption in molecular form on the WO3 surface can be expressed in equilibrium conditions, such as:
O 2 g + V 0 + e C B = O 2 V 0 a d s W O 3 ,
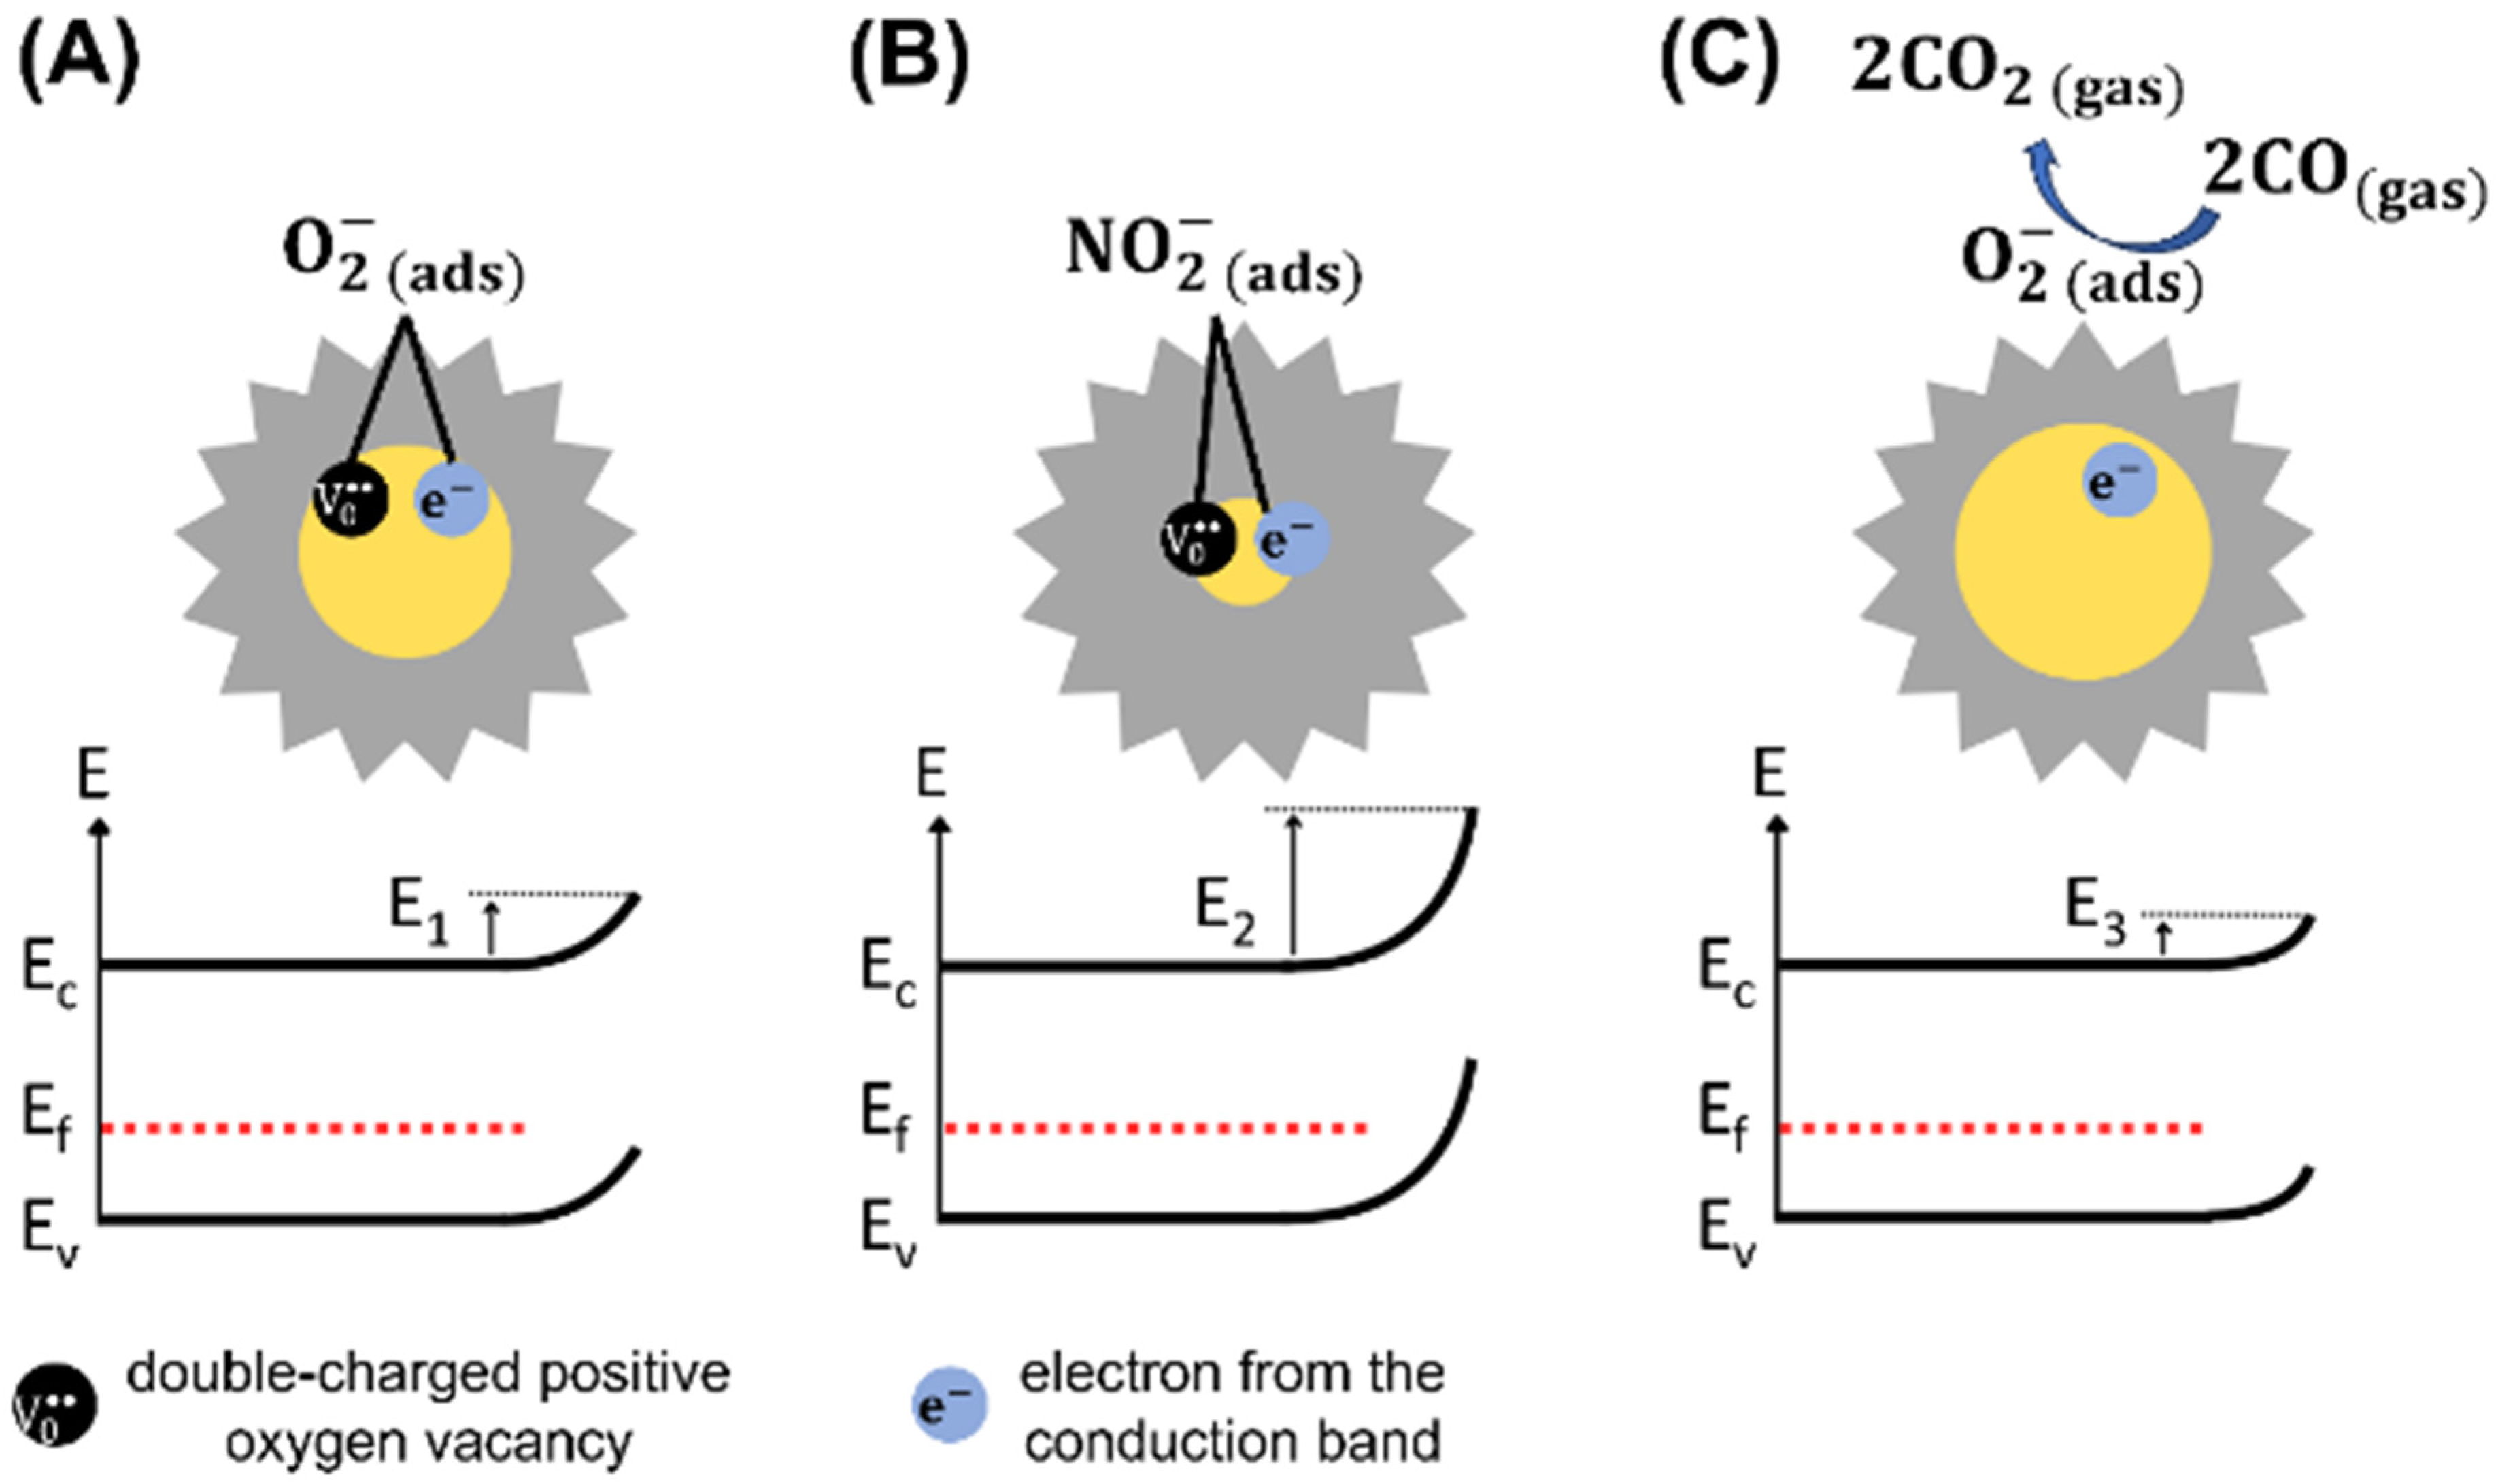
where e C B represents the electrons in the conduction band, V 0 is a double-charged positive oxygen vacancy, and ( O 2 V 0 ) a d s ( W O 3 ) is the oxygen chemisorbed coupled to V 0 [81]. The oxygen adsorption at the WO3 grain boundaries generates potential barriers, and its change leads to variations in the barrier potential energy ( E 1 ), which regulates the surface conductivity of WO3 [9], as illustrated in Figure 9A.
At temperatures equal to or lower than 150 °C, it is unlikely for NO2 molecules to interact with O 2 [4]. Generally, NO2 molecules interact with the metal oxide surface by reacting with oxygen vacancies [82]. Using Density Functional Theory (DFT), Han and Yin [83] reported that NO2 molecules fill vacancy sites during adsorption at the WO-terminated surface. This indicates the presence of numerous surface vacancies [61] in the crystalline structure of WO3 microflowers available for NO2 interaction. Thus, direct NO2 adsorption on available WO3 surface sites is much more probable than its interaction with pre-adsorbed oxygen species, and the reaction can be expressed as follows:
N O 2 ( g ) + V 0 + e ( W O 3 ) ( N O 2 V 0 ) a d s ( W O 3 ) ,
Additionally, Blackman et al. and Mirabella et al. proposed that changes in the ‘intrinsic’ oxygen vacancy concentration may drive the conductivity variation, in agreement with the surface conductivity model [59,84], while recent operando DRIFTS studies by Suman et al. provide direct evidence supporting the involvement of surface-adsorbed oxygen species [85]. The adsorption of NO2 (Reaction (4)) further increases the electron depletion region, raising the material’s electrical resistance [4]. Consequently, electron conduction through the grains is modulated by NO2 concentrations [86]. Figure 9B illustrates the modulation of the space-charge layer and potential barrier energy ( E 2 ) due to the adsorption of NO2 on the WO3 surface, which increases its electrical resistance. Additionally, the dissociation of NO2 species into NO molecules and oxygen adsorbed on the WO3 surface is also possible, as shown in Reaction (5).
N O 2 V 0 a d s W O 3 N O g a s + O V 0 a d s W O 3 ,
Moreover, the formation of nitrite [87,88] and nitrate [88] species through electron trapping in the material is possible. The following reactions express these processes:
N O 2 ( g a s ) + e N O 2 a d s ,
2 N O 2 ( g a s ) + 1 2 O 2 ( g a s ) + 2 e N O 2 ( a d s ) + N O 3 ( a d s ) ,
N O 2 ( a d s ) + 1 2 O 2 ( g a s ) N O 3 ( a d s ) ,
The adsorption of reducing gases CO, H2, C2H2, and C2H4 on the n-type WO3 surface at 150 °C occurs through reactions with negatively charged oxygen species ( O 2 ) chemisorbed on the surface. This process releases electrons into the conduction band, thereby increasing the conductivity of WO3 and decreasing the space-charge layer. The reactions involved for CO, H2, C2H2, and C2H4 gases can be described as follows [80,89,90,91]:
2 C O ( g a s ) + O 2 a d s 2 C O 2 ( g a s ) + e ,
H 2 ( g a s ) + 1 2 O 2 a d s H 2 O ( g a s ) + e ,
2 C 2 H 2 ( g a s ) + O 2 a d s 2 C 2 H 2 O ( a d s ) + e ,
2 C 2 H 4 ( g a s ) + O 2 a d s 2 C 2 H 4 O ( a d s ) + e ,
Figure 9C illustrates the reaction between CO gas and a negatively charged oxygen species chemisorbed on the surface of WO3, which releases electrons into the conduction band, thereby decreasing its electrical resistance. The reaction is similar for the other reducing gases, as reported in Reactions (10)–(12). A previous study reported the temperature dependence of chemisorbed oxygen species on the WO3 surface, indicating that the density of these species decreases as the temperature decreases [80]. At temperatures ranging from 25 °C to 200 °C, the concentration of chemisorbed oxygen species shows minimal variation but increases significantly above 200 °C. Conversely, the density of the oxygen lattice increases at higher temperatures [80]. Therefore, the low density of O 2 species at 150 °C may be related to the low sensor response to reducing gases, which explains the high sensor selectivity to NO2. In situ FTIR analyses are necessary for future investigations into the detection mechanism of NO2 and reducing gases, which may corroborate the reactions mentioned above. Specifically, the interaction described by Reaction (5) between NO2 and WO3 surface can be confirmed as the predominant mechanism.

4. Conclusions

Hierarchical WO3 materials with flower-like morphology and micrometer sizes were synthesized using the microwave-assisted hydrothermal method. The material exhibited a WO3 composition, hexagonal crystalline phase, a bandgap of 2.4 eV, and a high specific surface area of 61 m2/g. From the several systems studied, the sample MF-WO3-K2, synthesized at 150 °C for 30 min, using HCl 3M and 2 g of K2SO4, demonstrated extraordinary sensor performance in detecting NO2 at concentrations ranging from 2 to 100 ppm, with elevated selectivity against interferent gases, including CO, H2, C2H2, and C2H4. The MF-WO3-K2 sensor achieved a signal of 225 for 5 ppm NO2 at 150 °C, with response/recovery times of 14.5/2.4 min, respectively. It exhibited good reproducibility and stability and a low detection limit of 65 ppb at this temperature. Long-term sensing stability tests should be conducted as additional analyses to evaluate sensing performance. These impressive results can be attributed to the unique morphology of the microflowers composed of nanoplates on the surface, which can provide abundant active surface sites, a large specific surface area, better diffusion of gas molecules into the material, a high proportion of depleted volume, and high crystallinity with fewer electron traps. Therefore, the MF-WO3-K2 microflowers exhibited high sensor performance, making this material potentially promising for gas sensing applications. Furthermore, additional life cycle investigations and a device prototype can be developed.

Supplementary Materials

The following supporting information can be downloaded at: https://www.mdpi.com/article/10.3390/chemosensors13110390/s1, Figure S1: SEM images of the synthesized material obtained by varying the K2SO4 amount as follows: (A) 0 g, (B) 1 g, (C) 2 g, (D) 3 g, and (E) 4 g. The HCl concentration was 3 M, and the synthesis time was 30 min. (F) Variation in microflower diameter and plate thickness as a function of K2SO4 mass; Figure S2: SEM images of the synthesized material obtained by varying the HCl concentration as follows: (A) 0 M, (B) 1 M, (C) 2 M, (D) 3 M, and (E) 4 M. The amount of K2SO4 was 2 g, and the synthesis time was 30 min. (F) Variation in microflower diameter and plate thickness as a function of HCl concentration; Figure S3: SEM images of the synthesized material obtained by varying the synthesis time as follows: (A) 15 min, (B) 30 min, (C) 60 min, (D) 90 min, and (E) 120 min. The amount of K2SO4 used was 2 g, and the HCl concentration was 3 M. (F) Variation in microflower diameter and plate thickness as a function of synthesis time; Figure S4: EDS spectrum of the MF-WO3-K2 sample; Figure S5: (A) Response and (B) recovery times as a function of NO2 concentrations ranging from 2 to 100 ppm at temperatures between 100 °C and 300 °C for the six MF-WO3-K2 sensors.

Author Contributions

P.V.M.: Methodology, Formal analysis, Investigation, Writing—Original Draft, Writing—Review and Editing; P.H.S.: Validation, Data Curation, Writing—Review and Editing; M.O.O.: Conceptualization, Validation, Writing—Review and Editing, Resources, Project administration, and Funding acquisition. All authors have read and agreed to the published version of the manuscript.

Funding

Coordination of Superior Level Staff Improvement (CAPES) (grant number 88882.330127/2019-01 and 88887.936511/2024-00), National Council for Scientific and Technological Development (CNPq) (grant number 152155/2022-8) and the São Paulo Research Foundation (FAPESP), Brasil (Process Number #2016/20808-0 and #2017/26219-0), and the Financier of Studies and Projects (FINEP) (contract number 01.22.0291.00, reference #0083/21).

Data Availability Statement

The supplementary data supporting this article have been included as part of the Supplementary Information (SI). SEM images of synthesized materials varying the K2SO4 amount, HCl concentration, and the synthesis time; EDS spectrum of MF-WO3-K2 sample; response and recovery times for the six MF-WO3-K2 sensors are presented.

Acknowledgments

The authors acknowledge São Paulo State University - Institute of Chemistry.

Conflicts of Interest

There are no conflicts to declare.

References

  1. Duan, X.; Xu, D.; Jia, W.; Li, R.; Sun, B.; Yan, R.; Zhao, W. WO3/WS2 Nanoflowers Fabricated by Low-Temperature in-Situ Oxidation for Rapid Detection of Nitrogen Dioxide. Sens. Actuators A Phys. 2024, 365, 114854. [Google Scholar] [CrossRef]
  2. World Health Organization. Health Aspects of Air Pollution with Particulate Matter, Ozone and Nitrogen Dioxide: Report on a WHO Working Group, Bonn, Germany, 13–15 January 2003; World Health Organization: Geneva, Switzerland, 2003. [Google Scholar]
  3. Long, H.; Zeng, W.; Zhang, H. Synthesis of WO3 and Its Gas Sensing: A Review. J. Mater. Sci. Mater. Electron. 2015, 26, 4698–4707. [Google Scholar] [CrossRef]
  4. Urasinska-Wojcik, B.; Vincent, T.A.; Chowdhury, M.F.; Gardner, J.W. Ultrasensitive WO3 Gas Sensors for NO2 Detection in Air and Low Oxygen Environment. Sens. Actuators B Chem. 2017, 239, 1051–1059. [Google Scholar] [CrossRef]
  5. Righettoni, M.; Amann, A.; Pratsinis, S.E. Breath Analysis by Nanostructured Metal Oxides as Chemo-Resistive Gas Sensors. Mater. Today 2015, 18, 163–171. [Google Scholar] [CrossRef]
  6. Bai, X.; Ji, H.; Gao, P.; Zhang, Y.; Sun, X. Morphology, Phase Structure and Acetone Sensitive Properties of Copper-Doped Tungsten Oxide Sensors. Sens. Actuators B Chem. 2014, 193, 100–106. [Google Scholar] [CrossRef]
  7. Tyagi, S.; Chaudhary, M.; Ambedkar, A.K.; Sharma, K.; Gautam, Y.K.; Singh, B.P. Metal Oxide Nanomaterial-Based Sensors for Monitoring Environmental NO2 and Its Impact on the Plant Ecosystem: A Review. Sens. Diagn. 2022, 1, 106–129. [Google Scholar] [CrossRef]
  8. Song, W.; Zhang, R.; Bai, X.; Jia, Q.; Ji, H. Exposed Crystal Facets of WO3 Nanosheets by Phase Control on NO2-Sensing Performance. J. Mater. Sci. Mater. Electron. 2020, 31, 610–620. [Google Scholar] [CrossRef]
  9. Wang, M.; Wang, Y.; Li, X.; Ge, C.; Hussain, S.; Liu, G.; Qiao, G. WO3 Porous Nanosheet Arrays with Enhanced Low Temperature NO2 Gas Sensing Performance. Sens. Actuators B Chem. 2020, 316, 128050. [Google Scholar] [CrossRef]
  10. Morais, P.V.; Suman, P.H.; Silva, R.A.; Orlandi, M.O. High Gas Sensor Performance of WO3 Nanofibers Prepared by Electrospinning. J. Alloys Compd. 2021, 864, 158745. [Google Scholar] [CrossRef]
  11. Perfecto, T.M.; Zito, C.A.; Volanti, D.P. Room-Temperature Volatile Organic Compounds Sensing Based on WO3·0.33H2O, Hexagonal-WO3, and Their Reduced Graphene Oxide Composites. RSC Adv. 2016, 6, 105171–105179. [Google Scholar] [CrossRef]
  12. Phanichphant, S. Semiconductor Metal Oxides as Hydrogen Gas Sensors. Procedia Eng. 2014, 87, 795–802. [Google Scholar] [CrossRef]
  13. Hoa, N.D.; El-Safty, S.A. Gas Nanosensor Design Packages Based on Tungsten Oxide: Mesocages, Hollow Spheres, and Nanowires. Nanotechnology 2011, 22, 485503. [Google Scholar] [CrossRef] [PubMed]
  14. Lee, C.-Y.; Kim, S.-J.; Hwang, I.-S.; Lee, J.-H. Glucose-Mediated Hydrothermal Synthesis and Gas Sensing Characteristics of WO3 Hollow Microspheres. Sens. Actuators B Chem. 2009, 142, 236–242. [Google Scholar] [CrossRef]
  15. Li, X.-L.; Lou, T.-J.; Sun, X.-M.; Li, Y.-D. Highly Sensitive WO3 Hollow-Sphere Gas Sensors. Inorg. Chem. 2004, 43, 5442–5449. [Google Scholar] [CrossRef]
  16. Van Dang, T.; Duc Hoa, N.; Van Duy, N.; Van Hieu, N. Chlorine Gas Sensing Performance of On-Chip Grown ZnO, WO3, and SnO2 Nanowire Sensors. ACS Appl. Mater. Interfaces 2016, 8, 4828–4837. [Google Scholar] [CrossRef]
  17. Behera, B.; Chandra, S. Synthesis of WO3 Nanorods by Thermal Oxidation Technique for NO2 Gas Sensing Application. Mater. Sci. Semicond. Process 2018, 86, 79–84. [Google Scholar] [CrossRef]
  18. Shendage, S.S.; Patil, V.L.; Vanalakar, S.A.; Patil, S.P.; Harale, N.S.; Bhosale, J.L.; Kim, J.H.; Patil, P.S. Sensitive and Selective NO2 Gas Sensor Based on WO3 Nanoplates. Sens. Actuators B Chem. 2017, 240, 426–433. [Google Scholar] [CrossRef]
  19. Xia, H.; Wang, Y.; Kong, F.; Wang, S.; Zhu, B.; Guo, X.; Zhang, J.; Wang, Y.; Wu, S. Au-Doped WO3-Based Sensor for NO2 Detection at Low Operating Temperature. Sens. Actuators B Chem. 2008, 134, 133–139. [Google Scholar] [CrossRef]
  20. Li, G.; Li, J.; Wang, Y.; Du, Y.; Xu, H.; Wang, Y. In-Situ Growth WO3@ZIF-8 Core-Shell Nanorod Arrays for Highly Responsive and Selective NO2 Detection. Microchem. J. 2025, 216, 114735. [Google Scholar] [CrossRef]
  21. Do, D.T.; Nguyen, D.Y.N.; Tran, T.T.H.; Phan, H.P.; Luu, T.L.A.; Dang, T.T.; Pham, T.H.; Nguyen, H.L.; Nguyen, V.H.; Nguyen, C.T. Engineering Hierarchical Cubic WO3 Nanostructures for Sub-Ppb-Level NO2 Gas Sensor. Sens. Actuators A Phys. 2025, 393, 116847. [Google Scholar] [CrossRef]
  22. Do, D.T.; Nguyen, D.Y.N.; Pham, T.A.; Nguyen, C.T.; Nguyen, V.H. Comparative Study of Monoclinic and Cubic WO3 Nanoplates on NO2 Gas-Sensing Properties. RSC Adv. 2025, 15, 22930–22940. [Google Scholar] [CrossRef] [PubMed]
  23. Roopa; Pradhan, B.K.; Tyagi, D.; Salma; Mauraya, A.K.; Kushvaha, S.S.; Muthusamy, S.K. NO2 Gas Sensing Characteristics of WO3 Thin Films Synthesised by the Thermal Oxidation of DC Sputtered W Films: Effect of Oxidation Temperature. J. Alloys Compd. 2025, 1036, 181706. [Google Scholar] [CrossRef]
  24. Ganesan, M.; Harish, S.; Shanmugasundaram, K.; Mohan, M.K.; Archana, J.; Navaneethan, M. Highly Sensitive and Selective Au-Loaded WO3 Nanoplates for NO2 Gas Detection. Sens. Actuators B Chem. 2025, 440, 137900. [Google Scholar] [CrossRef]
  25. Jiang, H.-Y.; Chen, G.-L.; Xin, Y.-Y.; Shen, S.-K.; Deng, Z.-P.; Xu, Y.-M.; Huo, L.-H.; Gao, S. Honeycomb-like WO3 Architecture Derived from Grapevine Boosts Efficient Detection of Trace NO2 Gas at near Room Temperature. Sens. Actuators B Chem. 2025, 436, 137686. [Google Scholar] [CrossRef]
  26. Li, G.; Wang, Y.; Du, Y.; Xu, H.; Wang, Y. WO3-SnO2 Nanocomposites with Isotype Heterojunctions for Sensitive Detection of NO2. Mater. Lett. 2025, 396, 138743. [Google Scholar] [CrossRef]
  27. Qiu, Y.; Wang, Y. Synthesis, Growth Kinetics and Ultra-Sensitive Performance of Electrospun WO3 Nanofibers for NO2 Detection. Appl. Surf. Sci. 2023, 608, 155112. [Google Scholar] [CrossRef]
  28. Liaqat, M.J.; Hussain, S.; Shahid, A.; Amu-Darko, J.N.O.; Ibrahim, T.K.; Ibrahim, S.M.; Manavalan, R.K.; Zhang, X.; Qiao, G.; Liu, G. Hydrothermally Grown WO3-SnO2 Nanocomposites for Efficient NO2 Detection at Low Concentration. Sens. Actuators B Chem. 2025, 436, 137711. [Google Scholar] [CrossRef]
  29. Rani, S.; Dahiya, R.; Kumar, V.; Berwal, P.; Sihag, S. Hydrothermally Engineered WO3 Nanosheets as Potential NO2 Gas Sensor. Ionics 2025, 31, 993–1002. [Google Scholar] [CrossRef]
  30. Li, R.; Wang, Q.; Wang, Y.; An, B.; Yang, Y.; Wu, Z.; Wang, P.; Zhang, T.; Han, R.; Xie, E. Unraveling the Effect of Oxygen Vacancy on WO3 Surface for Efficient NO2 Detection at Low Temperature. ACS Appl. Mater. Interfaces 2024, 16, 51738–51747. [Google Scholar] [CrossRef]
  31. Singh, J.P.; Sharma, A.; Tomar, M.; Chowdhuri, A. WO3 and WO3-SnO2 Composite-Based Sensors for Low-Temperature Detection of NO2 Gas. J. Electron. Mater. 2024, 53, 6688–6699. [Google Scholar] [CrossRef]
  32. Kaur, H.; Bhatti, H.S.; Singh, K. Pr Doped SnO2 Nanostructures: Morphology Evolution, Efficient Photocatalysts and Fluorescent Sensors for the Detection of Cd2+ Ions in Water. J. Photochem. Photobiol. A Chem. 2020, 388, 112144. [Google Scholar] [CrossRef]
  33. Wang, C.; Ding, M.; Kou, X.; Guo, L.; Feng, C.; Li, X.; Zhang, H.; Sun, P.; Sun, Y.; Lu, G. Detection of Nitrogen Dioxide down to Ppb Levels Using Flower-like Tungsten Oxide Nanostructures under Different Annealing Temperatures. J. Colloid Interface Sci. 2016, 483, 314–320. [Google Scholar] [CrossRef]
  34. Wang, M.; Li, X.; Wang, Y.; Han, S.; Song, R.; Xu, Z.; Bai, L.; Hussain, S.; Liu, G.; Qiao, G.; et al. In-Situ Grown Hydrated Tungsten Oxide Nanosheets for Low Temperature Ppb-Level NO2 Detection with Alleviated Humidity Interference. Sens. Actuators B Chem. 2023, 396, 134623. [Google Scholar] [CrossRef]
  35. Wilken, M.; Ciftyürek, E.; Cwik, S.; Mai, L.; Mallick, B.; Rogalla, D.; Schierbaum, K.; Devi, A. CVD Grown Tungsten Oxide for Low Temperature Hydrogen Sensing: Tuning Surface Characteristics via Materials Processing for Sensing Applications. Small 2023, 19, 2204636. [Google Scholar] [CrossRef]
  36. Yadav, A.; Sharma, A.; Baloria, V.; Singh, P.; Gupta, G. Ultrahigh Sensitive NO Sensor Based on WO3 Film with Ppb-Level Sensitivity. Ceram. Int. 2023, 49, 7853–7860. [Google Scholar] [CrossRef]
  37. Bai, S.; Ma, Y.; Luo, R.; Chen, A.; Li, D. Room Temperature Triethylamine Sensing Properties of Polyaniline–WO3 Nanocomposites with p–n Heterojunctions. RSC Adv. 2016, 6, 2687–2694. [Google Scholar] [CrossRef]
  38. Bose, A.K.; Manhas, M.S.; Ganguly, S.N.; Sharma, A.H.; Banik, B.K. Carbide, Nitride and Boride Materials Synthesis and Processing; Weimer, A.W., Ed.; Springer Netherlands: London, UK, 1997; ISBN 978-94-010-6521-4. [Google Scholar]
  39. Nüchter, M.; Ondruschka, B.; Bonrath, W.; Gum, A. Microwave Assisted Synthesis — A Critical Technology Overview. Green. Chem. 2004, 6, 128–141. [Google Scholar] [CrossRef]
  40. Schütz, M.B.; Xiao, L.; Lehnen, T.; Fischer, T.; Mathur, S. Microwave-Assisted Synthesis of Nanocrystalline Binary and Ternary Metal Oxides. Int. Mater. Rev. 2018, 63, 341–374. [Google Scholar] [CrossRef]
  41. Modak, M.; Rane, S.; Jagtap, S. WO3: A Review of Synthesis Techniques, Nanocomposite Materials and Their Morphological Effects for Gas Sensing Application. Bull. Mater. Sci. 2023, 46, 28. [Google Scholar] [CrossRef]
  42. Yu, Y.; Zeng, W.; Xu, M.; Peng, X. Hydrothermal Synthesis of WO3·H2O with Different Nanostructures from 0D to 3D and Their Gas Sensing Properties. Phys. E Low-Dimens. Syst. Nanostruct. 2016, 79, 127–132. [Google Scholar] [CrossRef]
  43. Gui, Y.; Liu, Z.; Fang, S.; Tian, J.; Gong, F. Synthesis of Flower-like WO3/Graphene Nanocomposite by Microwave-Assisted Hydrothermal Method and the Enhanced Gas-Sensing Properties to Aniline. J. Mater. Sci. Mater. Electron. 2016, 27, 2890–2895. [Google Scholar] [CrossRef]
  44. Li, S.; Lin, P.; Zhao, L.; Wang, C.; Liu, D.; Liu, F.; Sun, P.; Liang, X.; Liu, F.; Yan, X.; et al. The Room Temperature Gas Sensor Based on Polyaniline@flower-like WO3 Nanocomposites and Flexible PET Substrate for NH3 Detection. Sens. Actuators B Chem. 2018, 259, 505–513. [Google Scholar] [CrossRef]
  45. He, M.; Xie, L.; Zhao, X.; Hu, X.; Li, S.; Zhu, Z.-G. Highly Sensitive and Selective H2S Gas Sensors Based on Flower-like WO3/CuO Composites Operating at Low/Room Temperature. J. Alloys Compd. 2019, 788, 36–43. [Google Scholar] [CrossRef]
  46. Hu, J.; Sun, Y.; Wang, X.; Chen, L.; Zhang, W.; Chen, Y. Synthesis and Gas Sensing Properties of Molybdenum Oxide Modified Tungsten Oxide Microstructures for Ppb-Level Hydrogen Sulphide Detection. RSC Adv. 2017, 7, 28542–28547. [Google Scholar] [CrossRef]
  47. Gurlo, A.; Bârsan, N.; Weimar, U. Metal Oxides. In Metal Oxides: Chemistry and Applications; Fierro, J.L.G., Ed.; CRC Press: Boca Raton, FL, USA, 2006; pp. 683–729. ISBN 9780367392222. [Google Scholar]
  48. Bai, S.; Zhang, K.; Shu, X.; Chen, S.; Luo, R.; Li, D.; Chen, A. Carboxyl-Directed Hydrothermal Synthesis of WO3 Nanostructures and Their Morphology-Dependent Gas-Sensing Properties. CrystEngComm 2014, 16, 10210–10217. [Google Scholar] [CrossRef]
  49. Di Natale, F.; Lancia, A. Recovery of Tungstate from Aqueous Solutions by Ion Exchange. Ind. Eng. Chem. Res. 2007, 46, 6777–6782. [Google Scholar] [CrossRef]
  50. Shirke, Y.M.; Porel Mukherjee, S. Selective Synthesis of WO3 and W18O49 Nanostructures: Ligand-Free PH-Dependent Morphology-Controlled Self-Assembly of Hierarchical Architectures from 1D Nanostructure and Sunlight-Driven Photocatalytic Degradation. CrystEngComm 2017, 19, 2096–2105. [Google Scholar] [CrossRef]
  51. Shi, J.; Hu, G.; Cong, R.; Bu, H.; Dai, N. Controllable Synthesis of WO3·nH2O Microcrystals with Various Morphologies by a Facile Inorganic Route and Their Photocatalytic Activities. New J. Chem. 2013, 37, 1538–1544. [Google Scholar] [CrossRef]
  52. Liang, S.; Zhu, S.; Chen, Y.; Wu, W.; Wang, X.; Wu, L. Rapid Template-Free Synthesis and Photocatalytic Performance of Visible Light-Activated SnNb2O6 Nanosheets. J. Mater. Chem. 2012, 22, 2670–2678. [Google Scholar] [CrossRef]
  53. Djaoued, Y.; Balaji, S.; Brüning, R. Electrochromic Devices Based on Porous Tungsten Oxide Thin Films. J. Nanomater. 2012, 2012, 674168. [Google Scholar] [CrossRef]
  54. Daniel, M.F.; Desbat, B.; Lassegues, J.C.; Gerand, B.; Figlarz, M. Infrared and Raman Study of WO3 Tungsten Trioxides and WO3, XH2O Tungsten Trioxide Tydrates. J. Solid State Chem. 1987, 67, 235–247. [Google Scholar] [CrossRef]
  55. Díaz–Reyes, J.; Dorantes–García, V.; Pérez–Benítez, A.; Balderas–López, J.A. Obtaining of Films of Tungsten Trioxide (WO3) by Resistive Heating of a Tungsten Filament. Superficies y vacío 2008, 21, 12–17. [Google Scholar]
  56. Mukherjee, R.; Sahay, P.P. Effect of Precursors on the Microstructural, Optical, Electrical and Electrochromic Properties of WO3 Nanocrystalline Thin Films. J. Mater. Sci. Mater. Electron. 2015, 26, 6293–6305. [Google Scholar] [CrossRef]
  57. Wang, Z.; Sun, P.; Yang, T.; Gao, Y.; Li, X.; Lu, G.; Du, Y. Flower-like WO3 Architectures Synthesized via a Microwave-Assisted Method and Their Gas Sensing Properties. Sens. Actuators B Chem. 2013, 186, 734–740. [Google Scholar] [CrossRef]
  58. Wang, C.; Li, X.; Feng, C.; Sun, Y.; Lu, G. Nanosheets Assembled Hierarchical Flower-like WO3 Nanostructures: Synthesis, Characterization, and Their Gas Sensing Properties. Sens. Actuators B Chem. 2015, 210, 75–81. [Google Scholar] [CrossRef]
  59. Mirabella, D.A.; Aldao, C.M. Dependence of N-Type Metal-Oxide Gas Sensor Response on the Pressure of Oxygen and Reducing Gases. ACS Sens. 2024, 9, 1938–1944. [Google Scholar] [CrossRef]
  60. Staerz, A.; Russ, T.; Weimar, U.; Barsan, N. Understanding the Sensing Mechanism of WO3 Based Gas Sensors. In Proceedings of the 2019 IEEE International Symposium on Olfaction and Electronic Nose (ISOEN), Fukuoka, Japan, 26–29 May 2019; IEEE: Fukuoka, Japan, 2019. [Google Scholar]
  61. Staerz, A.; Somacescu, S.; Epifani, M.; Kida, T.; Weimar, U.; Barsan, N. WO3-Based Gas Sensors: Identifying Inherent Qualities and Understanding the Sensing Mechanism. ACS Sens. 2020, 5, 1624–1633. [Google Scholar] [CrossRef]
  62. Hua, Z.; Li, Y.; Zeng, Y.; Wu, Y. A Theoretical Investigation of the Power-Law Response of Metal Oxide Semiconductor Gas Sensors Ι: Schottky Barrier Control. Sens. Actuators B Chem. 2018, 255, 1911–1919. [Google Scholar] [CrossRef]
  63. Potyrailo, R.A.; Go, S.; Sexton, D.; Li, X.; Alkadi, N.; Kolmakov, A.; Amm, B.; St-Pierre, R.; Scherer, B.; Nayeri, M.; et al. Extraordinary Performance of Semiconducting Metal Oxide Gas Sensors Using Dielectric Excitation. Nat. Electron. 2020, 3, 280–289. [Google Scholar] [CrossRef]
  64. Beknalkar, S.A.; Patil, V.L.; Harale, N.S.; Suryawanshi, M.P.; Patil, A.P.; Patil, V.B.; Kim, J.H.; Patil, P.S. 2-D to 3-D Conversion of WO3 Nanostructures Using Structure Directing Agent for Enhanced NO2 Gas Sensing Performance. Sens. Actuators A Phys. 2020, 304, 111882. [Google Scholar] [CrossRef]
  65. Wang, X.; Ansari, D. Superior Sensitivity and Low Detection Limit of NO2 Sensor Based on Layered Tungsten Oxide. J. Environ. Chem. Eng. 2022, 10, 107786. [Google Scholar] [CrossRef]
  66. Gao, M.; Zhang, W.; Guo, J.; Liu, L. Gas Sensor Based on Two-Dimensional GaSe for Sensitive NO2 Detection. Sens. Actuators B Chem. 2025, 444, 138447. [Google Scholar] [CrossRef]
  67. Ambi, R.R.; Mali, R.A.; Pawar, A.B.; Mulla, M.G. Temperature Controllable Synthesis of NiO Microflower-like Architecture for Selective Detection of NO2. Ceram. Int. 2025, 51, 31407–31416. [Google Scholar] [CrossRef]
  68. Du, H.; Li, X.; Zhang, Z.; Li, Q.; Zhao, L.; Wang, J. Ultrasensitive NO2 Sensor Based on In2O3 Nanocubes/SnS2 Nanoflowers Hetero Composites. Sens. Actuators B Chem. 2025, 444, 138277. [Google Scholar] [CrossRef]
  69. Rakshit, S.; Mondal, S.; Jana, P.C.; Datta, R. CuO Nanoparticles: Structural, Optical and Electronic Properties with Gas Sensing Performance for Efficient Detection of NO2 Gas. J. Mater. Sci. Mater. Electron. 2025, 36, 1260. [Google Scholar] [CrossRef]
  70. Zhang, S.; Xing, M.; Zhang, B.; Zhang, B.; Luo, N.; Wang, Y. NiMoO4/NiO Heterojunction Based Low Detection Limit High Sensitivity NO2 Gas Sensor. Microchem. J. 2025, 215, 114290. [Google Scholar] [CrossRef]
  71. Park, J.-C.; Kim, S.; Yuk, Y.; Lee, D.; Oh, I.; Scott, M.C.; Oh, M.H.; Lee, S. Non−noble Metal Catalyst Embedded WO3 Microspheres for Enhancement of NO2 Gas Sensing. Sens. Actuators B Chem. 2026, 447, 138825. [Google Scholar] [CrossRef]
  72. Biswas, S.; Ranwa, S. Morphology Tunability to Large-Scale Cross-Linked Vertically Grown MoS2 Nanopetals Using Ambient Pressure Chemical Vapor Deposition for NO2 Sensing. J. Electron. Mater. 2025. [Google Scholar] [CrossRef]
  73. Chen, Q.; Shi, Y.; Zhao, K.; Niu, H.; Liu, J. Highly Sensitive Flexible NO2 Resistive Gas Sensor Based on Polythiophene/Multi-Walled Carbon Nanotubes/SnO2 Ternary Composite. J. Appl. Polym. Sci. 2025, e58105. [Google Scholar] [CrossRef]
  74. Hambir, S.; Chowdhari, U.; Pattanshetti, S.; Pujari, B.; Jagtap, S. Experimental and Theoretical Investigations of Flowerlike WO3-RGO Heterostructure for NO2 Gas Sensing at Low Operating Temperature. J. Alloys Compd. 2025, 1039, 183137. [Google Scholar] [CrossRef]
  75. Guo, J.; Chang, X.; Zheng, W.; Zhang, J.; Liu, X. Synergistic Enhancement of NO2 Sensing via Pd-Sensitized Oxygen Vacancy Engineering in WO3 Nanoplates. ACS Sens. 2025, 10, 7661–7669. [Google Scholar] [CrossRef]
  76. Srivastava, I.; Dwivedi, C.; Srivastava, S.; Dhanda, A.; Husale, S.; Gupta, G.; Singh, P. Oxygen Vacancy Enriched ZnO Nanorods for Highly Sensitive NOx Gas Sensor. Mater. Lett. 2026, 402, 139317. [Google Scholar] [CrossRef]
  77. Sopiha, K.V.; Malyi, O.I.; Persson, C.; Wu, P. Chemistry of Oxygen Ionosorption on SnO2 Surfaces. ACS Appl. Mater. Interfaces 2021, 13, 33664–33676. [Google Scholar] [CrossRef]
  78. Gurlo, A. Interplay between O2 and SnO2: Oxygen Ionosorption and Spectroscopic Evidence for Adsorbed Oxygen. ChemPhysChem 2006, 7, 2041–2052. [Google Scholar] [CrossRef]
  79. Yamazoe, N.; Fuchigami, J.; Kishikawa, M.; Seiyama, T. Interactions of Tin Oxide Surface with O2, H2O AND H2. Surf. Sci. 1979, 86, 335–344. [Google Scholar] [CrossRef]
  80. Ciftyurek, E.; Li, Z.; Schierbaum, K. Adsorbed Oxygen Ions and Oxygen Vacancies: Their Concentration and Distribution in Metal Oxide Chemical Sensors and Influencing Role in Sensitivity and Sensing Mechanisms. Sensors 2023, 23, 29. [Google Scholar] [CrossRef] [PubMed]
  81. Giancaterini, L.; Emamjomeh, S.M.; De Marcellis, A.; Palange, E.; Resmini, A.; Anselmi-Tamburini, U.; Cantalini, C. The Influence of Thermal and Visible Light Activation Modes on the NO2 Response of WO3 Nanofibers Prepared by Electrospinning. Sens. Actuators B Chem. 2016, 229, 387–395. [Google Scholar] [CrossRef]
  82. Epifani, M.; Prades, J.D.; Comini, E.; Pellicer, E.; Avella, M.; Siciliano, P.; Faglia, G.; Cirera, A.; Scotti, R.; Morazzoni, F.; et al. The Role of Surface Oxygen Vacancies in the NO2 Sensing Properties of SnO2 Nanocrystals. J. Phys. Chem. C 2008, 112, 19540–19546. [Google Scholar] [CrossRef]
  83. Han, X.; Yin, X. Density Functional Theory Study of the NO2-Sensing Mechanism on a WO3 (0 0 1) Surface: The Role of Surface Oxygen Vacancies in the Formation of NO and NO3. Mol. Phys. 2016, 114, 3546–3555. [Google Scholar] [CrossRef]
  84. Kucharski, S.; Vorochta, M.; Piliai, L.; Beale, A.M.; Blackman, C. Interplay between CO and Surface Lattice Oxygen Ions in the Vacancy-Mediated Response Mechanism of SnO2-Based Gas Sensors. ACS Sens. 2025, 10, 1898–1908. [Google Scholar] [CrossRef]
  85. Suman, P.H.; Junker-Reiss, B.; Weimar, U.; Orlandi, M.O.; Barsan, N. Unraveling the Gas Sensing Mechanism of Single-Crystalline Sn3O4 Nanobelts Using Operando DRIFT Spectroscopy and Isotopically Labeled Gases. Sens. Actuators B Chem. 2026, 447, 138909. [Google Scholar] [CrossRef]
  86. Wang, C.; Yin, L.; Zhang, L.; Xiang, D.; Gao, R. Metal Oxide Gas Sensors: Sensitivity and Influencing Factors. Sensors 2010, 10, 2088–2106. [Google Scholar] [CrossRef]
  87. Staerz, A.; Weimar, U.; Barsan, N. Understanding the Potential of WO3 Based Sensors for Breath Analysis. Sensors 2016, 16, 1815. [Google Scholar] [CrossRef]
  88. Yang, L.; Marikutsa, A.; Rumyantseva, M.; Konstantinova, E.; Khmelevsky, N.; Gaskov, A. Quasi Similar Routes of NO2 and NO Sensing by Nanocrystalline WO3: Evidence by In Situ DRIFT Spectroscopy. Sensors 2019, 19, 3405. [Google Scholar] [CrossRef]
  89. Wei, Z.; Zhou, Q.; Lu, Z.; Xu, L.; Gui, Y.; Tang, C. Morphology Controllable Synthesis of Hierarchical WO3 Nanostructures and C2H2 Sensing Properties. Phys. E Low-Dimens. Syst. Nanostruct. 2019, 109, 253–260. [Google Scholar] [CrossRef]
  90. Toldra-Reig, F.; Serra, J.M. Development of Potentiometric Sensors for C2H4 Detection. Sensors 2018, 18, 2992. [Google Scholar] [CrossRef] [PubMed]
  91. Chang, C.-H.; Chou, T.-C.; Chen, W.-C.; Niu, J.-S.; Lin, K.-W.; Cheng, S.-Y.; Tsai, J.-H.; Liu, W.-C. Study of a WO3 Thin Film Based Hydrogen Gas Sensor Decorated with Platinum Nanoparticles. Sens. Actuators B Chem. 2020, 317, 128145. [Google Scholar] [CrossRef]
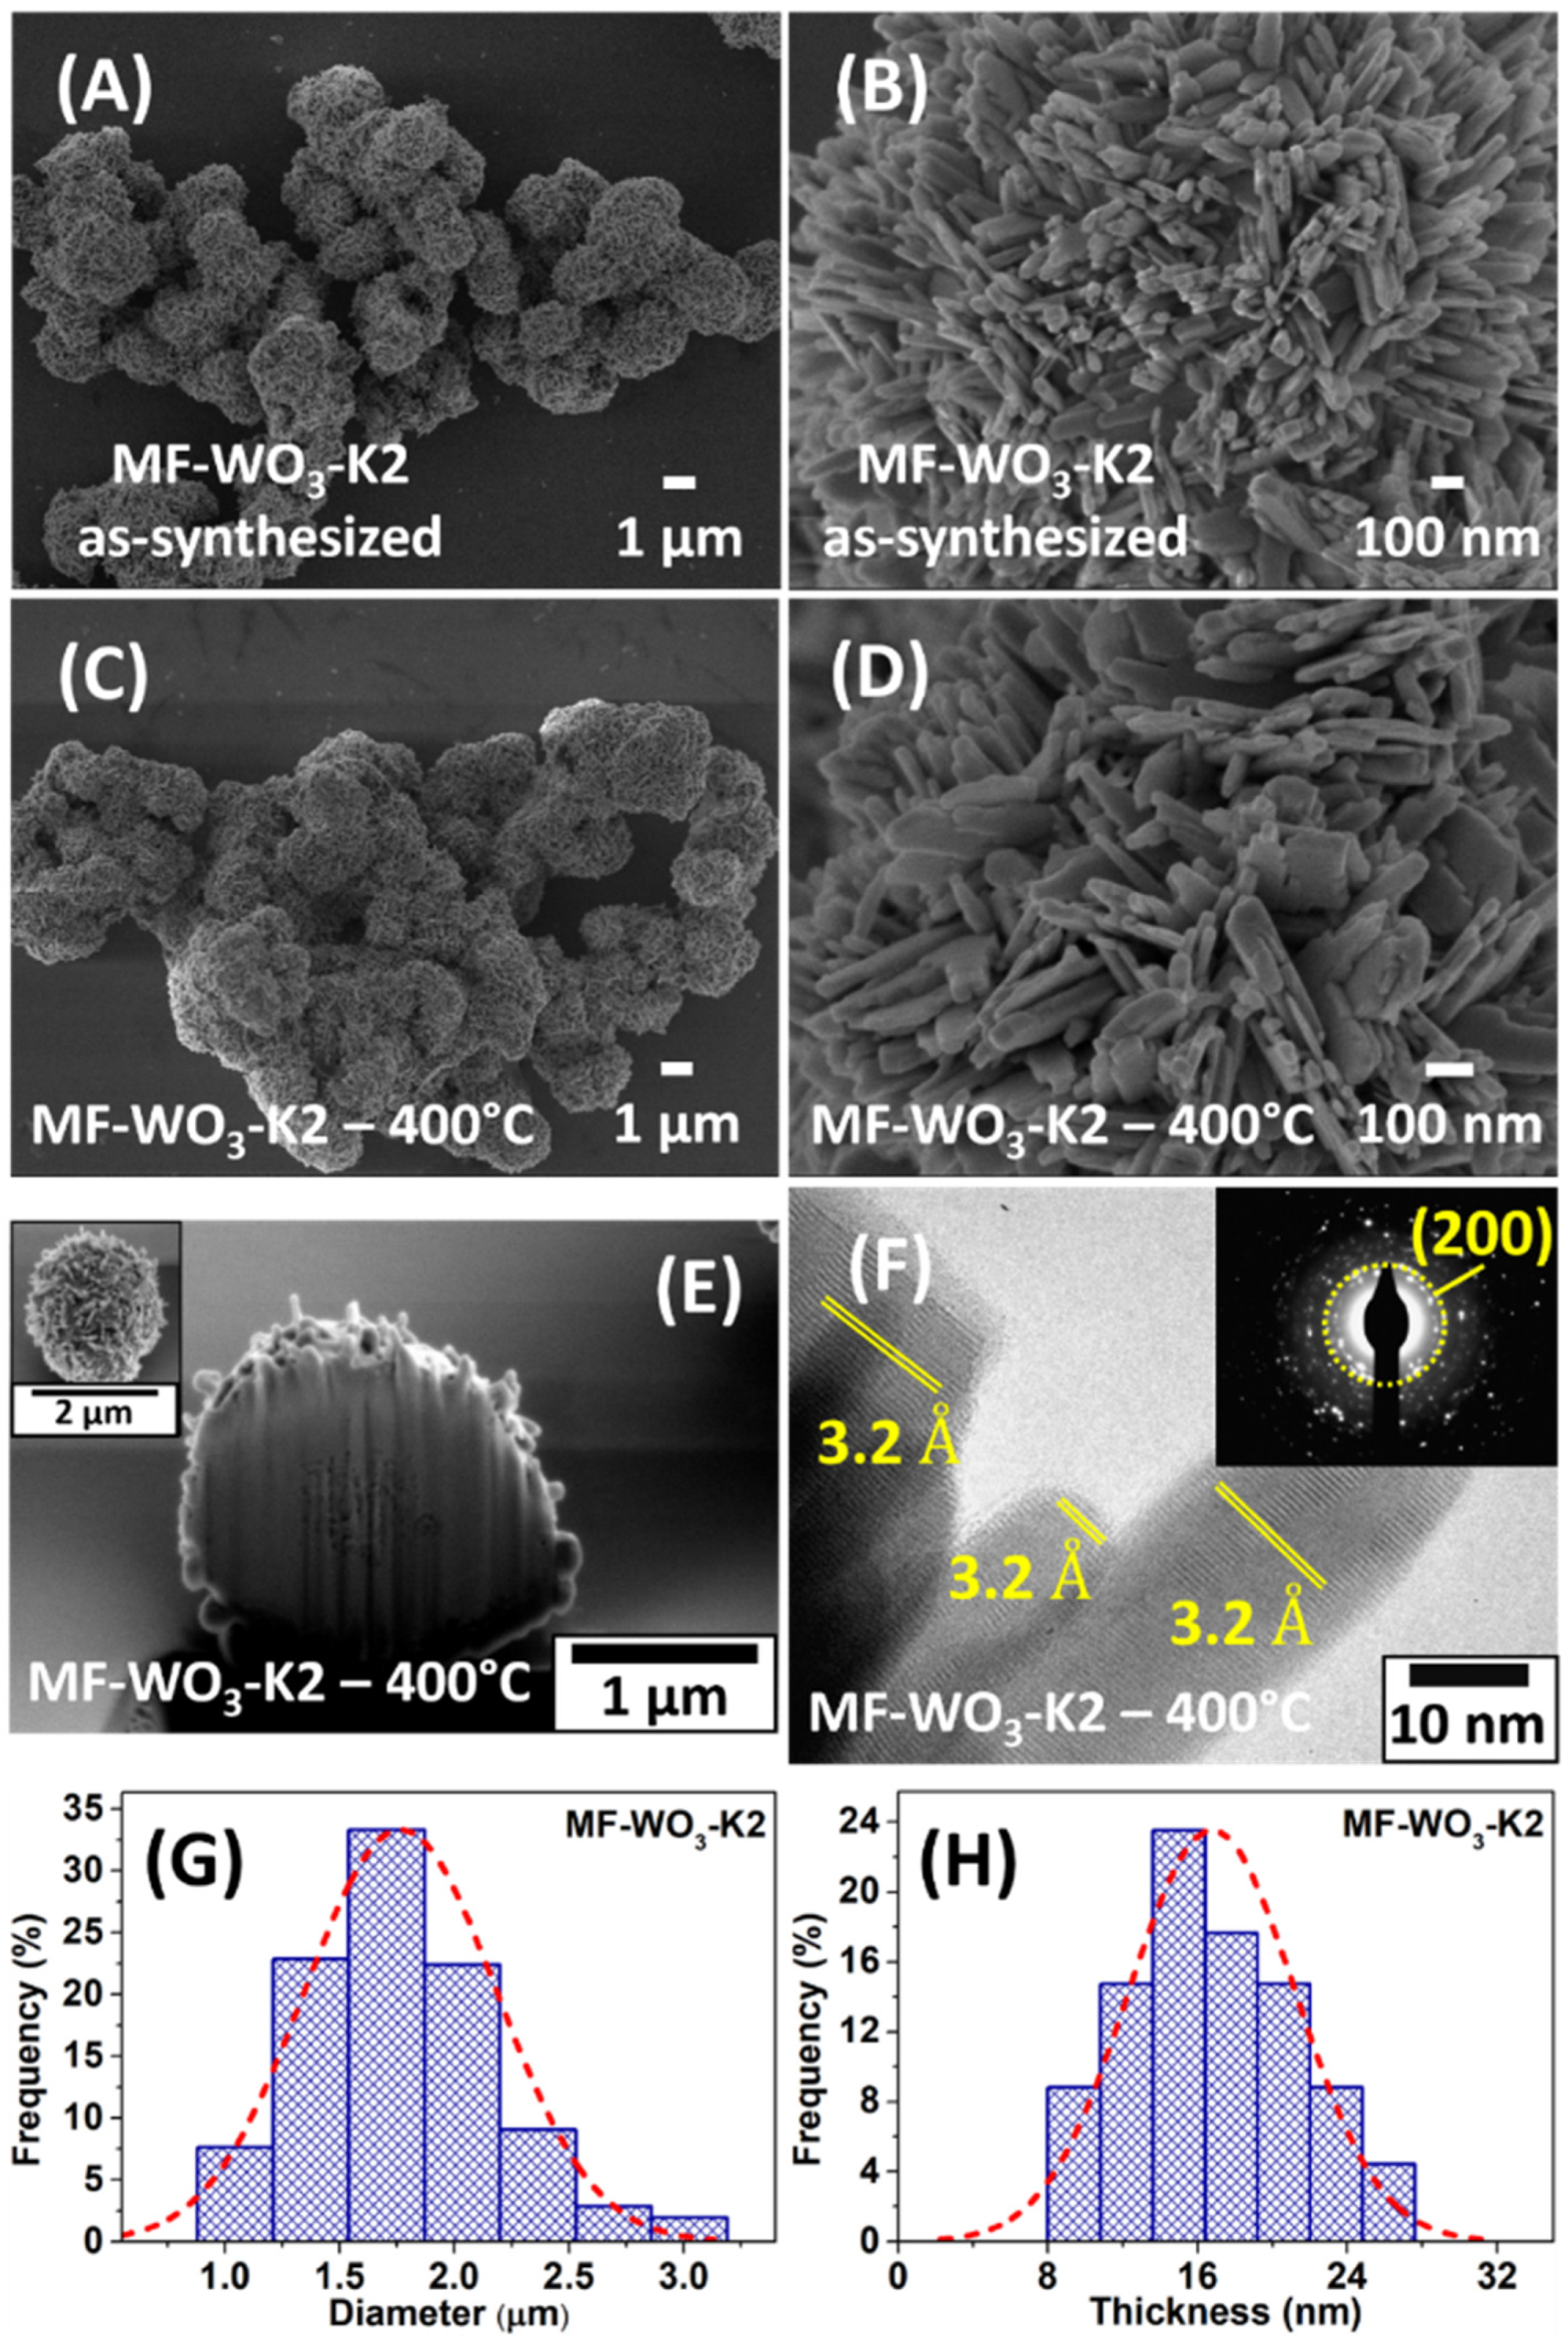
Figure 1. SEM images of (A,B) the as-synthesized microflowers and (C,D) after heat treatment at 400 °C. (E) Cross-section SEM image of a single microflower using a dual-beam microscope. (F) HRTEM image with SAED analysis (inset) of MF-WO3-K2. (G,H) Distribution of (A) microflower diameters and (B) nanoplate thicknesses and the Gaussian fit after heat treatment at 400 °C.
Chemosensors 13 00390 g001
Figure 2. (A) XRD analysis of as-synthesized microflowers (MF- W O 3 0.33 H 2 O -K2) before and after heat treatment at 400 °C (MF-WO3-K2). (B) TG analysis of the as-synthesized microflowers.
Chemosensors 13 00390 g002
Figure 3. (A) Raman spectra, (B) UV-Vis analysis, (C) nitrogen adsorption/desorption isotherms, and (D) pore size distribution of the MF-WO3-K2 microflowers.
Chemosensors 13 00390 g003
Figure 4. (A) Resistance of the MF-WO3-K2 sensor as a function of time during exposures to NO2 concentrations ranging from 2 ppm to 100 ppm at operating temperatures between 100 °C and 300 °C. (B) Sensor signal as a function of NO2 concentrations, calculated from resistance data shown in (A).
Chemosensors 13 00390 g004
Figure 5. (A) Resistance versus time plot for the MF-WO3-K2 device at 150 °C for several concentrations of reducing gases (CO, H2, C2H2, and C2H4). (B) Comparison of sensor signals for 5 ppm of the analyzed gases at 150 °C.
Chemosensors 13 00390 g005
Figure 6. (A) Sensor signal versus time and (B) linear plot of sensor signal as a function of NO2 concentrations fitted with a power-law function for six MF-WO3-K2 devices at 150 °C. (C) Log-log plot of l o g S versus log c N O 2 and the linear calibration curve.
Chemosensors 13 00390 g006
Figure 7. (A) Gas detection tests of MF-WO3-K2 under seven cycles of exposure to NO2 at a concentration of 25 ppm. (B) Average response and recovery times as a function of NO2 concentrations ranging from 2 to 100 ppm at 150 °C for the six MF-WO3-K2 sensors.
Chemosensors 13 00390 g007
Figure 8. (A) Linear plot of resistance of the MF-WO3-K2 device as a function of NO2 concentrations at 150 °C fitted with a power-law function. (B) Log-log plot of l o g R versus log c N O 2 with the corresponding linear calibration curve.
Chemosensors 13 00390 g008
Figure 9. Representations of the interaction mechanisms between the WO3 surface and (A) O2, (B) NO2, and (C) CO gases at 150 °C. ( E : electron energy; E c : energy of conduction band; E f : Fermi level; E v : energy of valence band; E 3 < E 1 < E 2 : potential barrier energies).
Chemosensors 13 00390 g009
Table 1. Sensor signal with the standard deviation of the MF-WO3-K2 sensor at 150 °C for NO2 concentrations ranging from 2 to 100 ppm.
NO2 Concentration (ppm)Sensor Signal ( R N O 2 / R g a s ) (SD)
259 (7)
5225 (44)
10464 (117)
25927 (231)
501560 (117)
1002372 (97)
Table 2. Average response and recovery times, including standard deviations, of the MF-WO3-K2 sensor at 150 °C for NO2 concentrations ranging from 2 to 100 ppm.
NO2 Concentration
(ppm)
Average Response
Time (min) (SD)
Average Recovery
Time (min) (SD)
2 14.4 (0.9)2.3 (0.6)
5 14.5 (0.5)2.4 (0.5)
10 11.6 (1.9)3.0 (0.3)
25 7.6 (2.5)3.7 (1.1)
50 7.5 (1)4.4 (1.3)
100 7.4 (1.7)9.1 (1.5)
Table 3. Constant values for LOD calculation at 150 °C.
Constants a b R ¯ 0 σ 0
Values 3.84 · 10 7 0.94 1.25 · 10 6 5.6 · 10 5
Table 4. Summary of the performance of the MF-WO3-K2 sensor and a comparison with literature reports on WO3-based sensors for NO2 detection.
WO3 Material Operating Temperature (°C)NO2
Concentration (ppm)
Sensor
Signal
Response/
Recovery Times (s)
LODReference
MF-WO3-K2
sensor
1505225 *
226 **
22,578% ***
870/14465 ppbThis work
WO3 Nanofibers 15010220 *-0.5 ppm[10]
WO3 Microflowers 15010055.5 *9/2251 ppm[64]
WO3 nanosheets 10010460 *54/63-[9]
WO3 Layer-like 1605106 **32/13-[65]
GaSe 150283% *** 80 ppb[66]
NiO 20054.2% ***6/78 [67]
In2O3/SnS2180515.61 *34/6525 ppb[68]
CuO 2001030% *** 1 ppm[69]
NiMoO4/NiO 160116.18 *32/7174.7 ppb[70]
WO3
S: WO3
15055.6 *
578 *
186/>3000
185/130
-
54
[71]
MoS2 nanopetal 10010061.78% ***22/2251 ppm[72]
PTh/MWCNT/SnO215010076.8% ***23/75-[73]
WO3-rGO
heterostructure
100577 **24/457-[74]
Pd-WO3-Ov16010106.44 *37.2/28.551 ppb[75]
ZnO nanorods 250508.8 *28/20-[76]
* ( R N O 2 / R a i r ) , ** ( R N O 2 R a i r ) / R a i r , *** 100 % · ( R N O 2 R a i r ) / R a i r .
Disclaimer/Publisher’s Note: The statements, opinions and data contained in all publications are solely those of the individual author(s) and contributor(s) and not of MDPI and/or the editor(s). MDPI and/or the editor(s) disclaim responsibility for any injury to people or property resulting from any ideas, methods, instructions or products referred to in the content.