Abstract
Nickelate oxides show promise for biosensing applications, especially in glucose detection. Creating nickelate-based biosensors involves utilizing their electron-correlated structure and the metal–insulator (MI) transition, which endows them with unique electronic, magnetic, and catalytic properties. Chemical or oxygen vacancies can alter their conductivity and catalytic activity, enabling redox-based detection. In this study, Nd1−xEuxNiO3 films (0 < x < 0.35) functionalized with Glucose Oxidase (GOx) were tested for glucose sensing. Eu substitution shifts the MI transition temperature (TMI) from 200 K (x = 0) to 340 K (x = 35). At room temperature, these films undergo a metallic-to-insulator phase transition, which, along with the Ni3+/Ni2+ ratios, influences their sensing capabilities. Time-resolved electrical resistance measurements monitored how glucose interacts with the film surfaces. The sample with x = 0.3 exhibited a measurable resistance change in response to glucose concentrations ranging from 10−12 to 0.5 M, with a sensitivity of 9.1 mM−1 and a limit of detection (LOD) of approximately 0.47 μM. Reproducibility and interference tests with other sugars yielded good results across all samples. Eu doping in NdNiO3 enhances their sensing response, highlighting the importance of electronic state and MI transition in the sensing performance of these nickelate-based glucose sensors.
1. Introduction
Glucose is an essential carbohydrate in the human body, involved in crucial metabolic processes such as oxidative phosphorylation and glycolysis, which contribute to the synthesis of proteins, glycogen, and lipids [1,2]. However, one of the main diseases associated with this carbohydrate is diabetes, a common disease that requires monitoring the glucose level accurately, sensitively, reliably, quickly, and in a way that allows the patient to measure it daily [3]. Typically, in glucose monitoring, glucose/enzyme reactions produce hydrogen peroxide (H2O2), which, despite being an unstable molecule, can be harmful, for example, during the metabolism of proteins and carbohydrates, among other processes.
Various analytical methods have been proposed to measure glucose levels in different body fluids, classified by their invasiveness (invasive, minimally invasive, or non-invasive techniques). In both blood and sweat analysis, various methods, including spectroscopy, electrochemistry, and chromatography, are effectively used in different studies, providing high-sensitivity and selectivity results [4,5,6,7].
These glucose sensors are classified by their working principles into two types: non-enzymatic and enzymatic. Both promote glucose oxidation, leading to changes in the sensor’s electrical signal response [4]. In enzymatic sensors, glucose is detected indirectly by the formation of H2O2. Conversely, non-enzymatic sensors utilize nanomaterials, such as metals and metal oxides, to mimic enzymatic properties and modify the properties of the analyte [4,8]. The glucose oxidase (GOx) enzyme is commonly used in glucose sensors because of its high specificity and selectivity. Typically, enzymatic sensing involves the transfer of electrons during oxidation reactions between GOx and glucose. Specifically, GOx, which contains flavin adenine dinucleotide (FAD), catalyzes the conversion of glucose to gluconolactone and reduces GOx-FAD to GOx-FADH2. This reaction produces current or voltage changes that are usually measured at the electrode [4]. The main challenges in developing enzymatic glucose sensors include immobilizing GOx on the electrode and preventing its denaturation and deactivation due to changes in pH or temperature [7].
In glucose non-enzymatic sensors, metal oxides like CuO2 nanoparticles serve as electrocatalysts to transfer electrons during glucose oxidation. It is not a straightforward reaction that happens in several steps, depending on the materials. Generally, CuO2 is converted into CuOOH, which reacts with glucose to produce Cu(OH)2 and gluconic acid [4]. The advantage of these sensors is their stability; however, their drawbacks include low selectivity and reproducibility, mainly due to low conductivity or high agglomeration [7].
There are different types of enzymatic and non-enzymatic glucose sensors, which have been combined with various nanomaterials. Recently, GOx combined with nanomaterials and Au-MoS2 peroxidase (POD)-like nanoenzymes has been used in glucose sensors [8,9,10]. Non-enzymatic glucose sensors have been extensively studied using metal and metal oxide nanostructures to enable their application in glucose detection sensors. Among these materials, we can include nanocubes and nanospheres of Fe3O4 coated with SiO2 and functionalized with poly(acrylic) acid to detect proteins [11], metal oxide nanoparticles such as CuO, Cu2O, MnO2, NiO, CoOx [4,12,13,14], carbon-based and composite materials [7,15,16] and perovskite oxides like Sr0.85Ce0.15FeO3, La1−xSrxMnO3 (0.1 < x < 0.6), RNiO3 (R = La, Nd, Sm) [9,17,18,19,20]. The advantages of using perovskite oxides include the ability to control their physical properties through doping, their low electrical conductivity, and the presence of oxygen vacancies in their crystal structure. These features contribute to their capacity to catalyze the oxidation process or to serve as glucose sensors.
Perovskite nickelates RNiO3 (R = rare earth) display significant physical properties that are directly linked to their crystalline and electronic structures [21]. Usually, these compounds (R ≠ La) undergo a metal–insulator transition (MIT), which is highly sensitive to changes in composition, doping, and lattice strain. These features enable the customization and enhancement of the electronic and chemical properties of the nickelate for specific sensing applications [9,10,22,23,24].
At low temperatures, RNiO3 (R ≠ La) compounds exhibit an insulator state, and a metal–insulator transition (MIT) occurs during heating, leading to metallic behavior above the MIT temperature (TMI). At TMI, their perovskite orthorhombic distorted structure (Pbnm) typically shifts to a monoclinic symmetry (P21/n), with two different Ni-O bond lengths, and the paramagnetic state transitions into an antiferromagnetic order [25]. When this electronic localization happens, a charge disproportionation 2Ni3+ → Ni3+δ + Ni3−δ is observed, establishing a charge-ordered (CO) state. The Ni-O-Ni bond angle plays a key role in predicting the electronic bandwidth and magnetic interactions. A smaller rare earth cation causes a more distorted structure, which is observed to result in a monotonic increase in the MIT temperature as the ionic radius of the rare earth cations decreases; these values range from 145 K (Pr) to 500 K (Lu), respectively [26]. For R = Pr and Nd, the TMI is close to the magnetic ordering temperature (TN); for other rare earth cations, such as R = Sm, Eu, TMI exceeds TN. Consequently, as the size of the rare earth cation decreases in RNiO3, the Ni-O-Ni bond angle and the overlap of O 2p and Ni 3d bands decrease, which also causes rotation of NiO6 octahedra and influences MIT and related properties of these compounds.
It is noteworthy that the thermally driven TMI exhibited by the nickelates has a rich phase diagram, while the magnetic and electronic properties can be controlled by the size of the rare earth cation. It should also be noted that these RNiO3 compounds are challenging to obtain in bulk because they must retain the unstable Ni3+ state, which requires high oxygen pressure during synthesis. Generally, producing RNiO3 thin films involves low or partial oxygen pressures, but this can also lead to the formation of non-stoichiometric oxygen in these materials films [27].
It is important to note that synthesizing RNiO3 compounds in bulk form is very challenging because maintaining the unstable Ni3+ oxidation state requires high oxygen pressure during synthesis. Typically, RNiO3 thin films are prepared under lower or partial oxygen pressures. However, this often causes the films to have non-stoichiometric oxygen, which affects their final composition and properties. Oxygen vacancies in RNiO3 compounds can affect their magnetic, structural, and electronic properties. Their presence causes elongation of the Ni-O bonds and bending of the Ni-O-Ni angles, impacting their charge ordering [21].
Due to their exceptional properties, nickelates are used as sensing materials for various biochemical compounds, including glucose, glutamate, ascorbic acid, and trifluoperazine [9,10,27,28]. LaNiO3 nanofibers and NdNiO3 nanoparticles were used as electrodes in a non-enzymatic glucose sensor that exhibits high selectivity and sensitivity [17,19]. Here, the electro-oxidation mechanism of the catalytic oxidation of glucose involves the transformation of Ni2+ to Ni3+, which oxidizes glucose into gluconolactone and reduces the metal back to Ni2+. A similar result can be observed in non-enzymatic ascorbic acid biosensors made from NdNiO3 nanotubes synthesized at ambient oxygen pressure, which contain Ni3+/Ni2+ and oxygen vacancies [28]. This electronic configuration facilitates charge transfer between the oxide nanotubes and ascorbic acid, resulting in the oxidation of ascorbic acid to form dehydroascorbic acid. Doped nickelate, such as LaNi0.6Co0.4O3 nanoparticles, was also used as electrodes for sensing devices to detect glucose and H2O2 in blood serum [29].
As observed in thin film platforms of SmNiO3 and NdNiO3/Nafion, which were used for studying enzymatic glucose and glutamate biosensors for constructing neurotransmitters, the glucose oxidase enzyme is attached to the Au-SmNiO3 substrate [9,10]. The oxidation mechanism involves the transfer of hydrogen atoms from glucose to the GOx enzyme and then into the electronic structure of the nickelate. Zhang et al. [9] describe that these hydrogen bonds with oxygen anions and occupy interstitial sites of the NiO6 octahedra in SmNiO3, changing the occupancy of the Ni eg orbitals and affecting its electrical resistance. The GOx role is to mediate the glucose oxidation reaction without external energy input.
In this context, we synthesized Nd1−xEuxNiO3 thin films (x = 0, 0.30, and 0.35) using the chemical solution deposition method at low temperature and ambient oxygen pressure. It should be noted that the synthesis of these nickelate films typically requires high oxygen pressure, so our initial challenge was to synthesize these films effectively. These films will also exhibit a mixture of oxidation states, Ni3+/Ni2+, and oxygen vacancies as observed by Rossato et al. [28], which can provide valuable insights. Additionally, producing Eu-doped NdNiO3 thin films should shift the MI transition to temperatures between 200 K and 400 K. Most sensor studies were performed at room temperature in either the metallic state of LaNiO3 or NdNiO3, or in the insulating state of SmNiO3. In this work, we analyze compounds with different electronic states of the metal, specifically the metal–insulator edge and the insulator state between the metallic and insulating phases. This demonstrates how the electronic state interacts with glucose/glucose oxidase and their potential as a platform for enzymatic glucose sensors.
2. Materials and Methods
2.1. Chemicals
Citric Acid, ethylene glycol, Ni(CH3CO2)3.4H2O, Nd(CH3CO2)3.H2O, Eu(CH3CO2)3.H2O, Cysteamine, GOx enzyme (Aspergillus niger, type VII), H2O2 35% PA, and D-(+)-glucose. All reagents were of analytical grade and high purity, purchased from Sigma-Aldrich. Solutions were prepared using high-purity water (Direct-Q UV Ultra purification System, Millipore Sigma-Merck, Darmstadt, Germany). The phosphate buffer (PB) at pH 6.8 was used as the electrolyte.
2.2. Precursor Solution
The Nd1−xExNiO3 (x = 0.0; 0.30; 0.35) precursor solutions were prepared by dissolving stoichiometric amounts of Nd/Eu-Ni in aqueous citric acid at 70 °C with constant stirring. Then, hydrated neodymium acetate and hydrated europium(III) acetate were stirred into the solution until they were fully dissolved (~1 h). Ethylene glycol was added and maintained under these conditions for about 1 h to allow for the complexation of metal ions and subsequent polyesterification. Previously, the viscosity of these solutions was adjusted to approximately 5 cP using a digital viscometer (Brookfield Viscometer DV-I Prime).
Nd1−xEuxNiO3 Film Deposition
Before the deposition process, the Si(100)/SiO2 substrates were cleaned with strong acids and bases, along with H2O2 to remove possible contamination from organic residues. The precursor solutions were applied to the substrates using a spin coater (KW-4A, Chemat Technology—SPI supplies, West Chester, PA, USA), spinning at 3000 rpm for 3 s and then at 7000 rpm for 20 s. The films were dried at approximately 50 °C for 10 min to eliminate solvents. To achieve film thicknesses ranging from 200 to 400 nm, six layers of each composition were deposited for all samples. Each layer was heat-treated at 300 °C for 2 h and then at 700 °C for 4 h in a tubular electric furnace (Lindberg Blue M, Thermo Fisher Scientific, Waltham, MA, USA) within an oxygen atmosphere (O2). The samples are designated as NdNiO3 (NNO), Nd0.7Eu0.3NiO3 (NENO30), and Nd0.65Eu0.35NiO3 (NENO35).
2.3. Apparatus and Procedures
All films were characterized by X-ray powder diffraction (XRD) using a D8-Focus diffractometer (Bruker AXS, GmbH, Billerica, MA, USA) equipped with a LynxEye 1D linear silicon strip detector and Cu-Kα radiation (λ = 1.54056 Å). All measurements were conducted at room temperature (25 °C), with scans from 20° to 60°. Fourier-transform infrared spectroscopy of these samples was performed using a Model 610-IR spectrophotometer (Varian—Agilent Techn., Palo Alto, CA, USA) with the PIKE diffuse reflectance accessory, covering the wavenumber range of 500 to 4000 cm−1 and a resolution of 4.0 cm−1. A field emission scanning electron microscope (JMS-6701F, JEOL, Tokyo, Japan), was used to analyze the homogeneity and structure of each Nd1−xEuxNiO3 thin film. X-ray photoelectron spectroscopy (XPS) was conducted with a Thermo Scientific K-Alpha+ spectrometer using Al Kα radiation. Spectral analysis was performed using CasaXPS software (2020, version 2.3.23PR1.0). The C 1 s peak (284.6 ± 0.1 eV) served as the reference for energy calibration. The background was corrected with a Shirley algorithm combined with a Lorentzian–Gaussian function. Absorption spectra were measured with a Cary 50 UV–Vis spectrophotometer (Varian—Agilent Techn., Palo Alto, CA, USA), covering the range of 200–1000 nm.
The electrical transport properties were measured by attaching copper terminals to the film’s surface with silver epoxy paint, which was cured at 100 °C for 10 min. The films were then connected to the sample holder of the Quantum Design PPMS (Physical Properties Measurement System, Quantum Design, San Diego, CA, USA). R(T) measurements were also performed on an 204 ARS closed-cycle cryostat (Advanced research system, Macungie, PA, USA) linked to a measurement system (Keithley SourceMeter 2400 (Tektronix, Cleveland, OH, USA), 331 temperature controller (Lake Shore Cryotronics, Woburn, MA, USA) and a microcomputer via GPIB/USB connection, using LabVIEW (version 10.0.1, 2010).
2.4. Bio-Interface
The first stage of this assembly involved depositing gold tracks on the surface of the Nd1−xEuxNiO3 films, using a lab-made thermal evaporation system to achieve a thickness of about 100 nm. To functionalize the films with GOx, we followed a protocol described in the literature that uses cysteamine to attach an oxidized GOx enzyme [9,10]. First, the samples were immersed in a 10 mM cysteamine (CysAm) solution for 2 h in a dark room at room temperature. They were then rinsed with water to remove unreacted cysteamine and dried in a spin coater.
Before depositing in the NNO/Au/CysAm or NENO/Au/CysAm, an oxidation step was performed on the GOx enzyme to stabilize it. For this, a pH 6.8 buffer of 0.1 M sodium phosphate was prepared for enzyme oxidation [9]. A 20 µM GOx solution was prepared by adding 30 mg of sodium metaperiodate to 5 mL of buffer. The solution was incubated for 1 h at 4 °C, then 6.97 µL of ethylene glycol was added to stop the reaction, followed by another 30-min incubation at room temperature. The product was purified through membrane dialysis for 24 h to collect oxidized GOx and exchange the buffer to 0.1 M PB at pH ~6.8. Finally, the NNO/Au/CysAm and NENO/Au/CysAm devices were immersed in this GOx solution for about 1 h at 4 °C, then rinsed with deionized water. The devices were dried in a spin coater and stored at 4 °C in the refrigerator (see Supplementary Materials).
To observe the effects of these modifications with CysAm/GOx, the sample surfaces were examined using Atomic Force Microscopy (NanoIR—NovaVista, Molecular Vista, San Jose, CA, USA) before and after functionalization. The charge transfer on glucose and nickelate film surfaces was analyzed by monitoring resistance responses over time, as expected with glucose solutions of different concentrations. These measurements were also conducted using a Keithley 2400C Sourcemeter (Tektronix, Cleveland, OH, USA) connected to a PC via the LabVIEW (version 10.0.1, 2010) interface. All these measurements were repeated at least three times on four samples of NNO, NENO30, and NENO35 films.
Direct analysis of glucose in orange juice samples was performed to verify the applicability of the proposed method in real sample analysis. For this, we prepared samples of commercial and freshly squeezed orange juice (OJ). All samples were filtered using a 45-micron syringe filter. The commercial OJ reported a sugar concentration of 9 g/100 mL, whereas the glucose content is approximately 2 g/100 mL. This OJ was diluted in water to reach concentrations ranging from 0.05 to 0.4 M and used to build the calibration curve.
3. Results
3.1. Structural, Morphological, and Electrical Characterization of Nd1−xEuxNiO3 Films
Figure 1i displays the XRD patterns of NNO, NENO30, and NENO35 films, indicating they are polycrystalline samples. The Bragg reflections are identified as belonging to the NdNiO3 crystalline phase (space group symmetry Pbnm; JCPDF 01-080-1947) [30]. Moreover, as expected, replacing Nd3+ with Eu3+ does not alter the symmetry of the crystalline structure. The lattice parameters, estimated and listed in Table 1, differ from those of bulk samples; these cell parameters are slightly larger than the bulk cell parameter a = 5.3891 Å but smaller than b = 5.3816 Å and c = 7.6101 Å reported in the literature. This variation is more noticeable when comparing the unit cell volume (V). Additionally, the samples were heat-treated at low temperatures under an oxygen pressure of about 1 bar. Oxygen non-stoichiometry likely increases due to Eu3+ replacing Ni3+ in the lattice, leading to a mixture of Ni3+ and Ni2+. Figure 1iii shows a schematic band structure and the orthorhombic structure for all samples; these crystal structures were modeled using Vesta software (2024, version 2.1.6) based on literature data.
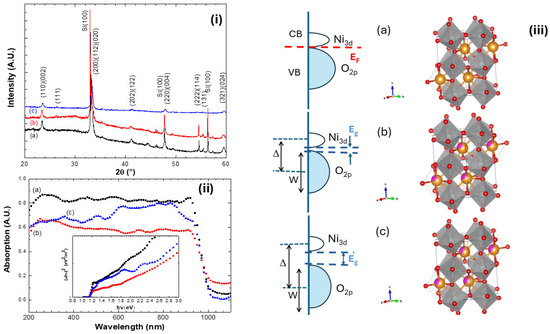
Figure 1.
(i) X-ray diffractograms, (ii) UV–vis spectroscopy, and the inset shows the Tauc plot. (iii) Schematic charge-transfer band structure and orthorhombic structure of (a) NNO films, (b) NENO30, and (c) NENO35 deposited on SiO2/Si(100) substrate. Here, EF is Fermi energy, Δ is the charge transfer energy, W is the O 2p bandwidth, the red circles represent the oxygen atoms, the yellow circles the Nd atoms, and the purple circles the Eu atoms.

Table 1.
The values listed were the pseudo-cubic lattice parameters (apc), unit cell volume (V), the crystallite size (D), and tension at the film/substrate interface (e), for the Nd1−xEuxNiO3 films.
The film/substrate interfacial strain (e) and crystallite sizes of the synthesized materials were also reported, following the reduction behavior for the most substituted compounds. The film thickness may also have influenced these values, considering the growth method, which generally produces films with a thickness of around 200–400 nm, exceeding the film thicknesses reported in the literature.
UV–vis spectroscopy measurements show how replacing Nd3+ with Eu3+ affects the electronic structure of these films (Figure 1ii). As mentioned, decreasing the radius of the element replacing Nd in perovskite compounds can significantly affect the electronic structure of nickelate materials, since this substitution can cause rotations, twists, and distortions of the NiO6 octahedra that comprise the crystal lattice. The absorption range from 700 to 1200 nm corresponds to excitation from the occupied to the unoccupied state of the transition metal Ni eg* antibonding orbital. Below 700 nm, absorption results from transitions from the hybridized t2g*/2p oxygen orbitals to the eg* orbitals [31,32].
The inset of Figure 1ii shows the curves of the Tauc method, revealing that three distinct slopes are noticeable for these films, indicating changes in their electronic structures [31]. The slopes above 3 eV changes are related to the transition from metallic to insulating electronic states, promoted by Eu substitution in the NdNiO3 compound. It is important to note that the measurements were taken at room temperature (~25 °C). According to the literature, at room temperature, the NENO35 film is in the insulating phase, while the others are either in the metallic phase or at the metal–insulator transition region [33].
Figure 2 shows the FESEM images of the surfaces of Nd1−xEuxNiO3 films (0 ≤ x ≤ 0.35). These images reveal homogeneous surfaces, low packing density, and few defects, with particles that are roughly rounded and slightly elongated, ranging from 50 to 120 nm in length. Similar results were observed in the work of Nikulin and Tiwari, where the synthesis of small, weakly linked crystallites was studied. The estimated average particle diameters are 56.0(6) nm, 77.4(8) nm, and 82.5(8) nm for NNO, NENO30, and NENO35, respectively (see Figure S1). These analyses indicate that the average particle diameter increases with higher Eu substitution in the NdNiO3 matrix, which is expected since the substituent species has a relatively larger ionic radius.
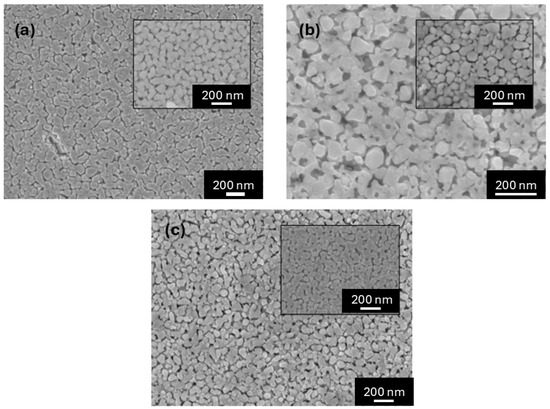
Figure 2.
FESEM images of sample surfaces of (a) NNO, (b) NENO30, and (c) NENO35 films deposited on SiO2/Si(100) substrate with 6 layers of deposition. Inserts show images with higher magnification.
To assess the impact of Ni2+/Ni3+ states and oxygen vacancies on the physical properties of Eu-doped NdNiO3 thin films, XPS measurements were performed. Figure 3a shows the XPS survey spectra of NNO, NENO30, and NENO35 samples. The survey spectra display characteristic peaks for Nd, Ni, and O elements. In the NENO30 and NENO35 spectra, additional signals corresponding to Eu (highlighted in gray) are observed, confirming the successful doping of Eu into the films, which agrees with the XRD and transport data.
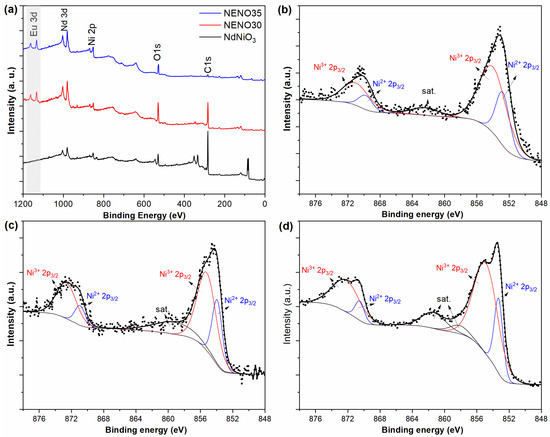
Figure 3.
XPS survey spectra (a) and high-resolution XPS spectrum of Ni 2p (b–d) from NNO, NENO30, and NENO35 films, respectively.
As reported in previous XPS analyses of NNO nanostructures, the presence of Ni2+ can cause significant changes in the properties and characteristics of these compounds [34,35,36]. Figure 3b shows the Ni 2p high-resolution core-level spectrum of NNO. The spectrum exhibits four peaks: the peaks at 852.8 and 854.0 eV are attributed to Ni2+ 2p3/2 and Ni3+ 2p3/2, respectively, while the peaks at 867.8 and 871.0 eV correspond to Ni2+ 2p1/2 and Ni3+ 2p1/2, respectively. The Ni 2p high-resolution spectra of NENO30 and NENO35 are shown in Figure 3c,d. For the NENO30 sample, the 2p3/2 and 2p1/2 doublet related to Ni2+ and Ni3+ were fitted at 853.9 (870.9) eV and 855.2 (872.6) eV, respectively. In the case of NENO35, the corresponding Ni2+ and Ni3+ peaks were fitted at 853.3 (870.5) eV and 854.9 (872.2) eV, respectively. Based on the peak deconvolution of the Ni 2p spectra, the Ni2+/Ni3+ ratio was estimated by comparing the relative areas of the Ni2+ 2p3/2 and Ni3+ 2p3/2 peaks. The NNO, NENO30, and NENO35 exhibited Ni2+/Ni3+ ratios of 0.40, 0.44, and 0.30, respectively. These results reveal that a mixture of bi- and trivalent Ni was stabilized during thermal treatment of the thin films with an O2 pressure of approximately 1 atm, which is insufficient for the primary stabilization of Ni3+ in the RNiO3 phase [33].
Figure 4 shows the normalized electrical resistance curves as a function of temperature for Nd1−xEuxNiO3/SiO2/Si(100) films during cooling and heating. The R(T)/R(300 K) versus temperature curves exhibit metallic behavior above the Metal–Insulator Transition (TMI) temperature, indicated by a decrease in resistance during cooling. Below TMI, the material enters an insulating state, with R(T) values increasing by several orders of magnitude as the temperature drops [37,38]. Hysteresis is also observed between the heating and cooling curves for the three analyzed films. An important point is that the TMI temperature was controlled by increasing the replacement of Nd3+ by Eu3+, as expected from bulk studies reported in the literature [33,39].
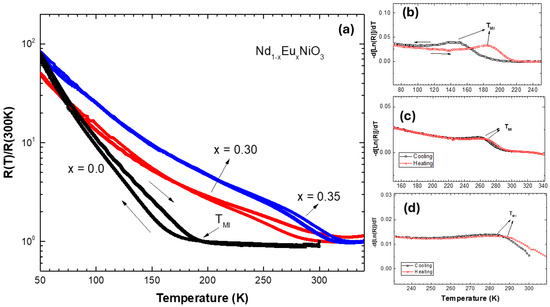
Figure 4.
Temperature dependence R(T)/R(300K) curves measured for Nd1−xEuxNiO3/SiO2/Si(100) films (a). Curves of -d(Ln(R))/dT versus temperature for samples (b) NNO, (c) NENO30, and (d) NENO35.
Generally, using electrical resistivity measurement curves versus temperature allows the study of properties such as the Metal–Insulator Transition (TMI) and the material’s behavior. The power law can describe the temperature dependence of the electrical resistance: , where A is the residual electrical resistivity constant, B is the temperature-related coefficient, and n is the power factor, which generally takes on values of 1 or 2. In the NNO sample, n is 3/2 for temperature ranges between 200 and 340 K, and the scattering can be linked to electron–phonon coupling. Below the TMI, the behavior becomes more complex, as there is a coexistence region of metallic and insulating phases (hysteresis region), and the Arrhenius law cannot describe the region with the highest proportion of insulating phase [
The TMI values obtained for each sample during heating and cooling were estimated by calculating −d[lnR(T)]/dT, with the TMI peak indicated in Figure 4b–d. The values are comparable to those reported in the literature [39]. The films exhibit TMI ranging from 190 K to 280 K from x = 0 to x = 0.35. As shown, increasing the Eu concentration in the prepared films results in a higher phase transition temperature, as expected [33]. These results are like those reported in the literature and agree with the schematic band structure of Figure 1iii. Therefore, these samples provide nickelate platforms with three different electronic states: metallic, intermediate, and insulating at room temperature (300 K).
3.2. Nd1−xEuxNiO3 as a Platform for Biosensors
To demonstrate the potential of Nd1−xEuxNiO3 films for sensor applications, they were functionalized with GOx-modified Au electrodes and characterized. A schematic diagram of this device is shown in Figure 5a. AFM images confirmed the effect of CysAm/GOx on the gold electrode deposited on the nickelate films. The surface morphology of both pristine and GOx-modified electrodes is shown in Figure 5b,c. The pristine electrode has an average grain diameter (D) of approximately 22 nm and a roughness (R) of about 5.2 nm. In comparison, the GOx-decorated electrode shows D around 10.5 nm and R around 3.1 nm. The smooth topography seen in Figure 5c and the reduction in grain size suggest that GOx molecules are associated with several bright spots covering the gold surface. However, the average size and height of GOx molecules, around 10 nm, are larger than the 4–5 nm reported in the literature [9]. Their size depends on how cysteamine modifies the surface and the prior topography of the gold electrode.
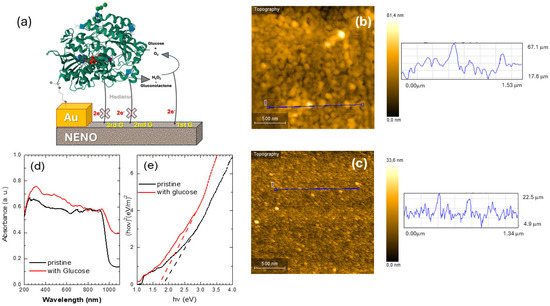
Figure 5.
(a) Schematic representation of the enzymatic NENO sensor configuration. The GOx (3QVR structure available in the Protein Data Bank) chain is represented by a green cartoon, and the cofactor FAD is represented by a spacefill model colored by atom element. The protein structure is bound to the gold surface by the adduct cysteamine. Electron transfer (2e−) from the enzymatic reaction to NENO is facilitated by hydrogen peroxide produced through the reoxidation of FADH2 by molecular oxygen, characterizing a first-generation sensor (1stG). The sensor components are represented out of scale for clarity. (b) AFM scans of the pristine and (c) GOx-modified gold electrode deposited on the NENO35 film. The blue lines represent the line scan showing the surface height variation on the NENO30 sample. (d) UV–vis spectra, and (e) estimated Tauc graph of samples for NENO30/Au/CysAm film decorated with GOx before (pristine) and after deposition of a 0.5 M glucose solution on the surface. The dashed red and black lines indicate changes in the absorption slopes.
Firstly, the interaction of the GOx/CysAm-modified nickelate film with glucose was investigated using Fourier Transform Infrared (FTIR) and UV–vis spectroscopy measurements before and after exposure to glucose. The FTIR spectrum is shown in Figure S2a. The gluconolactone band around 1135 cm−1 was not detectable when only a low concentration of this substance was used. The UV–vis spectra, before and after the reaction with the glucose solution, exhibit a slight shift towards longer wavelengths of the ~1000 nm absorption bands (see Figure 5d). The Tauc analysis was performed to verify this point. Figure 5e shows the Tauc plots derived from the UV-vis spectra GOx/NENO30 film; the glucose reaction with the GOx/NENO30 film modifies the slope of the Tauc curve. Here, these curves reveal three slopes: one from 1 to 1.2 eV and another from 1.2 to 3 eV, both of which are assigned to excitations from occupied to unoccupied antibonding eg* orbitals. These slopes don’t seem to change significantly with the addition of glucose. The third slope, from 3 to 4.5 eV, is attributed to transitions from the O 2p orbitals to the Ni 3d eg orbitals, and its slope slightly increases from 3.5 to 4.1 eV.m−2 [32]. Therefore, the intercept with the x-axis of both curves, without and with glucose, slightly decreases, which can be attributed to the nickelate–GOx reaction with glucose (see the black and red dashed lines in Figure 5e). Since, in this reaction, hydrogen doping of the nickelate–GOx device donates electrons to the eg orbital. This can result in a significant on-site Coulomb repulsion between 3d eg orbitals, promoting charge carrier localization, which can be related to these changes in the slope. Similar behavior was observed for the NNO and NENO35 samples. The temperature dependence of the electrical resistance R(T) of de NNO, NENO30, and NENO35 pristine, with CysAm, and GOx was measured. Similar behavior and TMI were observed for all samples, with slight increases in the R(T) values (see for example Figure S2b).
Despite these findings, they do not confirm the mechanism related to the GOx-films oxidation of glucose based on this result. First, to verify the enzyme response, the GOx-NENO30 was soaked in a glucose solution, and the reaction product was analyzed in the presence of horseradish peroxidase (HRP) for different periods (see the Supplementary Materials, Figure S9). This result confirms the formation of H2O2 during the oxidation of glucose by GOx on the film’s surface. In this reaction, the immobilized GOx catalyzes the oxidation of glucose, producing H2O2 and gluconic acid, which is a typical reaction of a first-generation glucose sensor (See Figure 5a) [4].
To evaluate the catalytic activity of these samples, 20 μL of 0.5 M glucose and 0.5 M hydrogen peroxide were applied separately to the surfaces of both the pristine and GOX-modified devices (see Figure 6i). The normalized electrical resistance R/R0 (where R0 = R(t = 0s)) was measured for 30 min at room temperature (~20 °C). The R/R0 readings for nickelate films without enzyme remain almost constant (insert Figure 6i), indicating a slight increase in the R/R0 values for all samples. This small change in R/R0 values suggests that glucose was directly oxidized on the surface of the pristine film via the Ni2+/Ni3+ redox transition (black curve), which enhances electron transfer and increases resistance. Additionally, dropping hydrogen peroxide and then glucose produces a similar increase in the R/R0 values for all bare samples (red curve). Here, the nickelate film also promotes H2O2 oxidation to water through electron transfer. However, these small changes in R/R0 could be related to a limited amount of H2O2 to transfer electrons on the surface of the nickelate film.
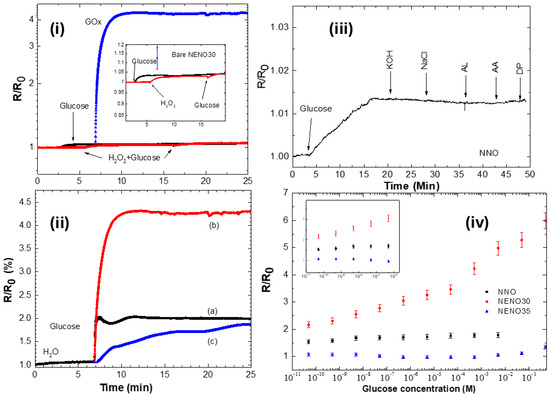
Figure 6.
(i) R/R0 versus time curves of pristine and GOx-modified NENO30 film with 20 μL of 0.5 M glucose solution and 0.5 M hydrogen peroxide. The inset shows the rise in the R/R0 with the addition of glucose (black curve) and H2O2 (red curve), and subsequently glucose. (ii) Time resistance of (a) NNO (black), (b) NENO30 (red), and (c) NENO35 (blue) devices, decorated with GOx enzymes, with 20 μL of 0.5 M glucose added to the surface. (iii) Response of the sensor to the addition of 0.5 M glucose and successive addition of KOH, NaCl, Lactic acid (AL), Ascorbic acid (AA), and dopamine (DP). (iv) Calibration curves of R/R0 response to changing glucose concentrations. In detail, the inset shows a magnification of R/R0 at low glucose concentrations for the NNO-Gox and NENO35-GOx devices (noise level < 5%).
In contrast, the R/R0 versus time curve for the GOx-coated samples shows a sharp increase after glucose addition (blue curve), suggesting a reaction between glucose and the nickelate/GOx device. Here, the enzymatic reaction between GOx and glucose continuously generates H2O2, which is consumed by electron transfer to the nickelate film and is quickly replenished until the system reaches a constant reaction rate. In contrast, the addition of hydrogen peroxide to the nickelate–GOx device results in a minor enhancement of the R/R0 values, still, with a smaller magnitude than the result observed for the measurement with glucose (see Figure S5vi). The reaction mechanism behind the electrical response of the NENO/GOx films involves an initial transfer of an electron from the hydrogen peroxide produced by FADH2 reoxidation generated during the glucose-GOx reaction into the nickelate surface. As previously discussed, this reaction donates an electron to the Ni 3d orbital in the nickelate film, as indicated by the Tauc curves, suggesting charge carrier localization. These changes increase resistivity values, like those reported for RNiO3 nanostructures [9,10]. Additionally, the presence of Ni3+/Ni2+ and oxygen vacancies, as observed via XPS, contributes to this sensor response.
It should be noted that the enzyme is directly linked to the cysteamine molecules over the gold electrodes. The oxidation of glucose occurs locally with the GOx molecules, also continuously providing H2O2 localized at the nickelate surface. Additionally, the good conductivity of both the nickelate film and the gold electrode provides an excellent microenvironment for GOx, thereby enhancing the rate of electron transfer [10,40,41]. Therefore, we believe that the synergistic effect of GOx localization and H2O2 generation near the nickelate surface is responsible for a higher electron transfer and these higher R/R0 values.
The reaction between H2O2 and the nickelate–GOx is not localized, and some authors have reported that an excess of H2O2 can promote a loss of enzyme activity [42]. From these discussions, we believe that the nickelate–GOx devices continue to function as a first-generation glucose biosensor.
Figure 6ii displays these curves, which show a rapid increase (~10 s) in R/R0 until reaching a maximum plateau. This behavior indicates that at this plateau, the system reaches a constant reaction rate at the fixed glucose concentration; similar behavior has been reported for an SmNiO3-GOx device in the literature [9]. Additionally, a greater change in R/R0 was observed for the NENO30/GOx sample. These findings highlight how small changes in the electronic state influence the sensor response of this film. Zang et al. [9] correlate the modification of proton-doped nickelate thin films with a high detection limit in enzyme–SmNiO3 devices, attributing this to the strong electron correlation exhibited by the nickelate compounds.
To confirm the significance of the nickelate film in the reaction with glucose, similar measurements were conducted on different substrates, specifically SiO2/Si(100) and ITO/PET. In this process, identical gold tracks on these substrates were functionalized with cysteamine and glucose oxidase (GOx). No change in the R/R0 values was observed upon adding the glucose solution, as shown in Figure S3 (Supplementary Materials). These results suggest that the presence of the nickelate film is necessary for the film–GOx device to promote the glucose reaction.
To verify their specificity, nickelate–GOx devices were tested separately using 20 µL of 0.5 M galactose, fructose, and glucose. R/R0 values change only with glucose while remaining constant with the addition of the other sugars (see Figure S4). To test the selectivity of the GOx devices, glucose detection was measured in the presence of the most common interfering species, ascorbic acid (AA) and Dopamine (DP). Typically, physiological concentrations exhibit 3–8 mM of glucose and 0.1 mM of AA [43]. Figure 6iii shows the measurement of R/R0 vs. time using ~20 μL of 0.5M glucose, adding successively 0.1 mM of KOH, NaCl, Lactic acid (AL), AA, and DP for the NNO-GOx devices. Similar behavior was observed for Eu-doped films. These measurements show no significant change in the R/R0 values in the presence of interferents, indicating the high selectivity of these proposed sensors.
Figure 6iv shows the response of all Nd1−xEuxNiO3–GOx devices to low glucose levels, with the R/R0 values increasing steadily as the glucose concentration rises. This figure also indicates that NENO30-GOx devices are more sensitive to changing glucose levels. The R/R0 versus concentration curves were used to estimate the sensitivity of the three samples (see Figure S5). The NENO30-GOx device exhibits the highest sensitivity, approximately 9.25 × 10⁻¹ mM−1, and the widest detection range (see Table 2). Across all films, R/R0 values increase with higher glucose concentrations, with the NENO30-GOx device reaching higher R/R0 values at elevated concentrations. For example, the electrical resistance of the NENO35-GOx device ranges from 71 kΩ to 76.6 kΩ when glucose concentrations are varied from 10−10 M to 0.5 M. In contrast, for NENO30-GOx sample, this R value varies from 9.7 to ~28 Ω (see Figure S5ii).
Table 2.
The values listed were the sensitivity, glucose concentration range, detection limit (LOD), and the correlation coefficient (R2) calculated for the Nd1−xEuxNiO3—GOx devices.
This change in the R/R0 values with the glucose concentration may be related to changes in the electronic structure caused by Eu doping. However, as seen in SEM images, these samples seem to have slightly higher apparent porosity, which could also contribute to this result. When examining the R/R0 response at different glucose concentrations, it is notable that the NENO30 film shows a better sensor response than the other samples, suggesting that the electronic structure near TMI enhances the GOx/glucose reaction on the sample surface.
As can be seen in Figure 6iv, the R/R0 versus glucose concentration curves exhibit a non-linear behavior with a log x-axis scale, which makes it difficult to calculate the LOD using the expression LOD = 3.3 σ/slope. The σ value is the blank standard deviation, and the slope is observed in a linear signal-concentration curve. For non-linear curves, an estimated method is to consider that the R/R0 intensity approaches 3.3.σ value at low concentrations [44]. The detection limit (LOD) was calculated using the ratio of the lowest concentration (10−10 M) and the corresponding R/R0 value measured for the nickelates-GOx, which is equal to 3.3.σ/LOD (see Table 2). The σ value is the blank standard deviation, whose values were estimated from the R/R0 values measured in water. These standard deviations are <3%, but we consider σ ~ 5% to include any ambient changes (humidity and temperature variation). The LOD values ranged from 3.57 × 10⁻⁵ to 7.7 × 10⁻⁵ μM for NENO30-GOx and NENO35-GOx, respectively. These values align with those reported in the literature for various electrochemical glucose sensors that utilize a perovskite-based material as their foundation.
The LOD of other perovskite-based glucose sensors is presented in Table 3. La-based perovskite biosensors exhibit the lowest limits of detection, as 8 nM was obtained for carbon paste electrodes modified with LaNi0.6Co0.4O3 [29]. Perovskite also provides a lower detection limit for H2O2, showing the most excellent catalytic effect of the B-site ions Ni and Co. Other lanthanide A-site ions, such as praseodymium and neodymium, are replaced by alkaline earth metals, including barium and strontium [43].
Table 3.
Examples of the performance of perovskite-based glucose biosensors.
This work reports the LOD values for the Nd1−xEuxNiO3/GOx/CysAm/Au devices, which are comparable to those reported for other nickelates. However, it shows that doping with Eu3+ ions improves the sensor response. Notably, small changes in the crystalline and electronic structure result in shifts in the metal–insulator state of these samples at room temperature. Along with the presence of Ni3+ and Ni2+, these factors make these materials significant as glucose sensors.
In the Supplementary Materials, the repeatability, reproducibility, and stability of the nickelate–GOx devices used as glucose sensors were also assessed (Figures S6–S8). These tests were conducted on three samples of each nickelate film, demonstrating good reproducibility and repeatability. The R/R0 values are close to 0.9 with 0.5 M of glucose and a relative standard deviation of approximately 5%. It is worth noting that changes in temperature and humidity can cause variations in these values. Additionally, the R/R0 values of these devices remain stable for 30 to 60 min, but their magnitude varies significantly over 14 days. This fluctuation can be linked to the connection and disconnection of the electrical cables used during these measurements.
To evaluate the practical usefulness of these nickelate–GOx sensors, we used calibration curves to compare their performance with freshly prepared orange juice (filtered with a 0.45 μm PTFE syringe filter). The calibration curve is shown in Figure 7i; here, a commercial orange juice (Natural One, with a total sugar content of 9 g/100 mL) was used as a reference. We also tested a real sample of orange juice (OJ) and measured an R/R0 versus OJ concentration curve. Figure 7i displays the R/R0 versus time curve of the NENO30-GOx device after adding freshly squeezed orange juice. The R/R0 values increase for approximately 10 min and reach a maximum at longer times. Using the calibration equation Y = −0.80 + 0.09x (R2 = 0.97), we estimate the glucose concentration in the natural orange juice to be 0.267(3) M (4.8 g/100mL), which is larger than the 2.6 g/100mL value reported in the literature [48]. Therefore, one possible application for these nickelate–GOx devices is to monitor glucose in fluids.
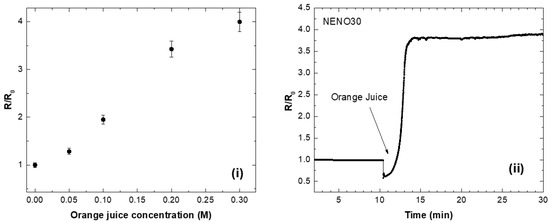
Figure 7.
(i) Calibration curve of R/R0 versus commercial orange juice concentration. (ii) Measurement of a real sample of orange juice with the NENO30-GOx device.
4. Conclusions
In summary, this study confirmed that NNO and NENO thin films can be successfully fabricated using the chemical solution deposition method. NdNiO3 and Nd1−xEuxNiO3 (x = 0, 0.30, 0.35) thin films crystallize in an orthorhombic distorted perovskite structure. They exhibit physical properties, such as a metal–insulator transition, which can be tuned through Eu doping and lattice strain. Gold electrodes (~100 nm) deposited on the surface of the nickelate were functionalized with cysteamine and glucose oxidase (GOx). The electrical resistance of these nickelate–GOx films changes in response to glucose exposure, with resistance increasing as the glucose concentration rises. The sensitivity and detection limits range from 0.8 to 9 × 10⁻¹ mM−1 and from 3.57 × 10⁻⁵ to 7.71 × 10⁻⁵ μM for NENO30 and NENO35, respectively. Evaluation of interference, selectivity, repeatability, and reproducibility further supports the potential of these devices for glucose sensing. For films with x = 0.30 and 0.35, the incorporation of Eu3 into the NdNiO3 matrix modifies the electronic structure, directly affecting the sensor response, which is related to the Ni3+/Ni2+ ratio and the metal–insulator transition temperature of the nickelates. Based on these results, the nickelate–GOx devices show promise for monitoring glucose levels in fluids.
Supplementary Materials
The following supporting information can be downloaded at: https://www.mdpi.com/article/10.3390/chemosensors13110387/s1, Figures S1–S10.
Author Contributions
The work presented here was carried out as a collaboration among all authors. Conceptualization, methodology, and formal analysis, G.P.L. and M.T.E.; XPS and writing, J.H.H.R.; writing—original draft preparation, G.P.L.; writing—review and editing, M.T.E.; review and editing, I.L.N. and N.L.V.C.; funding acquisition, M.T.E. All authors have read and agreed to the published version of the manuscript.
Funding
This work was supported by a CAPES fellowship, the COVID Project UFABC, and Fundação de Amparo à Pesquisa do Estado de São Paulo (2022/11278-9).
Institutional Review Board Statement
Not applicable.
Informed Consent Statement
Not applicable.
Data Availability Statement
The data will be made available upon request.
Acknowledgments
GPL acknowledges CAPES for the fellowship, the Multiuser Center Facilities at UFABC, and Renato Altobelli Antunes for XPS measurements. We also acknowledge the financial support provided by Fundação de Amparo à Pesquisa do Estado de São Paulo (2022/11278-9) and the COVID Project UFABC (2021–2022).
Conflicts of Interest
The authors declare no conflicts of interest.
Abbreviations
The following abbreviations are used in this manuscript:
| NNO | NdNiO3 |
| NENO30 | Nd0.7Eu0.3NiO3 |
| NENO35 | Nd0.65Eu0.35NiO3 |
| GOx | Glucose Oxidase |
| CysAm | Cysteamine |
| HRP | horseradish peroxidase |
References
- Grünblatt, E.; Ohki, C.M.Y.; Schmitt-Böhrer, G.A.; Riederer, P.; Walitza, S. Exploring the interplay of glucose metabolism, insulin resistance, and neurodegenerative pathologies: Insights from streptozotocin and hypoglycaemic in vitro models. J. Neural Transm. 2025, 132, 1479–1491. [Google Scholar] [CrossRef]
- Collotta, D.; Ferreira Alves, G. Editorial: Unveiling the role of carbohydrates in cardiometabolic health. Front. Nutr. 2025, 12, 1568319. [Google Scholar] [CrossRef]
- Krook, A.; Mulder, H. Pinpointing precision medicine for diabetes mellitus. Diabetologia 2022, 65, 1755–1757. [Google Scholar] [CrossRef]
- Reddy, V.S.; Agarwal, B.; Ye, Z.; Zhang, C.; Roy, K.; Chinnappan, A.; Narayan, R.J.; Ramakrishna, S.; Ghosh, R. Recent Advancement in Biofluid-Based Glucose Sensors Using Invasive, Minimally Invasive, and Non-Invasive Technologies: A Review. Nanomaterials 2022, 12, 1082. [Google Scholar] [CrossRef]
- Zafar, H.; Channa, A.; Jeoti, V.; Stojanović, G.M. Comprehensive Review on Wearable Sweat-Glucose Sensors for Continuous Glucose Monitoring. Sensors 2022, 22, 638. [Google Scholar] [CrossRef] [PubMed]
- Singhal, C.M.; Kaushik, V.; Awasthi, A.; Zalke, J.B.; Palekar, S.; Rewatkar, P.; Srivastava, S.K.; Kulkarni, M.B.; Bhaiyya, M.L. Deep Learning-Enhanced Portable Chemiluminescence Biosensor: 3D-Printed, Smartphone-Integrated Platform for Glucose Detection. Bioengineering 2025, 12, 119. [Google Scholar] [CrossRef] [PubMed]
- Ye, W.; Ruiyi, L.; Zaijun, L. Ultrasensitive electrochemical sensor for monitoring glucose in sweat based on Ta0.975Au0.025O1.05-graphene nanobelt nanocomposite with excellent catalytic activity and specificity. Microchim. Acta 2025, 192, 1–14. [Google Scholar] [CrossRef]
- Peng, L.; Liu, Y.; Wu, Q.; Zhou, L.; Dong, M.; Zhong, L. Au-doped MoS2 nanozyme with self-cascade catalytic performance for one-step glucose detection application. Anal. Bioanal. Chem. 2025, 417, 4945–4955. [Google Scholar] [CrossRef] [PubMed]
- Zhang, H.-T.; Zuo, F.; Li, F.; Chan, H.; Wu, Q.; Zhang, Z.; Narayanan, B.; Ramadoss, K.; Chakraborty, I.; Saha, G.; et al. Perovskite nickelates as bio-electronic interfaces. Nat. Commun. 2019, 10, 1–7. [Google Scholar] [CrossRef]
- Sun, Y.; Nguyen, T.N.H.; Anderson, A.; Cheng, X.; Gage, T.E.; Lim, J.; Zhang, Z.; Zhou, H.; Rodolakis, F.; Zhang, Z.; et al. In Vivo Glutamate Sensing inside the Mouse Brain with Perovskite Nickelate-Nafion Heterostructures. ACS Appl. Mater. Interfaces 2020, 12, 24564–24574. [Google Scholar] [CrossRef]
- Xu, S.; Lee, T.R. Fe3O4 nanoparticles: Structures, synthesis, magnetic properties, surface functionalization, and emerging applications. Appl. Sci. 2021, 11, 11301. [Google Scholar] [CrossRef]
- Thatikayala, D.; Ponnamma, D.; Sadasivuni, K.K.; Cabibihan, J.J.; Al-Ali, A.K.; Malik, R.A.; Min, B. Progress of Advanced Nanomaterials in the Non-Enzymatic Electrochemical Sensing of Glucose and H2O2. Biosensors 2020, 10, 151. [Google Scholar] [CrossRef]
- Jahani, P.M.; Javar, H.A.; Mahmoudi-Moghaddam, H. A new electrochemical sensor based on Europium-doped NiO nanocomposite for detection of venlafaxine. Measurement 2021, 173, 108616. [Google Scholar] [CrossRef]
- Huang, J.; Wang, S.; Ding, J.; Li, S.; Xu, J. Enhanced glucose sensing performance via synergistic integration of silver nanowires and cobalt oxide. Surf. Interfaces 2025, 72, 107065. [Google Scholar] [CrossRef]
- Chen, T.-W.; Ramachandran, R.; Chen, S.-M.; Anushya, G.; Ramachandran, K. Graphene and Perovskite-Based Nanocomposite for Both Electrochemical and Gas Sensor Applications: An Overview. Sensors 2020, 20, 6755. [Google Scholar] [CrossRef] [PubMed]
- Singh, Y.; Verma, S.K.; Kandadai, N.; Subbaraman, H. Highly Sensitive Graphene-Assisted Large-Area Kapton-Based Flexible Surface Plasmon Resonance Biosensor for Enzymatic Glucose Detection. ACS Appl. Mater. Interfaces 2025, 17, 45527–45537. [Google Scholar] [CrossRef]
- Sivakumar, M.; Pandi, K.; Chen, S.-M.; Cheng, Y.-H.; Sakthivel, M. Facile synthesis of perovskite-type NdNiO3 nanoparticles for an effective electrochemical non-enzymatic glucose biosensor. New J. Chem. 2017, 41, 11201–11207. [Google Scholar] [CrossRef]
- He, J.; Sunarso, J.; Zhu, Y.; Zhong, Y.; Miao, J.; Zhou, W.; Shao, Z. High-performance non-enzymatic perovskite sensor for hydrogen peroxide and glucose electrochemical detection. Sens. Actuat. B-Chem. 2017, 244, 482–491. [Google Scholar] [CrossRef]
- Wang, B.; Gu, S.; Ding, Y.; Chu, Y.; Zhang, Z.; Ba, X.; Zhang, Q.; Li, X. A novel route to prepare LaNiO3 perovskite-type oxide nanofibers by electrospinning for glucose and hydrogen peroxide sensing. Analyst 2013, 138, 362–367. [Google Scholar] [CrossRef]
- Boubezari, I.; Zazoua, A.; Errachid, A.; Jaffrezic-Renault, N. Sensitive Electrochemical Detection of Bioactive Molecules (Hydrogen Peroxide, Glucose, Dopamine) with Perovskites-Based Sensors. Chemosensors 2021, 9, 289. [Google Scholar] [CrossRef]
- Catalano, S.; Gibert, M.; Fowlie, J.; Íñiguez, J.; Triscone, J.M.; Kreisel, J. Rare-earth nickelates RNiO3: Thin films and heterostructures. Rep. Prog. Phys. 2018, 81, 046501. [Google Scholar] [CrossRef]
- Vinothkumar, V.; Sakthivel, R.; Chen, S.-M. Rare earth dysprosium nickelate nanospheres for the selective electrochemical detection of antipsychotic drug perphenazine in biological samples. Mater. Today Chem. 2022, 24, 100883. [Google Scholar] [CrossRef]
- Zhang, Z.; Schwanz, D.; Narayanan, B.; Kotiuga, M.; Dura, J.A.; Cherukara, M.; Zhou, H.; Freeland, J.W.; Li, J.; Sutarto, R.; et al. Perovskite nickelates as electric-field sensors in salt water. Nature 2017, 553, 68–72. [Google Scholar] [CrossRef] [PubMed]
- Ha, S.D.; Shi, J.; Meroz, Y.; Mahadevan, L.; Ramanathan, S. Neuromimetic Circuits with Synaptic Devices based on Strongly Correlated Electron Systems. Phys. Rev. Appl. 2014, 2, 064003. [Google Scholar] [CrossRef]
- de La Cruz, F.P.; Piamonteze, C.; Massa, N.E.; Salva, H.; Alonso, J.A.; Martínez-Lope, M.J.; Casais, M.T. Possible common ground for the metal-insulator phase transition in the rare-earth nickelates RNiO3. Phys. Rev. B 2002, 66, 153104. [Google Scholar] [CrossRef]
- Medarde, M.; Dallera, C.; Grioni, M.; Delley, B.; Vernay, F.; Mesot, J.; Martínez-Lope, M.J. Charge disproportionation in RNiO3 perovskites (R=rare earth) from high-resolution x-ray absorption spectroscopy. Phys. Rev. B 2009, 80, 245105. [Google Scholar] [CrossRef]
- Pandiyan, R.; Vinothkumar, V.; Chen, S.-M.; Prasad, G.V.; Kim, T.H. Perovskite lanthanum nickelate nanoparticles: As effective modified screen printed carbon electrode for electrochemical detection of trifluoperazine. Surf. Interfaces 2023, 38, 102805. [Google Scholar] [CrossRef]
- Rossato, J.H.H.; Oliveira, M.E.; Lopes, B.V.; Gallo, B.B.; La Rosa, A.B.; Piva, E.; Barba, D.; Rosei, F.; Carreño, N.L.V.; Escote, M.T. A Flexible Electrochemical Biosensor Based on NdNiO3 Nanotubes for Ascorbic Acid Detection. ACS Appl. Nano Mater. 2022, 5, 3394–3405. [Google Scholar] [CrossRef]
- Zhang, Z.; Gu, S.; Ding, Y.; Jin, J. Analytica Chimica Acta A novel nonenzymatic sensor based on LaNi0.6Co0.4O3 modified electrode for hydrogen peroxide and glucose. Anal. Chim. Acta 2012, 745, 112–117. [Google Scholar] [CrossRef] [PubMed]
- García-Muñoz, J.L.; Rodríguez-Carvajal, J.; Lacorre, P.; Torrance, J.B. Neutron-diffraction study of RNiO3 (R=La, Pr, Nd, Sm): Electronically induced structural changes across the metal-insulator transition. Phys. Rev. B 1992, 46, 4414. [Google Scholar] [CrossRef]
- Chang, L.; Wang, L.; You, L.; Zhou, Y.; Fang, L.; Wang, S.; Wang, J. Band gap tuning of nickelates for photovoltaic applications. J. Phys. D. Appl. Phys. 2016, 49, 44LT02. [Google Scholar] [CrossRef]
- Chang, L.; Wang, L.; You, L.; Yang, Z.; Abdelsamie, A.; Zhang, Q.; Zhou, Y.; Gu, L.; Chambers, S.A.; Wang, J. Tuning Photovoltaic Performance of Perovskite Nickelates Heterostructures by Changing the A-Site Rare-Earth Element. ACS Appl. Mater. Interfaces 2019, 11, 16191–16197. [Google Scholar] [CrossRef]
- Escote, M.T.; Barbeta, V.B.; Jardim, R.F.; Campo, J. Metal-insulator transition in Nd1−xEuxNiO3 compounds. J. Phys. Condens. Matter. 2006, 18, 6117–6132. [Google Scholar] [CrossRef]
- Yamanaka, T.; Hattori, A.N.; Pamasi, L.N.; Takemoto, S.; Hattori, K.; Daimon, H.; Sato, K.; Tanaka, H. Effects of Off-Stoichiometry in the Epitaxial NdNiO3 Film on the Suppression of Its Metal-Insulator-Transition Properties. ACS Appl. Electron. Mater. 2019, 1, 2678–2683. [Google Scholar] [CrossRef]
- Preziosi, D.; Sander, A.; Barthélémy, A.; Bibes, M. Reproducibility and off-stoichiometry issues in nickelate thin films grown by pulsed laser deposition. AIP Adv. 2017, 7, 1–17. [Google Scholar] [CrossRef]
- Qiao, L.; Bi, X. Direct observation of oxygen vacancy and its effect on the microstructure, electronic and transport properties of sputtered LaNiO3-δ films on Si substrates. Thin Solid Films 2010, 519, 943–946. [Google Scholar] [CrossRef]
- Medarde, M.L. Structural, magnetic and electronic properties of perovskites (R = rare earth). J. Phys. Condens. Matter. 1997, 9, 1679–1707. [Google Scholar] [CrossRef]
- Capon, F.; Ruello, P.; Bardeau, J.F.; Simon, P.; Laffez, P.; Dkhil, B.; Ratuszna, A. Metal–insulator transition in thin films of RxR1−x′NiO3 compounds: DC electrical conductivity and IR spectroscopy measurements. J. Phys. Condens. Matter. 2005, 17, 1137–1150. [Google Scholar] [CrossRef]
- Barbeta, V.B.; Jardim, R.F.; Escote, M.T.; Dilley, N.R. Magnetothermopower in Nd1−xEuxNiO3 compounds. J. Appl. Phys. 2007, 101, 09N509. [Google Scholar] [CrossRef]
- Salimi, A.; Sharifi, E.; Noorbakhsh, A.; Soltanian, S. Immobilization of glucose oxidase on electrodeposited nickel oxide nanoparticles: Direct electron transfer and electrocatalytic activity. Biosens. Bioelectron. 2007, 22, 3146–3153. [Google Scholar] [CrossRef]
- NNjoko, N.; Louzada, M.; Britton, J.; Khene, S.; Nyokong, T.; Mashazi, P. Bioelectrocatalysis and surface analysis of gold coated with nickel oxide/hydroxide and glucose oxidase towards detection of glucose. Colloids Surfaces B Biointerfaces 2020, 190, 110981. [Google Scholar] [CrossRef]
- Guoqiang, G.; Liang, Q.; Yani, Z.; Pengyun, W.; Fanzhuo, K.; Yuyang, Z.; Zhiyuan, L.; Xing, N.; Xue, Z.; Qiongya, L.; et al. Recent advances in glucose monitoring utilizing oxidase electrochemical biosensors integrating carbon-based nanomaterials and smart enzyme design. Front. Chem. 2025, 13, 1591302. [Google Scholar] [CrossRef]
- El-Ads, E.H.; Galal, A.; Atta, N.F. The effect of A-site doping in a strontium palladium perovskite and its applications for non-enzymatic glucose sensing. RSC Adv. 2016, 6, 16183–16196. [Google Scholar] [CrossRef]
- Kong, D.; Zhao, J.; Tang, S.; Shen, W.; Lee, H.K. Logarithmic Data Processing Can Be Used Justifiably in the Plotting of a Calibration Curve. Anal. Chem. 2021, 93, 12156–12161. [Google Scholar] [CrossRef]
- Franceschini, F.; Taurino, I. Nickel-based catalysts for non-enzymatic electrochemical sensing of glucose: A review. Phys. Med. 2022, 14, 100054. [Google Scholar] [CrossRef]
- Nemati, S.S.; Dehghan, G.; Rashtbari, S.; Tan, T.N.; Khataee, A. Enzyme-based and enzyme-free metal-based glucose biosensors: Classification and recent advances. Microchem. J. 2023, 193, 109038. [Google Scholar] [CrossRef]
- El-Ads, E.H.; Galal, A.; Atta, N.F. Electrochemistry of Glucose at Gold Nanoparticles Modified Graphite/SrPdO3 Electrode—Towards a Novel Non-Enzymatic Glucose Sensor. J. Electroanal. Chem. 2015, 749, 42–52. [Google Scholar] [CrossRef]
- Amor-Gutiérrez, O.; Costa-Rama, E.; Fernández-Abedul, M.T. Full integrated sampler and dilutor in an electrochemical paper-based device for glucose sensing. Microchim. Acta 2021, 188, 1–8. [Google Scholar] [CrossRef]


Disclaimer/Publisher’s Note: The statements, opinions and data contained in all publications are solely those of the individual author(s) and contributor(s) and not of MDPI and/or the editor(s). MDPI and/or the editor(s) disclaim responsibility for any injury to people or property resulting from any ideas, methods, instructions or products referred to in the content. |
© 2025 by the authors. Licensee MDPI, Basel, Switzerland. This article is an open access article distributed under the terms and conditions of the Creative Commons Attribution (CC BY) license (https://creativecommons.org/licenses/by/4.0/).