Abstract
A novel airborne pathogen detection method, based on Flashing Ratchet Potential (FRP) and Electric Current Spectroscopy (ECS), is presented. The system employs a precisely engineered asymmetric electrode array to generate controlled directional transport of oxygen ions (O2−•), produced via thermionic emission and three-body electron attachment. As these ions interact with airborne particles in the detection zone, measurable perturbations in the ECS profile emerge, yielding distinct spectral signatures that indicate particle presence. Proof-of-concept experiments, using standardized talcum powder aerosols as surrogates for viral-scale particles, established optimal operating parameters of 6 V potential and 600 kHz modulation frequency, with reproducible detection signals showing a relative shift of 4.5–13.4% compared to filtered-air controls. The system’s design concept incorporates humidity-resilient features, intended to maintain stability under varying environmental conditions. Together with the proposed size selectivity (50–150 nm), this highlights its potential robustness for real-world applications. To the best of our knowledge, this is the first demonstration of an open-air electro-ratchet transport system coupled with electric current spectroscopy for bioaerosol monitoring, distinct from prior optical or electrochemical airborne biosensors, highlighting its promise as a tool for continuous environmental surveillance in high-risk settings such as hospitals, airports, and public transit systems.
1. Introduction
The growing recognition of airborne pathogen transmission [1] has exposed critical limitations in current detection technologies, particularly for real-time field deployment in high-risk environments such as hospitals, airports, and public transit systems. Despite being the gold standard, polymerase chain reaction (PCR) assays [2] require specialized laboratory infrastructure, trained personnel, and typically 4 to 6 h for results. These constraints severely restrict their utility during emerging outbreaks where rapid containment is crucial. Alternative biosensing platforms have made significant strides, with electrochemical systems [3,4] achieving impressive sensitivity through graphene-based interfaces, optical methods [5] leveraging surface-enhanced Raman spectroscopy for viral fingerprinting, and microfluidic approaches [6] enabling precise nanoparticle manipulation. However, as Sivakumar and Lee [7] comprehensively demonstrated, these technologies face fundamental trade-offs between sensitivity (particularly for aerosols containing fewer than 100 viral copies per cubic meter) [8], response time (less than 15 min for early warning systems) [9], and operational robustness against environmental interferents like humidity and particulate matter [10,11]. Hybrid opto-fluidic approaches have also advanced multiplexed detection capabilities, though miniaturization for continuous airborne monitoring remains challenging [8].
Our patented solution [12], supported by a detailed preprint study [13], addresses these challenges through an innovative integration of Flashing Ratchet Potential (FRP) and Electric Current Spectroscopy (ECS), representing the first adaptation of ratchet physics for airborne pathogen monitoring. Building upon foundational work in Brownian motor theory [14], nanofluidic rocking transport [15], and mesoscopic ratchet energy harvesting [16], the current system employs a precisely engineered asymmetric electrode array that generates controlled, directional transport of superoxide radical anions (O2−•). These charge carriers are produced through two well-characterized mechanisms: thermionic emission from specialized cathode materials [17] and three-body electron attachment to ambient oxygen molecules [18]. As pathogen-laden aerosols traverse the active detection zone, their interaction with the directed ion currents produces measurable perturbations in the resulting ECS profile, consistent with impedance-based particle readouts [19,20]. To minimize interference from non-target aerosols, the FRP system incorporates a dual-filtration assembly composed of 150 nm and 50 nm cutoff stages, combined with polarity-based charge discrimination. Particulates larger than approximately 1 µm, such as pollen and dust, are removed by the upper-stage filter, while ultrafine soot and combustion-derived nanoparticles smaller than 50 nm pass through the lower stage and contribute equally to both baseline and exposure spectra. Consequently, only aerosols within the 50–150 nm range (typical of viral particles) remain within the active detection window. Since these residual particulates exist in both “infected” and “non-infected” samples, their effects are effectively cancelled in the differential ECS subtraction process, analogous to a calibration-based normalization. This design ensures that the FRP detection mechanism remains both size- and charge-selective, substantially reducing cross-sensitivity to non-biological airborne particulates.
The system’s core innovation lies in its multistage detection architecture. First, time-modulated, spatially offset electrode potentials create a sequence of potential wells that preferentially transport particles within specific size ranges (50 to 150 nm for target viruses), an approach aligned with nanofluidic preconcentration principles [21]. Second, the particle-handling front end integrates size-discriminating electrokinetic concepts relevant to aerosol classification [22] with a dual-filter assembly that removes both large particulate interferents (greater than 1 μm) and small background nanoparticles (less than 50 nm) [23]. Third, a humidity-resistant housing with hydrophobic membranes maintains stable operation across 20 to 90 percent relative humidity [24].
Proof-of-concept experiments [12,13] using standardized talcum powder aerosols [23] established optimal operating parameters of 6 V potential and 600 kHz modulation frequency, achieving reproducible detection signals with 4.5–13.4% variation in root-mean-square current. These parameters were guided by O2−• transport dynamics, for which the travel distance follows = (1/ƒ)√(2qV/m) under the relevant electron–molecule cross-sections and attachment physics [24]. In parallel, progress in electrochemical point-of-care biosensors [25] and 2D-material-enabled transduction for healthcare diagnostics [26] indicates clear routes to further enhance sensitivity and integration. Finally, field-scale demonstrations of real-time environmental surveillance for respiratory viruses underscore the value of continuous monitoring in public and healthcare environments [8].
2. Materials and Methods
Flashing Ratchet Potential Design
The Flashing Ratchet Potential (FRP) system comprises a linear arrangement of alternating positive and negative electrodes (Figure 1), inspired by the Feynman ratchet concept [27] to harness directional particle transport from stochastic motion. The core mechanism is grounded in the principle that asymmetric potential landscapes, when periodically modulated, can induce net particle drift in systems dominated by Brownian diffusion [14,15,16,28,29,30,31]. This ratchet-driven transport has been extensively investigated for applications in sensing [32], biomolecular/energy transduction [33,34,35], and particle separation [36,37,38]. In microbiological contexts, ratchet principles have been applied to DNA transport and separation [33], protein translocation across membranes [34], and biomolecular machine operation [35]. Additional studies have explored their utility in nanofluidic preconcentration [21], achieving net drift of charged macromolecules in asymmetric, periodically driven geometries [28], and controlling particle motion in micro-/nanofluidic channels [20,21].
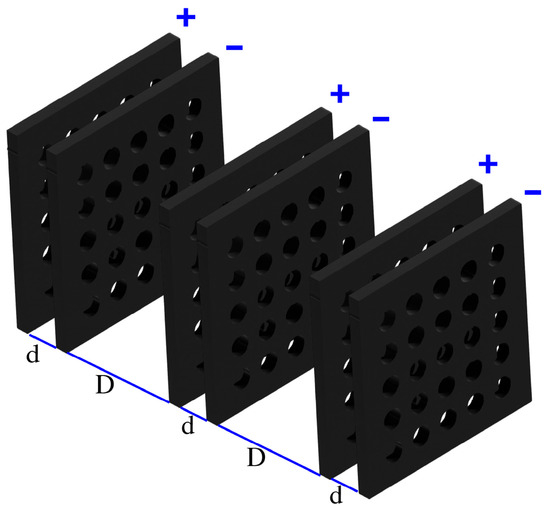
Figure 1.
Electrode arrangement used in the Flashing Ratchet Potential (FRP) system, showing alternating positive and negative electrodes. “d” denotes the inter-electrode gap within each electrode pair, and “D” represents the spacing between consecutive electrode pairs.
In the present design, FRP electrodes are fabricated as metallic grids coated with a dielectric insulating layer to minimize direct charge leakage. The electrodes are biased in a sequenced voltage arrangement of “+V, −V, +V, −V, …” and driven by a square-wave signal alternating between zero and the set voltage with a defined period τ (Figure 2), following the configuration described by Bqoor [39]. The FRP electrodes were fabricated from stainless-steel micro-mesh substrates arranged in alternating positive and negative sequences and fixed on a non-conductive frame to preserve geometric uniformity. Each electrode was then coated using a fine SiO2-based dielectric spray, applied in multiple passes to ensure a continuous insulating layer across the metallic surface. This spray-coating method was selected because it provides high surface coverage, excellent adhesion, and uniform electrical insulation without requiring vacuum deposition. The resulting dielectric layer exhibited an average thickness of approximately 1.0 ± 0.2 µm, verified by optical profilometry.
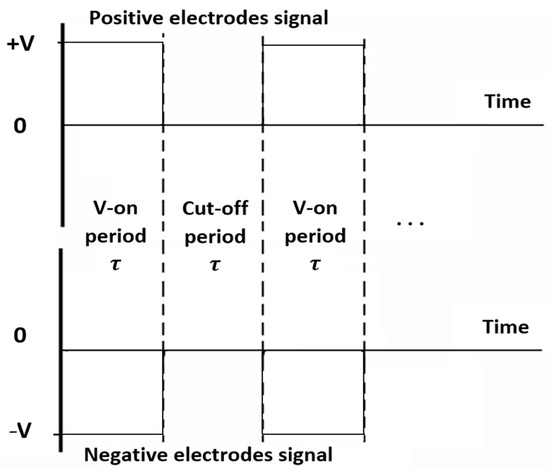
Figure 2.
Square-wave voltage signal supplying power to the FRP electrodes. The dashed vertical lines indicate the transition points between the voltage-on and cut-off periods (τ) for both positive and negative electrode signals.
Electrode spacing and alignment were controlled using laser-cut acrylic templates, maintaining a positional tolerance of ± 0.05 mm across the entire array. These parameters were optimized to minimize charge leakage, ensure symmetric potential distribution, and stabilize the electric field during high-frequency operation. Electrodes with opposite polarities are spaced at a distance (d), while electrodes of identical polarity are separated by (D + d) (Figure 1).
During the Voltage Cut-On phase (τ), free charges traverse the electrode array. These charges are predominantly generated via thermionic emission from specialized cathode materials [17], followed by interactions with oxygen molecules in the ambient air through electron attachment processes [40], and subsequent recombination dynamics at material surfaces [41]. The latter process facilitates the production of O2−•, which serve as the primary charge carriers. The spatial and temporal modulation of the FRP results in controlled drift and size-selective manipulation of airborne particles within the electrode array.
3. Results
3.1. Transportation of Free Charged Particles
To visually confirm the movement of free negative particles through the FRP electrode assembly, a series of controlled experiments were performed. As illustrated in Figure 3, the results provide clear evidence of free-charge transit and the generation of discrete negative electric pulses acros the FRP. The pronounced downward peaks in Figure 3b (with Thermionic Electrons) indicate the arrival of negative charges at the back-end anode, released at a 10 Hz frequency via a high-voltage alternating switch, as opposed to Figure 3a (without Thermionic Electrons).
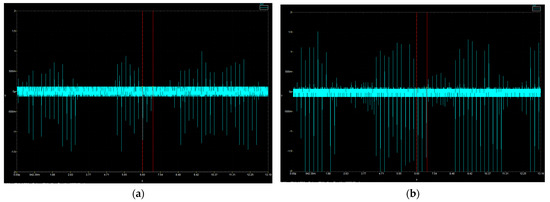
Figure 3.
FRP back-end anode voltage relative to background signals. The cyan trace represents the RMS voltage fluctuations (), and the red vertical line indicates the voltage cut-on reference point (τ). (a) Signal profile without thermionic electron emission (baseline noise). (b) Signal profile with thermionic electron emission, showing increased fluctuation amplitude due to active charge transport across the electrode array.
The higher negative voltage (Vi) fluctuations observed with thermionic electron emission are further substantiated by Root Mean Square (RMS) voltage measurements at the back-end anode:
- Without thermionic electrons:
- With thermionic electrons:
Here, the RMS voltage is calculated as:
which serves as an effective quantitative indicator of the number of free negative particles (n) reaching the anode.
3.2. Particle Transport Mechanism in the FRP
In the experimental setup, thermionically emitted free electrons from the cathode were directed toward the high-voltage insulated electrode, where they were captured by ambient oxygen molecules to form O2−• through three-body electron attachment. These reactive yet short-lived species serve as the principal charge carriers within the FRP field. The supplied high voltage was a half-rectified square wave at a frequency of 10 Hz. Under these conditions, the electrons remained near the high-voltage electrode long enough for most to be captured by ambient oxygen molecules (O2). At low electron energies, the predominant mechanism for O2−• formation is three-body electron attachment:
This process occurs within tens of nanoseconds, as O2−• are among the dominant negative ion species in low-temperature plasmas containing oxygen, air, or other oxygen-rich mixtures [40]. Thus, the majority of charge carriers generated in the FRP can be considered O2−• ions.
The average distance traveled ) by ions with mean energy over a travel time is:
Here, is the FRP voltage, is the oxygen molecular mass, is the electron charge. The travel time t is determined by the FRP frequency FFRP as:
Combining these yields:
The selection of operating frequencies was guided by both theoretical and practical considerations. The low-frequency (≈10 Hz) thermionic heating pulses regulate the rate of primary electron emission, whereas the high-frequency domain (500–1000 kHz) controls the FRP modulation responsible for directed ion transport. Coupling these two frequency scales ensures stable carrier generation while maintaining the temporal asymmetry required for efficient ratchet transport, as predicted by Equation (4). Figure 4 shows the relationship between and the FRP voltage at a constant frequency of 500 kHz. Successful transport within the FRP is governed by discrete travel distances , corresponding to 1 cm, 4 cm, and 7 cm. Increasing voltage does not continuously increase particle transport, as Equation (4) suggests.
Figure 4.
Theoretical relationship between the average distance traveled by O2−• ions and the FRP voltage at a constant frequency of 500 kHz.
For example, at 500 kHz, the optimal FRP voltage for O2−• ions to travel the first 1 cm (crossing the first negative electrode) is approximately 4.2 V. Beyond this voltage, the number of transported ions increases only for particles with energies exceeding 4.2 eV. However, excessively high voltages cause some particles to escape from the FRP boundaries, reducing the net number reaching the back-end anode.
The experimental results in Figure 5 align with theoretical predictions, showing measurements for voltages V ∈ {4, 11} V at 500 kHz. Statistical analysis of the standard deviation (σ) for each voltage (Figure 6) further validates the transport behavior:
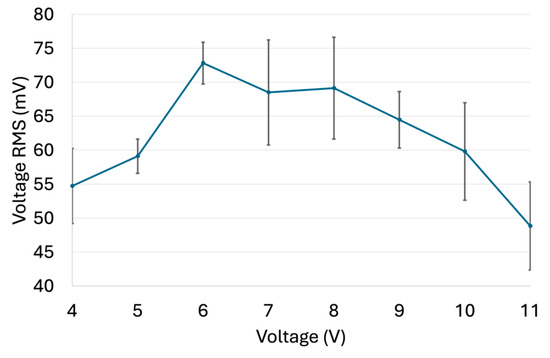
Figure 5.
Experimental relationship between FRP voltage and the average number of transported free charges, expressed by the measured , at a constant frequency of 500 kHz.
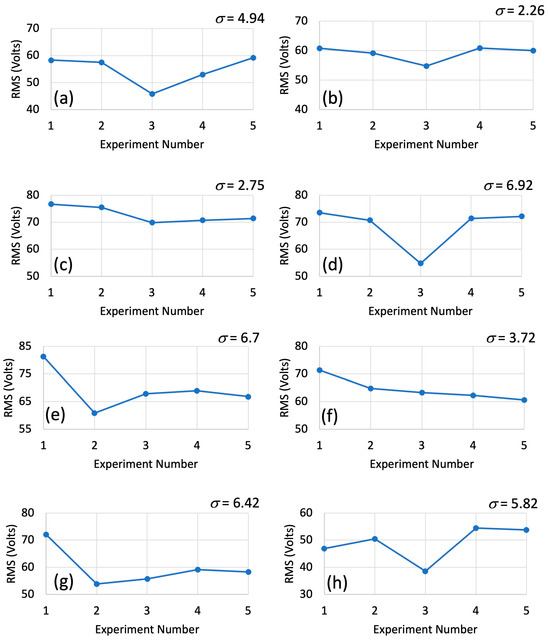
Figure 6.
Statistical analysis of experimental results showing the standard deviation (σ) of the measured at constant FRP frequency (500 kHz) for voltages ranging from 4 V to 11 V: (a) 4 V, 500 kHz; (b) 5 V, 500 kHz; (c) 6 V, 500 kHz; (d) 7 V, 500 kHz; (e) 8 V, 500 kHz; (f) 9 V, 500 kHz; (g) 10 V, 500 kHz; (h) 11 V, 500 kHz.
- Low voltages (V ≤ 4 V): Many free charges lack sufficient energy to cross the first negative electrode, causing charge accumulation near positive electrodes. Over time, shorter travel paths emerge for some charges, making time-dependent and increasing σ.
- Optimal voltages (5–6 V): Most charges have just enough energy to cross the first electrode d = 1 cm, resulting in smaller σ values and more stable transport.
- High voltages (V > 6 V): Excess energy allows charges to cross the first electrode easily, but also enables boundary escapes. This makes the number of transported charges dependent on time-varying thermionic electron production, increasing σ.
To further investigate the influence of the FRP’s operating frequency on particle transport, an additional experiment was conducted in which the FRP voltage was fixed at 6 V, while the driving frequency was varied between 500 kHz and 1000 kHz. The variation of with frequency is presented in Figure 7, and the observed results show strong agreement with the theoretical predictions.
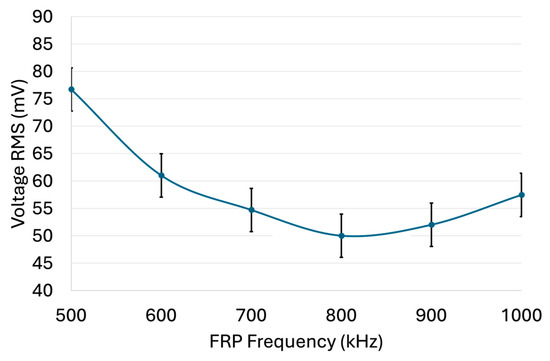
Figure 7.
Frequency dependence of the measured at a constant FRP voltage of 6 V, showing agreement with theoretical predictions.
From the theoretical model, the frequency required for O2−• with an average energy of approximately 6 eV to traverse a distance of 1 cm is around 600 kHz. At frequencies below this value (e.g., 500 kHz), the longer half-cycle period provides the particles with sufficient travel time to cross to the next electrode, leading to a relatively higher transport efficiency. However, as the frequency increases beyond the optimal ~600 kHz, the available travel time per cycle decreases, limiting the ability of particles to reach the next electrode despite the higher oscillation energy imparted by the field. This reduction in transit time explains the downward trend in observed in the range of 500–800 kHz.
Interestingly, when the frequency exceeds ~800 kHz, a different effect becomes dominant. The increasing oscillation amplitude at these higher frequencies imparts greater kinetic energy to the particles, allowing some of them to initiate motion from positions farther away than the nominal starting points. This reduces the required travel distance to less than 1 cm, enabling a greater fraction of the charged particles to reach the subsequent electrode within the shortened cycle time. As a result, begins to rise again in the high-frequency regime, reflecting the combined influence of enhanced particle oscillations and reduced travel distances.
3.3. Detection Methodology Examination
The experimental observations revealed that the anode value, which represents the transport of free negative particles, was sensitive to ambient room conditions, which varied on an hourly basis. These variations were primarily attributed to the fluctuating concentration of free radicals in the surrounding atmosphere. Despite these environmental influences, the characteristic relationships of anode with changes in FRP voltage and frequency, as shown in Figure 5 and Figure 7, remained consistent across multiple repetitions of the experiment. Only minor variations in magnitude were recorded, confirming the robustness of the observed trends.
From Figure 5, the optimal FRP voltage was determined to be approximately 6 V. Similarly, Figure 7 indicated that a critical operating frequency of about 600 kHz produced the most distinct ECS variation upon particle introduction. Accordingly, all subsequent detection trials were performed at the optimized operating point of 6 V and 600 kHz, which consistently yielded stable and reproducible signals (σ ≈ 2%).
The stability of anode under these optimized conditions (6 V, 600 kHz) was evaluated by recording ten successive measurements at 60 s intervals, beginning 5 min after activating the experimental setup. The results, presented in Figure 8, showed a standard deviation of 1.53 mV, approximately 2% of the average value, indicating high operational stability.
Figure 8.
Ten-minute stability test of the measured at constant FRP operating parameters (6 V, 600 kHz), demonstrating high reproducibility and low standard deviation.
The final experiment for examining the detection methodology involved the use of talcum powder, a natural clay mineral primarily composed of magnesium, silicon, oxygen, and hydrogen [22]; its aerosolization characteristics in consumer products have also been studied [23]. The powder used had an average particle diameter of 26.57 μm [23]. In this procedure, approximately 0.1 g of talcum powder was gradually dropped onto the FRP electrodes at ~2 s intervals, ten times, at the 7th, 9th, 11th, …, and 25th minute after the apparatus was switched on. For comparison, measurements were also recorded without the addition of talcum powder at the 6th, 8th, 10th, …, and 24th minute under identical operating conditions.
The results in Figure 9 confirmed the viability of the detection method. The measured percentage difference between the “with powder” and “without powder” cases ranged from 4.5% to 13.4%. For significantly smaller particles, such as viral particles with diameters on the order of 0.1 μm, the relative change in would be proportionally smaller. However, this signal difference can be amplified electronically and integrated over time to enhance detection sensitivity. Moreover, by reducing dead-time intervals through the use of advanced electronic measurement modules, both random and systematic errors can be minimized, further improving detection accuracy. The optimized operating parameters of the FRP–ECS system are summarized in Table 1.
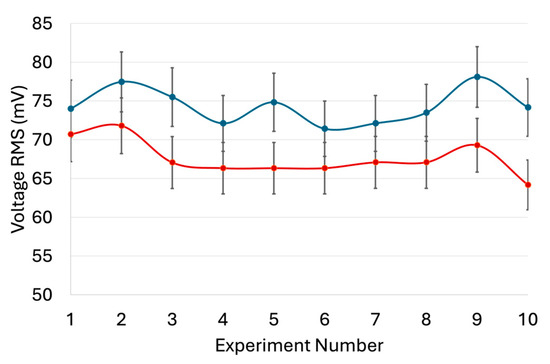
Figure 9.
Validation of the detection methodology: comparison of measurements with (red curve) and without (blue curve) talcum powder (average particle size 26.57 μm) under constant FRP operating parameters (6 V, 600 kHz).

Table 1.
Optimized operating parameters and performance metrics of the FRP–ECS detection system. The symbol “—” denotes values that are not applicable for that parameter.
3.4. Sample Preparation and Insertion
The detection system is designed to identify the presence of particles within a specific size range by comparing two Electrical Current Spectra (ECSs) generated from the same biological sample [9]. The methodology relies on differential analysis:
- First sample: Extracted from the medium between two filtration stages (150 nm and 50 nm filters), where potential impurities in the viral size range (~100 nm) are most likely to exist.
- Second sample: Extracted from the medium after passing through the 50 nm filter, where the probability of viral particle presence is minimal.
Both samples are processed under identical FRP operating parameters to generate their respective ECSs. Subtraction of the second ECS from the first yields one of two diagnostic outcomes:
- Case I—Negative test:The subtraction results in a signal fluctuating around zero with no increasing trend over time. This indicates that the two samples are essentially identical, confirming the absence of impurities within the 150–50 nm size range (negative detection).
- Case II—Positive test:The subtraction results in a signal that increases steadily with time, indicating non-identical samples. This confirms the presence of impurity particles within the 150–50 nm range (positive detection). The slope of this ECS line provides a direct measure of impurity density, corresponding to the number of viral particle copies in the sample.
As illustrated in Figure 10, the system employs precision-controlled valves to regulate insertion of the first and second samples. To minimize noise in ECS measurements, a sample polarization filter is incorporated. This filter prevents strongly polarized objects, such as water vapor molecules, from entering the FRP electrode assembly. Although weakly polarized particles may still affect both ECSs, their influence is effectively canceled out by subtraction and can be further minimized by extending the measurement duration. The detailed internal structure of the FRP electrode assembly, including the cathode, electrode array, and anode connection, is shown separately in Figure 11.
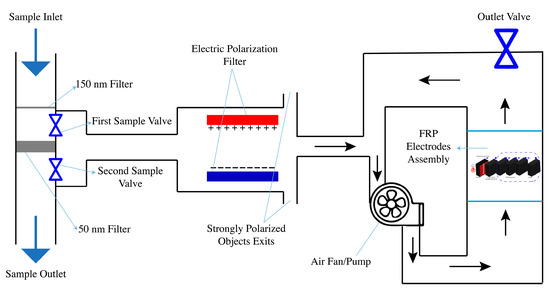
Figure 10.
Schematic of the sample preparation and insertion system showing dual filtration stages and controlled valve mechanisms. The arrows indicate the direction of airflow and particle transport through the filtration, polarization, and FRP electrode stages.
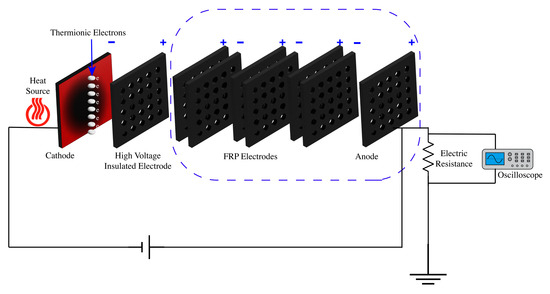
Figure 11.
Enlarged view of the Flashing Ratchet Potential (FRP) electrode assembly, corresponding to the section indicated in Figure 10. The figure shows the cathode with thermionic emission, high-voltage insulated electrode, alternating FRP electrodes, and anode connected to the measurement circuit.
Importantly, this detection system can serve as a rapid screening “gate” to PCR testing. Notably, A negative ECS subtraction result provides strong evidence that no particles are present within the instrument’s detection limits and the specified 150–50 nm size window, substantially reducing the need for immediate PCR confirmation.
3.5. Enhanced Sample Collection Strategy
To ensure that a sufficient number of viral particles enter the detection system, alternative collection methods can be implemented. One such strategy employs a blender-like mechanism to liberate viral particles from aerosol droplets prior to filtration. In this configuration (depicted in Figure 12):
Figure 12.
Improved sample collection mechanism incorporating aerosol liberation and sequential filtration stages.
- The first sample is directed from the blender through the 150 nm filter directly to the polarization filter, bypassing the 50 nm filter, thereby maximizing the probability of capturing viral particles.
- The second sample is collected only after passing through the 50 nm filter, serving as the “clean” reference sample
Furthermore, enforced coughing is recommended for sample collection, as exhaled air produced in this manner contains larger volumes of respiratory droplets originating from the upper respiratory tract. These droplets provide a more representative and concentrated source of viral particles for detection. However, such applications require Institutional Review Board (IRB) approval and will be addressed in future work
4. Discussion and Conclusions
This study presented a novel detection methodology based on the controlled transport of O2−• through Flashing Ratchet Potential (FRP) electrodes and the resulting interaction of these charge carriers with airborne particles. The superoxide species, generated via three-body electron attachment under low-pressure air conditions, exhibit lifetimes on the order of 10−4–10−3 s—sufficient for drift through the electrode array without extensive secondary reactions. The magnitude of the resulting free current was monitored as the root mean square voltage () at the FRP back-end anode, serving as a quantitative indicator of impurity-induced perturbations in charge transport.
Experimental validation confirmed that introducing talcum-powder particles (median diameter: 26.57 μm, [13,23]) produced reproducible RMS shifts of 4.5–13.4%. Although talc is chemically inert toward O2−•, potential oxidative interactions between superoxide and organic aerosols or viral envelopes are acknowledged and will be systematically investigated in future studies. Such reactions may alter surface charge states and thus modulate the ECS signal, potentially enhancing detection sensitivity rather than hindering it.
In addition, it is recognized that interactions between O2−• and organic or biological particles could induce mild oxidative effects on surface lipids or proteins, particularly in viral envelopes. These limited oxidation processes may in fact enhance detection rather than hinder it, since they influence charge mobility and consequently amplify ECS signal amplitude. It should be noted that no biological samples were examined in the present study; all conclusions regarding viral-scale particles are based on non-reactive surrogates and theoretical modeling. Future work will explicitly investigate O2−•–virus interactions under controlled conditions to quantify their contribution to signal modulation.
To further refine the system, we plan to adopt a Design of Experiments (DoE) approach to explore multi-parameter interactions among voltage, frequency, electrode spacing, and dielectric thickness. This multivariate optimization will complement the current single-parameter study and accelerate identification of optimal FRP operating conditions.
From a theoretical standpoint, the system is scalable toward much smaller particles. For viral particles with characteristic dimensions around 100 nm, simulations predict a detectable percentage difference in in the range of 0.2% to 0.5%, assuming realistic concentrations of viral copies and optimized FRP geometry. Although smaller in magnitude than the talcum powder results, such differences are still within measurable limits when supported by signal amplification and longer acquisition times. This points toward the system’s strong potential for application in rapid viral detection scenarios.
Importantly, the methodology is inherently robust to environmental variability. While the absolute scale of can fluctuate slightly with changing room conditions (e.g., ambient radicals or humidity), the relative trends in response to voltage and frequency modulation remained consistent across repeated experiments. This consistency underscores the reproducibility and reliability of the FRP-based approach.
Overall, the system’s dual-filtration configuration and charge-selective transport mechanism substantially mitigate interference from non-target aerosols such as soot or pollen, ensuring that the ECS differential signal primarily reflects viral-sized particles within the 50–150 nm range.
In conclusion, the present work establishes the foundation of a new detection paradigm that combines particle transport physics with electrical signal analysis. The results confirm that:
- Proof of Concept: Controlled transport of ions through FRP electrodes is achievable and can be exploited for detecting foreign particles.
- Demonstrated Sensitivity: Impurities as large as talcum powder (26.57 μm) produce clear and quantifiable signatures in the spectrum.
- Scalability: Theoretical models support extension of this methodology to detect viral-scale particles (~100 nm), given appropriate signal processing. In future work, we plan to extend the present theoretical framework by developing a numerical simulation model combining finite-element electric-field mapping and particle-tracking algorithms to visualize the trajectories of superoxide anions and aerosols under varying FRP voltages and frequencies. This modeling effort will complement the current proof-of-concept experiments and provide quantitative insight into ion transport dynamics.
- Improvement Potential: Detection accuracy and sensitivity can be enhanced by refining electrode manufacturing, optimizing FRP operational conditions, and extending measurement duration.
Overall, this FRP-based system demonstrates promising potential as a rapid, non-invasive pre-screening tool for airborne impurities and pathogens, capable of serving as an efficient “gate” prior to confirmatory molecular tests such as PCR.
5. Patents
This work has led to the filing of an international patent application covering the developed airborne pathogen detection system [13].
Author Contributions
Conceptualization, Y.A.-Z., M.B. and L.I.; methodology, Y.A.-Z., M.B. and L.I.; software, Y.A.-Z., M.B. and L.I.; validation, Y.A.-Z. and M.B.; formal analysis, Y.A.-Z., M.B. and L.I.; investigation, Y.A.-Z., M.A. and L.I.; resources, Y.A.-Z.; data curation, Y.A.-Z., M.B., M.A. and L.I.; writing—original draft preparation, Y.A.-Z.; writing—review and editing, Y.A.-Z., M.B. and M.A.; visualization, Y.A.-Z., M.B., M.A., M.A. and L.I.; supervision, Y.A.-Z.; project administration, Y.A.-Z. All authors have read and agreed to the published version of the manuscript.
Funding
This research received no external funding.
Institutional Review Board Statement
Not applicable.
Informed Consent Statement
Not applicable.
Data Availability Statement
The raw data supporting the conclusions of this article will be made available by the authors on request.
Acknowledgments
This study was finalized during the sabbatical leave of Yazan Al-Zain from the University of Jordan for the Academic year 2024/2025.
Conflicts of Interest
The authors declare that there are no commercial, financial, or other conflicts of interest related to this work.
Abbreviations
The following abbreviations are used in this manuscript:
| FRP | Flashing Ratchet Potential |
| ECS | Electric Current Spectroscopy |
| PCR | Polymerase Chain Reaction |
| RMS | Root Mean Square |
References
- Morawska, A.; Cao, J. Airborne transmission of SARS-CoV-2: The world should face the reality. Environ. Int. 2020, 139, 105730. [Google Scholar] [CrossRef] [PubMed]
- Chang, Y.; Wang, Y.; Li, W.; Wei, Z.; Tang, S.; Chen, R. Mechanisms, techniques and devices of airborne virus detection: A review. Int. J. Environ. Res. Public Health 2023, 20, 5471. [Google Scholar] [CrossRef]
- Peña-Bahamonde, J.; Nguyen, H.N.; Fanourakis, S.K.; Rodrigues, D.F. Recent advances in graphene-based biosensor technology with applications in life sciences. J. Nanobiotechnol. 2018, 16, 75. [Google Scholar] [CrossRef]
- Vidic, J.; Manzano, M. Electrochemical biosensors for rapid pathogen detection. Curr. Opin. Electrochem. 2021, 29, 100750. [Google Scholar] [CrossRef]
- Shanmukh, S.; Jones, L.; Driskell, J.; Zhao, Y.; Dluhy, R.; Tripp, R.A. Rapid and Sensitive Detection of Respiratory Virus Molecular Signatures Using a Silver Nanorod Array SERS Substrate. Nano Lett. 2006, 6, 2630–2636. [Google Scholar] [CrossRef]
- Yang, N.; Li, T.; Dong, S.; Zhang, S.; Jia, Y.; Mao, H.; Zhang, Z.; Zhang, F.; Pan, X.; Zhang, X.; et al. Correction: Detection of airborne pathogens with single photon counting and a real-time spectrometer on microfluidics. Lab Chip 2023, 23, 400. [Google Scholar] [CrossRef]
- Sivakumar, R.; Lee, N.Y. Recent advances in airborne pathogen detection using optical and electrochemical biosensors. Anal. Chim. Acta 2022, 1234, 340297. [Google Scholar] [CrossRef]
- Puthussery, J.V.; Ghumra, D.P.; McBrearty, K.R.; Doherty, B.M.; Sumlin, B.J.; Sarabandi, A.; Mandal, A.G.; Shetty, N.J.; Gardiner, W.D.; Magrecki, J.P.; et al. Real-Time Environmental Surveillance of SARS-CoV-2 Aerosols. Nat. Commun. 2023, 14, 3692. [Google Scholar] [CrossRef] [PubMed]
- Lee, D.; Jang, J.; Jang, J. Sensitive and Highly Rapid Electrochemical Measurement of Airborne Coronaviruses through Condensation-Based Direct Impaction onto Carbon Nanotube-Coated Porous Paper Working Electrodes. J. Hazard. Mater. 2023, 458, 131972. [Google Scholar] [CrossRef]
- Talukder, M.E.; Alam, F.; Pervez, M.N.; Jiangming, W.; Hassan, F.; Stylios, G.K.; Naddeo, V.; Song, H. New Generation Washable PES Membrane Face Mask for Virus Filtration. Nanocomposites 2022, 8, 13–23. [Google Scholar] [CrossRef]
- Wang, Y.; Zhou, Y. Recent progress on anti-humidity strategies of chemiresistive gas sensors. Materials 2022, 15, 8728. [Google Scholar] [CrossRef] [PubMed]
- Albqoor, M.J.A.; Al-Zain, Y.M.Y.; Alkaid Albqoor, M.J.; Isma’il, L.B.J. Airborne Viral Particles and Microorganisms Detection System and Method Using Flashing Ratchet Potential. PCT Patent Application WO2023223369, Published 7 December 2023. Available online: https://patentscope.wipo.int/search/en/detail.jsf?docId=WO2023223369 (accessed on 18 August 2025).
- Bqoor, M.; Al-Zain, Y.; Albqoor, M.A.; Ismail, L. Airborne viral particles and microorganisms detection system and method using flashing ratchet potential. Preprints 2023, 2023091335. [Google Scholar] [CrossRef]
- Reimann, P. Brownian Motors: Noisy Transport Far from Equilibrium. Phys. Rep. 2002, 361, 57–265. [Google Scholar] [CrossRef]
- Skaug, M.J.; Schwemmer, C.; Fringes, S.; Rawlings, C.D.; Knoll, A.W. Nanofluidic rocking Brownian motors. Science 2018, 359, 1505–1508. [Google Scholar] [CrossRef]
- Roche, B.; Roulleau, P.; Jullien, T.; Jompol, Y.; Farrer, I.; Ritchie, D.A.; Glattli, D.C. Harvesting dissipated energy with a mesoscopic ratchet. Nat. Commun. 2015, 6, 6738. [Google Scholar] [CrossRef]
- McCarthy, P.T.; Reifenberger, R.G.; Fisher, T.S. Thermionic and photo-excited electron emission for energy-conversion processes. Front. Energy Res. 2014, 2, 54. [Google Scholar] [CrossRef]
- Ponomarev, A.A.; Aleksandrov, N.L. The kinetics of energetic O− ions in oxygen discharge plasmas. Plasma Sources Sci. Technol. 2017, 26, 044003. [Google Scholar] [CrossRef]
- Vidic, J.; Manzano, M.; Chang, C.-M.; Jaffrezic-Renault, N. Advanced Biosensors for Detection of Pathogens Related to Livestock and Poultry. Vet. Res. 2017, 48, 11. [Google Scholar] [CrossRef]
- Oh, J.; Hart, R.; Capurro, J.; Noh, H.M. Comprehensive analysis of particle motion under non-uniform AC electric fields in a microchannel. Lab Chip 2009, 9, 62–78. [Google Scholar] [CrossRef]
- Mitra, A.; Ignatovich, F.; Novotny, L. Nanofluidic preconcentration and detection of nanoparticles. J. Appl. Phys. 2012, 112, 014306. [Google Scholar] [CrossRef]
- Kulkarni, P.; Baron, P.A.; Willeke, K. (Eds.) Aerosol Measurement: Principles, Techniques, and Applications, 3rd ed.; John Wiley & Sons: Hoboken, NJ, USA, 2011. [Google Scholar]
- Rasmussen, P.E.; Levesque, C.; Niu, J.; Gardner, H.D.; Nilsson, G.; Macey, K. Characterization of airborne particles emitted during application of cosmetic talc products. Int. J. Environ. Res. Public Health 2019, 16, 3830. [Google Scholar] [CrossRef]
- Taniguchi, T.; Kawamura, K.; Sakamoto, S.; Tagashira, H. Three-body attachment in oxygen and an air-like nitrogen and oxygen mixture. J. Phys. D Appl. Phys. 1982, 15, 1187. [Google Scholar] [CrossRef]
- Wachholz Junior, D.; Deroco, P.B.; Hryniewicz, B.M.; Kubota, L.T. Strategies for electrochemical point-of-care biosensors. Annu. Rev. Anal. Chem. 2025, 18, 161–181. [Google Scholar] [CrossRef] [PubMed]
- Jayakumar, A.; Surendranath, A. 2D materials for next generation healthcare applications. Int. J. Pharm. 2018, 551, 309–321. [Google Scholar] [CrossRef]
- Feynman, R.P.; Leighton, R.B.; Sands, M. The Feynman Lectures on Physics, Vol. I; Addison-Wesley: Reading, MA, USA, 1963. [Google Scholar]
- Wang, Z.; Jia, Z.; He, X. Net motion of a charged macromolecule in a ratchet-slit. Soft Matter 2013, 9, 11107–11112. [Google Scholar] [CrossRef]
- Lau, B.; Kedem, O.; Schwabacher, J.; Kwasnieski, D.; Weiss, E.A. An introduction to ratchets in chemistry and biology. Mater. Horiz. 2017, 4, 310–318. [Google Scholar] [CrossRef]
- Lavella, G.; Morfino, R.; Maharbiz, M.M. A synthetic Brownian ratchet architecture for creating tailorable chemomechanical nanomachines. Appl. Phys. Lett. 2012, 101, 013701. [Google Scholar] [CrossRef]
- Pavlyukevich, I.; Li, Y.; Xu, Y.; Chechkin, A. Directed transport induced by spatially modulated Lévy flights. J. Phys. A Math. Theor. 2015, 48, 495004. [Google Scholar] [CrossRef]
- Liao, K.; Collins, S.; Brus, V.; Mikhnenko, O.; Hu, Y.; Phan, H.; Nguyen, T. Electron Ratchets: State of the Field and Future Challenges. ACS Appl. Mater. Interfaces 2019, 11, 1081–1087. [Google Scholar] [CrossRef] [PubMed]
- Bader, J.S.; Hammond, R.W.; Henck, S.A.; Deem, M.W.; McDermott, G.A.; Bustillo, J.M.; Simpson, J.W.; Mulhern, G.T.; Rothberg, J.M. DNA Transport by a Micromachined Brownian Ratchet Device. Proc. Natl. Acad. Sci. USA 1999, 96, 13165–13169. [Google Scholar] [CrossRef] [PubMed]
- Depperschmidt, A.; Ketterer, N.; Pfaffelhuber, P. A Brownian Ratchet for Protein Translocation Including Dissociation of Ratcheting Sites. J. Math. Biol. 2013, 66, 505–534. [Google Scholar] [CrossRef] [PubMed]
- Zarrin, A.; Sivak, D.A.; Brown, A.I. Breaking Time-Reversal Symmetry for Ratchet Models of Molecular Machines. Phys. Rev. E 2019, 99, 062127. [Google Scholar] [CrossRef]
- Chen, Q.; Wu, J.C.; Hu, C.T.; Ou, Y.L.; Ai, B.Q. Transport of Interacting Self-Propelled Brownian Particles in a Common Ratchet Potential. Eur. Phys. J. B 2015, 88, 22. [Google Scholar] [CrossRef]
- Plyukhin, A.V. Intrinsic Ratchets: A Hamiltonian Approach. Phys. Rev. E 2018, 98, 042130. [Google Scholar] [CrossRef]
- Ryabov, A.; Tasinkevych, M. Mechanochemical Active Ratchet. Sci. Rep. 2023, 13, 20572. [Google Scholar] [CrossRef] [PubMed]
- Bqoor, M.J. Ionized Gas Thermoelectric Generator. Therm. Sci. Eng. Prog. 2020, 18, 100496. [Google Scholar] [CrossRef]
- de Urquijo, J.; González-Magaña, O.; Basurto, E.; Juárez, A.M. Two- and three-body attachment, electron transport and ionisation in water-air mixtures. J. Phys. D Appl. Phys. 2023, 57, 125205. [Google Scholar] [CrossRef]
- Paul, D.; Mozetič, M.; Zaplotnik, R.; Primc, G.; Đonlagić, D.; Vesel, A. A review of recombination coefficients of neutral oxygen atoms for various materials. Materials 2023, 16, 1774. [Google Scholar] [CrossRef]


Disclaimer/Publisher’s Note: The statements, opinions and data contained in all publications are solely those of the individual author(s) and contributor(s) and not of MDPI and/or the editor(s). MDPI and/or the editor(s) disclaim responsibility for any injury to people or property resulting from any ideas, methods, instructions or products referred to in the content. |
© 2025 by the authors. Licensee MDPI, Basel, Switzerland. This article is an open access article distributed under the terms and conditions of the Creative Commons Attribution (CC BY) license (https://creativecommons.org/licenses/by/4.0/).