Abstract
Nitrate, as one of the important nutrients in seawater, influences the constant ratio of nitrogen to phosphorus, which is closely related to phytoplankton survival. In this work, a Cu-nanosphere-modified gold microwire electrode was used as the working electrode for determining nitrate in an artificial seawater sample with salinity of 35‰ by a differential pulse voltammetry technique. Under the optimized conditions, the detection linear range is from 1 μM to 2000 μM, the limit of detection is 0.33 μM, and the response time for a single sample is 5 min. Then, to reduce the influence of factors such as temperature, humidity, and microbial environment during sample transporting on the nitrate concentration in real seawater, a portable electrochemical system was introduced for on-site detection. Rapid field determination results show that nitrate levels correlate with tides, proving the portable system’s reliability.
1. Introduction
Nitrate plays a key role in marine biogeochemical cycles and is essential for maintaining planktonic ecosystem balance [1]. Nitrate is found naturally in soil, water, and food, so it has significant implications for environmental and human health [2]. Meanwhile, nitrate, as the main dissolved nitrogen form in seawater, plays a key role in biogeochemical cycles by regulating the growth of phytoplankton and nutrient cycling, affecting the survival of phytoplankton and plants in the ocean that use dissolved nitrogen as a major nutrient element [3]. It may even threaten biological diversity, as well as human health, through transmission through the food chain [4]. Seawater and phytoplankton exhibit a similar C:N:P = 106:16:1 relationship, known as the Redfield Ratio [5]. This ratio is frequently used as a benchmark to identify limiting nutrients for marine productivity. A N/P ratio higher than this value indicates phosphorus limitation, while a lower ratio suggests nitrogen limitation [6]. Currently, most ocean and sea areas, including the Bohai Sea, have experienced a sharp decline in their N/P ratios. This decline in dissolved inorganic nitrogen is primarily attributed to human activities, with atmospheric deposition, wastewater discharges, and riverine inputs contributing 66%, 21%, and 13%, respectively. As a limiting element, nitrogen limits surface primary productivity, leading to increasing eutrophication of the Bohai Sea [7]. In coastal seawater, nitrate concentrations are much higher in coastal marine areas than in the open ocean due to run-off from land and human activities. Valiela et al. indicate that nitrate concentrations in China’s coastal waters, particularly in the Yellow Sea region, have significantly increased. Several Chinese rivers discharge extremely high concentrations of nitrate into the Yellow Sea. The Changjiang (Yangtze), Huanghe (Bohai Sea), Jiulong (East China Sea), and Pearl Rivers (South China Sea) show nitrate concentrations of 10–160 μM, 200–260 μM, 14.3–743 μM, and 0–325 μM, respectively [8]. In contrast, surface nitrate concentrations in open ocean regions (e.g., off the coast of Peru and the coastal upwelling zone extending to the equatorial Pacific at ~180° W) are typically about 10 μM. These concentrations gradually decrease with increasing distance from the shore [9]. Deviations from the Redfield Ratio can lead to a rapid increase in red tide and algal bloom events. Furthermore, such imbalances promote the proliferation of harmful bacterial species. The consequences include large-scale mortality of other phytoplankton and a marked depletion of dissolved oxygen in seawater [10]. Therefore, on-site detection of precise nitrate levels in seawater can provide a rapid reflection of the nitrate concentration in the field.
The main causes of nitrate in seawater include human activities (e.g., agricultural water flow, industrial emissions, and urbanization) [11] and natural factors (e.g., atmospheric deposition and nitrogen fixation) [12]. Nitrification and denitrification maintain the nitrogen balance of nitrate. The rates of these processes are governed by external conditions, such as pH, microbiology, and temperature [13]. These affect the concentrations of nitrate in actual seawater samples. Excessive nitrogen concentrations, attributable to human activities, cause significant risks to the marine environment and humans, so the efficiency of nitrate monitoring is crucial. Consequently, rapid and in situ determination of nitrate concentration in seawater can effectively avoid the interference of environmental conditions. Furthermore, it avoids errors caused by sample storage and transport. On the other hand, in situ detection is convenient, allowing researchers to observe the field situation and providing real-time analyses in the field with useful reference data. Therefore, it is necessary to develop a method for rapid determination of nitrate in seawater directly in the field.
Currently, various methods for the detection of nitrate in seawater include ultraviolet spectrophotometry [14], copper and cadmium reduction [15], ion chromatography [16], high-performance liquid chromatography [17], colorimetry [18], capillary electrophoresis [19], surface-enhanced Raman spectroscopy [20], etc. Although the sensitivity and reliability of these methods are excellent, they generally require large, complex, and expensive equipment. In addition, professional technicians are required to carry out sample pre-treatment or pre-concentration, as well as other relevant operations. Furthermore, the data is found to be less selective, and these methods are time-consuming and complex to perform. They are not suitable for on-site detection of nitrate in seawater. On the other hand, biological denitrification requires continuous on-site detection of nitrate. At the same time, extractive techniques such as ion-exchange resins [21] and reverse osmosis [22] produce secondary pollution that must be tracked, increasing the cost of systematic detection. Therefore, the electrochemical detection of nitrate in seawater can be regarded as a potential alternative method. It has attracted attention due to its simple procedure, convenient use, high efficiency, portable equipment, low sample volume, and low cost [23]. At the same time, electrochemical methods offer the possibility of performing a rapid field determination of nitrate in seawater due to the small portable size of the instrument.
Electrode materials are of critical importance in determining product selectivity and accelerating electron conduction efficiency. For instance, Cu/Cu2O nanowires demonstrate enhanced activity for NO3− reduction in K2SO4 solution. Paliwal et al. [24] reported voltammetric and spectroscopic measurements of the nitrate reduction reaction on copper and copper alloy electrodes (CuAg, CuSn, and CuPt) in alkaline media. The alloying of Cu with Ag in an alkaline electrochemical environment has been shown to improve the activity of the nitrate reduction catalyst compared to Cu alone. The enhanced activity of the catalyst resulted from a specific electronic interaction within the Cu-Ag alloy. This mechanism was attributed to the transfer of electron density from Cu to Ag. As a result, the Ag atoms maintained a more reduced state on the Cu surface. Consequently, the Cu-Ag alloy catalyst was stabilized by the coordinating ligand 3,5-diamino-1,2,4-triazole (DAT) during the electrodeposition process, exhibiting enhanced resistance to oxidation. This conclusion is supported by vibrational spectroscopy, which reveals that oxidation is correlated with the nitrate reduction process in alkaline media. Li et al. [25] reported the preparation of an amino-functionalized, vertically ordered mesoporous silica film (NH2-VMSF). Subsequently, copper nanoparticles (CuNPs) were immobilized onto this film. This composite material was then used to modify an indium tin oxide (ITO) electrode. The obtained CuNPs/NH2-VMSF/ITO was then applied to the electrochemical detection of NO3−. This method demonstrated a wide linear concentration range of 5.0–1000 μM, with a low detection limit of 2.3 μM. The direct electrochemical detection of NO3− in water samples (tap water, lake water, seawater, and rainwater) was achieved by CuNPs/NH2-VMSF/ITO, with recoveries ranging from 97.8% to 109%. The CuNPs/NH2-VMSF/ITO sensor has been demonstrated to exhibit excellent reproducibility, regenerability, and reliability. Wu et al. [26] used electrochemically reduced copper oxide nanowires that were grown via thermal oxidation to obtain arrays of copper nanowires grown seamlessly on copper wires. The obtained nanostructures, which were characterized by seamless surfaces, provided a large surface area and improved electrical conductivity for the working electrode. Amperometric testing demonstrated excellent performance of the seamless-nanowire-structured working electrode. It exhibited a linear response (R2 = 0.9974) to nitrate ions across a concentration range of 50 to 600 μM. A high sensitivity of 0.357 μA·μM−1·cm−1 and a low detection limit of 12.2 μM (at S/N = 3) were also obtained. This is of great significance for the design of electrochemical sensors.
This work focused on the field determination of nitrate in coastal seawater. A portable electrochemical rapid determination system was constructed for the field determination of nitrate in seawater, as shown in Figure 1a. The system utilizes differential pulse voltammetry (DPV) as the detection method, which transitions from laboratory-based optimization to field implementation of the developed method. This method could be used for field determination of nitrate concentrations, enabling rapid analysis. In this work, a portable electrochemical system was constructed using a Cu-nanosphere-modified gold microwire electrode as the working electrode. The determination performance was investigated by DPV under optimal experimental conditions and compared with spectrophotometry. Furthermore, the entire miniaturized system enabled direct on-site analysis with minimal sample preparation, overcoming the dependency on laboratory-bound instruments. In order to verify the practicality of the constructed portable electrochemical system for field determination of nitrate, high-frequency sampling of coastal seawater was used to detect the concentration of nitrate. The results showed that the nitrate concentration had a good correlation with tidal variation. This indicated that the constructed portable electrochemical system could achieve reliability and stability in the field determination of nitrate in coastal seawater.
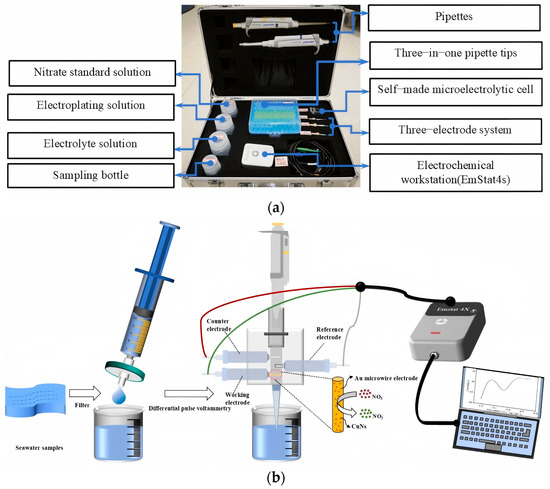
Figure 1.
Portable electrochemical rapid detection system (a) and process of nitrate detection (b).
2. Materials and Methods
2.1. Reagents
Unless otherwise stated, all the chemical reagents used in this study were analytical grade and provided by Sinopharm Chemical Reagent Co., Ltd. (Shanghai, China). Copper sulfate pentahydrate (CuSO4·5H2O), sodium nitrate (NaNO3), anhydrous ethanol (CH3CH2OH), potassium ferricyanide (K3[Fe(CN)6]), potassium ferrocyanide (K4[Fe(CN)6]) and potassium chloride (KCl), concentrated sulfuric acid (H2SO4, 98%), and standard artificial seawater (with a salinity of 35‰, GBW(E)130011, Beijing Putian Tongchuang Biological Technology, Co., Beijing, China) were used in this work.
2.2. Apparatus
All experiments were performed on an electrochemical workstation (EmStat4s) produced by Red Matrix China Limited. The three-electrode system, purchased from ChuXi Industrial Co., Ltd. (Shanghai, China), comprised the following: a gold microwire electrode was used as the working electrode (Au microwire: diameter 0.3 mm, length 5 mm, purity 99.99%), a silver/silver chloride electrode was used as the reference electrode (Ag/AgCl, diameter 0.6 mm, length 6 mm, purity 99.99%), and a platinum wire electrode was used as the auxiliary electrode (Pt, diameter 0.6 mm, length 6 mm). Micropipettes were purchased from Eppendorf company (Hamburg, Germany). A spectrophotometer (DU 800, PerkinElmer Instrument Co., Ltd., Waltham, MA, USA), high-resolution scanning electron microscope (S-4800, Hitachi, Tokyo Japan), ultrapure water system (Cascade-Bio, Pall Corporation, Port Washington, NY, USA), and pH meter (E-201-C, Shanghai LeiMag Instrument Co., Ltd., Shanghai, China) were used in this work. A miniature electrolytic cell was self-made from polyether ether ketone with length of 15 mm, width of 10 mm, and height of 20 mm.
2.3. Construction of a Portable Electrochemical System
Figure 1a shows a portable electrochemical system for the field determination of nitrate. Three construction sections are as follows: (i) a portable electrochemical workstation; (ii) a laptop computer connected to the electrochemical workstation for data recording; (iii) a self-made micro-electrolytic cell with a three-electrode system: CuNs/Au microwire working electrode, platinum wire counter electrode, and Ag/AgCl reference electrode.
2.4. Electrochemical Analysis Procedure
The gold microwire electrode was firstly modified with copper nanospheres (CuNs) through the i-t deposition technique in a solution of 0.5 M CuSO4·5H2O in ultrapure water under optimized conditions: deposition potential of −0.4 V and deposition time of 60 s. Then electrochemical analysis procedure started: a 5 mL seawater sample was first filtered with a 0.45 μm filter membrane into a reagent bottle; subsequently, 5 M H2SO4 was added dropwise into the seawater sample until the target pH value of 6 was reached. Finally, nitrate in seawater samples was identified on a self-made micro-electrolytic cell through pipettes by the DPV technique. The potential window was set in the range from −0.6 V to −1.2 V, with a step potential value of 0.01 V, a pulse potential set to 0.05 V, a pulse time of 0.05 s, and a scanning rate of 100 mV/s. The standard addition method was employed to determine the nitrate concentration in seawater samples. A fixed volume of the sample was successively spiked with known volumes (in the micromolar range) of a high-concentration nitrate standard solution. The current response was recorded after each addition. A calibration curve was plotted as the current versus the concentration of nitrate added. The original nitrate concentration was calculated from the absolute value of the x-intercept. The analysis procedure is visualized in Figure 1b. When necessary, the electrode was regenerated to prepare a fresh active surface for the next detection. The regeneration procedure involved applying a constant potential of 0.3 V using i-t amperometry in 0.5 M H2SO4 for 60 s to electrochemically dissolve the copper nanospheres, followed by thorough rinsing with ultrapure water.
2.5. Coastal Seawater Sample Collection
In accordance with the “Marine Survey Specifications” (GB/T 12763-2007) and the “Marine Monitoring Specifications” (GB 17378-2007), surface seawater samples (0~1 m) were collected in this work. Sampling was conducted in the coastal area of Yantai, located in the Yellow Sea, using polytetrafluoroethylene (PTFE) bottles that had been acid-washed and then dried. Before sampling, the bottles were rinsed three times with local seawater. After collection, the samples were filtered through a 0.45 μm cellulose acetate membrane filter. Subsequently, the samples were analyzed on-site using the portable detection system.
3. Results and Discussion
3.1. Detection Mechanism
Copper nanosphere (CuN)-modified gold microwire electrode used as the working electrode can significantly enhance the electron transfer rate in the electrochemical determination process of nitrate ions (NO3−). When the pH value of the solution is below 7, the electrochemical reduction reaction of nitrate is a two-electron transfer coupled with a two-proton process [25]. Cu nanospheres accelerate electron transfer to the electrode surface, resulting in amplification of the detection signal. The fundamental reaction mechanism is as follows:
NO3− + 2H+ + 2e− → NO2− + H2O
3.2. Characterization of CuNs/Au Microwire Electrode
3.2.1. Scanning Electron Microscopy
The morphology and structure of the Cu-nanosphere-modified gold microwire electrode were characterized using scanning electron microscopy (SEM) and energy-dispersive spectrometry (EDS), as illustrated in Figure 2. Comparative analysis of the bare Au microwire electrode and CuNs/Au microwire electrode (Figure 2a,b) reveals distinct morphological differences. The surface of the CuNs/Au microwire electrode (seen in Figure 2b,c) exhibited a uniform distribution of spherical substances with a nano-size, which indicated that Cu nanospheres had been successfully deposited onto the gold microwire electrode. The individual nanospheres with diameters of 10–50 nm provide the electrode with a larger electrochemically active surface area and higher conductivity, which facilitates determination of NO3− on CuNs/Au microwire electrode.
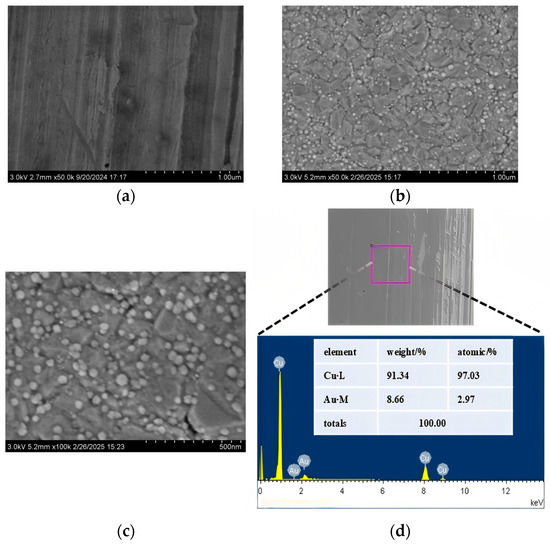
Figure 2.
Scanning electron micrograph images of bare Au microwire electrode (a) with magnification factor of 50,000× and Cu-nanosphere-modified Au microwire electrode (CuNs/Au microwire electrode) with magnification factors of (b) 50,000× and (c) 100,000×; (d) energy-dispersive spectrometry of CuNs/Au microwire electrode.
EDS results shown in Figure 2d demonstrated that Cu and Au were the predominant constituent elements on the modified electrode surface. The relative proportions of Cu and Au elements are 91.34% and 8.66%, respectively, which further confirms that Cu nanospheres had been immobilized on the Au microwire electrode surface.
3.2.2. Cyclic Voltammetry
Figure 3a demonstrates CV responses of K3Fe(CN)6 on the bare Au microwire electrode and CuNs/Au microwire electrode at a scan rate of 50 mV/s. The significant enhancement in peak current density was observed at the CuNs/Au microwire electrode (5.057 mA·cm−2) compared to the bare Au microwire electrode (3.126 mA·cm−2). This enhancement demonstrated the larger electrochemically active surface area provided by Cu nanospheres. The current density was calculated by normalizing the peak current difference (ΔIp) to the electrode’s geometric area. It demonstrated that Cu nanospheres provided a larger electroactive surface area, leading to an enhanced current response.
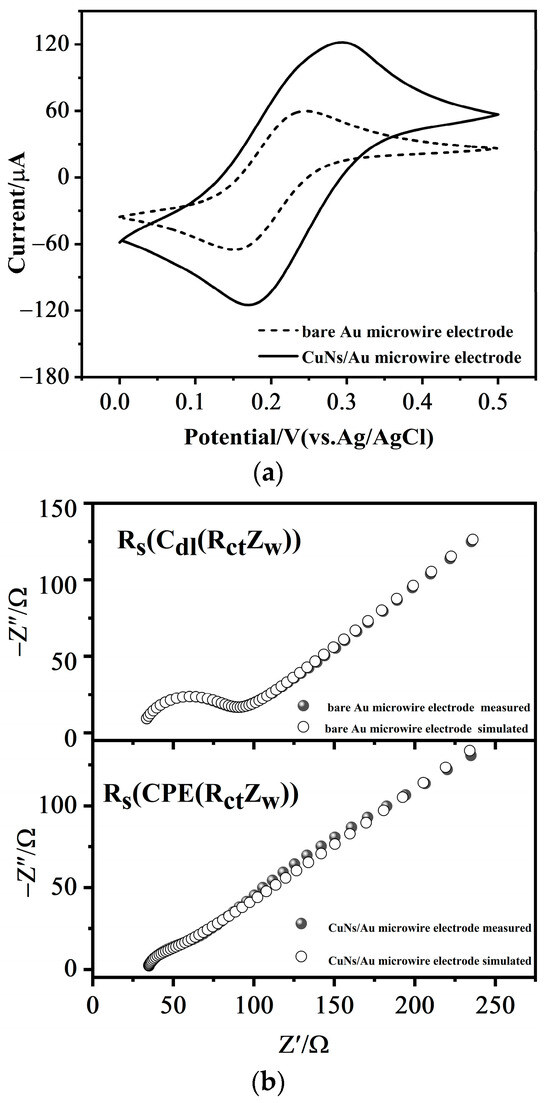
Figure 3.
Cyclic voltammetric curve (a) and Nyquist plots (b) of bare Au microwire electrode and Cu-nanosphere-modified Au microwire electrode obtained for 5 mM K3Fe(CN)6/K4Fe(CN)6 in 0.5 M KCl at bare Au microwire electrode and CuNs/Au microwire electrode, respectively. Frequency range is from 106 to 0.01 Hz, and perturbation signal is 5 mV.
3.2.3. Electrochemical Impedance Spectroscopy
To further investigate the interfacial properties, electrochemical impedance spectroscopy (EIS) was performed in an electrolyte containing 0.5 M KCl and 5 mM K3[Fe(CN)6]/K4[Fe(CN)6]. EIS spectra were analyzed to evaluate the conductive behavior and charge transfer resistance at the electrode surface. Nyquist plots of the bare Au microwire electrode and CuNs/Au microwire electrode were recorded at an open circuit potential of 0.18 V over a frequency range from 0.01 Hz to 105 Hz. (Figure 3b). The experimental data were fitted using the Randles equivalent circuit (seen in Figure 3b), where Rs represents the solution resistance, Rct denotes the charge transfer resistance, constant phase element (CPE) accounts for non-ideal capacitive behavior arising from surface roughness or adsorbed species [27], and Zw corresponds to the Warburg impedance associated with diffusion processes [28].
Rct values for the bare Au microwire electrode and CuNs/Au microwire electrode were determined to be 53.52 Ω and 7.10 Ω, respectively. The marked reduction in Rct indicated that the Cu nanosphere modification exposed abundant active sites and minimized electron transfer resistance, which greatly facilitated charge transfer. This is consistent with studies demonstrating that Cu-based nanostructures enhance interfacial electron transfer by providing a high density of electroactive sites [29]. The CPE equation has two parameters: Q, which is related to its capacitance, and n, the constant phase exponent, which is related to the deviation from an ideal capacitor. The behavior of a constant phase element at a value of 1 is similar to that of a normal capacitor; at a value of 0.5, it is like a Warburg element; and at a value of 0.0, it is similar to that of a resistor. Additionally, the CPE parameters demonstrated a decline in the capacitance (Q) from 0.913 μT (bare Au microwire electrode) to 0.637 μT (CuNs/Au microwire electrode), along with an enhancement in the constant phase exponent (n) from 0.864 to 1.000. The improved n value approaching unity signifies enhanced surface homogeneity and a transition toward ideal capacitive behavior, as observed in nanocomposite-modified electrodes where nanoparticle dispersion optimizes interfacial properties [30]. These results confirmed that the Cu nanosphere modification layer facilitates efficient charge transfer at the electrode/electrolyte interface.
3.3. Voltammetric Response of Portable Electrochemical System in Artificial Seawater
3.3.1. Optimization Conditions
Various conditions, including electrodeposition potential and electrodeposition time, seawater pH value, and scanning rate, were optimized. These results are shown in Figure S1. The influence of electrodeposition potential (varying from −0.6 V to −0.3 V) on the DPV peak current of nitrate is shown in Figure S1A. Noticeably, the response peak current increased sharply with the increase in electrodeposition potential, ranging from −0.6 V to −0.4 V. However, it increased slowly as the electrodeposition potential changed from −0.4 V to −0.3 V. Although the peak current at −0.4 V was slightly lower than that at −0.3 V, the error margin decreased significantly. Therefore, the optimal electrodeposition potential was chosen to be −0.4 V, considering both signal stability and current response characteristics.
The effect of electrodeposition time was also investigated, with electrodeposition time ranging from 10 s to 70 s (shown in Figure S1B). The DPV peak current of nitrate exhibited a rapid increase from 10 s to 60 s, followed by a gradual growth trend between 60 s and 70 s. The transition likely stems from gradual accumulation of Cu nanospheres on the bare Au microwire electrode surface during the deposition process. It reached saturation at 60 s. After this electrodeposition time (60 s), further increases in time only caused slight increases in DPV peak current. This may be attributed to the surface being nearly fully covered, reaching a steady-state condition. Therefore, the optimal electrodeposition time was determined to be 60 s, considering both electrodeposition efficiency and surface coverage. Meanwhile, the artificial seawater pH value with salinity of 35‰ was systematically adjusted from 3 to 8 to investigate its effect on nitrate detection. As shown in Figure S1C, the DPV peak current exhibited a gradual increase across the pH range of 3~6, whereas a progressive decline was observed for pH values between 6 and 8. The maximum peak current amplitude was attained at a pH value of 6. Therefore, the optimal artificial seawater pH value was determined to be 6. As shown in Figure S1D, the DPV peak current increased with the increase in scan rate from 10 to 150 mV/s. A sharp rise occurred from 10 to 100 mV/s, transitioning to gradual growth from 100 to 150 mV/s due to diffusion limitations. So, the optimal scan rate was determined to be 100 mV/s.
3.3.2. Typical Different Pulse Voltammetric Response
DPV experiments were conducted on electrodes immersed in artificial seawater with and without nitrate, and the resulting current responses are shown in Figure 4. The results indicate that the bare gold microwire electrode exhibited no significant reduction peak current response in either nitrate-containing or nitrate-free artificial seawater. In contrast, the gold microwire electrode modified with Cu nanospheres did not show any distinct peak current in nitrate-free artificial seawater, but a sharp reduction peak was observed at around −1.0 V upon the addition of nitrate solution. This observation demonstrates that in acidic media, a bare Au surface alone is incapable of reducing nitrate ions unless copper nanospheres are deposited onto it. This finding suggests that the surface reconstruction of Cu nanomaterials generates highly active sites for nitrate adsorption and reduction, which are crucial for the observed catalytic activity [31]. This suggests that the modification with Cu nanospheres significantly enhanced the electron transfer efficiency of nitrate in seawater, thereby amplifying the current signal.
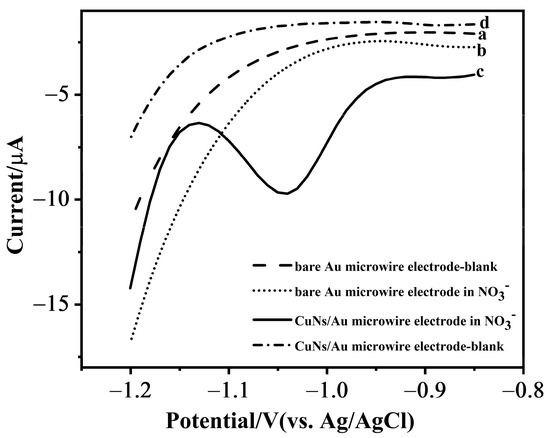
Figure 4.
Different DPV curves of bare Au microwire electrode without nitrate (a), bare Au microwire electrode in 50 μM nitrate (b), CuNs/Au microwire electrode in 50 μM nitrate (c), and CuNs/Au microwire electrode without nitrate (d).
3.3.3. Linearity and Limit of Detection
As shown in Figure 5a, an increase in peak current was seen as the nitrate concentration increased from 1.0 to 2000 μM. A calibration curve of current versus concentration was plotted from the data (Figure 5b). To improve the precision of the method, all measurements were repeated three times, and the standard deviation was calculated, as shown in Figure 5b. The regression equation was determined as Ip (μA) = 0.0322 Cnitrate (μM) + 0.297 with a coefficient R2 = 0.992. The detection limit for nitrate ions was determined to be 0.33 μM (S/N = 3). The limit of detection (LOD) was calculated using the formula LOD = 3σ/S, where σ is the standard deviation of the blank signal (n = 5) and S is the slope of the calibration curve.
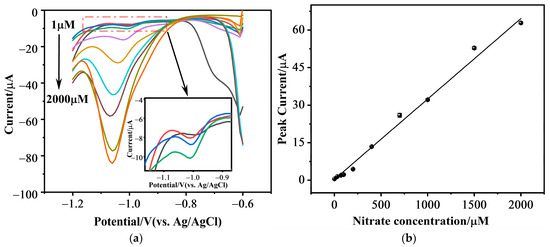
Figure 5.
(a) Differential pulse voltammetry (DPV) responses of the CuNs/Au microwire electrode to increasing concentrations of nitrate (from 1 to 2000 μM) in artificial seawater (salinity 35‰, from bottom to top); (b) the corresponding calibration curve of peak current versus nitrate concentration.
An exhaustive comparison of the sensor response from the previous works is provided in Table 1, taking into consideration different factors for the electrochemical detection of nitrate. The CuNs/Au microwire electrode demonstrated a good limit of detection and wide linear range compared to those in previously reported studies. The low detection limit and wide linear range demonstrated that the system possesses superior performance for detecting nitrate in real coastal seawater.

Table 1.
Comparison of various electrode materials for the detection of nitrate.
3.3.4. Selectivity, Stability, and Reproducibility
Other ions in the complex matrix may interfere with the CuNs/Au microwire electrode. To investigate the effect of possible interfering substances on the determination of nitrate and the selectivity of the system, DPV was performed under optimal experimental conditions in artificial seawater with salinity of 35‰, containing 10-fold higher concentrations of interfering ions (Cu2+, NH4+, Mg2+, Ca2+, H2PO4−, HCO3−, NO2−) compared to nitrate. The variation in the reduction peak current was monitored. As shown in Figure S4, the relative standard deviation (RSD) was less than 5%, indicating that the modified electrode is valuable for determination of nitrate in a real seawater environment. It is worth noting that this study focused on common inorganic ion interferences. The potential interference from dissolved organic matter (Humic Acids, phenolic compounds, etc.) through complexation or fouling, especially in extreme conditions, remained a challenge in the field of continuous environmental monitoring. These interfering materials should be investigated in future studies to fully assess the sensor’s performance in complex natural environments.
To assess the stability of the system, 20 consecutive detections were conducted under optimal conditions using artificial seawater with salinity of 35‰, containing 50 μM NaNO3. The changes in the reduction peak current were observed. As depicted in Figure S2, the RSD for the system in this artificial seawater was 3.05% (n = 20), which is less than 5%, demonstrating good stability. To evaluate the reproducibility of the system (shown in Figure S3), six different CuNs/Au microwire electrodes were used to detect 30 μM NaNO3 in artificial seawater with salinity of 35‰, with three consecutive measurements for each electrode. The variation in the reduction peak current was monitored. As shown in Figure S3, the RSD for the system was 3.27% (n = 6), which is less than 5%, indicating good reproducibility. To further expand the system’s applicability, future studies should comprehensively investigate its performance under a wider range of environmental conditions, such as varying temperature and salinity [38,39].
3.4. Practical Application of Portable Electrochemical System in Coastal Seawater
Figure S5 demonstrated a series of DPV response curves for nitrate in a real seawater sample using the calibration addition method with addition concentrations of 0, 30, 60, and 90 μM. The inset in the lower right corner shows the actual concentration of nitrate in the seawater sample. The nitrate concentration of the real seawater sample was determined by the intersection of the fitted curve of peak current versus concentration with the X-axis. The developed system demonstrates minimal concentration measurement errors and high data accuracy, making it suitable for field determination of nitrate in coastal seawater. The nitrate concentrations obtained by the continuous standard addition method in this system were compared with the results from traditional spectrophotometry for sample detection. The results are shown in Table 2. Analysis revealed that the relative standard error between the results from this system and those from spectrophotometry did not exceed 3%. A paired-sample t test was conducted to compare the accuracy of the DPV and UV–visible spectrophotometry methods for detection of nitrate concentration in seawater. The statistical analysis confirmed that the mean difference between the two methods was not statistically significant (95% CI [−0.50, 0.33], t(5) = −0.514, p = 0.629). These results demonstrate that there is no significant difference in accuracy between DPV and UV–visible spectrophotometry methods. The DPV electrochemical technique can therefore be considered a reliable and accurate alternative for the determination of nitrate in seawater.
Table 2.
Comparison of portable electrochemical system and spectrophotometry for the determination of nitrate in real seawater samples (n = 3).
Figure 6 illustrates a plot of high-frequency sampling for coastal field nitrate monitoring during a day. It can be seen that nitrate concentration at different times of one day shows a correlation with the tidal changes during the day; the nitrate concentration at low tide is higher than that at high tide. The observed inverse correlation between nitrate concentration and tides is a common feature in coastal areas influenced by freshwater input [40]. However, the specific magnitude and temporal pattern of nitrate variation could be site-specific, influenced by local hydrology and nutrient sources [41,42]. The similarity to the trend in detecting high and low tides for nitrate reported by Maria Cuartero et al. suggests that a tidal flushing effect may be responsible for the bell-shaped distribution of nitrate concentration. At low tide, more freshwater inputs carry more nitrate, while at high tide, seawater dilutes these inputs, resulting in lower concentrations [43]. The nitrate concentration exhibited minimal fluctuation across the various time periods, just as shown in Figure 6. This may be related to the change in salinity of seawater and the location of the selected seawater in a coastal area, which cannot fully represent the trend with the tides.
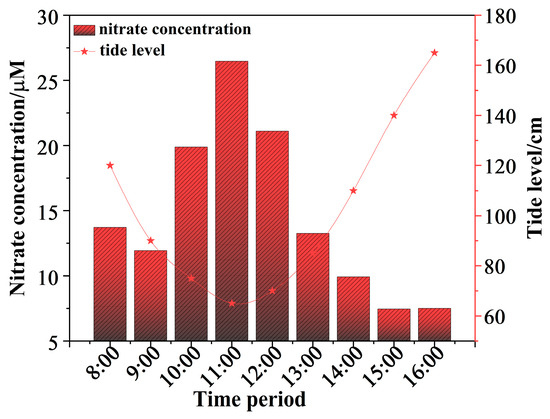
Figure 6.
Nitrate concentration variation at hourly sampling frequency and association with tidal cycles.
Figure 7 presents the results of Pearson correlation analysis conducted to investigate the interrelationships among various physicochemical parameters in coastal seawater. The correlation heatmap reveals several statistically significant relationships. The most prominent finding is an exceptionally strong negative correlation between nitrate concentration and salinity (r = −0.938, p < 0.01), indicating that the distribution of nitrate is strongly influenced by salinity. Additionally, nitrate showed a moderately strong positive correlation with water temperature (r = 0.710, p < 0.05) and a moderately strong negative correlation with dissolved oxygen (r = −0.618, p < 0.05). These correlations may be driven by seasonal nutrient inputs combined with microbial decomposition of organic matter, an oxygen-consuming process that releases bioavailable nutrients. In contrast, weak and non-significant positive correlations are observed between nitrate and conductivity (r = 0.431, p > 0.05), chlorophyll a (r = 0.079, p > 0.05), and pH (r = 0.205, p > 0.05). These findings demonstrate that the portable electrochemical system provides reliable efficiency and precision in accurately detecting nitrate concentrations in coastal seawater during field determination applications.
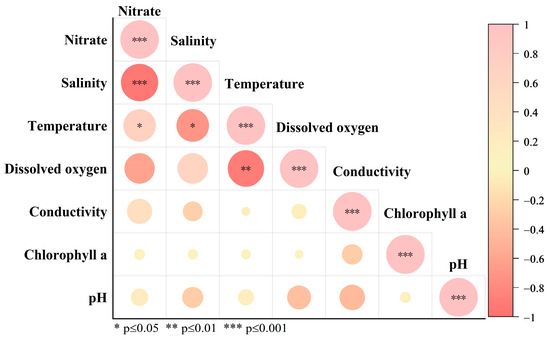
Figure 7.
Pearson correlation heatmap of nitrate concentration and physicochemical parameters in coastal seawater.
4. Conclusions
A portable and low-cost sensor based on a copper-nanosphere-modified gold microwire electrode has been developed for detection of nitrate in coastal seawater. Artificial seawater sample testing results demonstrated that the detection performance of nitrate has been improved significantly. This effect is attributed to the larger surface area and higher electrocatalytic activity of Cu nanospheres, which also resulted in high sensitivity and selectivity towards nitrate in seawater. A low detection limit of 0.33 μM and a wide linear range from 1 to 2000 μM were achieved. Meanwhile, the portable electrochemical system provides reliable and precise detection of nitrate concentrations in real coastal seawater during field determination applications, which is meaningful for marine environment monitoring.
Supplementary Materials
The following supporting information can be downloaded at https://www.mdpi.com/article/10.3390/chemosensors13100366/s1. Figure S1: Effects of different electrodeposition potentials (A) and electrodeposition times (B) on DPV peak current obtained by CuNs/Au microwire electrode in artificial seawater with salinity of 35‰ containing 50 μM NaNO3 solution for Cu nanosphere formation on Au microwire electrode; effect of pH value of seawater (C) and scanning rate (D) on DPV peak current obtained by CuNs/Au microwire electrode in artificial seawater with salinity of 35‰ containing 50 μM NaNO3 solution. Different electrodeposition potentials include −0.3, −0.4, −0.5, and −0.6 V; different electrodeposition times include 5, 10, 20, 30, 40, 50, 60, and 70 s; different seawater pH values include 3, 4, 5, 6, 7, and 8; different scanning rates include 10, 30, 50, 80, 100, 130, and 150 mV/s. The DPV scan rate = IncrE (mV)/pulse period (sec). The error bars represent the standard deviation from three independent measurements (n = 3). Figure S2: Stability tests of continuous detection performed 20 times (n = 20, RSD = 3.06%) in artificial seawater with salinity of 35‰ containing 50 μM nitrate solution. Figure S3: Reproducibility tests for different CuNs/Au microwire electrodes (n = 6, RSD = 3.27%) in artificial seawater with salinity of 35‰ containing 50 μM nitrate solution. Figure S4: Selectivity tests with possible interfering ions added to artificial seawater with salinity of 35‰ containing 30 μM nitrate solution. Figure S5: Different DPV curves obtained using the standard addition method in seawater 6 with 0 μM, 30 μM, 60 μM, and 90 μM nitrate.
Author Contributions
Conceptualization, X.H., Y.C., W.T. and D.P.; methodology, X.H., H.W., Z.X., Z.M., W.T. and D.P.; software, X.H.; validation, X.H. and H.W.; formal analysis, X.H., H.W., T.O. and T.L.; investigation, X.H., H.W., T.O., Z.X., T.L., Y.C. and Z.M.; resources, W.T. and D.P.; data curation, X.H. and W.T.; writing—original draft preparation, X.H.; writing—review and editing, X.H., H.W., W.T. and D.P.; visualization, X.H. and H.W.; supervision, W.T. and D.P.; project administration, D.P.; funding acquisition, W.T. and D.P. All authors have read and agreed to the published version of the manuscript.
Funding
This research was funded by the National Key R&D Program of China (No. 2021YFD190090201), the Quality Engineering Programme (No. 2024-78) of South China Normal University, the Taishan Scholar Project of Shandong Province (No. tsqn202103133), and the Special Fund for the Scholar Program of Yantai City.
Institutional Review Board Statement
Not applicable.
Informed Consent Statement
Not applicable.
Data Availability Statement
The original contributions presented in this study are included in the article/supplementary material. Further inquiries can be directed to the corresponding authors.
Conflicts of Interest
The authors declare no conflicts of interest.
References
- Casciotti, K.L. Nitrogen and oxygen isotopic studies of the marine nitrogen cycle. Annu. Rev. Mar. Sci. 2016, 8, 379–407. [Google Scholar] [CrossRef]
- Akçay, İ.; Özbay, Ö. Assessment of ecological and potential health risk caused by nitrate pollution of the berdan and göksu river basins, Turkey. J. Water Chem. Technol. 2024, 46, 645–651. [Google Scholar] [CrossRef]
- Smith, S.L.; Yamanaka, Y.; Pahlow, M.; Oschlies, A. Optimal uptake kinetics: Physiological acclimation explains the pattern of nitrate uptake by phytoplankton in the ocean. Mar. Ecol.-Prog. Ser. 2009, 384, 1–12. [Google Scholar] [CrossRef]
- Banerjee, P.; Garai, P.; Saha, N.C.; Saha, S.; Sharma, P.; Maiti, A.K. A critical review on the effect of nitrate pollution in aquatic invertebrates and fish. Water Air Soil Pollut. 2023, 234, 333. [Google Scholar] [CrossRef]
- Liefer, J.D.; White, A.E.; Finkel, Z.V.; Irwin, A.J.; Dugenne, M.; Inomura, K.; Ribalet, F.; Armbrust, E.V.; Karl, D.M.; Fyfe, M.H.; et al. Latitudinal patterns in ocean C:N:P reflect phytoplankton acclimation and macromolecular composition. Proc. Natl. Acad. Sci. USA 2024, 121, e2404460121. [Google Scholar] [CrossRef]
- Howarth, R.W.; Chan, F.; Swaney, D.P.; Marino, R.M.; Hayn, M. Role of external inputs of nutrients to aquatic ecosystems in determining prevalence of nitrogen vs. phosphorus limitation of net primary productivity. Biogeochemistry 2021, 154, 293–306. [Google Scholar] [CrossRef]
- Liang, W.; Wang, Y.; Mu, J.L.; Wu, N.; Wang, J.Y.; Liu, S.M. Nutrient changes in the Bohai Sea over the past two decades. Sci. Total Environ. 2023, 903, 166696. [Google Scholar] [CrossRef]
- Valiela, I.; Liu, D.; Lloret, J.; Chenoweth, K.; Hanacek, D. Stable isotopic evidence of nitrogen sources and C4 metabolism driving the world’s largest macroalgal green tides in the Yellow Sea. Sci. Rep. 2018, 8, 17437. [Google Scholar] [CrossRef]
- Levitus, S.; Conkright, M.E.; Reid, J.L.; Najjar, R.G.; Mantyla, A. Distribution of nitrate, phosphate and silicate in the world oceans. Prog. Oceanogr. 1993, 31, 245–273. [Google Scholar] [CrossRef]
- Wu, J.; Wang, Z.; Tian, J.; Li, N.; Wang, K.; Song, L.; Song, G.; Xu, X. Seasonal and long-term variations of nutrients in Liaodong Bay, China: Influencing factors and ecological effects. Mar. Environ. Res. 2024, 202, 106815. [Google Scholar] [CrossRef] [PubMed]
- Tuholske, C.; Halpern, B.S.; Blasco, G.; Villasenor, J.C.; Frazier, M.; Caylor, K. Mapping global inputs and impacts from of human sewage in coastal ecosystems. PLoS ONE 2021, 16, e0258898. [Google Scholar] [CrossRef]
- Xi, Y.; Wang, Q.; Zhu, J.; Yang, M.; Hao, T.; Chen, Y.; Zhang, Q.; He, N.; Yu, G. Atmospheric wet organic nitrogen deposition in China: Insights from the national observation network. Sci. Total Environ. 2023, 898, 165629. [Google Scholar] [CrossRef]
- Huesemann, M.H.; Skillman, A.D.; Crecelius, E.A. The inhibition of marine nitrification by ocean disposal of carbon dioxide. Mar. Pollut. Bull. 2002, 44, 142–148. [Google Scholar] [CrossRef]
- Arai, R.; Sakai, T.; Nishida, Y.; Inada, M. In situ temperature-compensated ultraviolet spectrophotometry to estimate nitrate and chloride concentrations in estuarine seawater with different salinity and composition. J. Environ. Manag. 2023, 344, 118689. [Google Scholar] [CrossRef] [PubMed]
- Niu, W.; Li, H.; Guo, X.; Chen, J.; Shi, X.; Zhu, Y. Field determination of nitrate in seawater using a novel on-line coppered cadmium column: A comparison study with the vanadium reduction method. Front. Mar. Sci. 2023, 10, 1138734. [Google Scholar] [CrossRef]
- Cheong, C.; Suzuki, T.; Miura, T.; Hioki, A. Comparison of continuous flow analysis and ion chromatography for determinations of nitrate, nitrite and phosphate ions in seawater and development of related seawater certified reference materials. Accredit. Qual. Assur. 2024, 29, 243–251. [Google Scholar] [CrossRef]
- Tahoun, I.F.; Rend, E.A.; Shehab, E. Optimization and validation of reversed phase ion-pair liquid chromatographic method for accurate determination of nitrate in high saline seawater. Egypt. J. Chem. 2024, 68, 135–139. [Google Scholar] [CrossRef]
- Lee, J.G.; Hong, J.; Lee, Y.; Lee, W.J.; Jeong, T.Y.; Oh, J.W. Point-of-care-testing NO3–N detection technology with selected transition-metal-based colorimetric sensor arrays. ACS Sens. 2025, 10, 986–994. [Google Scholar] [CrossRef]
- Tu, C.; Kee, L.H. Determination of nitrate in seawater by capillary zone electrophoresis with chloride-induced sample self-stacking. J. Chromatogr. A 2002, 966, 205–212. [Google Scholar] [CrossRef]
- Küster, T.; Bothun, G.D. In situ SERS detection of dissolved nitrate on hydrated gold substrates. Nanoscale Adv. 2021, 3, 4098–4105. [Google Scholar] [CrossRef]
- Chandrasekara, N.P.G.N.; Pashley, R.M. Study of a new process for the efficient regeneration of ion exchange resins. Desalination 2015, 357, 131–139. [Google Scholar] [CrossRef]
- Yuan, W.; Chen, X.; Yu, Z.; Wan, Y.; Lin, J.; Ye, W. Critical review of membrane fouling in reverse osmosis treatment: Characterizations, models, mechanisms, and controls. Sep. Purif. Technol. 2025, 363, 132119. [Google Scholar] [CrossRef]
- Wei, H.; Pan, D.; Han, H. Electrochemical monitoring of marine nutrients: From principle to application. Trac-Trends Anal. Chem. 2021, 138, 116242. [Google Scholar] [CrossRef]
- Paliwal, A.; Bandas, C.D.; Thornburg, E.S.; Haasch, R.T.; Gewirth, A.A. Enhanced nitrate reduction activity from Cu-alloy electrodes in an alkaline electrolyte. ACS Catal. 2023, 13, 6754–6762. [Google Scholar] [CrossRef]
- Li, D.; Xu, S.; Jin, H.; Wang, J.; Yan, F. Copper nanoparticles confined in a silica nanochannel film for the electrochemical detection of nitrate ions in water samples. Molecules 2023, 28, 7515. [Google Scholar] [CrossRef]
- Wu, Y.; Gao, M.; Li, S.; Ren, Y.; Qin, G. Copper wires with seamless 1D nanostructures: Preparation and electrochemical sensing performance. Mater. Lett. 2018, 211, 247–249. [Google Scholar] [CrossRef]
- Brug, G.J.; van den Eeden, A.L.G.; Sluyters-Rehbach, M.; Sluyters, J.H. The Analysis of electrode impedances complicated by the presence of a constant phase element. J. Electroanal. Chem. 1984, 176, 275–295. [Google Scholar] [CrossRef]
- Randles, J.E.B. Kinetics of Rapid Electrode Reactions. Discuss. Faraday Soc. 1947, 1, 11–19. [Google Scholar] [CrossRef]
- Outaleb, H.; Kouzbour, S.; Audonnet, F.; Vial, C.; Gourich, B. Electrocatalytic nitrate reduction for brackish groundwater treatment: From engineering aspects to implementation. Appl. Sci. 2024, 14, 8986. [Google Scholar] [CrossRef]
- Pushpanjali, P.A.; Manjunatha, J.G.; Hareesha, N.; Souza, E.S.D.; Charithra, M.M.; Prinith, N.S. Voltammetric analysis of antihistamine drug cetirizine and paracetamol at poly(L-Leucine) layered carbon nanotube paste electrode. Surf. Interface 2021, 24, 101154. [Google Scholar] [CrossRef]
- Wu, K.; Sun, C.; Wang, Z.; Song, Q.; Bai, X.; Yu, X.; Li, Q.; Wang, Z.; Zhang, H.; Tong, X.; et al. Surface reconstruction on uniform Cu nanodisks boosted electrochemical nitrate reduction to ammonia. ACS Mater. Lett. 2022, 4, 650–656. [Google Scholar] [CrossRef]
- Amini, N.; Maleki, A.; Maleki, P. Electrochemical detection of nitrate ions via reduction of NO2− and oxidation of NO reactions based on Cu@TiO2 coreshell/nafion/polyalizarin immobilized electrode. Mater. Chem. Phys. 2021, 264, 124384. [Google Scholar] [CrossRef]
- Patella, B.; Russo, R.R.; O’Riordan, A.; Aiello, G.; Sunseri, C.; Inguanta, R. Copper nanowire array as highly selective electrochemical sensor of nitrate ions in water. Talanta 2021, 221, 121643. [Google Scholar] [CrossRef] [PubMed]
- Abed, S.; Gibilaro, M.; Chamelot, P.; David, A.; Barus, C.; Massot, L. The optimization of bimetallic electrodes’ sensitivity using copper nucleation on metallic substrates to detect nitrates in seawater. J. Electroanal. Chem. 2022, 918, 116497. [Google Scholar] [CrossRef]
- Abir, A.Y.; Uddin, S.M.N.; Hasan, M.; Aziz, M.A.; Shah, S.; Ahmed, J.; Hasnat, M.A. Cu-electrodeposited gold electrode for the sensitive electrokinetic investigations of nitrate reduction and detection of the nitrate ion in acidic medium. Results Chem. 2023, 5, 100702. [Google Scholar] [CrossRef]
- Talbi, M.; Anurag, A.; Tegenkamp, C.; Ali, M.B.; Kanoun, O. Enhanced electrochemical detection of nitrite and nitrate in water using Chitosan-Copper phthalocyanine nanocomposite. Measurement 2024, 238, 115395. [Google Scholar] [CrossRef]
- Wei, S.; Xiao, D.; Bian, C.; Li, Y. Phosphate and nitrate electrochemical sensor based on a bifunctional boron-doped diamond electrode. ACS Omega 2024, 9, 20293–20303. [Google Scholar] [CrossRef]
- Zhu, X.; Xu, J.; Zhang, N.; Wu, C. Nitrate measurement in seawater based on environmental correction algorithm. IEEE Sens. J. 2023, 23, 15803–15812. [Google Scholar] [CrossRef]
- Prabhu, K.; Malode, S.J.; Shetti, N.P. Highly sensitive electrochemical sensor for the detection and quantification of Linuron based on silica gel modified carbon paste electrode. Environ. Technol. Innov. 2021, 23, 101687. [Google Scholar] [CrossRef]
- Zheng, Y.L.; Hou, L.J.; Liu, M.; Liu, Z.F.; Li, X.F.; Lin, X.B.; Yin, G.Y.; Gao, J.; Yu, C.D.; Wang, R.; et al. Tidal pumping facilitates dissimilatory nitrate reduction in intertidal marshes. Sci. Rep. 2016, 6, 21338. [Google Scholar] [CrossRef]
- Wallace, C.D.; Sawyer, A.H.; Barnes, R.T.; Soltanian, M.R.; Gabor, R.S.; Wilkins, M.J.; Moore, M.T. A model analysis of the tidal engine that drives nitrogen cycling in coastal riparian aquifers. Water Resour. Res. 2020, 56, e2019WR025662. [Google Scholar] [CrossRef]
- Sendrowski, A.; Castañeda-Moya, E.; Twilley, R.; Passalacqua, P. Biogeochemical and hydrological variables synergistically influence nitrate variability in coastal deltaic wetlands. J. Geophys. Res. Biogeosciences 2021, 126, e2020JG005737. [Google Scholar] [CrossRef]
- Cuartero, M.; Crespo, G.; Cherubini, T.; Pankratova, N.; Confalonieri, F.; Massa, F.; Tercier-Waeber, M.L.; Abdou, M.; Schäfer, J.; Bakker, E. In situ detection of macronutrients and chloride in seawater by submersible electrochemical sensors. Anal. Chem. 2018, 90, 4702–4710. [Google Scholar] [CrossRef] [PubMed]


Disclaimer/Publisher’s Note: The statements, opinions and data contained in all publications are solely those of the individual author(s) and contributor(s) and not of MDPI and/or the editor(s). MDPI and/or the editor(s) disclaim responsibility for any injury to people or property resulting from any ideas, methods, instructions or products referred to in the content. |
© 2025 by the authors. Licensee MDPI, Basel, Switzerland. This article is an open access article distributed under the terms and conditions of the Creative Commons Attribution (CC BY) license (https://creativecommons.org/licenses/by/4.0/).