Article

Nanostructured CeO2-C Derived from Ce-BDC Precursors for Room-Temperature Ammonia Sensing

1
College of Materials Science and Engineering, Chongqing University, Chongqing 400044, China
2
State Key Laboratory of Multiphase Flow in Power Engineering, School of Energy and Power Engineering, Xi’an Jiaotong University, Xi’an 710049, China
3
School of Chemical Engineering and Technology, Xi’an Jiaotong University, Xi’an 710049, China
*
Author to whom correspondence should be addressed.
Chemosensors 2025, 13(10), 362; https://doi.org/10.3390/chemosensors13100362
Submission received: 1 September 2025 / Revised: 22 September 2025 / Accepted: 29 September 2025 / Published: 3 October 2025
(This article belongs to the Special Issue Functional Nanomaterial-Based Gas Sensors)

Abstract

The prompt and reliable detection of NH3 leakage at room temperature (RT) is considered important for safety assurance and sustainable production. Although chemiresistive NH3 sensors feature low cost and structural simplicity, their practical application is hindered by high operating temperatures and inadequate selectivity. Metal–organic frameworks (MOFs) and their derivatives offer a promising approach to address these limitations. In this work, Ce-BDC precursors with tunable particle sizes and crystallinity were synthesized by adjusting the raw material concentration. Controlled pyrolysis yielded a series of CeO2-C-X (X = 0.5, 1, 1.5, 2) materials with nanosized particles. Among them, the CeO2-C-1 sensor delivered a high response of 82% toward NH3 under 40% relative humidity at RT. Moreover, it possessed excellent selectivity, repeatability, and rapid response-recovery behavior compared with the other samples. CeO2-C-1 also remained stable under varying oxygen and humidity conditions, demonstrating high applicability. The superior sensing properties may be attributed to its high specific surface area and optimized mesoporous structure, which facilitated efficient gas adsorption and reaction. These findings demonstrated that precise control of MOF precursors and the structure in CeO2 nanomaterials was critical for achieving high-performance gas sensing and established Ce-MOF-derived CeO2 as a promising sensing material for NH3 detection at RT.

1. Introduction

In recent years, gas-sensing materials and devices have attracted extensive attention in various fields such as environmental monitoring, industrial process control, and health management [1,2]. Ammonia (NH3) is commonly employed in NH3-selective catalytic reduction (NH3-SCR) systems for the removal of NOx from sintering flue gas and automobile exhaust [3]. However, excessive dosing can result in the release of unreacted NH3 into the atmosphere [4]. Meanwhile, with NH3 emerging as an efficient hydrogen carrier in the context of clean energy technologies, the risk of leakage has become a growing concern due to its high volatility [5,6]. NH3 can participate in the formation of PM2.5 by reacting with atmospheric SO2 and NOx to generate secondary inorganic aerosols [7]. Additionally, its strong irritant properties pose serious risks to the human respiratory system and eyes, and high concentrations (>50 ppm) can lead to irreversible damage [8,9]. Therefore, the prompt and accurate detection of its leakage is of paramount importance for both safety assurance and environmental sustainability.
Among various types of NH3 gas sensors, chemiresistive sensors have attracted extensive attention due to their simple architecture, low cost, ease of miniaturization, and compatibility with online monitoring [10,11]. However, the high operating temperature and low selectivity of conventional NH3 chemiresistive sensors have limited their widespread application [12]. Metal–organic frameworks (MOFs) have been regarded as promising materials for gas sensing applications due to their tunable porosity, high surface area, and structural diversity [13]. Most MOFs suffer from poor intrinsic conductivity due to the insulating nature of organic linkers and the lack of continuous electron pathways except for two-dimensional MOFs, limiting their direct use in chemiresistive sensing [14,15]. Pyrolyzing MOFs into metal oxide semiconductors (MOS) effectively overcomes these issues by enhancing conductivity, preserving high surface area and porosity, inheriting some intrinsic physical properties of the parent MOFs, and improving defect sites in the resulting metal oxides [16,17]. Song et al. [18] prepared ZIF-67-derived Co3O4 with a hollow structure, which exhibited abundant surface defects, leading to enhanced oxygen vacancy formation and improved NH3 sensing performance. Ren et al. [19] prepared porous ZnO derived from ZIF-8, and the optimal sample (ZIF-8-500) exhibited excellent NO2 sensing performance attributed to its mesoporous structure, high surface area, and abundant oxygen vacancies. MOF-derived materials have exhibited tremendous potential in sensing applications [20,21]. To the best of our knowledge, few studies have yet reported the use of Ce-MOF-derived CeO2 for room-temperature gas sensing.
Herein, nano-MOF materials of Ce-BDC were successfully synthesized by adjusting the concentrations of Ce4+ and the organic ligand of BDC (terephthalic acid). A series of Ce-BDC-X (X = 0.5, 1, 1.5, 2) derivatives were subsequently obtained via controlled pyrolysis at appropriate temperatures and employed for NH3 sensing at room temperature (RT). Notably, after thermal treatment, Ce-BDC precursors with varying average particle sizes and crystallinities yielded CeO2 nanoparticles with residual carbon from organic linkers, which were labeled as CeO2-C-X series. Among them, Ce-BDC-1 and its derivative CeO2-C-1 maintained the closest particle size before and after pyrolysis and exhibited the best NH3 gas-sensing performance. Furthermore, the selectivity and repeatability of the CeO2-C-1 based sensing device were comprehensively evaluated. Under 40% relative humidity at RT, it demonstrated a high response of 82% toward NH3 than others. In addition, CeO2-C-1 sensor showed excellent response-recovery behavior (22 s/66 s) and selectivity at RT. The effects of oxygen and humidity on gas-sensing performance were investigated, indicating that the sensor maintained a relatively stable response even under increased humidity and oxygen-free conditions, thereby enhancing its applicability. Finally, the NH3 sensing mechanism of CeO2-C-1 at RT was proposed.

2. Experiment Section

2.1. Fabrication of CeO2-C-X Gas Sensing Materials

Firstly, 0.2832 g (0.5 mmol) ammonium cerium nitrate (CAN, (NH4)3Ce(NO3)6) was dissolved in 8 mL of deionized water, while 0.0839 g terephthalic acid (H2BDC, C8H6O4) was dissolved in 24 mL of N,N-dimethylformamide (DMF). The molar ratio of CAN to H2BDC was about 1. After complete dissolution under magnetic stirring, the CAN solution was slowly added to the H2BDC solution and stirred for another 10 min to form a homogeneous mixture. The solution was then transferred to a Teflon-lined autoclave (XIUILAB X-SF-G100, Shanghai, China) and heated at 100 °C for 1 h. After natural cooling, the product was collected by centrifugation and washed with DMF and deionized water. The resulting precipitate was dried at 60 °C for approximately 12 h to obtain Ce-BDC-0.5. Similarly, the other Ce-BDC-X (X = 1, 1.5, 2) samples were synthesized by increasing the CAN and H2BDC amounts (CAN amounts: 1, 1.5 and 2 mmol) proportionally. CeO2-C-X (X = 0.5, 1, 1.5, 2) was further prepared by calcining at 500 °C for 2 h with a heating rate of 5 °C/min.

2.2. Characterization and Gas Sensing Properties

The morphology and structure of the Ce-BDC precursors and CeO2-C-X gas sensing materials were characterized by SEM, TEM, TG, XRD, XPS, Raman spectroscopy, and N2 adsorption–desorption measurements. The gas sensing tests were conducted using a setup with continuous gas flow, as shown in Figure S1. Moreover, the photograph of the sensor is shown in Figure S2. Detailed characterization information, sensor fabrication procedures, and gas-sensing test protocols can be found in the Supplementary Materials.

3. Results and Discussion

3.1. Morphology Characterization and Physical Properties

CeO2-C-X semiconductor series were synthesized by the rapid solvothermal method and calcination of Ce-BDC-X precursors, and the schematic illustration of synthesis is shown in Figure 1a. In addition, according to the TG analysis, calcination at 500 °C could basically stabilize the mass of the derived CeO2-C-1 (Figure S3). As the concentration of CAN and H2BDC increased, the color of Ce-BDC-X gradually changed from yellow to white. The morphology of the CeO2-C-X (X = 0.5, 1, 1.5, 2) was observed by SEM and presented in Figure 1(b1–e2). It was obvious that with the increasing reactant concentrations, the CeO2-C-X nanoparticles became more uniformly dispersed. In CeO2-C derived from Ce-BDC with low raw material concentration, more pronounced aggregation of particles was observed.
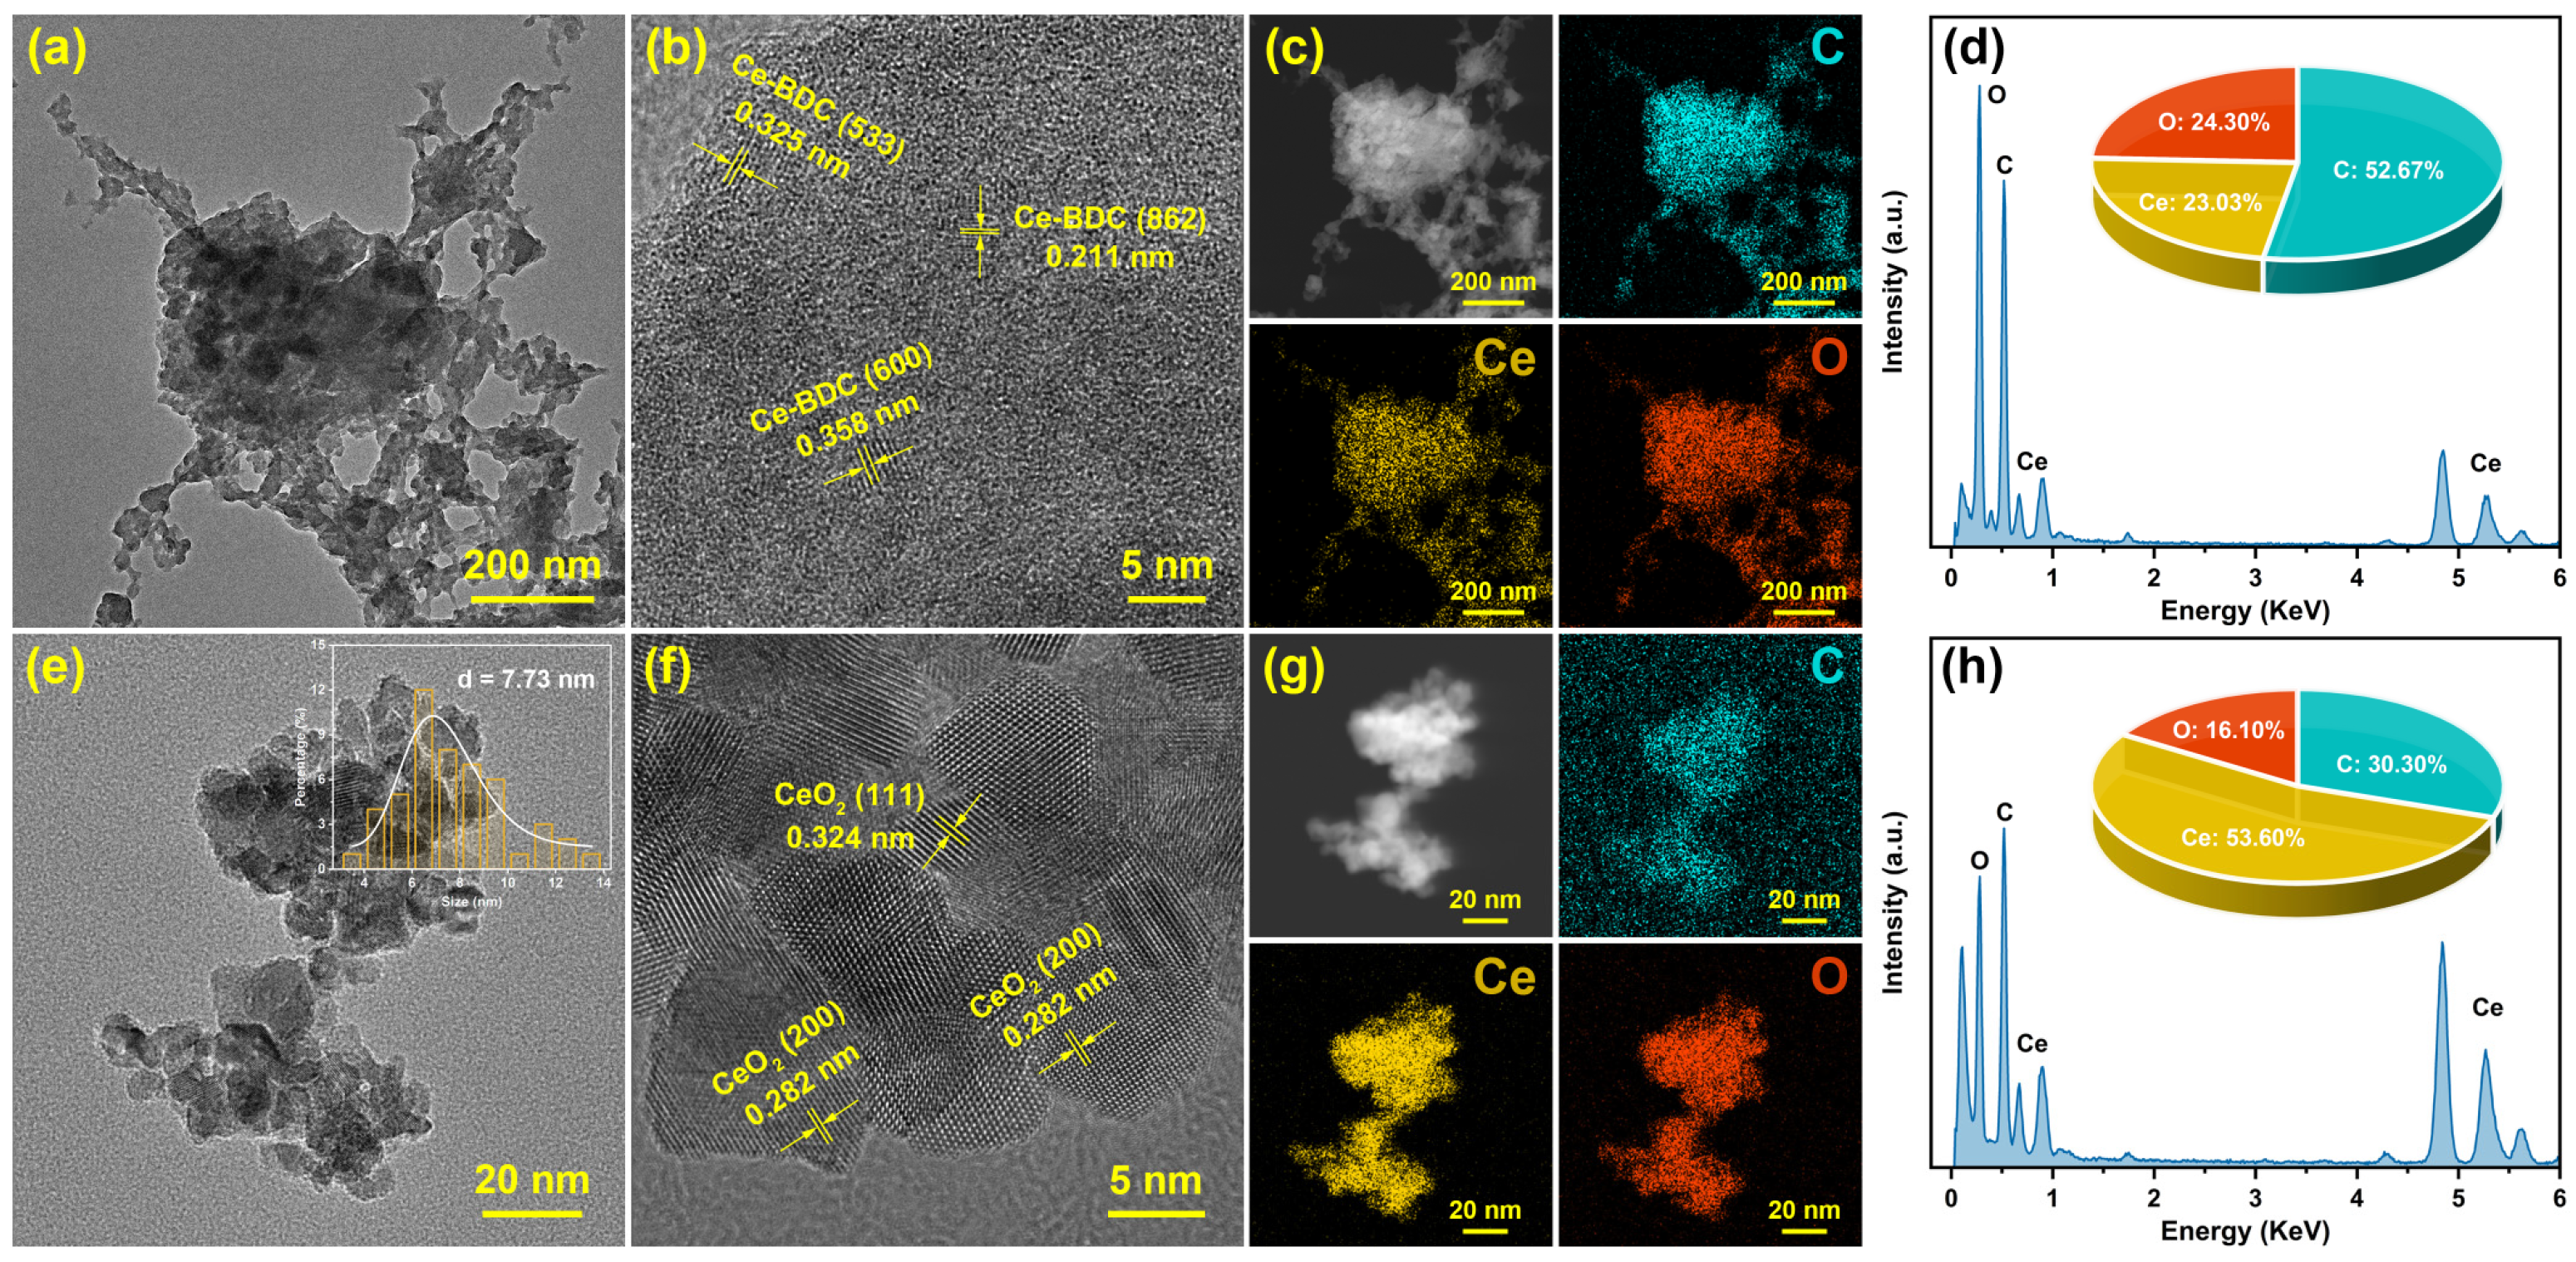
Further microstructural characterization of Ce-BDC-1 and its derived CeO2-C-1 was carried out using TEM. As shown in Figure 2a,b, Ce-BDC-1 exhibited only a few lattice fringes corresponding to the (533), (862), and (600) planes of previously reported Ce-BDC, owing to its small particle size and low crystallinity [22,23]. Upon further examination of CeO2-C-1 derived from Ce-BDC-1, as presented in Figure 2e, well-defined particles with an average size of approximately 7.73 nm were observed. Moreover, distinct lattice fringes corresponding mainly to the (111) and (200) planes of CeO2 were evident. EDS was employed to analyze the presence of Ce, O, and C elements in both Ce-BDC-1 and CeO2-C-1. As shown in Figure 2c,d,g,h, the content of C element was significantly reduced after calcination.
The phase structure and pore characteristics of the Ce-BDC precursor and the derived CeO2-C were further characterized. As depicted in Figure 3a, the Ce-BDC-X (X = 0.5, 1, 1.5, 2) samples exhibited gradually enhanced diffraction peak intensities with the increased raw material concentration. By comparing the positions of the characteristic peaks, the formation of Ce-BDC materials could be further confirmed, with diffraction peaks located at 7.1° of (111) plane, 8.2° of (200) plane, and 24.9° of (600) plane, which match the reported structure of Ce6O4(OH)4(BDC)6 (CCDC-1036904) [24]. Ce-BDC consists of hexanuclear Ce6O4(OH)4 clusters coordinated by twelve BDC linkers, forming a three-dimensional framework with fcu topology [25]. This structure was isostructural to the well-known Zr-based UiO-66 (University of Oslo-66), where Ce4+ replaces Zr4+ in the metal cluster [26]. The average crystallite size of the precursors was calculated using the Scherrer equation, revealing an increase from 2.50 to 19.21 nm as the reactants concentration increased, indicating that the crystallite size of Ce-BDC could be effectively tuned by adjusting the precursor concentration [27]. After calcination, CeO2-C-X materials were obtained, and their XRD patterns are shown in Figure 3b. All Ce-BDC derived CeO2 samples exhibited characteristic diffraction peaks corresponding to fluorite-structured CeO2 (PDF 01-81-0792) [28]. The peaks at 28.5°, 33.1°, 47.5°, 56.3°, 59.1°, 69.4°, 76.7°, 79.1°, and 88.4° could be indexed to the (111), (200), (220), (311), (222), (400), (331), (420), and (422) crystal planes of CeO2 (PDF 01-81-0792), respectively [29]. No additional peaks related to impurities were detected, suggesting that the sample was a single-phase CeO2 [30]. Similarly, the crystallite sizes of CeO2-C derived from Ce-BDC were estimated. The results showed nearly uniform crystallite sizes with only a slight increasing trend, ranging from 7.37 to 8.64 nm. The measured 7.96 nm particle size of CeO2-C-1 closely corresponds to the average particle size observed by TEM. It could be inferred that after calcination, the CeO2 derived from Ce-BDC underwent structural expansion or collapse, ultimately stabilizing at a crystallite size of around 7–8 nm. Moreover, it could be observed that among the samples, Ce-BDC-1 and its derived CeO2-C-1 exhibited the smallest change in crystallite size (from 8.67 to 7.96 nm), which might be beneficial for CeO2 to maintain superior physical properties.
Therefore, the N2 adsorption–desorption characteristics of the Ce-BDC derived CeO2 samples were investigated. As shown in Figure 3c, all CeO2-C-X samples displayed a certain microporosity but were mainly dominated by mesopores. Interestingly, hysteresis loops began to appear at lower relative pressures for CeO2-C-0.5 and CeO2-C-1, while CeO2-C-1.5 began to form them at p/p0 = 0.64, and CeO2-C-2 only began to form them at a higher p/p0 of 0.87. This indicated the presence of mesopores distributed across different pressure ranges in the various CeO2-C-X samples. Moreover, the differences in mesopore distribution could be observed from the pore size distribution calculated by the BJH method, which was depicted in Table S1 and highlighted section of Figure 3d. The pore diameters of CeO2-C-0.5 and CeO2-C-1 were significantly smaller than those of CeO2-C-1.5 and CeO2-C-2, which may be attributed to the pronounced structural collapse induced by the larger particle sizes of CeO2-C-1.5 and CeO2-C-2. In addition, the specific surface area of CeO2-C-X follows the order: CeO2-C-1 > CeO2-C-1.5 > CeO2-C-2 > CeO2-C-0.5, which is favorable for efficient gas adsorption during subsequent NH3 sensing.
To further investigate the structural characteristics of the derived CeO2, Raman spectroscopy was employed, and the results are displayed in Figure 3e,f. The strong vibrational peak at 463 cm−1 was attributed to the symmetric stretching vibration (F2g mode) of Ce-O coordination, which dominated in all CeO2-C-X samples [31]. The intensity of the F2g peak clearly decreased with the increase in X in CeO2-C-X, especially for CeO2-C-1.5 and CeO2-C-2, which had larger precursor grain sizes. It could be inferred that the significant structural collapse in CeO2-C-1.5 and CeO2-C-2 led to reduced symmetry of the Ce-O lattice, resulting in more disordered lattice vibrations. In addition, weak and broad bands observed at 595 cm−1 and 1174 cm−1 could be assigned to the Frenkel defect-induced mode (D band) and the second-order longitudinal optical mode (2LO band), respectively [32]. These bands were considered to be related to the concentration of oxygen vacancies in CeO2, among which CeO2-C-1 likely contained the highest amount of oxygen vacancies. By calculating the ratio of the D + 2LO bands to the F2g peak, the effect of oxygen vacancies in CeO2 can be estimated. Among the samples, CeO2-C-1 exhibited the highest ratio of 0.0515, which was significantly greater than other Ce-BDC-derived CeO2-C. Due to differences in precursor particle size, Ce-BDC derived CeO2 exhibited significant structural variations. Among them, CeO2-C-1 demonstrated the best combination of properties, including the highest specific surface area, the smallest mesopore distribution, and the greatest effect of oxygen vacancies, while maintaining the CeO2 crystal structure. This could be attributed to the minimal particle size change before and after derivation, which helped preserve the morphology of its physical structure.

3.2. XPS Analysis

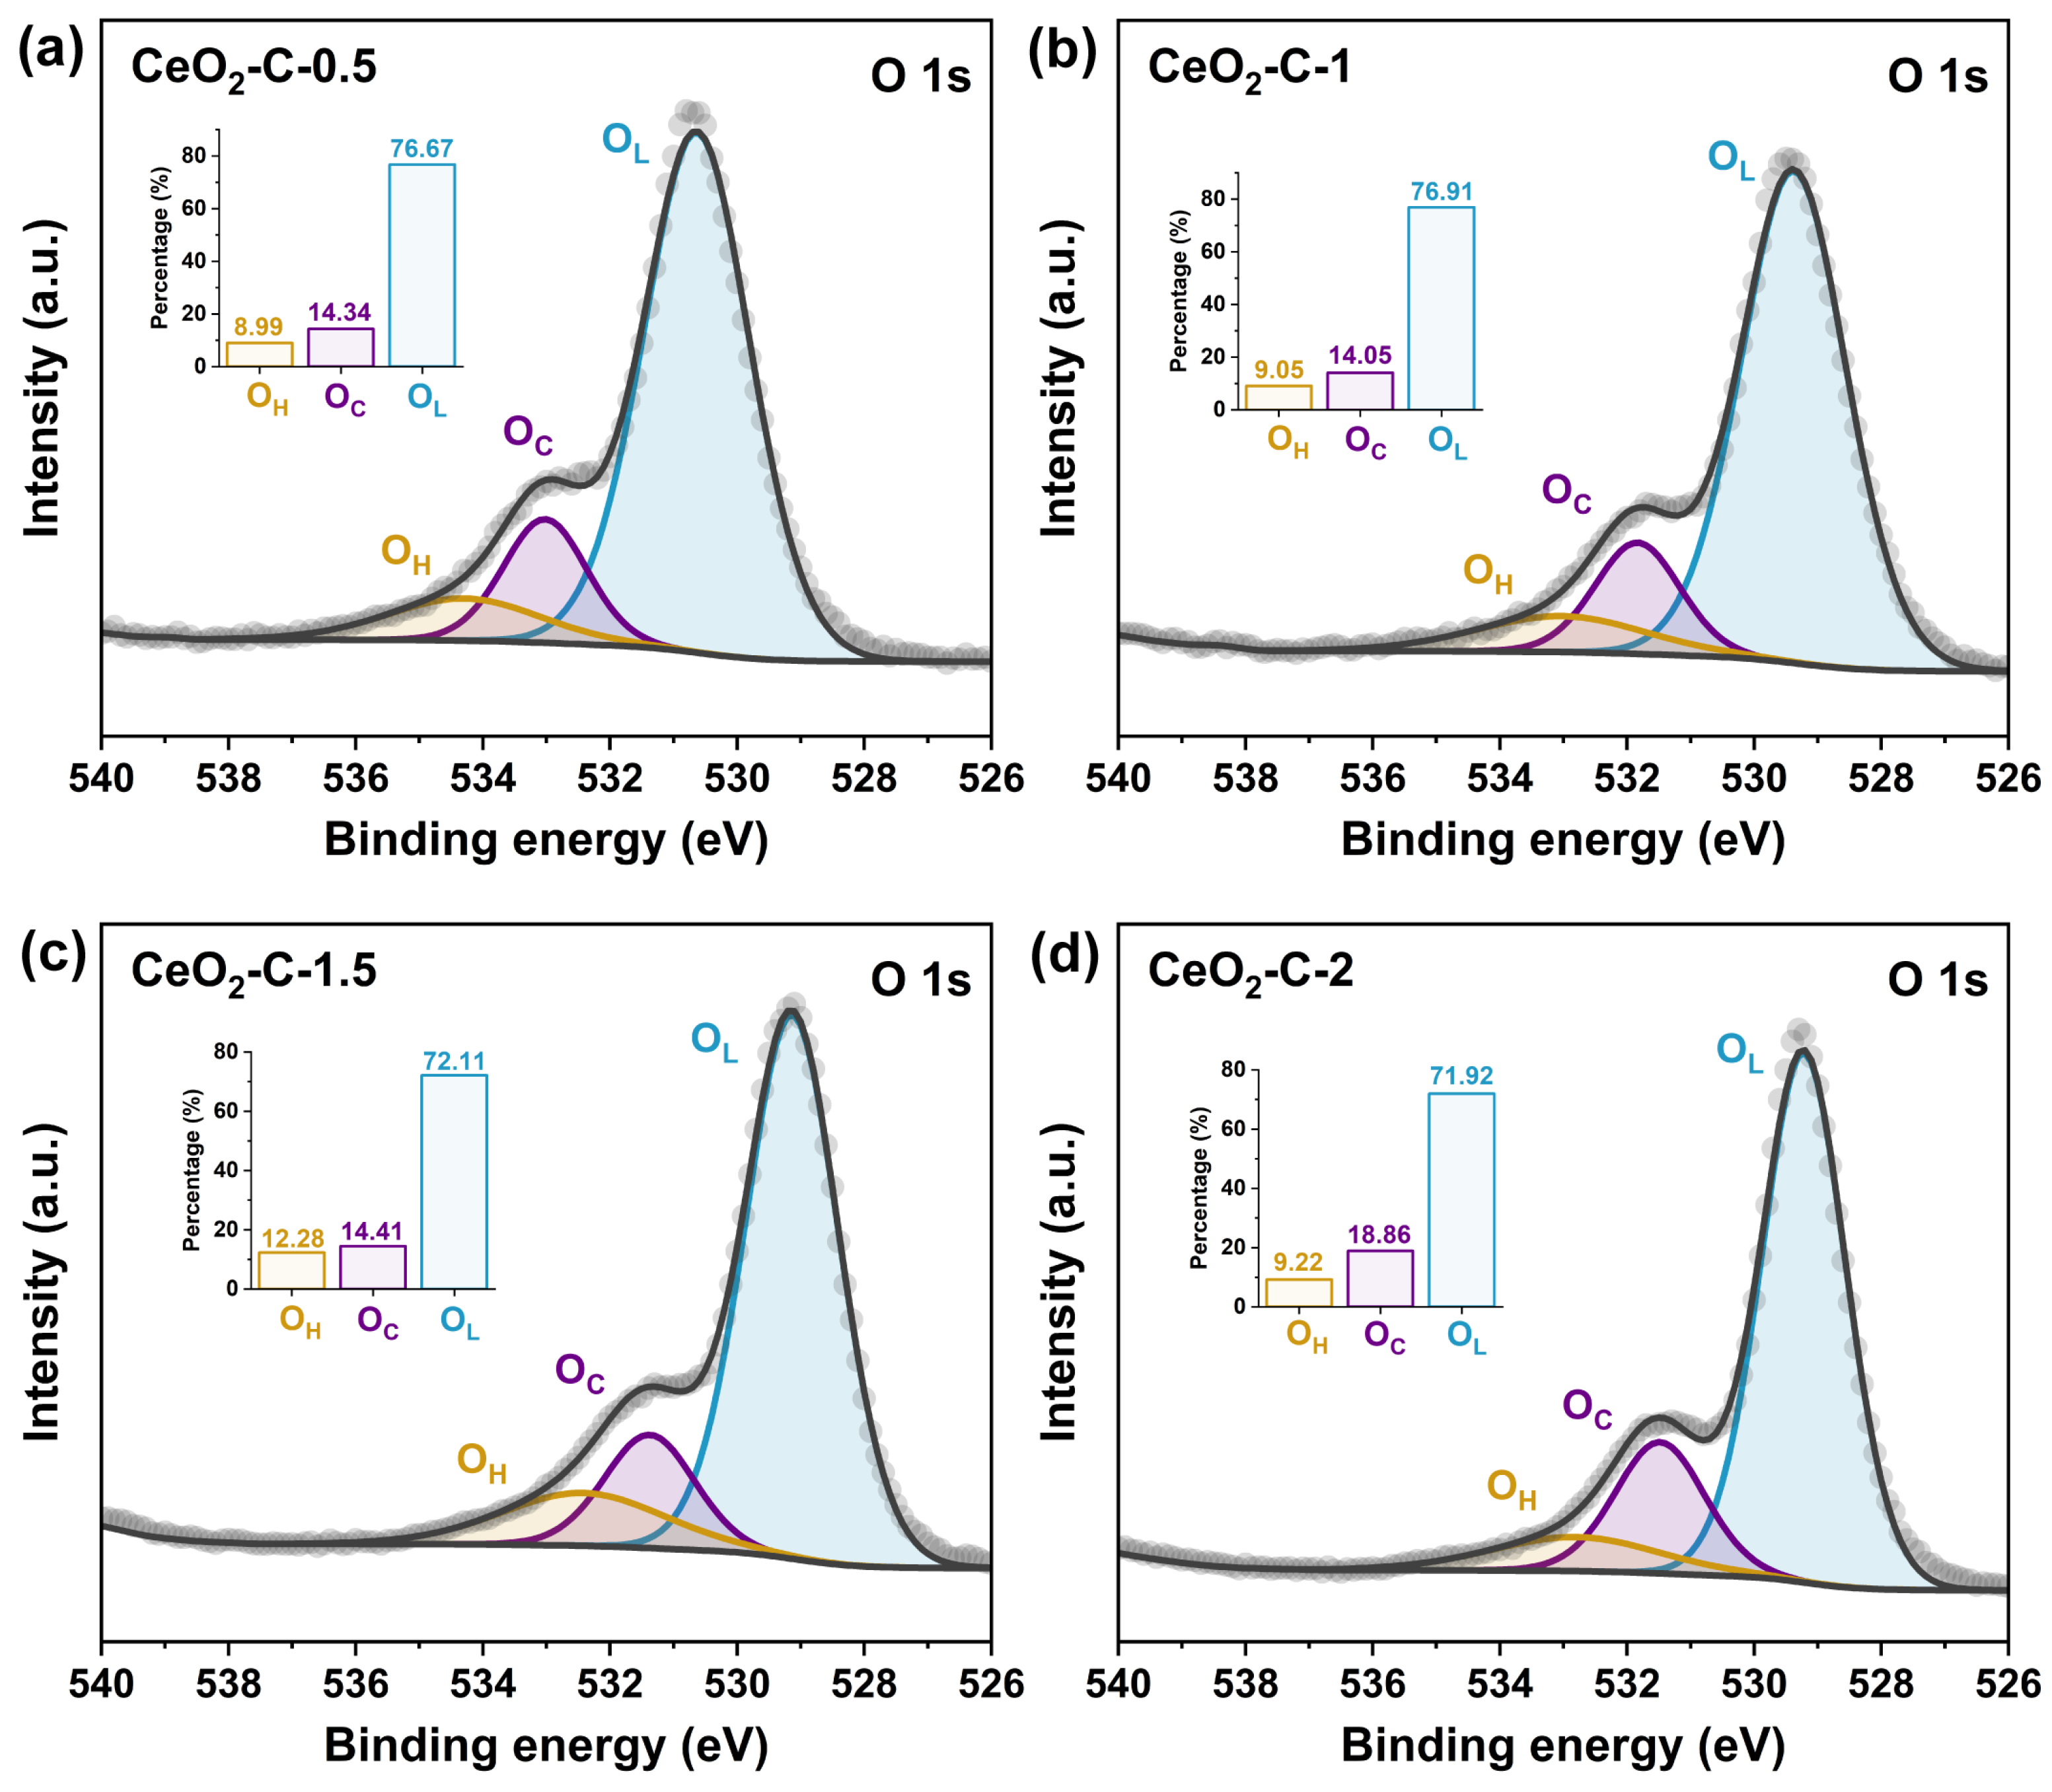
XPS was used to analyze the surface elements and chemical states of CeO2-C-X gas sensing materials. As shown in Figure S4a, the survey spectra of CeO2-C-X (X = 0.5, 1, 1.5, 2) displayed characteristic peaks of Ce 3d and O 1s. The Ce/O atomic ratios calculated from peak intensities are shown in Figure S4b. It was observed that CeO2-C-0.5 and CeO2-C-1 exhibited Ce/O ratios close to 2, while those of CeO2-C-1.5 and CeO2-C-2 were below 1, suggesting the formation of unstable CeO2 structures with more lattice defects. Further deconvolution of the Ce 3d spectra, as shown in Figure S4c, revealed that three pairs of peaks (V and U, V″ and U″, V‴ and U‴) corresponded to tetravalent Ce4+ (CeO2), while two pairs (V0 and U0, V′ and U′) were attributed to trivalent Ce3+ (Ce2O3) [33]. The calculated Ce4+ contents were: CeO2-C-1 (76.49%) > CeO2-C-0.5 (76.04%) > CeO2-C-1.5 (74.80%) > CeO2-C-2 (73.29%). The significantly lower Ce4+ content in CeO2-C-1.5 and CeO2-C-2 compared to CeO2-C-0.5 and CeO2-C-1 indicated their inferior redox performance [34]. Further deconvolution of the O 1s spectra was performed to identify the different oxygen species, as shown in Figure 4. The peak around 532 eV was attributed to surface hydroxyl groups (OH), the peak near 531 eV corresponded to surface adsorbed oxygen (OC), and the peak around 529 eV was assigned to lattice oxygen (OL) [35]. The OL proportion in CeO2-C-1.5 (Figure 4c) and CeO2-C-2 (Figure 4d) was significantly lower than that in CeO2-C-0.5 (Figure 4a) and CeO2-C-1 (Figure 4b), indicating that the excessive structural defects caused by the calcination of large-particle Ce-BDC led to a decline in potential gas sensing performance. Notably, XPS analysis revealed that CeO2-C-1.5 and CeO2-C-2 possessed excessive surface defect concentrations, which were actually unfavorable for enhancing NH3 sensing performance. In contrast, although CeO2-C-1 at Figure 4b exhibited the lowest adsorbed oxygen content (14.05%) and defect concentrations, Raman analysis still indicated a relatively pronounced influence of oxygen vacancies, and its proper surface Ce/O ratio with a moderate level of oxygen defects was more conducive to NH3 adsorption and conversion.

3.3. Gas Sensing Properties

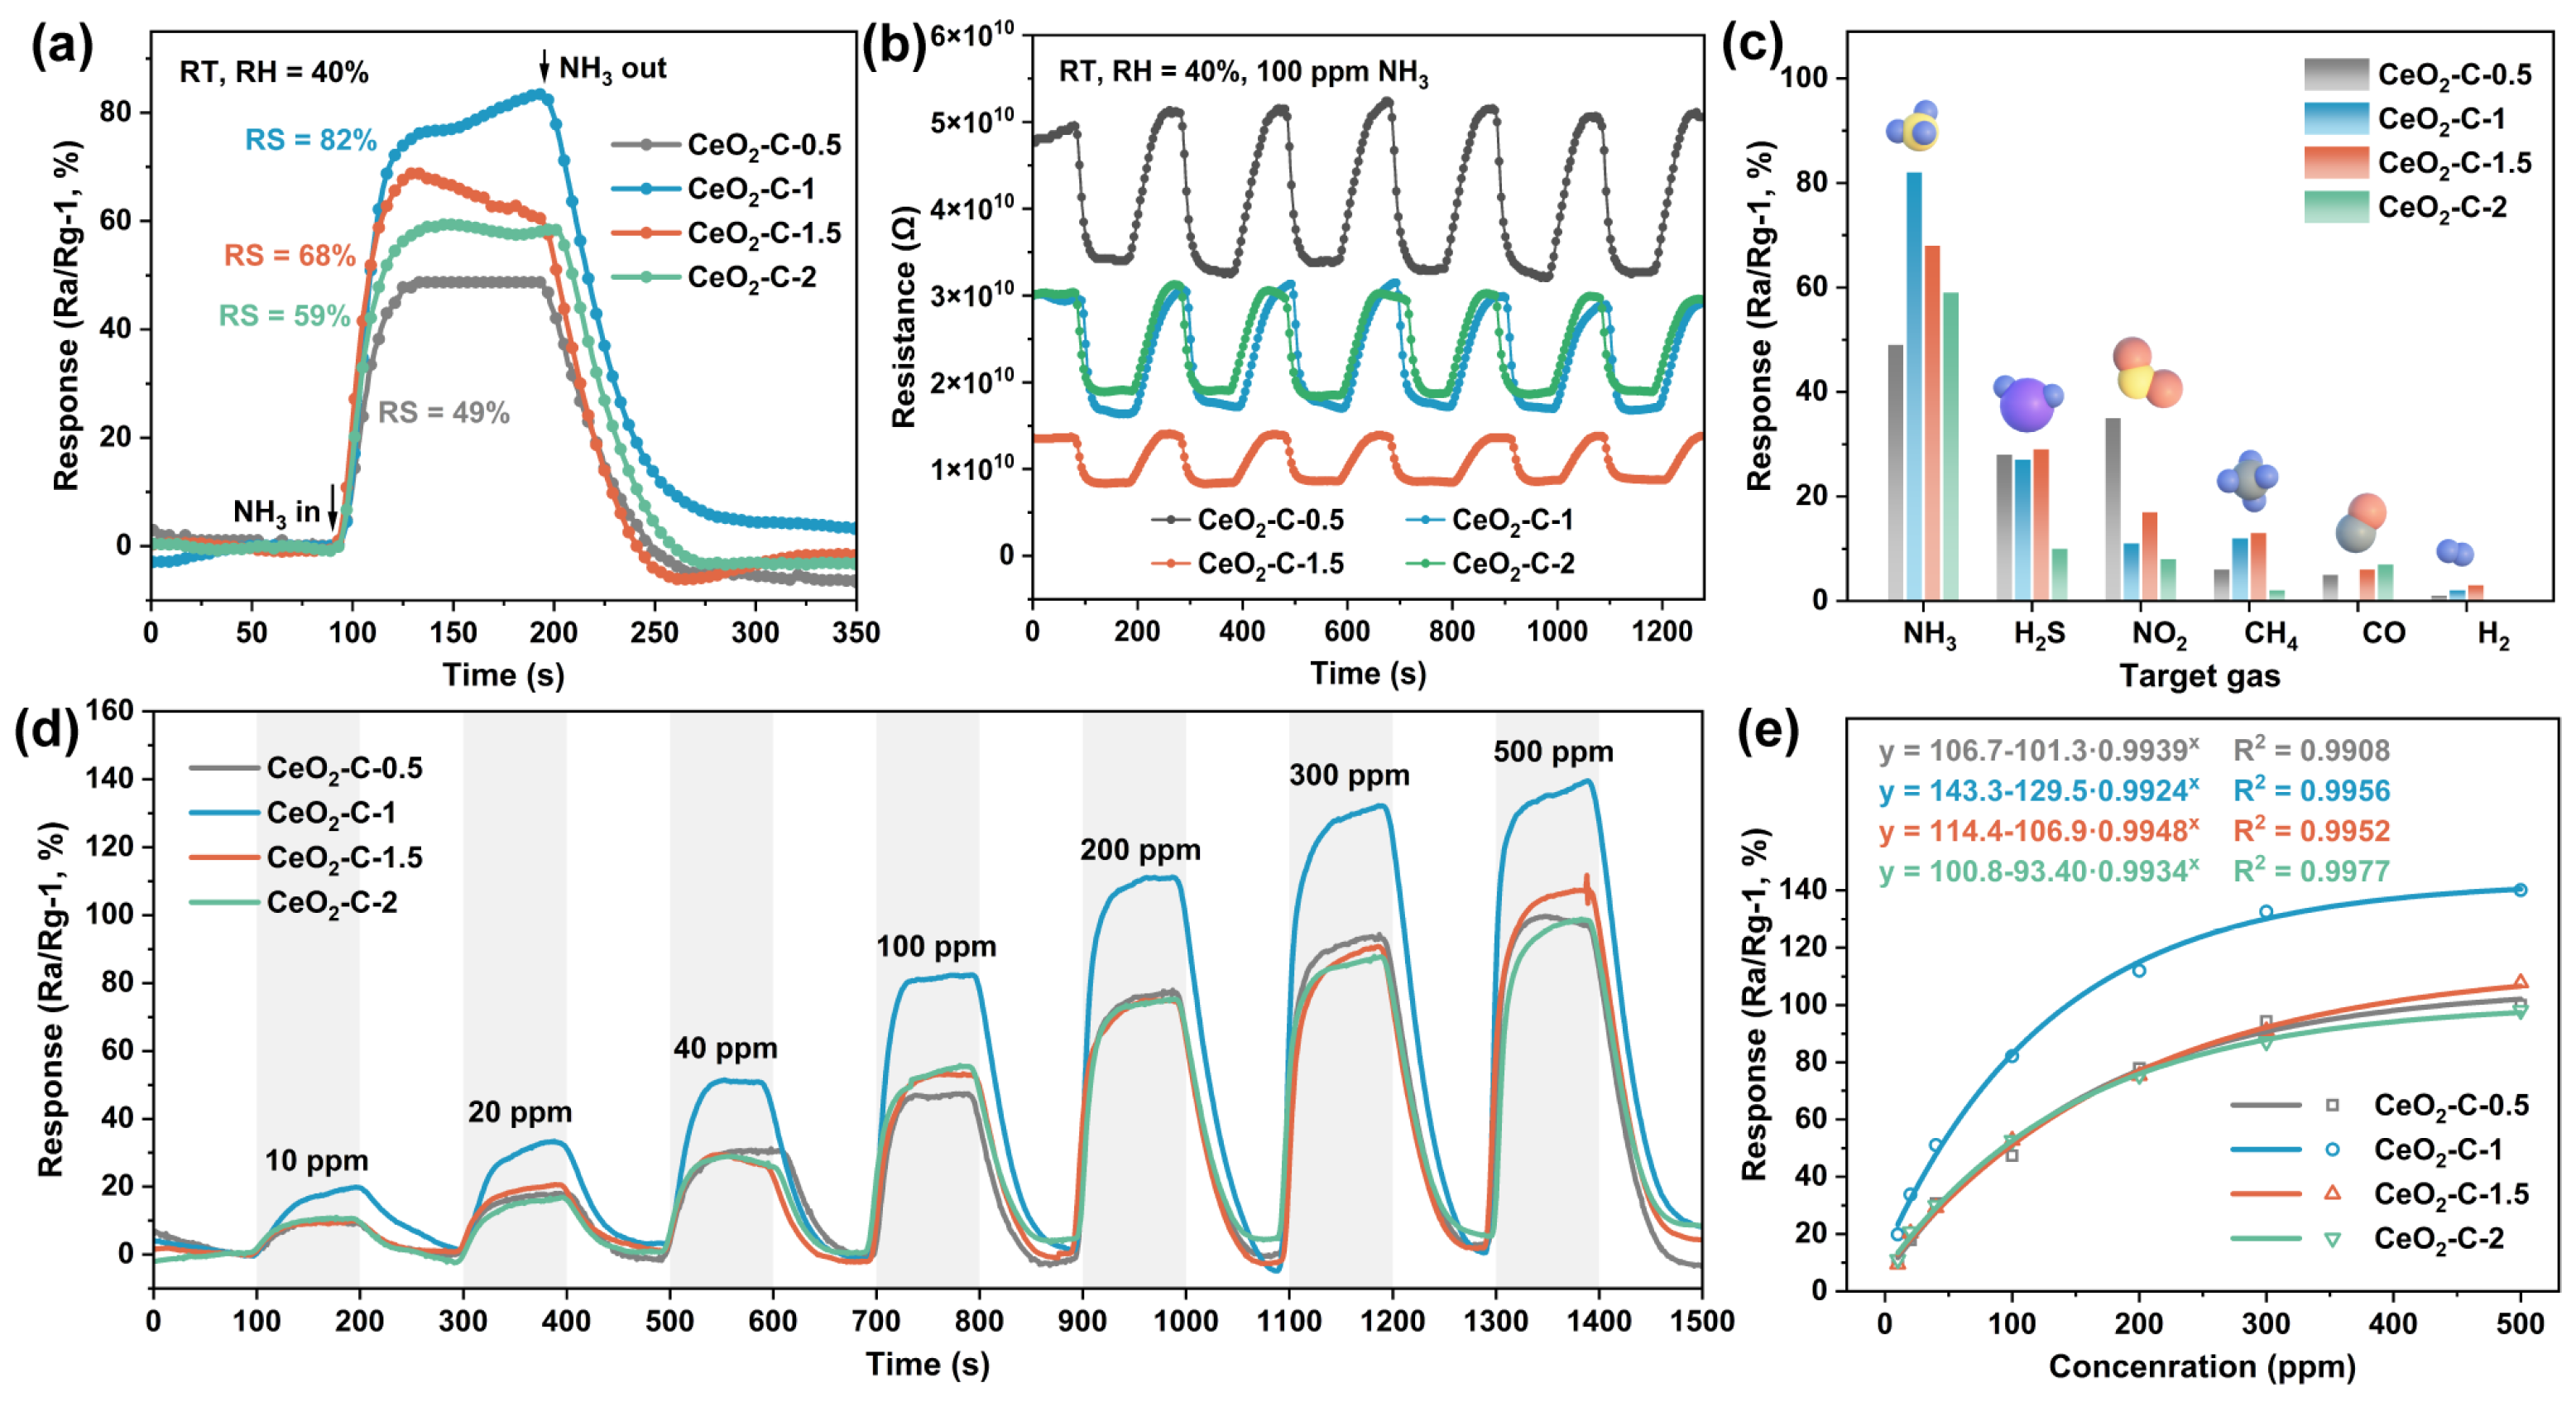
A series of CeO2-C derived from Ce-BDC precursors with different particle sizes and crystallinity was synthesized and assembled into sensors for NH3 detection, and the relevant procedures were described in Supplementary Materials. Under common environmental conditions, the NH3 sensing performance of CeO2-C was tested at RT = 25 ± 3 °C, using air as the recovery gas and maintaining the relative humidity (RH) at 40% ± 2% [36]. CeO2 exhibited relatively stable resistance values in the current-voltage (I–V) measurements (Figure S5). As shown in Figure 5a, at around 100 s, 100 ppm NH3 gradually reached the different CeO2-C-X sensors, leading to a change in resistance and thus a variation in response value. The four CeO2-C-X sensors exhibited distinct response behaviors, among which CeO2-C-1 (82%) showed a higher response than CeO2-C-1.5 (68%), CeO2-C-2 (59%), and CeO2-C-0.5 (49%). The response time (τres) and recovery time (τrec) were measured to be 22 s and 66 s, respectively. The LOD of CeO2-C-1 was calculated to be 0.31 ppm using the method of IPUAC and Burgués et al. in Supplementary Materials [37]. Further six-cycle repeatability tests were conducted to observe stability during repeated response-recovery in Figure 5b, the changes in resistance clearly reflected the NH3 adsorption and desorption processes, indicating the good cycling stability of the CeO2-C-X sensor series. The responses to various inorganic gases, excluding VOCs, were evaluated as shown in Figure 5c, with H2S and NO2 considered major interfering gases. CeO2-C-1 demonstrated the best anti-interference performance of low response to H2S (27%) and NO2 (11%) at RT. The NH3 sensing performance of CeO2-C-X at concentrations from 10 to 500 ppm is shown in Figure 5d. As NH3 concentration increased, the response values rose accordingly, with CeO2-C-1 consistently showing the highest response throughout the range. Moreover, CeO2-C-1 could achieve a response of 19.7% even at 10 ppm NH3. Significantly, the CeO2-C-X sensor series showed a near-exponential distribution of response values, suggesting higher sensitivity in the low-concentration range of NH3 (Figure 5e). The response of CeO2-C-1 to varying NH3 concentrations could be accurately fitted by y = 143.3 − 129.5·0.9924x, with an excellent correlation coefficient (R2 = 0.9956). To evaluate the long-term stability of the CeO2-C-1 sensor, cyclic stability tests were conducted under the same conditions after 30 days. As shown in Figure S6, CeO2-C-1 still exhibited a response of about 80%, demonstrating its excellent long-term stability. When compared with recently reported room-temperature NH3 sensors in Table 1, the CeO2-C-1 developed in this study showed competitive NH3 sensing performance among comparable materials.
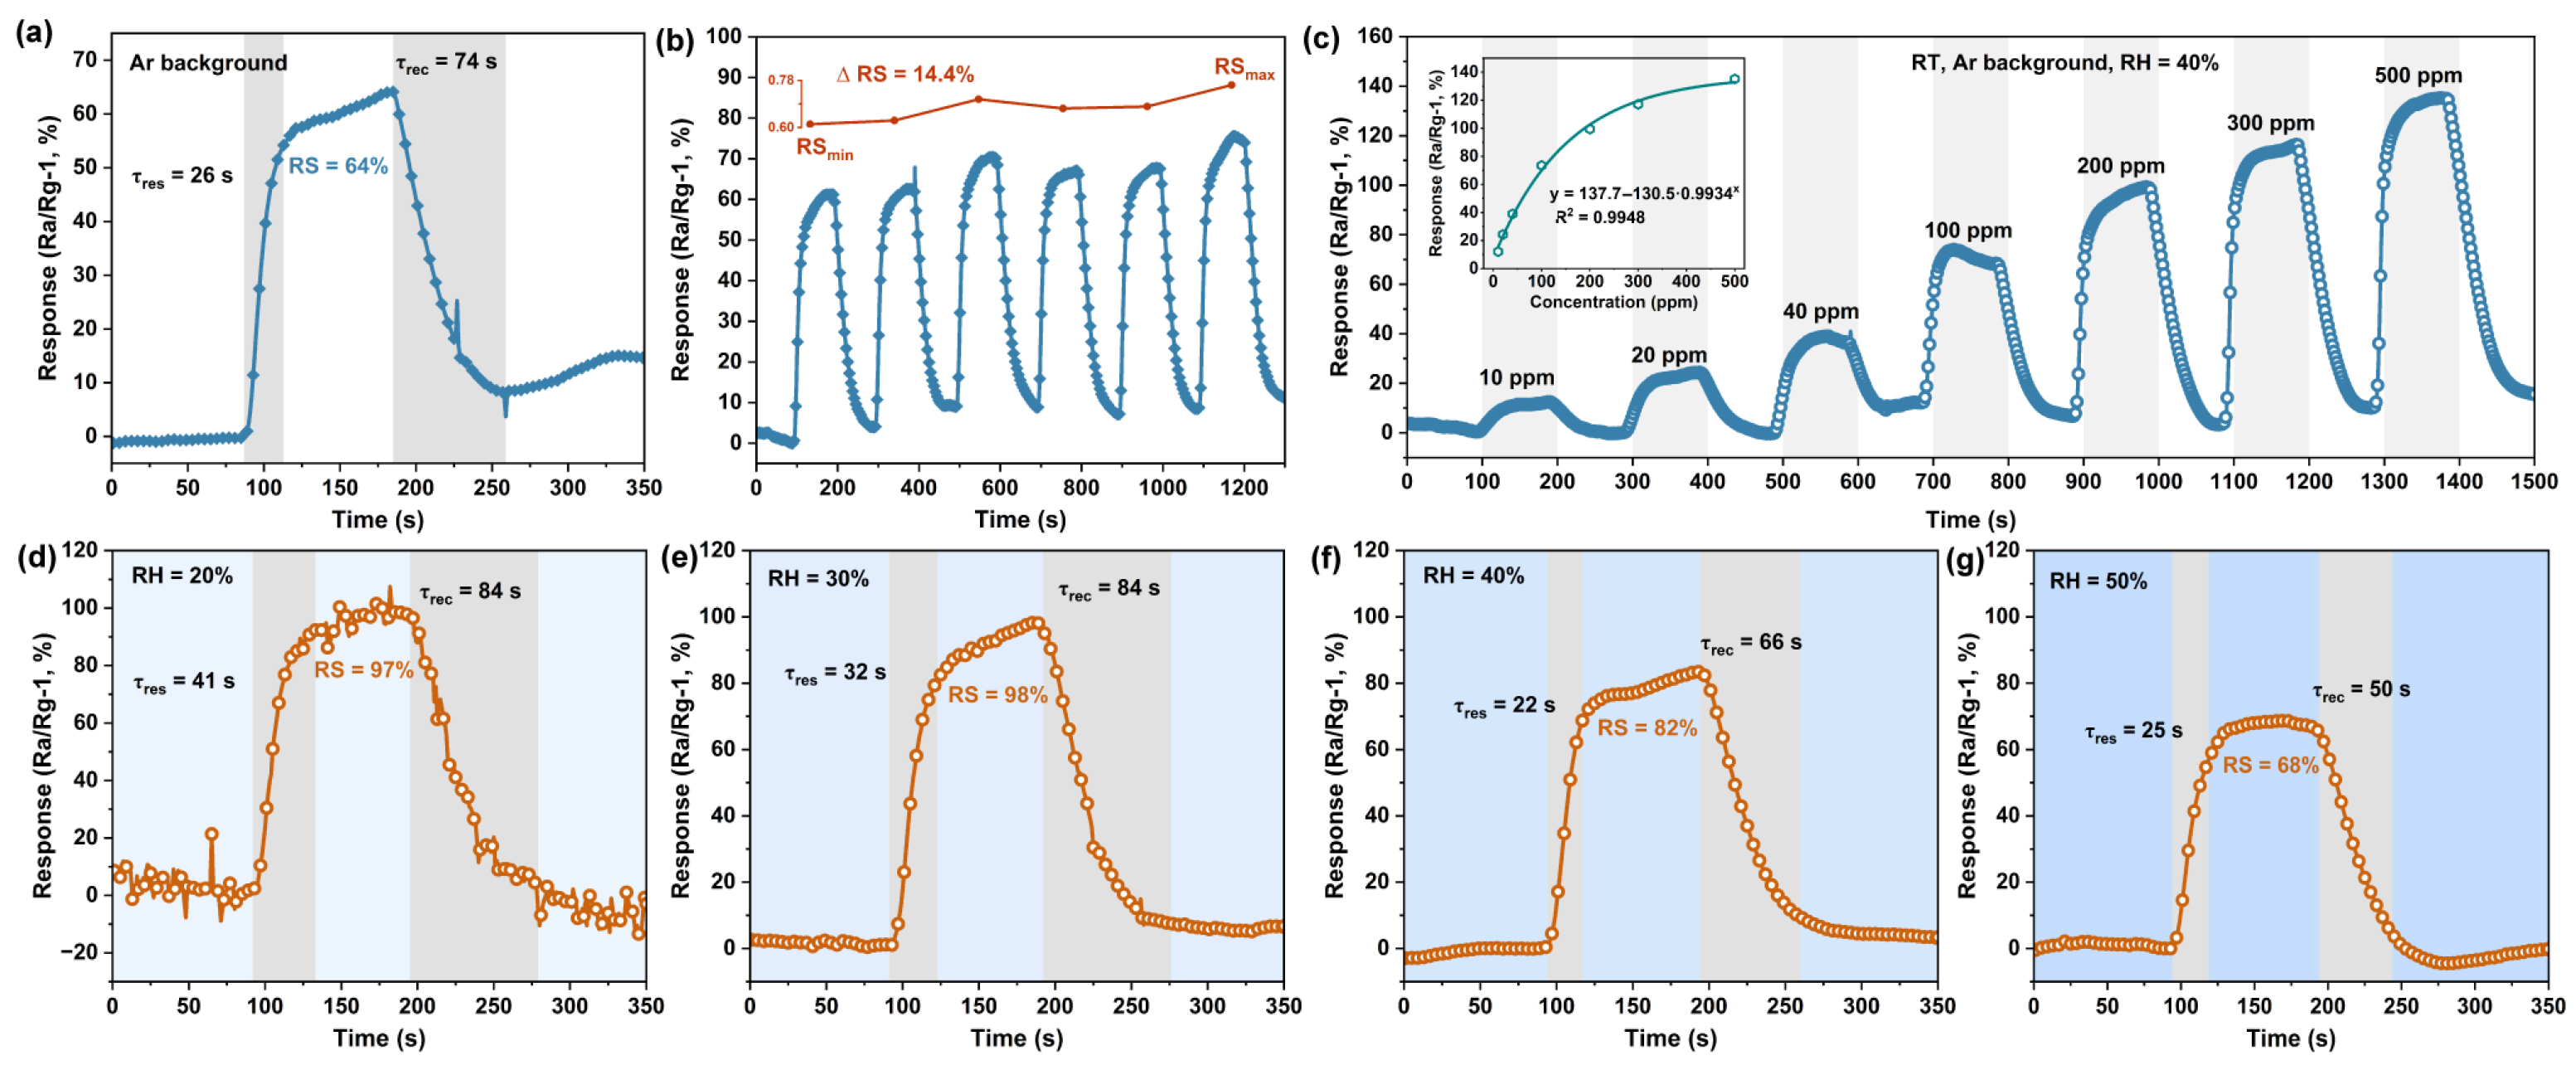
The O2 content and H2O are typically key factors affecting gas sensing performance [36]. Initially, the NH3 sensing behavior of the material under oxygen-free conditions was examined. As shown in Figure 6a, the gas sensing performance of the CeO2-C-1 sensor was tested under an Ar atmosphere with RH maintained at 40%. Although both the response and recovery times were delayed and the response value decreased, the material still exhibited τres and τrec of 26 s and 74 s, respectively, with a substantial response intensity of 64%. In six consecutive cycles of response testing in Figure 6b, the response showed slight fluctuations of 14.4%, indicating instability and a decline in sensing performance under oxygen-free conditions. As illustrated in Figure 6c, the NH3 response under varying concentrations still followed an exponential relationship. Humidity also influenced the resistance of CeO2-C-1, as shown in Figure 6d–f. It was observed that under low humidity, the CeO2-C-1 sensing material exhibited higher response values, though the response and recovery times were also prolonged. When the humidity reached 50%, the response value decreased but still remained at 68%. Overall, CeO2-C-1 maintained good gas-sensing performance under both oxygen-free conditions and varying humidity levels, which further broadened its potential applications.

3.4. Gas-Sensing Mechanism

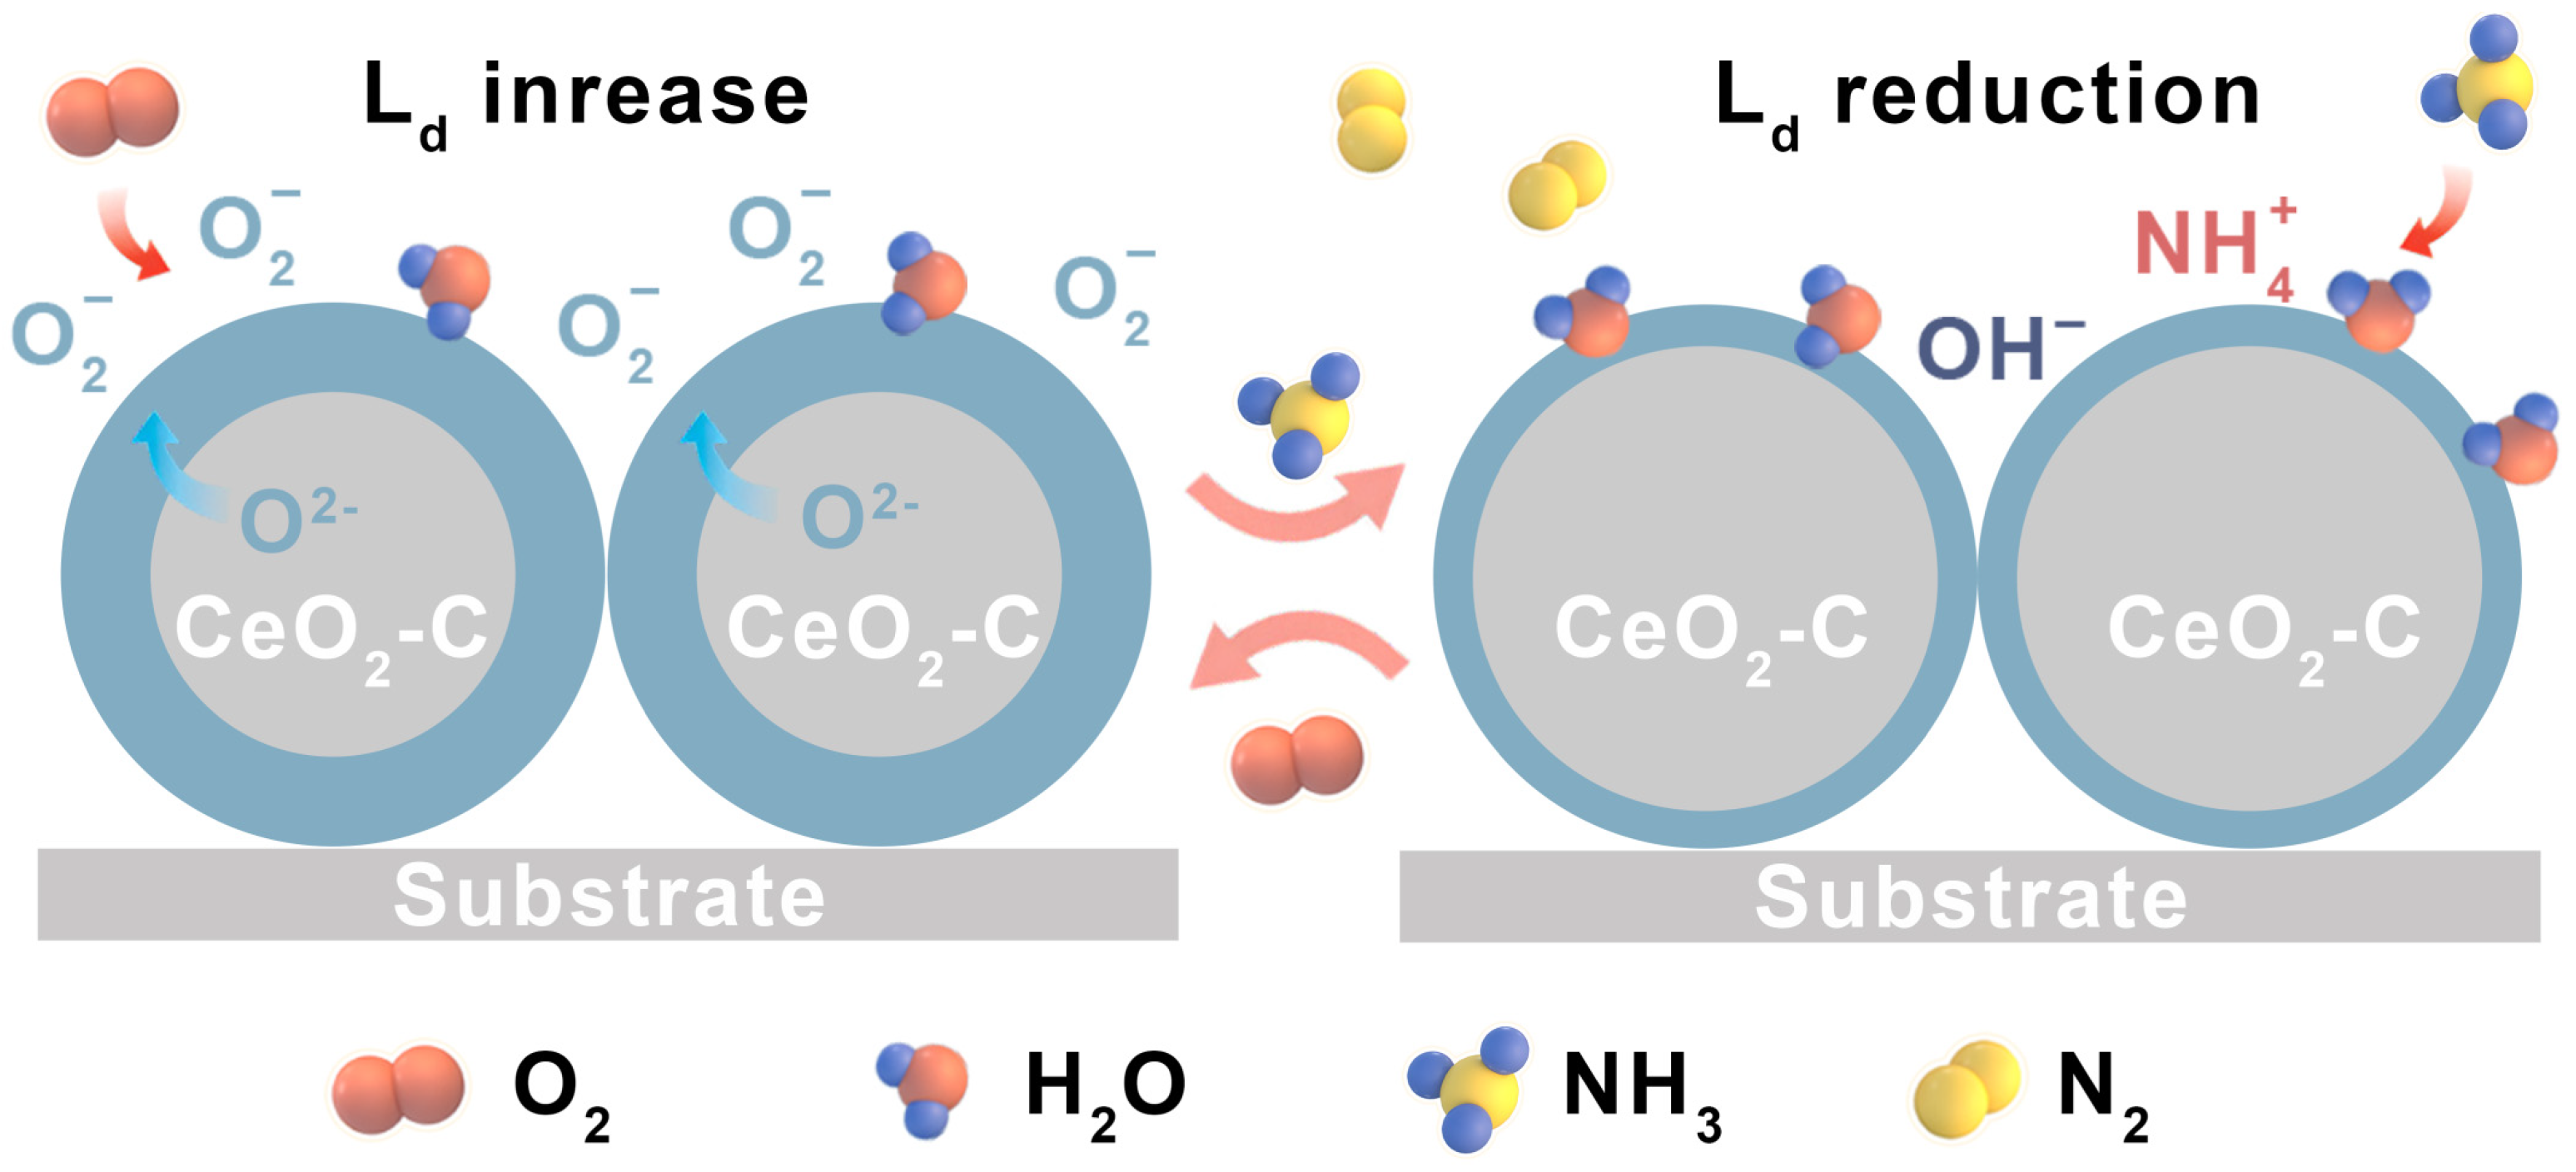
CeO2 is a typical n-type wide-bandgap semiconductor, and its NH3 gas-sensing mechanism primarily relies on the gas adsorption-reaction process on the surface and the resulting changes in the carrier concentration of the material [45]. The CeO2-C obtained from Ce-BDC contains residual carbon, which is beneficial for improving the electrical conductivity of CeO2 and mitigating the influence of humidity [46,47]. The possible NH3 sensing mechanism on CeO2-C is illustrated in Figure 7. In air, the surface of CeO2-C can adsorb oxygen molecules to form chemically adsorbed oxygen species (such as O2, O, and O2−) [48]. At RT, O2 molecules adsorb on the surface of CeO2-C and form O2 species as illustrated in Equations (1) and (2). These O2 species capture electrons from the conduction band of CeO2-C, resulting in the formation of a surface depletion layer (Ld) and an increased resistance [49,50].
O 2   ( gas ) O 2   ( ads )
O 2   ( ads ) + e O 2   ( ads ) ,   T < 150   ° C
As shown in Equations (3) and (4), when NH3 molecules interact with the CeO2-C surface, it reacts with the surface-adsorbed O2 species, releasing electrons back into the conduction band. This reduces the width of the depletion layer, leading to a decrease in resistance [51,52]. When re-exposed to air, O2 species are re-formed, and the material returns to its high-resistance state.
NH 3   ( gas ) NH 3   ( ads )
NH 3   ( ads ) + 3 O 2 2 N 2 + 6 H 2 O + 3 e
In addition, in the presence of ambient humidity, H2O molecules may adsorb on the CeO2-C surface. Meanwhile, NH3 tends to generate surface electrolyte ions, which reduce the resistance of the nano-sized CeO2-C (Equation (5)). When this sensing mechanism predominates, the sensor typically exhibits an integrative-type response, as the generated electrolyte ions are difficult to release [53]. Consequently, external stimuli such as thermal activation or UV irradiation are generally required to recover baseline resistance. The semiconductor-based sensing mechanism, primarily governed by depletion layer modulation, still predominates. It is evident that H2O and NH3 continue to compete for adsorption sites on the surface of CeO2-C, with increasing humidity leading to a slight decrease in the NH3 response.
NH 3   ( ads ) + H 2 O NH 4 + + OH
The superior gas-sensing performance of the CeO2-C sensor for NH3 detection at RT can be attributed to several factors. Among the series, the precursor Ce-BDC-1 and its derivative CeO2-C-1 exhibit the smallest particle size variation, preserving a stable nanostructure with the highest specific surface area. CeO2-C-1 also possesses the smallest average mesopore size, and this combination of limited particle growth and refined porosity ensures abundant active sites and efficient gas diffusion, thereby enhancing sensing performance and selectivity. Although the derived CeO2-C shows a high Ce3+ concentration, its sensing performance is inferior to that of certain other CeO2-C materials with lower Ce3+ content. This counterintuitive behavior may arise from excessive defect clustering, structural instability, or less favorable surface morphology.

4. Conclusions

In summary, a series of nano Ce-BDC materials and their derived CeO2-C-X material were successfully synthesized and systematically studied for room-temperature NH3 sensing. Among them, Ce-BDC-1-derived CeO2-C-1 showed minimal particle size variation and the highest specific surface area. It possessed 82% response to 100 ppm NH3, with a response/recovery time of 22 s/66 s at 25 °C and RH = 40%. It also exhibited a low detection limit (LOD = 0.31 ppm), along with excellent long-term stability and selectivity, thereby confirming the potential applicability of MOF-derived materials in gas sensing. Its superior sensing performance can be attributed to its well-developed mesoporous structure, which likely arises from the minimal particle size variation, allowing it to retain favorable physical properties. The NH3 sensing of CeO2-C at RT is primarily governed by depletion-layer modulation, where surface-adsorbed oxygen species capture and release electrons upon NH3 exposure. These findings highlight that careful synthesis control of the precursor Ce-MOF facilitates the design of CeO2-based gas sensors with optimized physical properties and stable gas-sensing performance.

Supplementary Materials

The following supporting information can be downloaded at: https://www.mdpi.com/article/10.3390/chemosensors13100362/s1, Figure S1: Schematic diagram and photograph of the planar gold electrode, along with the schematic illustration of the GB-203 platform; Figure S2: Photograph of the CeO2-C-1-based gas sensor fabricated on a planar Au electrode substrate; Figure S3: TG-DTG curve of Ce-BDC-1 in air atmosphere; Figure S4: (a) Survey spectrum, (b) The atomic percentages of Ce and O from the survey spectrum and (c) Ce 3d high-resolution spectrum of CeO2-C-X (X = 0.5, 1, 1.5, 2); Figure S5: Electrochemical cyclic voltammetry characterization (-4.5 V–4.5 V) of CeO2-C-X (X = 0.5, 1, 1.5, 2); Figure S6: Cyclic resistance response of CeO2-C-1 after 30 days; Figure S7: Linear fitting of RS (lg (143.3-y), %) versus NH3 concentration (lgx) for CeO2-C-1; Figure S8: 30 blank test points of CeO2-C-1; Table S1: Grain size of Ce-BDC-X and derived CeO2-C-X, and summary of pore properties of CeO2-X (X = 0.5, 1, 1.5, 2).

Author Contributions

Conceptualization, S.R., X.L., C.H., X.L. and X.Z.; methodology, M.L. and S.C.; software, S.R. and C.H.; validation, M.L. and S.R.; formal analysis, L.W. and M.L.; investigation, L.W.; resources, S.R., C.H. and B.B.; data curation, L.W.; writing—original draft preparation, L.W.; writing—review and editing, L.W., M.L., S.C., C.H., X.L. and X.Z.; visualization, B.B.; supervision, S.R., X.Z. and C.H.; project administration, S.R.; funding acquisition, S.R. All authors have read and agreed to the published version of the manuscript.

Funding

The current work was financially supported by the National Natural Science Foundation of China (Nos. 52174298 and 52374411), the BHP-Baowu-Monash Knowledge Centre for Low Carbon Metallurgy Project (No. EOI2024023), and the Outstanding Youth Science Foundation of Shaanxi Province (No. 2025JC-JCQN-031).

Informed Consent Statement

Not applicable.

Data Availability Statement

The raw data supporting the conclusions of this article will be made available by the authors on request.

Conflicts of Interest

The authors declare no conflict of interest.

References

  1. Liu, M.; Wang, L.; Ren, S.; Bai, B.; Chai, S.; He, C.; Zheng, C.; Yin, X.; Li, F. Preparation, improvement, and application of metal-organic framework-based sensing materials for gas leakage and emission: A review. Nano Mater. Sci. 2025, in press. [Google Scholar] [CrossRef]
  2. Yue, C.; Xu, J.; Liu, Z.; Yang, Z.; Mu, Y.; Chen, Q.; Chen, X.; Tan, X.; Wang, F.; Wang, X.; et al. Construction of Cr2O3-CdS heterojunction for enhancing the response of n-butanol gas. Sens. Actuators B Chem. 2025, 444, 138433. [Google Scholar] [CrossRef]
  3. Han, L.; Cai, S.; Gao, M.; Hasegawa, J.Y.; Wang, P.; Zhang, J.; Shi, L.; Zhang, D. Selective Catalytic Reduction of NOx with NH3 by Using Novel Catalysts: State of the Art and Future Prospects. Chem. Rev. 2019, 119, 10916–10976. [Google Scholar] [CrossRef]
  4. Chen, L.; Guan, X.; Fei, Z.; Asakura, H.; Zhang, L.; Wang, Z.; Su, X.; Yao, Z.; Keenan, L.L.; Hayama, S.; et al. Tuning the selectivity of NH3 oxidation via cooperative electronic interactions between platinum and copper sites. Nat. Commun. 2025, 16, 26. [Google Scholar] [CrossRef]
  5. MacFarlane, D.R.; Cherepanov, P.V.; Choi, J.; Suryanto, B.H.R.; Hodgetts, R.Y.; Bakker, J.M.; Ferrero Vallana, F.M.; Simonov, A.N. A Roadmap to the Ammonia Economy. Joule 2020, 4, 1186–1205. [Google Scholar] [CrossRef]
  6. Portarapillo, M.; Bellucci Sessa, A.; Russo, D.; di Benedetto, A. Ammonia as a Hydrogen Carrier: Energetic Assessment of Processes Integrated with Fuel Cells for Power Generation. Energy Fuels 2025, 39, 2843–2853. [Google Scholar] [CrossRef]
  7. Jonson, J.E.; Fagerli, H.; Scheuschner, T.; Tsyro, S. Modelling changes in secondary inorganic aerosol formation and nitrogen deposition in Europe from 2005 to 2030. Atmos. Chem. Phys. 2022, 22, 1311–1331. [Google Scholar] [CrossRef]
  8. Li, D.; Han, D.; Chen, Y.; Hong, Y.; Duan, Q.; Wang, H.; He, X.; Zhao, L.; Wang, W.; Sang, S. GaN/rGO nanocomposite gas sensor for enhanced NH3 sensing performances at room temperature. Sens. Actuators B Chem. 2024, 403, 135209. [Google Scholar] [CrossRef]
  9. Wang, W.; Zhen, Y.; Zhang, J.; Li, Y.; Zhong, H.; Jia, Z.; Xiong, Y.; Xue, Q.; Yan, Y.; Alharbi, N.S.; et al. SnO2 nanoparticles-modified 3D-multilayer MoS2 nanosheets for ammonia gas sensing at room temperature. Sens. Actuators B Chem. 2020, 321, 128471. [Google Scholar] [CrossRef]
  10. Bulemo, P.M.; Kim, D.H.; Shin, H.; Cho, H.J.; Koo, W.T.; Choi, S.J.; Park, C.; Ahn, J.; Guntner, A.T.; Penner, R.M.; et al. Selectivity in Chemiresistive Gas Sensors: Strategies and Challenges. Chem. Rev. 2025, 125, 4111–4183. [Google Scholar] [CrossRef]
  11. Li, J.; Li, Y.; Zeng, W.; Bai, B.; Ren, S. Regulating surface terminals and interlayer structure of Ti3C2Tx for superior NH3 sensing. Talanta 2025, 283, 127107. [Google Scholar] [CrossRef]
  12. Wang, Z.; Bu, M.; Hu, N.; Zhao, L. An overview on room-temperature chemiresistor gas sensors based on 2D materials: Research status and challenge. Compos. Part B Eng. 2023, 248, 110378. [Google Scholar] [CrossRef]
  13. Yi, S.; Shi, W.; Yang, X.; Yao, Z. Engineering sensitive gas sensor based on MOF-derived hollow metal-oxide semiconductor heterostructures. Talanta 2023, 258, 124442. [Google Scholar] [CrossRef] [PubMed]
  14. Luo, L.; Hou, L.; Cui, X.; Zhan, P.; He, P.; Dai, C.; Li, R.; Dong, J.; Zou, Y.; Liu, G.; et al. Self-condensation-assisted chemical vapour deposition growth of atomically two-dimensional MOF single-crystals. Nat. Commun. 2024, 15, 3618. [Google Scholar] [CrossRef] [PubMed]
  15. Nguyen, L.H.T.; Mirzaei, A.; Kim, J.Y.; Phan, T.B.; Tran, L.D.; Wu, K.C.; Kim, H.W.; Kim, S.S.; Doan, T.L.H. Advancements in MOF-based resistive gas sensors: Synthesis methods and applications for toxic gas detection. Nanoscale Horiz. 2025, 10, 1025–1053. [Google Scholar] [CrossRef]
  16. Liu, Z.; Wang, Y.; Li, Y.; Sui, C.; Liu, Y.; Liu, Y.; Zhao, Y.; Liang, X.; Liu, F.; Lu, G. Bimetallic MOF derived mesoporous structure of Ru doped SnO2 enable high-sensitivity gas sensors for triethylamine in high humidity. Sens. Actuators B Chem. 2024, 405, 135275. [Google Scholar] [CrossRef]
  17. Liu, M.; Wang, L.; Ren, S.; Bai, B.; Chai, S.; He, C.; Zheng, C.; Li, X.; Yin, X.; Xu, C.C. Effect of CTAB on the Morphology of Sn-MOF and the Gas Sensing Performance of SnO2 with Different Crystal Phases for H2 Detection. Chemosensors 2025, 13, 192. [Google Scholar] [CrossRef]
  18. Song, Z.; Liu, Y.; Wang, Y.; Chen, Y.; Li, J.; Li, L.; Yao, J. Polycrystalline hollow MOF derived Co3O4 semiconductor to achieve room-temperature ammonia detection in human exhaled breath. Sens. Actuators B Chem. 2024, 411, 135701. [Google Scholar] [CrossRef]
  19. Ren, X.; Xu, Z.; Liu, D.; Li, Y.; Zhang, Z.; Tang, Z. Conductometric NO2 gas sensors based on MOF-derived porous ZnO nanoparticles. Sens. Actuators B Chem. 2022, 357, 131384. [Google Scholar] [CrossRef]
  20. Montoro, C.; Kim, J.-Y.; Mirzaei, A.; Lee, J.-H.; Sayegh, S.; Makhoul, E.; Iatsunskyi, I.; Coy, E.; Bechelany, M.; Kim, H.W.; et al. MOF-derived metal oxide (Cu, Ni, Zn) gas sensors with excellent selectivity towards H2S, CO and H2 gases. Compos. Part B Eng. 2024, 283, 111637. [Google Scholar] [CrossRef]
  21. Li, Y.; Chen, P.; Zeng, W.; Li, X.; Wang, Q. MOF-derived Co3O4 decorated SnO2 nanosheets for NH3 sensor fabricated by carrier gas regulation. Chem. Eng. J. 2025, 519, 165001. [Google Scholar] [CrossRef]
  22. Li, W.; Chen, Y.; Zhang, J.; Zeng, F.; Bao, J.; Liu, L.; Tian, G. Cocatalyst Embedded Ce-BDC-CeO2 S-Scheme Heterojunction Hollowed-Out Octahedrons With Rich Defects for Efficient CO2 Photoreduction. Small 2024, 20, e2406487. [Google Scholar] [CrossRef] [PubMed]
  23. Hirschle, P.; Preiß, T.; Auras, F.; Pick, A.; Völkner, J.; Valdepérez, D.; Witte, G.; Parak, W.J.; Rädlerb, J.O.; Wuttke, S. Exploration of MOF nanoparticle sizes using various physical characterization methods-is what you measure what you get? CrystEngComm 2016, 18, 4359–4368. [Google Scholar] [CrossRef]
  24. Zhang, W.; Wang, L.; Pei, W.; Dang, J.; Zhang, Y.; Liu, X.; Maqsood, A.; He, Q.; Li, M. Ultraefficient Phosphate Adsorption via Monocarboxylic Acid-Regulated Defective Ce-MOFs: Pore Size Regulation, Valence State Modulation, and Unsaturated Center Design. ACS Appl. Mater. Interfaces 2025, 17, 36751–36762. [Google Scholar] [CrossRef]
  25. Matemb Ma Ntep, T.J.; Reinsch, H.; Liang, J.; Janiak, C. Acetylenedicarboxylate-based cerium(IV) metal-organic framework with fcu topology: A potential material for air cleaning from toxic halogen vapors. Dalton Trans. 2019, 48, 15849–15855. [Google Scholar] [CrossRef]
  26. Lammert, M.; Wharmby, M.T.; Smolders, S.; Bueken, B.; Lieb, A.; Lomachenko, K.A.; Vos, D.D.; Stock, N. Cerium-based metal organic frameworks with UiO-66 architecture: Synthesis, properties and redox catalytic activity. Chem. Commun. 2015, 51, 12578–12581. [Google Scholar] [CrossRef]
  27. Prieur, D.; Bonani, W.; Popa, K.; Walter, O.; Kriegsman, K.W.; Engelhard, M.H.; Guo, X.; Eloirdi, R.; Gouder, T.; Beck, A.; et al. Size Dependence of Lattice Parameter and Electronic Structure in CeO2 Nanoparticles. Inorg. Chem. 2020, 59, 5760–5767. [Google Scholar] [CrossRef]
  28. Huang, Q.; Chen, X.; Lv, L.; Zhang, W.; Pan, B. Redox-oriented anchoring of CeO2 over nanostructured MnCo-spinel: Strong oxide-support interaction for enhanced toluene combustion. Appl. Catal. B 2025, 378, 125548. [Google Scholar] [CrossRef]
  29. Gobi, R.; Babu, R.S.; Rani, M.U.; Gothandam, K.M.; Prakash, J.; Venkatasubbu, G.D. Investigating the effect of antibacterial cerium oxide nanoparticles embedded in biodegradable PVA/chitosan films for wound healing application: An in-vitro study. Emergent Mater. 2024, 8, 1813–1833. [Google Scholar] [CrossRef]
  30. Zuas, O.; Abimanyu, H.; Wibowo, W. Synthesis and characterization of nanostructured CeO2 with dyes adsorption property. Process. Appl. Ceram. 2014, 8, 39–46. [Google Scholar] [CrossRef]
  31. Sartoretti, E.; Novara, C.; Giorgis, F.; Piumetti, M.; Bensaid, S.; Russo, N.; Fino, D. In situ Raman analyses of the soot oxidation reaction over nanostructured ceria-based catalysts. Sci. Rep. 2019, 9, 3875. [Google Scholar] [CrossRef] [PubMed]
  32. Albu, Z.; Abass, N.A.; Sharma, P.K.; Qahtan, T.; Huang, S.; Rashid, N.; Sanfo, G.; Pineda, M.; Al-Sayoud, A.; AlOtaibi, B.; et al. Transition metal doping of CeO2 boosts photo-assisted electrocatalytic oxygen evolution performance. J. Energy Chem. 2025, 110, 973–985. [Google Scholar] [CrossRef]
  33. Wang, H.; Cui, G.; Lu, H.; Li, Z.; Wang, L.; Meng, H.; Li, J.; Yan, H.; Yang, Y.; Wei, M. Facilitating the dry reforming of methane with interfacial synergistic catalysis in an Ir@CeO2-x catalyst. Nat. Commun. 2024, 15, 3765. [Google Scholar] [CrossRef] [PubMed]
  34. Liu, F.; Li, J.; Sohn, H.Y.; Chen, C.; Yang, J.; Liu, X.; Lan, Y.; Zhang, W.; Wang, Q.; Liu, L. Redox on Mn-Ce interface and its effects on low temperature selective catalytic reduction for NO removal. Fuel 2023, 350, 128806. [Google Scholar] [CrossRef]
  35. Wang, W.; Wang, X.; Chen, L.; Zhang, S.; Li, W.; Li, S. Unveiling the role of surface hydroxyl oxygen in modulating the ‘seesaw effect’ of NH3-SCR over amorphous FeMnTi-AM catalysts. Appl. Catal. B 2025, 370, 125191. [Google Scholar] [CrossRef]
  36. Wu, H.; Yu, J.; Yao, G.; Li, Z.; Zou, W.; Li, X.; Zhu, H.; Huang, Z.; Tang, Z. Room temperature NH3 sensing properties and humidity influence of Ti3C2Tx and Ag-Ti3C2Tx in an oxygen-free environment. Sens. Actuators B Chem. 2022, 369, 132195. [Google Scholar] [CrossRef]
  37. Burgues, J.; Jimenez-Soto, J.M.; Marco, S. Estimation of the limit of detection in semiconductor gas sensors through linearized calibration models. Anal. Chim. Acta 2018, 1013, 13–25. [Google Scholar] [CrossRef]
  38. Elavarasan, T.; Amalarani, A.; Ernest, S.; Mohammed Gazzali, P.M.; Fairose, S. Structural, morphological and ammonia sensing properties of spray deposited CeO2 films. Mater. Today Proc. 2023, in press. [Google Scholar] [CrossRef]
  39. Zhang, L.; Xu, J.; Lei, X.; Sun, H.; Ai, T.; Ma, F.; Chu, P.K. Edge-enriched SnS2 nanosheets on graphene for chemiresistive room temperature NH3 sensors. Sens. Actuators B Chem. 2025, 433, 137565. [Google Scholar] [CrossRef]
  40. Choudhary, V.S.; Gangwar, S.; Yadav, C.S.; Sharma, S.; Almeida, M.A.P.; Sharma, S.K. Vanadium doping as a key factor for superior NH3 sensing at room temperature in MoSe2/TiO2 composites. Sens. Actuators A Phys. 2025, 388, 116501. [Google Scholar] [CrossRef]
  41. Wang, P.; Tang, C.; Zhang, L.; Lu, Y.; Huang, F. Hierarchical 0D/1D/2D Au/PANI/WS2 ternary nanocomposite NH3 sensor with high performance and fast response/recovery for food spoilage detection. Chem. Eng. J. 2024, 496, 153998. [Google Scholar] [CrossRef]
  42. Sinha, S.K.; Kumar, B.; Kumar, R.; Ganguly, S.; Hazra, A. Synthesis and characterization of hybrid NiO/CeO2 p-n heterojunction nanofibers for room temperature ammonia sensing application. Surf. Interfaces 2024, 51, 104568. [Google Scholar] [CrossRef]
  43. Zhang, L.; Xu, J.; Wang, D.; Lei, X.; Sun, H.; Huang, Y.; Ma, F.; Ai, T.; Chu, P.K. Enhanced Room-Temperature NH3-Sensing Performance of Ti3C2Tx MXene Decorated with CeO2 Nanoparticles. ACS Appl. Nano Mater. 2025, 8, 12090–12099. [Google Scholar] [CrossRef]
  44. Dhanawade, R.N.; Pawar, N.S.; Chougule, M.A.; Hingangavkar, G.M.; Jadhav, Y.M.; Nimbalkar, T.M.; Navale, Y.H.; Chavan, G.T.; Jeon, C.-W.; Patil, V.B. Highly sensitive and selective PAni-CeO2 nanohybrid for detection of NH3 biomarker at room temperature. J. Mater. Sci. Mater. Electron. 2023, 34, 781. [Google Scholar] [CrossRef]
  45. Singh, S.; Shin, K.Y.; Moon, S.; Kim, S.S.; Kim, H.W. Phase-Engineered MoSe2/CeO2 Composites for Room-Temperature Gas Sensing with a Drastic Discrimination of NH3 and TEA Gases. ACS Sens. 2024, 9, 3994–4006. [Google Scholar] [CrossRef]
  46. Wang, B.R.; Hu, Y.; Pan, Z.; Wang, J. MOF-derived manganese oxide/carbon nanocomposites with raised capacitance for stable asymmetric supercapacitor. RSC Adv. 2020, 10, 34403–34412. [Google Scholar] [CrossRef]
  47. Lim, H.; Kwon, H.; Kang, H.; Jang, J.E.; Kwon, H.J. Laser-Induced and MOF-Derived Metal Oxide/Carbon Composite for Synergistically Improved Ethanol Sensing at Room temperature. Nano-Micro Lett. 2024, 16, 113. [Google Scholar] [CrossRef]
  48. Isaac, N.A.; Pikaar, I.; Biskos, G. Metal oxide semiconducting nanomaterials for air quality gas sensors: Operating principles, performance, and synthesis techniques. Mikrochim. Acta 2022, 189, 196. [Google Scholar] [CrossRef]
  49. Liu, J.; Dai, M.; Wang, T.; Sun, P.; Liang, X.; Lu, G.; Shimanoe, K.; Yamazoe, N. Enhanced Gas Sensing Properties of SnO2 Hollow Spheres Decorated with CeO2 Nanoparticles Heterostructure Composite Materials. ACS Appl. Mater. Interfaces 2016, 8, 6669–6677. [Google Scholar] [CrossRef]
  50. Yoon, J.W.; Kim, J.S.; Kim, T.H.; Hong, Y.J.; Kang, Y.C.; Lee, J.H. A New Strategy for Humidity Independent Oxide Chemiresistors: Dynamic Self-Refreshing of In2O3 Sensing Surface Assisted by Layer-by-Layer Coated CeO2 Nanoclusters. Small 2016, 12, 4229–4240. [Google Scholar] [CrossRef]
  51. Esmaeili, C.; Ashtiani, S.; Regmi, C.; Laposa, A.; Voves, J.; Kroutil, J.; Friess, K.; Povolny, V.; Lotfian, S. Preparation and characterisation of NH3 gas sensor based on PANI/Fe-doped CeO2 nanocomposite. Heliyon 2024, 10, e34801. [Google Scholar] [CrossRef]
  52. Gond, R.; Shukla, P.; Prakash, B.; Rawat, B. Vertically Aligned MoS2/ZnO Heterostructure for Highly Selective NH3 Sensing at Room Temperature. ACS Appl. Electron. Mater. 2024, 6, 2728–2738. [Google Scholar] [CrossRef]
  53. Maier, K.; Helwig, A.; Muller, G.; Hille, P.; Eickhoff, M. Effect of Water Vapor and Surface Morphology on the Low Temperature Response of Metal Oxide Semiconductor Gas Sensors. Materials 2015, 8, 6570–6588. [Google Scholar] [CrossRef]
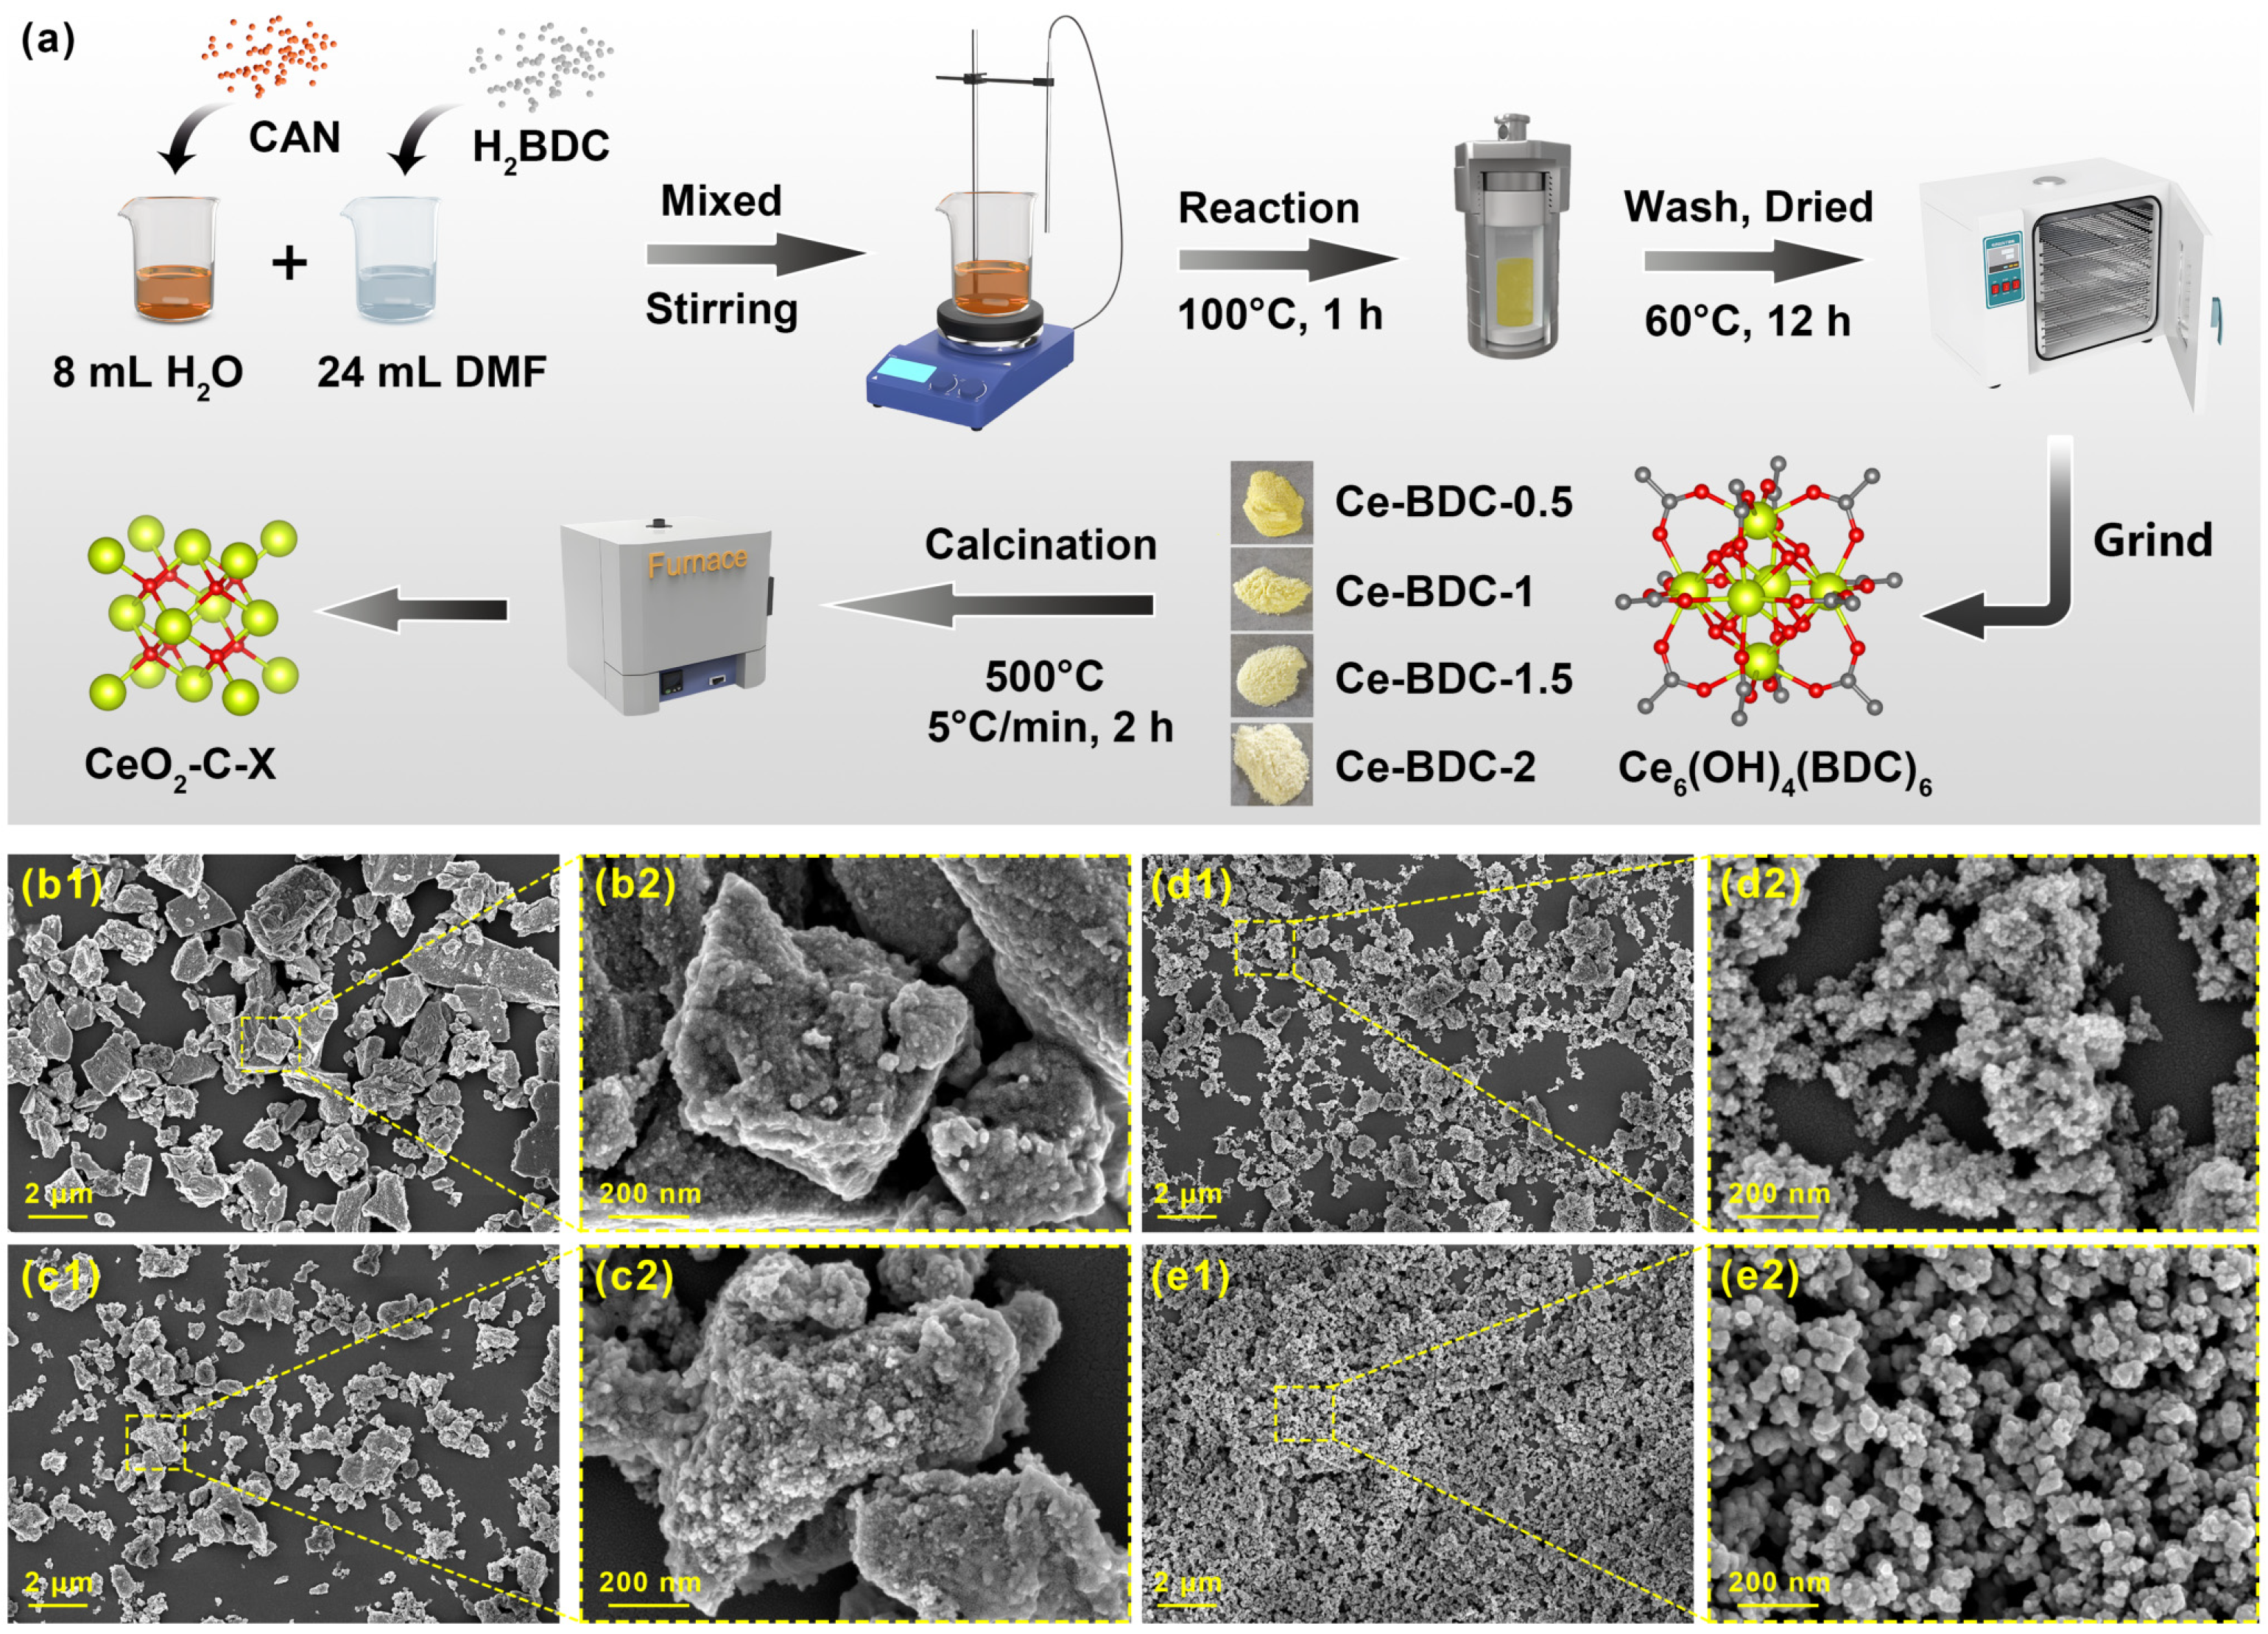
Figure 1. (a) Schematic diagram of the CeO2-C-X synthesis (X = 0.5, 1, 1.5, 2); (b1e2) Morphology of CeO2-C-X observed by SEM at 2 μm (left) and 200 nm (right) scales: (b1,b2) CeO2-C-0.5, (c1,c2) CeO2-C-1, (d1,d2) CeO2-C-1.5, (e1,e2) CeO2-C-2.
Chemosensors 13 00362 g001
Figure 2. TEM images of (a,b) Ce-BDC-1, (e,f) CeO2-C-1. STEM images and EDS elemental mapping images of C, Ce and O for (c) Ce-BDC-1, (g) CeO2-C-1. TEM-EDS spectrum and corresponding quantitative elemental compositions of (d) Ce-BDC-1, (h) CeO2-C-1.
Chemosensors 13 00362 g002
Figure 3. (a) XRD pattern of Ce-BDC-X precursors and (b) Ce-BDC-X derived CeO2-C-X; (c) N2 adsorption–desorption isotherms; (d) BJH calculated pore diameter distribution; Raman spectroscopy was recorded with 532 nm excitation laser in the range of (e) 300–1200 cm−1 and locally enlarged (f) 500–1300 cm−1 of CeO2-C-X (X = 0.5, 1, 1.5, 2).
Chemosensors 13 00362 g003
Figure 4. O 1s high-resolution spectrum and peak deconvolution curves of (a) CeO2-C-0.5, (b) CeO2-C-1, (c) CeO2-C-1.5, (d) CeO2-C-2 samples (the gray dots represent the actual data points).
Chemosensors 13 00362 g004
Figure 5. Gas sensing performance of CeO2-C-X sensors (X = 0.5, 1, 1.5, 2) under ambient conditions with RH = 40% at RT: (a) Response-recovery characteristics to 100 ppm NH3; (b) Cyclic resistance response over six consecutive cycles; (c) Selectivity to 100 ppm NH3, H2S, NO2, CH4, CO, and H2; (d) Responses to NH3 concentrations from 10 to 500 ppm; (e) Exponential fitting of response versus NH3 concentration.
Chemosensors 13 00362 g005
Figure 6. CeO2-C-1 sensor measured in an Ar atmosphere: (a) Response-recovery characteristics to 100 ppm NH3; (b) Cyclic resistance response over six consecutive cycles; (c) Response to NH3 concentrations from 10 to 500 ppm and exponential fitting of response versus NH3 concentration. (d) Response-recovery characteristics to 100 ppm NH3 under varying humidity conditions: (d) 20%, (e) 30%, (f) 40%, and (g) 50%.
Chemosensors 13 00362 g006
Figure 7. Possible H2O-induced NH3 sensing mechanism on CeO2-C.
Chemosensors 13 00362 g007
Table 1. NH3 sensing performance at RT compared with recently reported work.
MaterialsRH (%)Conc. (ppm)RS (%)τresrec (s)LODRef
CeO2 film01003519/66NA[38]
SnS2/grapheneNA10062.3663/5860.1 ppm[39]
MoSe2/VTiO25062.7894/500.3 ppm[40]
Au/PANI/WS251100286.124/2613.8 ppb[41]
NiO@CeO204009779/21NA[42]
CeO2/Ti3C2Tx01028.36145/875NA[43]
PAni-CeO20100809.31/531.60NA[44]
CeO2-C-1401008222/660.31 ppmThis work
Disclaimer/Publisher’s Note: The statements, opinions and data contained in all publications are solely those of the individual author(s) and contributor(s) and not of MDPI and/or the editor(s). MDPI and/or the editor(s) disclaim responsibility for any injury to people or property resulting from any ideas, methods, instructions or products referred to in the content.