Article

A Practical Approach to Triclosan Detection: A Novel Y2O3@GCN-Modified Carbon Paste Electrode for Sensitive and Selective Detection in Environmental and Consumer Products

by
Aleksandar Mijajlović
1,
Miloš Ognjanović
2,*,
Vesna Stanković
3,
Tijana Mutić
3,
Slađana Đurđić
1,
Branka B. Petković
4 and
Dalibor M. Stanković
1
1
Faculty of Chemistry, University of Belgrade, Studentski Trg 12-16, 11000 Belgrade, Serbia
2
VINČA Institute of Nuclear Sciences—National Institute of the Republic of Serbia, University of Belgrade, Mike Petrovića Alasa 12-14, 11000 Belgrade, Serbia
3
Institute of Chemistry, Technology and Metallurgy—National Institute of the Republic of Serbia, University of Belgrade, Njegoševa 12, 11000 Belgrade, Serbia
4
Faculty of Sciences and Mathematics, University of Priština in Kosovska Mitrovica, Lole Ribara 29, 38220 Kosovska Mitrovica, Serbia
*
Author to whom correspondence should be addressed.
Chemosensors 2024, 12(12), 272; https://doi.org/10.3390/chemosensors12120272
Submission received: 14 November 2024 / Revised: 6 December 2024 / Accepted: 18 December 2024 / Published: 19 December 2024
(This article belongs to the Special Issue Electrochemical Sensors and Biosensors for Environmental Detection)

Abstract

:
This study presents the development of a novel electrochemical sensor for the sensitive and selective detection of triclosan (TSC) on a carbon paste electrode (CPE) modified with graphitic carbon nitride (GCN) and doped with yttrium oxide nanoparticles (Y2O3). The materials and proposed electrode were characterized using transmission electron microscopy (TEM), scanning electron microscopy (SEM), X-ray diffraction (XRD), electrochemical impedance spectroscopy (EIS), and cyclic voltammetry (CV). The modified sensor exhibited significantly enhanced electrocatalytic activity towards TSC compared to the unmodified CPE. The sensor demonstrated a wide linear detection range, which was obtained using square wave voltammetric method (SWV), with a low limit of detection (LOD) of 0.137 µM and a low limit of quantification (LOQ) of 0.455 µM. The sensor also exhibited excellent selectivity towards TSC in the presence of various interfering substances. The practical applicability of the sensor was evaluated through real-sample analysis, where it was successfully used to determine TSC levels in tap water and toothpaste samples. The sensor demonstrated high recovery rates and minimal matrix effects, indicating its suitability for real-world applications. In conclusion, the developed CPE/Y2O3@GCN sensor offers a promising approach for the sensitive, selective, and reliable detection of triclosan in environmental and consumer products.

1. Introduction

Triclosan (TSC, (5-chloro-2-(2,4-dichlorophenoxy)phenol) is a commonly used antimicrobial ingredient that prevents bacterial contamination in a variety of personal care products, including soap, toothpaste, and cosmetics [1]. Its popularity in consumer goods is partly owing to its efficiency in suppressing bacterial development, resulting in broad use in household products and in medical settings [2]. However, the excessive usage of TSC has prompted concerns about its environmental persistence and potential contribution to antimicrobial resistance [3]. Toxicity studies show that TSC can disrupt endocrine functions, particularly by interfering with thyroid hormone metabolism, which poses risks to both human health and wildlife [4]. Furthermore, the byproducts of degradation of TSC, like dioxins, can cause cancer when they accumulate in water sources, which has an adverse effect on aquatic life [5]. For the objective of monitoring TSC’s effects on the environment and biology, a number of chemical techniques have been developed. Because of its accuracy and sensitivity, high-performance liquid chromatography (HPLC) is a common method for identifying TSC in environmental samples [6]. Another common technique is gas chromatography-mass spectrometry (GC-MS), which provides accurate quantification of biological and water samples [7]. Electrochemical sensors offer several advantages for detecting TSC and other analytes in environmental monitoring [8]. They are rapid, sensitive, and often require simple and inexpensive instrumentation. Many are portable, enabling field testing and remote monitoring [9]. Additionally, they are versatile and can be adapted to detect various analytes, including other environmental pollutants [10,11].
Electrochemical sensors offer several advantages for detecting TSC in environmental monitoring. They provide rapid, real-time results, making them suitable for on-site analysis. Their high sensitivity enables the detection of low concentrations of TSC, allowing for early detection and intervention. Additionally, they often require relatively simple and inexpensive instrumentation compared to other techniques like HPLC or GC-MS. Many electrochemical sensors are portable, enabling field testing and remote monitoring. Their versatility allows them to be adapted to detect various analytes, including other environmental pollutants. Furthermore, electrochemical sensors typically require low power, making them suitable for battery-powered devices.
The two-dimensional polymer structure of graphitic carbon nitride (GCN), a carbon-based polymeric nanomaterial, is made up of nitrogen and carbon atoms joined into a stable π-conjugated layered system inside tri-s-triazine rings. This material has a band gap of 2.7 eV and is classified as a semiconductor due to its various degrees of tri-s-triazine ring condensation [12,13,14,15]. The structure of GCN is rich in nitrogen, which serves as a potent electron donor and is the source of its catalytic activity. Due to the existence of the C–N components, which create the framework within the polymer structure, two-dimensional GCN materials have highly specific surface area, excellent thermal and chemical stability, and fast electron transport capabilities [16,17,18]. Additionally, GCN is a metal-free polymeric substance that can be regarded as an environmentally friendly platform for a variety of environmental analytical applications.
In recent years, this highly functional material has been used in immunoassays and for the selective electrochemical sensing of medicines, heavy metals, and pesticides [19,20,21,22]. Yttrium oxide nanoparticles have gained attention in electrochemical sensors due to their stability and unique catalytic properties. Yttrium (Y), which has an atomic number of 39 and an electronic configuration of [Kr]4d15s2, allows it to form stable oxides with properties suitable for high-performance sensors, particularly through enhanced dielectric and thermal stability attributes [23]. Faster electron transmission is made possible by Y2O3’s high dielectric constant, which is advantageous for developing sensitive detection systems in electrochemical applications. Because of the material’s inherent thermal stability, sensors may perform in a variety of environmental settings and retain their integrity under trying conditions [24]. Y2O3 nanoparticles are made using a variety of synthesis techniques, including sol–gel, hydrothermal, and electrochemical pathways, each of which affects the particles’ size, surface area, and shape [23]. While hydrothermal synthesis offers sufficient control over particle size and crystallinity, both of which are critical for optimal surface area and catalytic behavior, sol–gel is especially prized for creating homogenous and fine-sized particles. Y2O3 nanoparticles are frequently used as coatings or embedded in polymer matrices in electrochemical applications, increasing the electrochemical surface area and promoting quicker redox reactions that are essential in sensors for the detection of metal ions, organic contaminants, and biological markers [25,26,27]. Because of its effectiveness in controlling particle size and shape, the Pechini method is a well-liked synthesis process for creating metal oxide nanoparticles that are frequently utilized in sensor development. Using this technique, metal ions are chelated with organic acids, then polymerized to create a homogeneous gel that, when calcined, produces highly pure and homogeneous nanoparticles [28]. Furthermore, the Pechini approach produces nanoparticles with superior stability and improved electron transport characteristics, all of which are critical for high-performance sensor applications [29]. The method’s versatility and cost-effectiveness make it a valuable technique in developing efficient, sensitive, and selective sensor devices.
In this paper, for the first time, the modified variant of the Pechini process was used to synthesize yttrium oxide nanoparticles (Y2O3). For the sensitive and specific electrochemical detection of TSC, this study effectively illustrates the potential of a novel carbon paste electrode (CPE) enhanced with graphitic carbon nitride and yttrium oxide nanoparticles. Due to the synergistic effects of GCN and Y2O3, which are expected to have higher surface area and superior electron transport characteristics, the CPE/Y2O3@GCN composite electrode should offer increased electrocatalytic activity.

2. Materials and Methods

Yttrium (III) chloride hexahydrate (YCl3 × 6H2O), anhydrous citric acid (C6H8O7), acrylic acid (CH2=CHCOOH), hydroquinone (C6H4(OH)2), melamine (C3H6N6), acetonitrile (H3C−C≡N), sodium hydroxide (NaOH), potassium ferrocyanide (K4[Fe(CN)6]), potassium ferricyanide (K3[Fe(CN)6]), potassium chloride (KCl), and triclosan (C12H7Cl3O2) were obtained from Sigma-Aldrich and directly used for experimental investigations without purification or pretreatment. Britton–Robinson buffer solution (BRBS) was prepared by mixing equimolar amounts of phosphoric, acetic, and boric acids (40 mM). The desired pH values were adjusted using a 0.2 M NaOH solution. All pH measurements were performed using a pH meter equipped with a universal glass electrode (Orion 1230, Thermo Fisher Scientific, Waltham, MA, USA). Double-distilled water was used for all solutions.
A potentiostat/galvanostat Autolab, model PGSTAT302N (Metrohm, Bijdorpplein, Netherlands), was used for electrochemical measurements, including cyclic voltammetry, square wave voltammetry, and differential pulse voltammetry. A classical three-electrode system was employed, consisting of a modified or pristine CPE as the working electrode (WE), a platinum plate as the counter electrode (CE), and an Ag/AgCl (3 M KCl) reference electrode (RE). Electrochemical impedance spectroscopy (EIS) measurements were performed using a potentiostat/galvanostat CHI 760b (CH Instruments, Inc., Austin, TX, USA). The morphology of Y2O3 was analyzed using a JEM-2100F (JEOL, Tokyo, Japan) transmission electron microscope (TEM) operating at 200 kV and a JSM-7001F (JEOL, Tokyo, Japan) scanning electron microscope (FE-SEM) equipped with an EDS analyzer (Oxford Instruments, Oxford Instruments, Abingdon, UK). The SEM electron accelerating voltage was set to 20 kV for accurate quantitative EDS analysis. The crystal structure of the prepared materials was analyzed using X-ray powder diffraction (XRPD) on a SmartLab® (Rigaku, Tokyo, Japan) diffractometer with a Cu Kα radiation source (λ = 1.5406 Å). The instrument operated at 40 kV and 30 mA. Measurements were conducted on a dried powder, scanning with a 2θ range of 10°–70° at a scan rate of 0.5°/min and a step size of 0.02°. The surface chemistry of the Y2O3 nanoparticles, as well as composite materials, was examined within the mid-infrared region (4000–400 cm−1) using ATR-FTIR spectroscopy (Nicolet iS50, Thermo Fisher Scientific, Waltham, MA, USA) with a Smart iTR ATR. Powdered samples were flattened with a diamond crystal plate using a pivot press for optimal exposure. Background spectra collected from a clean diamond crystal were subtracted using the OMNIC™ Spectra Software (OMNIC 9.2.98).

2.1. Preparation of Y2O3 Nanoparticles

The Y2O3 nanoparticles were prepared using a modified procedure described by Zaki et al. [30] (Scheme 1). A 0.1% hydroquinone solution (0.01 g of hydroquinone in 10 mL water) was mixed with 0.006 mol of anhydrous citric acid (1.15272 g) and 0.005 mol of acrylic acid (0.343 mL) in a three-neck round-bottom flask equipped with a thermometer and condenser. The mixture was heated gradually to 120–170 °C, resulting in esterification at around 120 °C and polymerization at higher temperatures. This process yielded a viscous, pale-yellow polymer. A 5% aqueous solution of yttrium(III) chloride hexahydrate (1.3653 g YCl3 × 6H2O in 25.9407 g distilled water) was added to the polymer solution and stirred for an hour. The solution was then dried overnight at 150 °C to obtain solid, porous resins. These resins were ground in an agate mortar and calcined at 450 °C for four hours in glazed alumina crucibles. This high-temperature calcination process decomposed the organic components and yielded Y2O3 nanoparticles.

2.2. Preparation of Graphitic Carbon Nitride (GCN) and Y2O3@GCN Nanocomposite

For GCN synthesis, melamine was heated in air for 120 min, reaching a temperature of 600 °C. As GCN was formed, the white powder became a pale-yellow color [31].
The Y2O3@GCN composite was synthesized following the procedure outlined in [32], with a minor modification: DMF was used instead of ethanol. The yttrium oxide and GCN were mixed in a 1:1 ratio (Scheme 1).

2.3. Preparation of Carbon Paste Electrode and Real-World Samples Analysis

The modification of CPE was performed by mixing 72 mg of carbon and 8 mg of Y2O3@GCN composite with 20 µL of paraffin oil in a mortar (Scheme 1). The best ratio of GCN:Y2O3 was 5:1. After homogenizing the mixture, the substance was allowed to absorb the paraffin oil and obtain a finely distributed particle size overnight. Real-world samples were analyzed as follows: a total of 1 mg of toothpaste was dispersed in 10 mL of pH 7.0 BRBS, while tap water samples were directly measured in pH 7.0 BRBS, with different spiking concentrations of TSC (10.0 μM, 20.0 μM, and 40.0 μM).

3. Results and Discussion

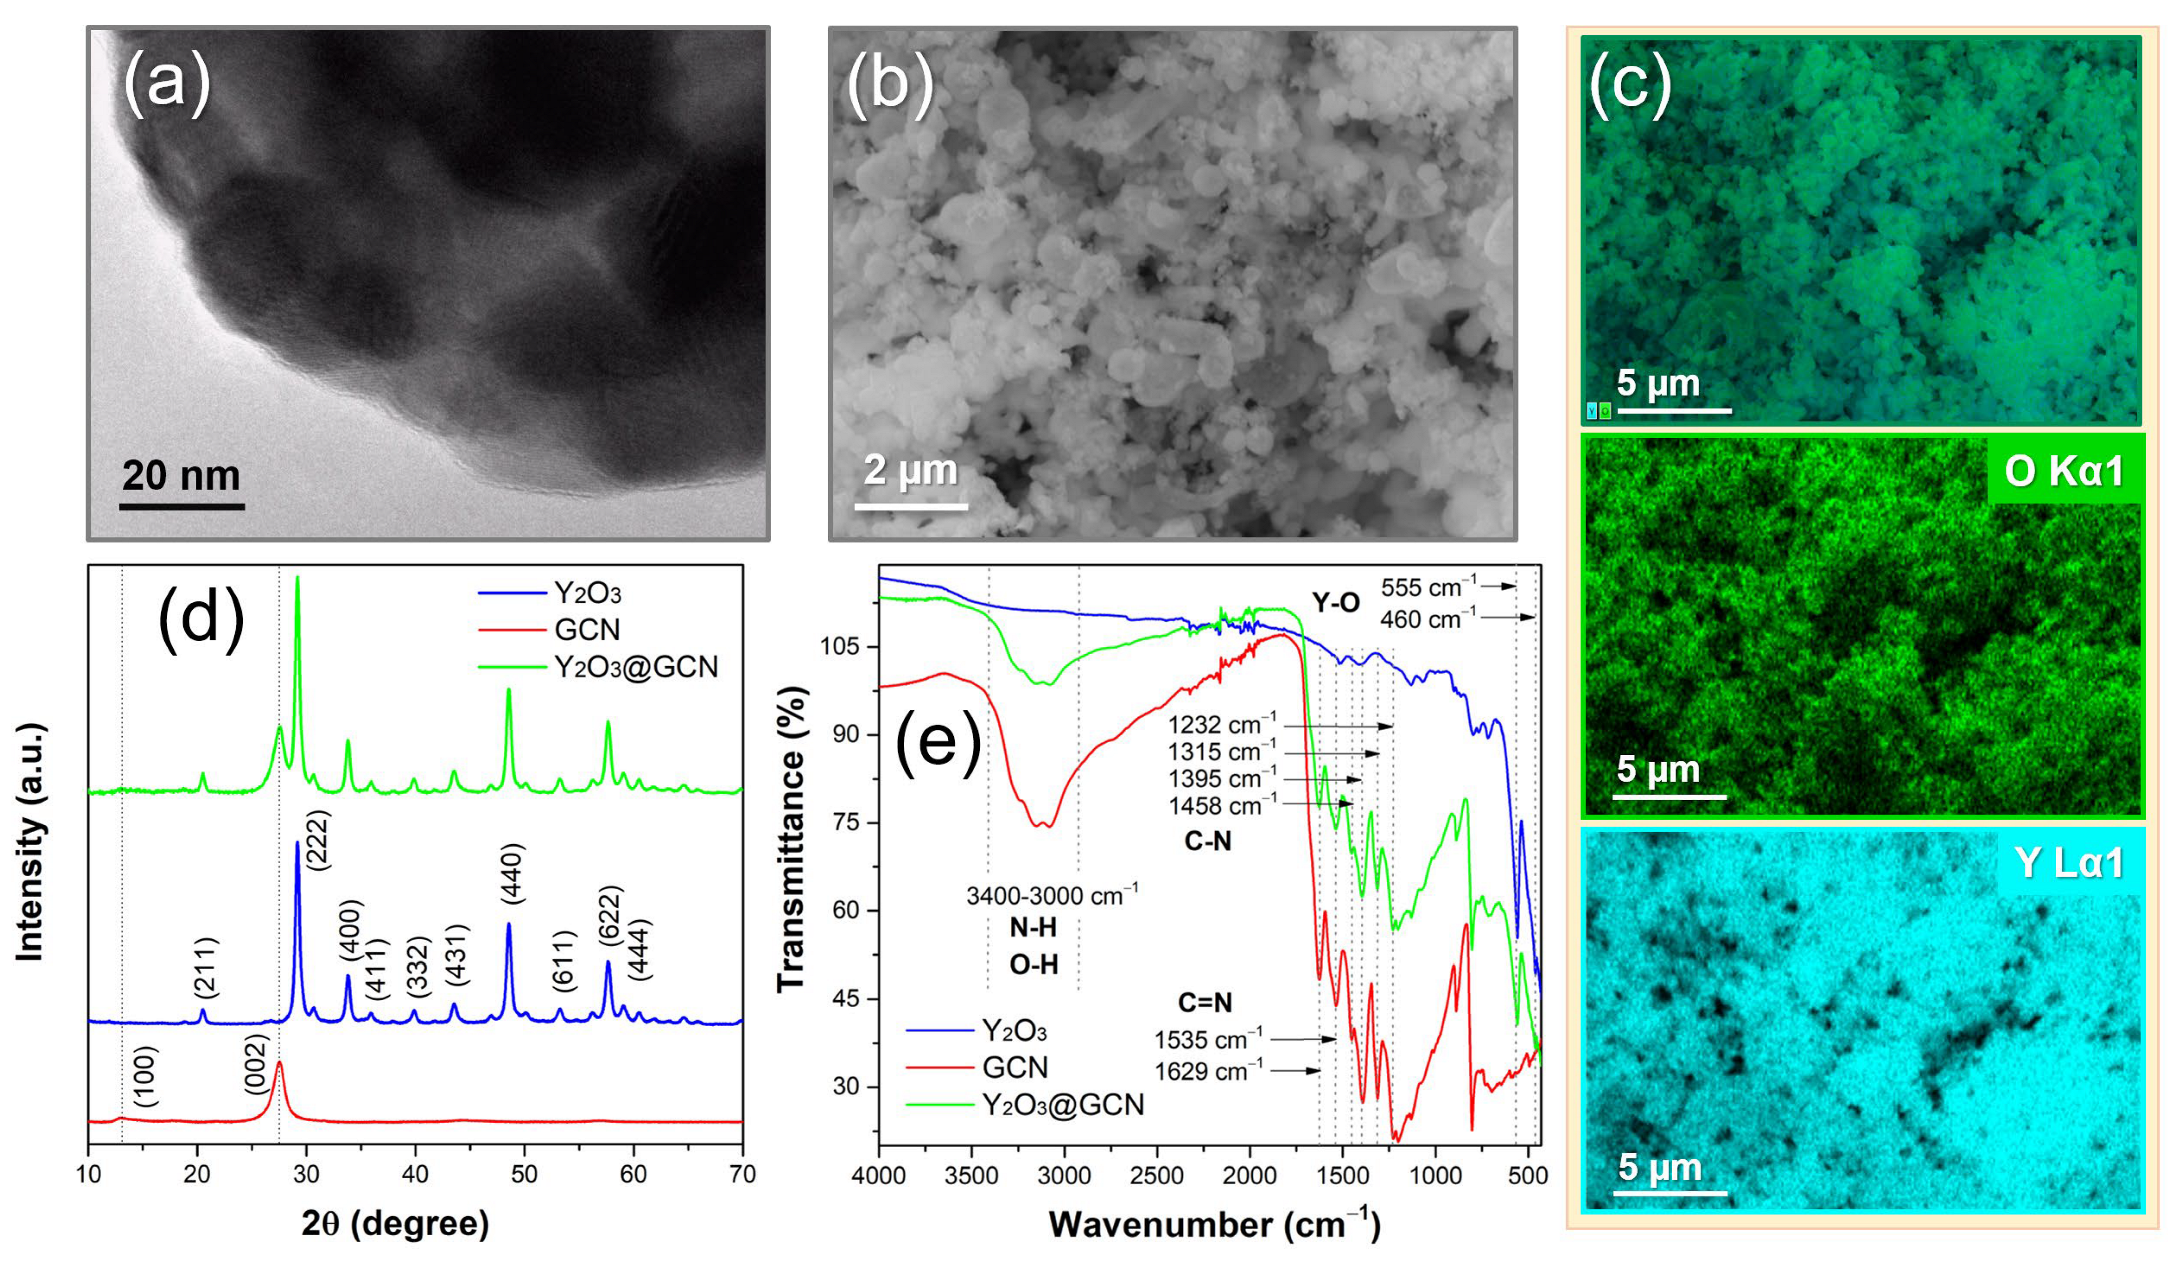
3.1. Structural and Morphological Characterization of Nanocomposite Materials

The analysis of the morphology of yttrium oxide nanoparticles was performed using transmission electron microscopy (TEM) and field emission scanning electron microscopy (FE-SEM). As shown in Figure 1a, Y3O2 nanoparticles are quasi-spherical in size between 20 nm and 30 nm, with distinctive crystal plane arrangements. The particles are agglomerated into larger structures. The SEM analysis revealed that the yttrium oxide nanoparticles are shaped spherically and pill-like, stacked one on top of another with a highly specific surface area, suitable for potential electroanalytical applications. FE-SEM analysis showed that Y and O atoms are uniformly scattered throughout the sample, with 30.5% of Y and 69.5% of O atoms in the analyzed part of the sample (Figure 1b,c). The XRD patterns reveal that all diffraction peaks can be indexed to the cubic Y2O3 structure (JCPDS #41-1105), and no peak from any other phases of Y2O3 and impurities was observed, confirming the formation of single-phase highly pure cubic Y2O3 (Figure 1d) [33]. The average crystallite size was assessed using the Scherrer formula, and the most intensive diffraction maximum was found to be (20 ± 2) nm, which agrees with the TEM results, indicating a large surface of yttrium oxide nanoparticles. The diffraction pattern of GCN exhibits two characteristic peaks at 12.9° and 27.5°, corresponding to the (100) and (002) planes of GCN, respectively [34]. The presence of the (002) peak of GC in the nanocomposite pattern confirms the successful formation of the Y2O3@GCN nanocomposite material.
Additionally, FT-IR analysis showed the presence of metal–oxygen stretching vibrations of cubic Y2O3 at 555−1 and 460 cm−1, without the significant presence of other bands (Figure 1e). This is further confirmation of the formation of cubic Y2O3 nanoparticles, which was found after XRD analysis [33]. The GCN spectrum revealed intense absorption bands in the spectral range of 1100–1750 cm−1. The peaks observed at approximately 1232, 1315, 1395, and 1458 cm−1 are assigned to C-N stretching vibrations in aromatic rings [35]. The presence of peaks at 1535 and 1629 cm−1 confirms the existence of C=N stretching vibrations [36]. The distinct peak at 810 cm−1 is indicative of the characteristic breathing mode of the s-triazine ring. Broad bands observed between 3000 and 3400 cm−1 are attributed to N-H and O-H stretching vibrations, likely arising from adsorbed water molecules. The Y2O3@GCN composite spectra exhibited all the characteristic vibrational modes previously discussed, providing additional evidence for the successful formation of the nanocomposite.

3.2. Electrochemical Characterization of the Nanocomposite

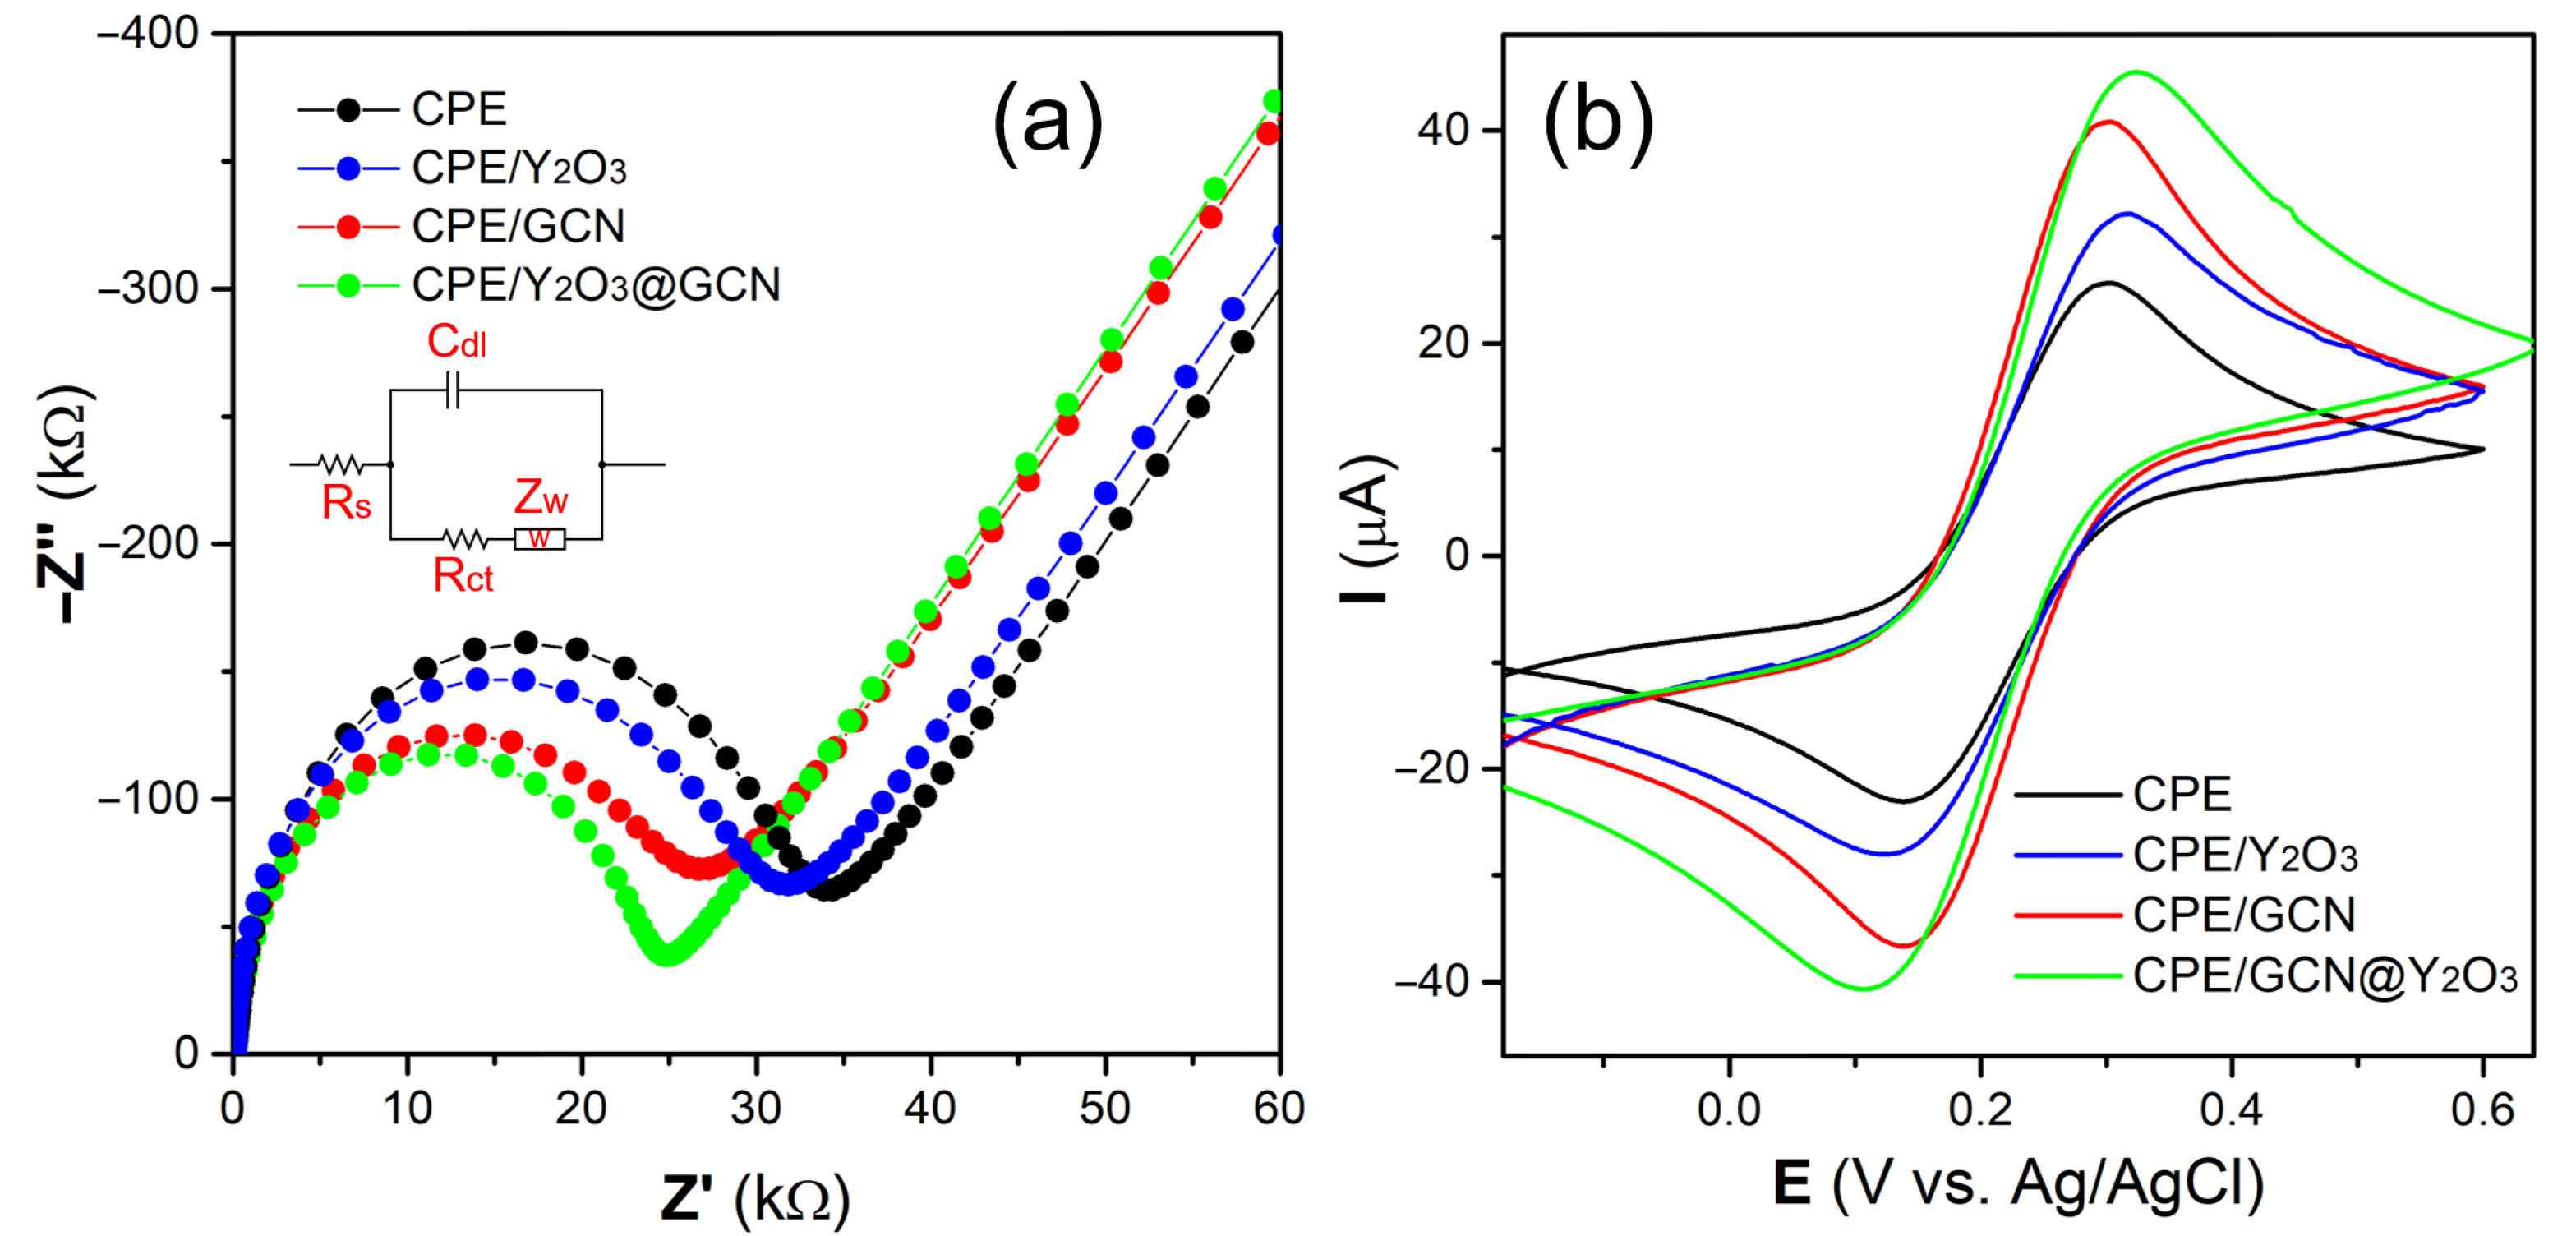
3.2.1. Electrochemical Impedance Spectroscopy and Cyclic Voltammetry Analysis

Electrochemical impedance spectroscopy (EIS) is a crucial technique used to analyze the electrical properties of changed electrode surfaces and their capacity to conduct electrons. Figure 2a presents the Nyquist plot, showing the relationship between Z′ and −Z″ for four different samples: pristine CPE, CPE/Y2O3, CPE/GCN, and CPE/Y2O3@GCN. These measurements were conducted in a 0.1 M KCl solution containing 5 mM of [Fe(CN)6]3−/4− ions, with the frequency ranging from 0.01 Hz to 100 kHz. The impedance data were modeled using the Randles circuit and are shown as inset of Figure 2a. In this circuit, Rct represents the resistance to charge transfer; Rs is the resistance of the electrolyte; Zw stands for the Warburg impedance, and Q represents the capacitance of the double layer [37,38]. On the Nyquist plots, the Rct and Zw components of the Randles circuit were seen to be in parallel with Q, forming a semicircle [39]. The Rct value of both the unmodified and modified electrodes is determined by the size of the semicircle formed in the electrochemical impedance spectroscopy plot. The diameter of this semicircle corresponds to the Rct value, which indicates the rate of electron transfer of the redox probe at the interface between the electrode and electrolyte. As seen from the Nyquist plot, the unmodified CPE exhibited a wide semicircle, resulting in the highest Rct value (34,317 Ω) compared to the modified electrodes. This indicated that CPE without any additional components may have had a lower number of active sites and limited capacity for electron and mass transfer. The CPE/Y2O3 structure at the nanoscale showed a reduced Rct value (31,629 Ω) compared to the unmodified CPE due to its enhanced surface area, increased number of active sites, and promotion of efficient electron transport. The CPE/GCN exhibited a much lower Rct value (27,026 Ω) in comparison to the previously mentioned electrodes, while the CPE/Y2O3@GCN has the lowest Rct value of 25,030 Ω, compared to all modified and pristine GCE. This may be attributed to the structural coupling of Y2O3 nanoparticles with GCN, since both structures possess large surface areas, which facilitates fast electron transfer. The resulting composite revealed significant synergistic effects between Y2O3 and pristine GCN, leading to the enhanced electrocatalytic activity of this modified electrode. Due to these characteristics, CPE/Y2O3@GCN shows fast electron transfer capability and low charge transfer resistance, making it a viable material for the advancement of electrochemical sensor applications.
The mass transfer capacity and electron transfer properties of the pristine CPE and the modified electrodes were also investigated by cyclic voltammetry (CV). Figure 2b illustrates the CV outcomes for unmodified and various modified carbon paste electrodes (CPE) in a solution containing 5 mM [Fe(CN)6]3−/4− and 0.1 M KCl, at a scan rate of 50 mV s−1. The obtained CV results indicated that the unmodified CPE had a deficient redox current response in comparison to the other electrodes that underwent modifications (Figure 2b). Upon examining the CV profiles, it is evident that the CPE/Y2O3@GCN provides the highest redox peak current values (Ipa = 50.1 µA and Ipc = 43.9 µA) in comparison to the other modified and unmodified CPEs. The main determinant of the maximum redox current response of CPE/Y2O3@GCN during electrocatalysis was the increased surface area of the synthesized Y2O3@GCN composite. This larger surface area facilitated the formation of an optimal electrode–electrolyte interface, enabling the efficient accumulation of charges or ions and promoting rapid electron transfer.

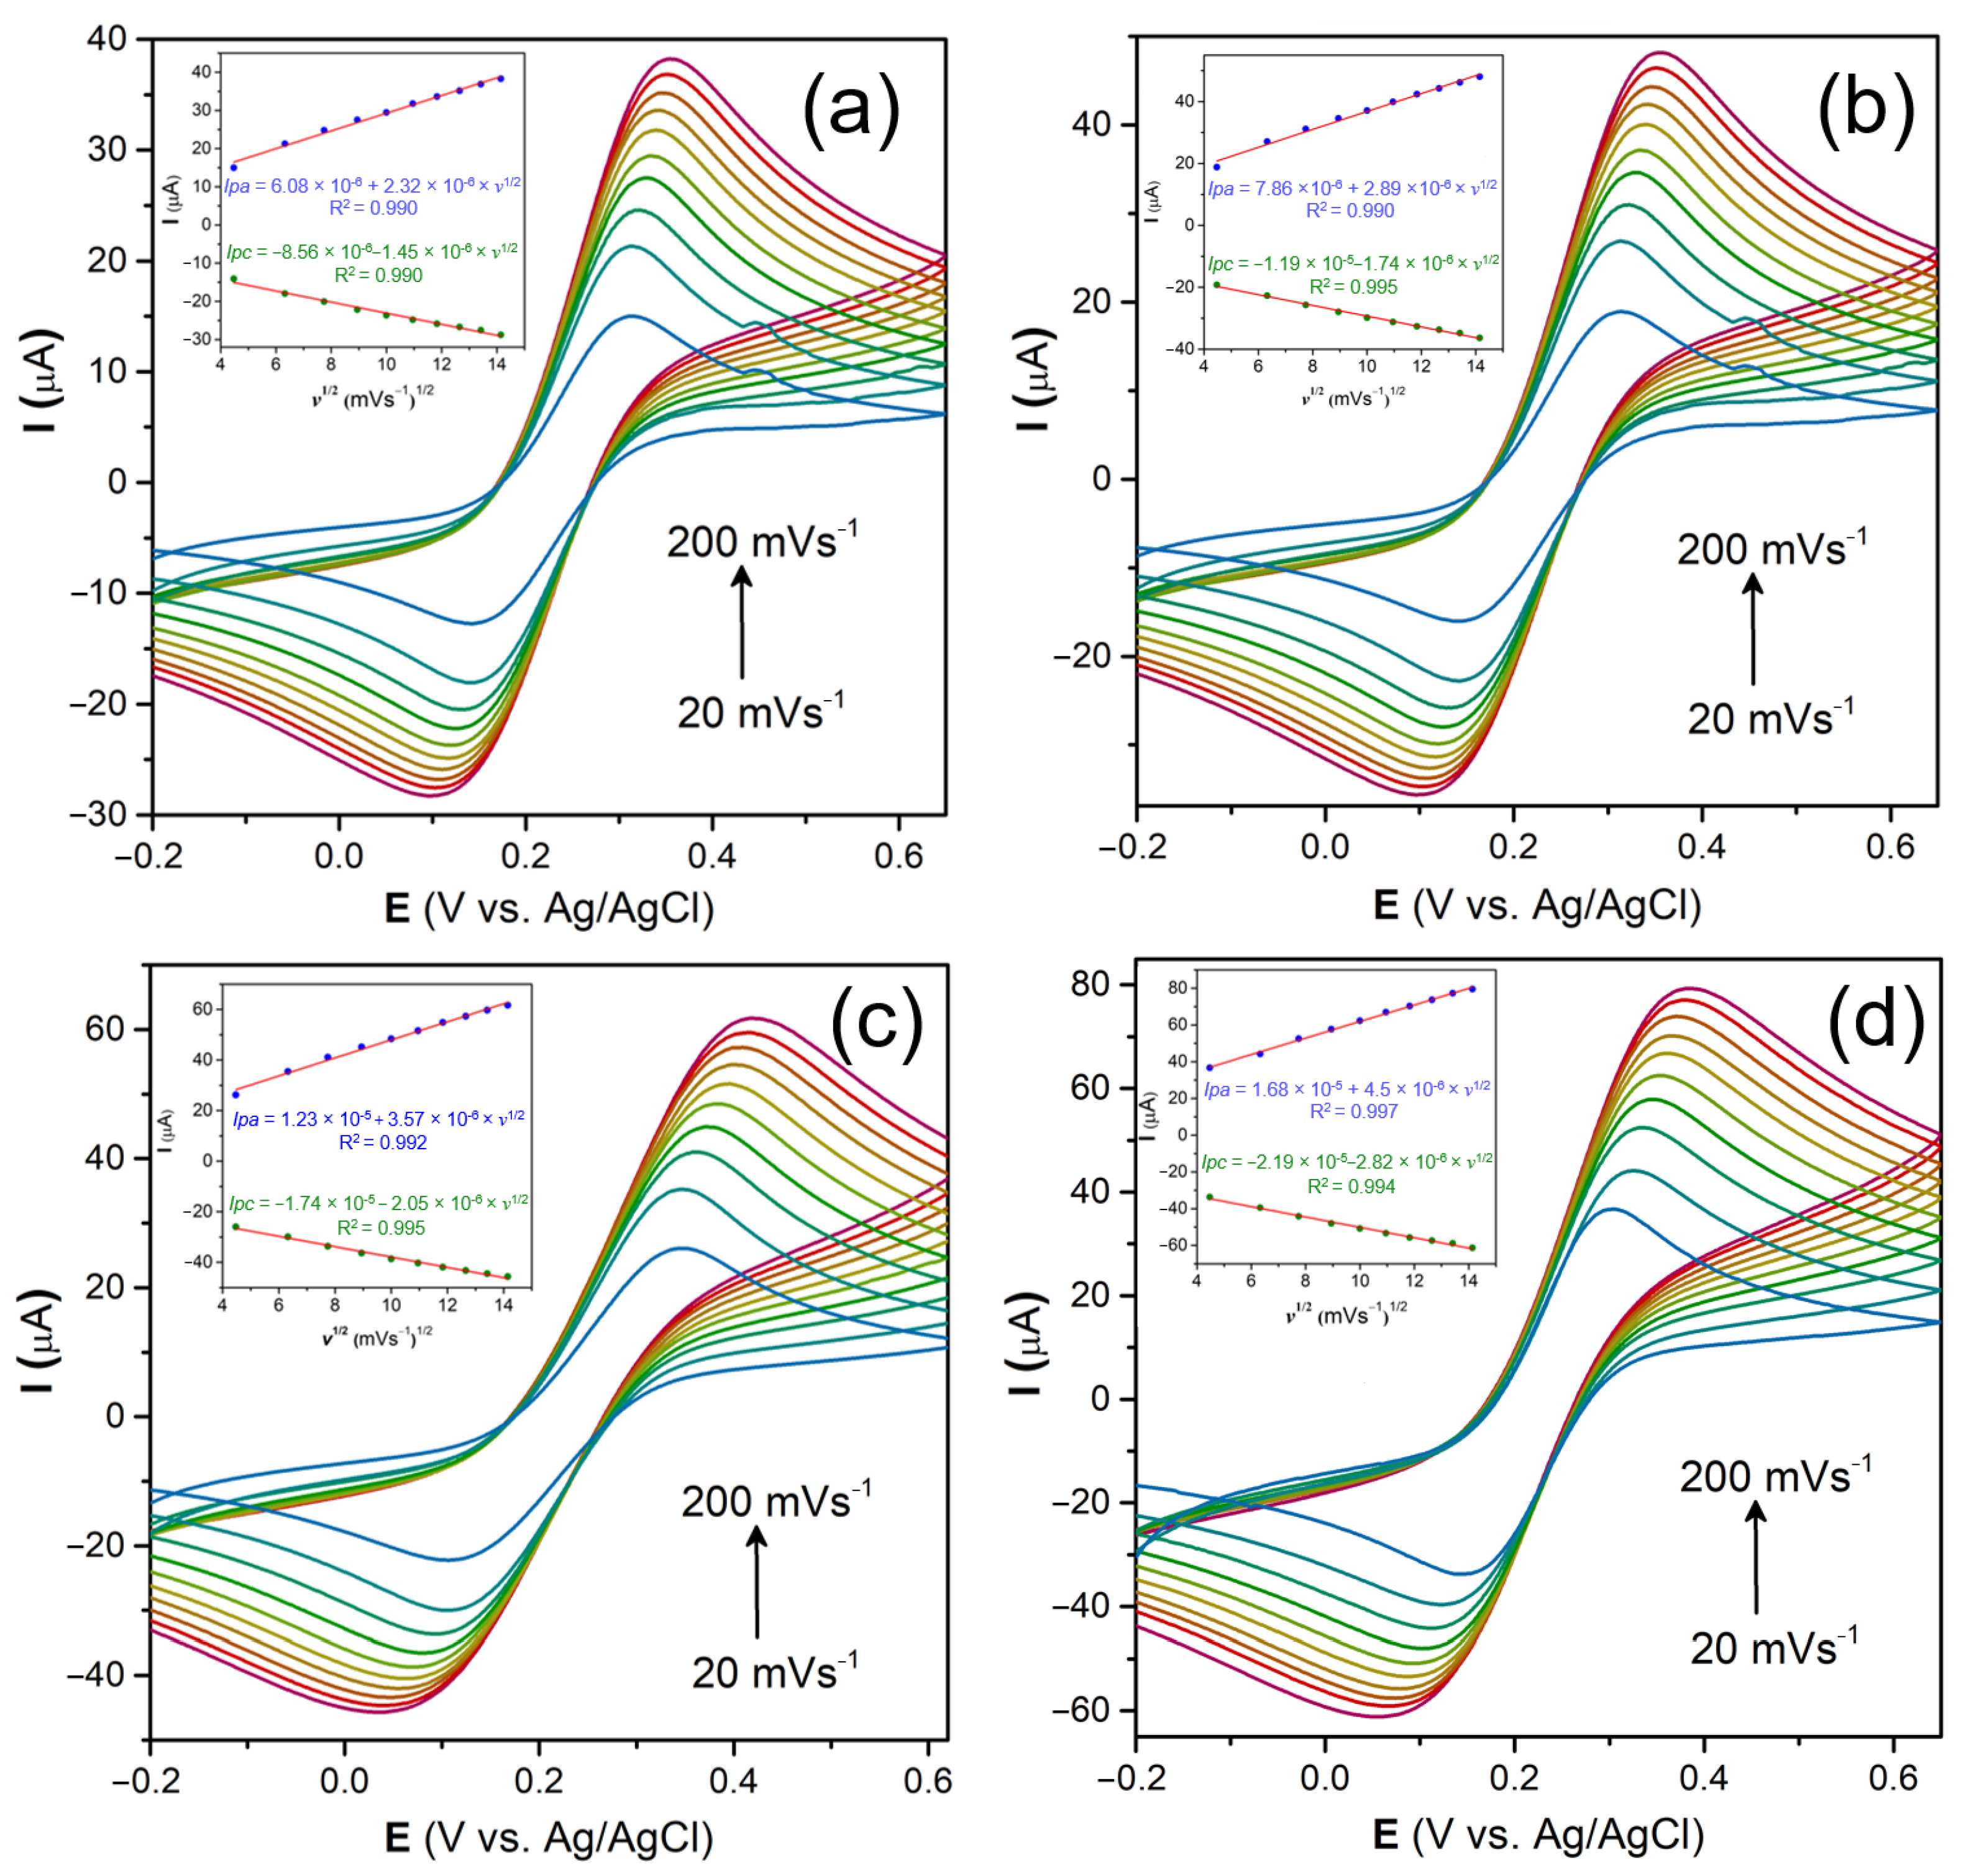
3.2.2. Scan Rate Measurements

The influence of the scan rate on the peak currents was also examined and then used to assess the electrochemical surface area of the modified electrodes. Moreover, a direct relationship is revealed when the present intensity values are graphed against the square root of the scanning rate. Figure 3a shows the linear relationship between redox peak current levels and scan rates. The scan speeds ranged from 20 mV s−1 to 200 mV s−1. Based on the CV data, it was also observed that the CPE/Y2O3@GCN exhibited a higher redox peak current than the other electrodes at all studied scan rates.
Furthermore, both the anodic (Ia) and cathodic (Ic) peak currents showed a strong linear relationship with the square root of the scanning rate. This suggests that the material facilitated a rapid redox reaction. The linear dependences may be described by the following equations:
I (A) = 1.68 × 10⁻⁵ + 4.5 × 10⁻⁶ υ1/2 (V s−1)1/2 (R2 = 0.997) for Ia, and
I (A) = −2.19 × 10⁻⁵ − 2.82 × 10⁻⁶ υ1/2 (V s−1)1/2 (R2 = 0.994) for Ic.
These data suggest that the processes taking place on the CPE/Y2O3@GCN-modified electrode are regulated via diffusion in redox [Fe(CN)6]3−/4− probe.
The Randles–Sevcik equation, Equation (1), was used to compute the electrochemical active surface area (EASA) of the redox reaction:
Ipa = (2.69 × 10⁵) × A × n3/2 × D1/2 × C × v½,
For K3[Fe(CN)6], n = 1, and D = 7.6 × 10⁻⁵ cm2 s−1.
The EASAs of the modified electrodes were determined using Randle’s slope and found to be 0.0152 cm2, 0.0118 cm2, 0.0092 cm2, and 0.0073 cm2 for the CPE/Y2O3@GCN, CPE/GCN, CPE/Y2O3, and pristine CPE, respectively. The results demonstrate that the CPE/Y2O3@GCN nanocomposite has the highest EASA value, making it an excellent choice for electrochemical sensor applications (Figure 3b–d). The calculated EASAs of the electrodes were used to calculate the surface coverages and surface concentrations (SC) of electroactive species on the modified electrode, using the Brown–Anson equation, Equation (2):
I p a = n 2 F 2 C A v 4 R T ,
where F is the Faraday constant (96,500 C/mol); n is the number of electrons transferred (n = 1); A is the electrode surface area (A = 0.0152 cm2); R is the gas constant (R = 8.314 Jmol−1 K−1); Ipa is the oxidation current; C is the surface concentration of the absorbed electroactive species (C), and v is the scan rate (20 mV s−1). From this equation, the SC of CPE/Y2O3@GCN was evaluated to be 1.30 × 10¹⁰ mol dm−2. CPE/Y2O3@GCN has shown very low charge transfer resistance (Rct), a significant electrochemical active surface area, and an efficient surface concentration. Moreover, the CPE/Y2O3@GCN exhibits a supercapacitor effect, which may enhance the increase in current density in the desired direction. Collectively, these components enhanced the electrocatalytic activity, making it beneficial to use as an electrochemical sensor for selected TSC and as a widely used ingredient for many consumer products.

3.3. Electrochemical Detection of TSC

The main goal of this study is to create an electrochemical sensor for the sensitive detection of TSC. The sensor has been made using a composite material of CPE/Y2O3@GCN. The electrocatalytic activity of TSC was assessed using the CV method at several electrode configurations, including pristine carbon paste electrode (CPE), CPE modified with yttrium oxide nanoparticles, CPE with graphitic carbon nitride (GCN), and CPE with GCN coated with Y2O3 (CPE/Y2O3@GCN). Figure 4 illustrates the current response of 100 µM TSC at the examined electrodes: pristine CPE, CPE/Y2O3, CPE/GCN, and CPE/Y2O3@GCN, in a BR buffer solution pH 7.0 at a scan rate of 50 mV s−1 (Figure 4a). The inset of Figure 4a displays a bar graph that represents anodic peak currents at modified electrodes which occurs at a potential of 0.62 V. The results showed that the unmodified CPE had a lower current response compared to the other modified electrodes, confirming a reduced electron transfer. The CPE/Y2O3@GCN exhibited the largest oxidation peak current in comparison to the pristine and other modified CPEs. Based on these findings, it can be concluded that the CPE/Y2O3@GCN exhibit a 2.3-fold increase in peak current compared to the pristine CPE, and it is a suitable material for electrochemical detection of TSC.
Three primary factors that might influence the electrochemical oxidation of TSC include the varying quantities of TSC, the examination of scan rate, and the variable pH of BR buffer solutions. In order to understand the electrocatalytic kinetics of CPE/Y2O3@GCN in the presence of TSC using the CV method, research was conducted to analyze the effects of various scan rates.
The plot of peak current (Ip) vs. the square root of scan rate (v1/2) in Figure 4b,c shows a linear relationship over the entire range of scan rates examined. This indicates that the system follows the characteristics of a conventional diffusion-regulated current system. The equation that describes this relationship is as follows:
Ip (A) = 3.13 × 10⁻⁷ × v½ − 5.48 × 10⁻⁸, with an R2 value of 0.992.
In addition, the relationship between the logarithm of the scan rate (log v) and the peak current (log Ip) is presented in Figure 4d. The linear relationship, with a slope of 0.49, was found, which closely aligns with the anticipated theoretical value of 0.5 for a diffusion-controlled process:
log Ip (A) = 0.49 × log v − 6.508, R2 = 0.995.

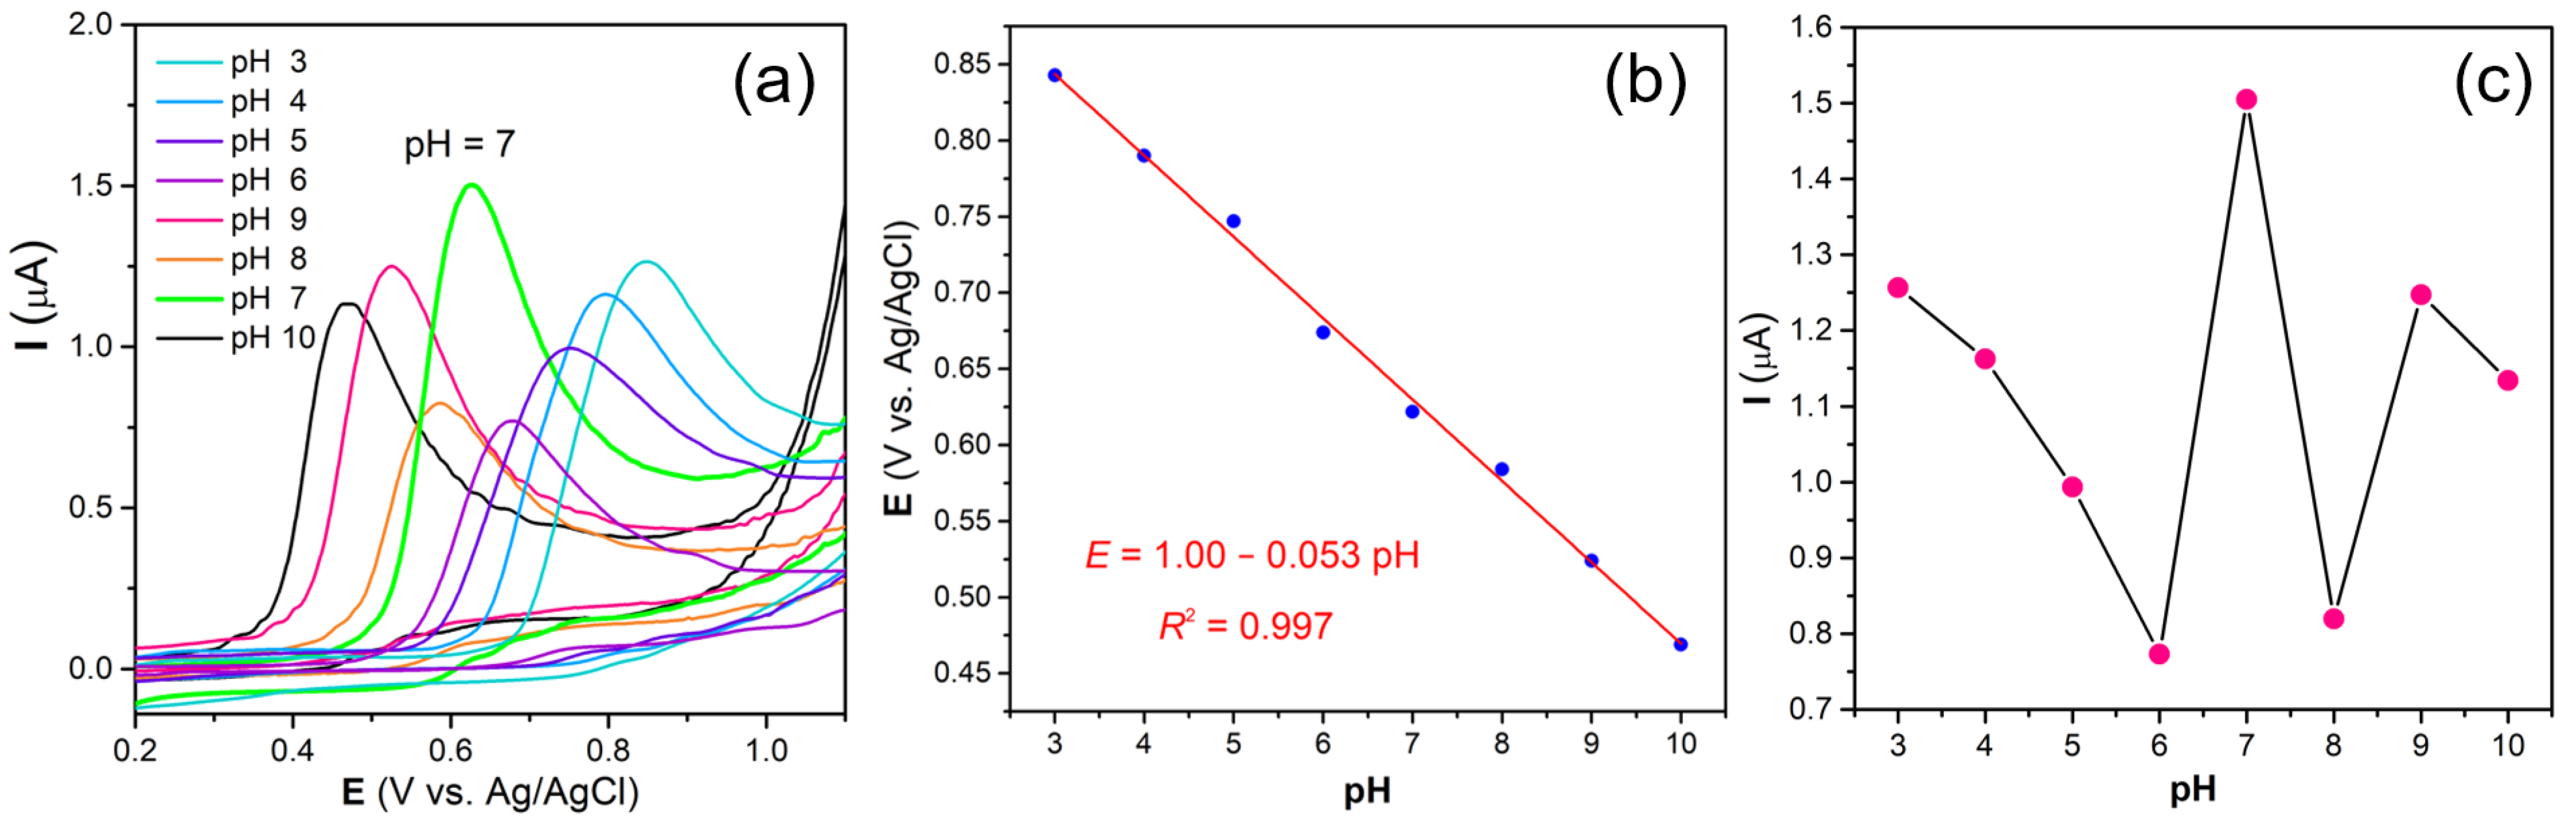
3.4. pH Optimization of Working Solutions

The pH range of the supporting electrolyte has a significant impact on the performance and function of the TSC sensor. The CV study, which is shown in Figure 5a, was performed using 100 µM of TSC in BRBS at various pH ranges (3.0–10.0) and at a scan rate of 50 mV s−1. The obtained result showed that the anodic peak potential (Epa) was shifted to the negative direction when the pH of the BRBS increased, indicating that protons played a part in the electrochemical reaction of TSC.
Considering the obtained results, the pH 7.0 of BRBS was chosen as the optimal pH value for further electrochemical research due to it being the highest peak current. The linear relationship for pH vs. Epa is shown in Figure 5b. The linear regression equation and the correlation coefficient were calculated as follows:
Epa = −0.053 pH + 1.00 and R2 = 0.997.
Then, the obtained slope value was used in the Nernst equation, Equation (3), for calculating proton/electron ratio in an electrochemical reaction:
E p = 0.0591   m n p H + b,
where m and n are the number of protons and electrons, respectively. Based on Equation (3), the m/n ratio was calculated to be 0.896 ≈ 1 for TSC, suggesting that an equal number of protons and electrons are involved in the electrochemical oxidation reaction of TSC at CPE/Y2O3@GCN. As stated, the oxidation mechanism of TCS at the CPE/Y2O3@GCN electrode involves a one-electron, one-proton transfer process and can be explained, whereby the oxidation reaction targets the phenolic hydroxyl group of TCS, generating a resonance-stabilized phenoxy radical, which is in agreement with the literature [40,41,42]. The effect of pH on peak current was given in Figure 5c graphically, explaining why the pH 7.0 of BRBS was chosen as the optimal for further research.

3.5. Determination of TSC via SWV Analysis

The square wave voltammetric (SWV) method was selected to establish the analytical electrochemical procedure for determining TCS using the modified CPE because compared to the differential pulse voltammetry (DPV) technique, it gives several times stronger response to TSC (Figure 6a). As part of developing the electroanalytical procedure, the instrumental parameters of SWV that could affect the current response of the analyte are optimized. The instrumental parameters, such as step potential, frequency, and amplitude, were analyzed to find the most effective experimental setup for measuring TSC using SWV. During the optimization process, each parameter was systematically altered while the others were held constant. The SWV was calibrated with an amplitude of 30 mV, a frequency of 10 Hz, and a potential step of 4 mV, chosen based on the target analyte’s optimal peak shape and the highest peak current. Hence, the SWV technique was used to examine the responsiveness of the suggested sensor for TSC in BR buffer solution with a pH of 7.0. The SWV profiles, recorded under the optimized experimental conditions, at various TSC concentration are shown in Figure 6b, while the corresponding calibration curve is presented in Figure 6c. When the concentrations of TSC changed from 0.5 µM to 100 µM, the oxidation peak current response of TSC also showed a linear increase. The computed linear regression equation with correlation coefficient for determining TSC in the examined range of concentrations is calculated as follows:
y = 6.36 × 10⁻⁷ [TSC] (µM) + 3.21 × 10⁻⁸, R2 = 0.992.
These results established that the CPE/Y2O3@GCN had a good electrocatalytic activity toward TSC. The limit of detection (LOD) and limit of quantitation (LOQ) were calculated using the standard equation method by following the corresponding equations, LOD = 3 × S/q and LOQ = 10 × S/q, where S is the standard deviation obtained from the five measurements of the blank signal (0.0015 μA), and q is the calibration plot slope value (0.0321 μA μM−1). The calculated LOD and LOQ values are 0.137 µM and 0.455 µM, respectively. To assess the reproducibility of the proposed sensor, six consecutive SWV measurements in 10 µM TSC were performed under identical conditions (Figure 7). The relative standard deviation (RSD) of the current responses was calculated to be 4.46%. Additionally, five independently prepared CPE/Y2O3@GCN electrodes were tested under the same conditions, resulting in an RSD of 4.71% for the peak current obtained from 10 µM TSC measurements. The stability of the CPE/Y2O3@GCN sensor was evaluated by comparing the initial electrochemical response to that obtained after one week of storage. No significant change in the peak current was observed, indicating excellent stability.
The sensitivity value of the proposed sensor was found to be 2.112 µA µM−1 cm−2 (calculated as a ratio of the calibration slope value and the electroactive surface area of working electrode). Based on these results, the CPE/Y2O3@GCN can be considered as a promising sensor for the detection of TSC in real-world samples. As shown in Table 1, all of the results achieved and presented here, using various working electrodes, are comparable to those reported in the literature. Compared to the sensor proposed in this study, developing sensors with superior analytical performance, such as a lower detection limit and/or a wider linear range, is typically far more difficult and time consuming.

3.6. Interference and Practical Application Studies

The selectivity of the proposed sensor was investigated by utilizing a variety of anions, cations, and organic compounds to demonstrate its validity in a real-world application. The interference investigation was conducted under the optimal conditions for the determination of 100 μM TSC, with a 1:10 ratio of the analyte to the interferents. The TSC responses were not influenced by uric acid, ascorbic acid, mannose, or glucose, as illustrated in Figure 8a. In addition, no substantial interferences from common ions, including Na+, K+, Ca2+, Mg2+, Cu2+, and Pb2+, were observed, even at concentrations that were 100-fold higher. It can be concluded that the proposed technique is capable of accurately detecting TSC in a complex matrix with minimal interference from the factors mentioned above, as a signal change of at least 5% is considered substantially interfering.
The practical usability of our suggested CPE/Y2O3@GCN sensor was examined by spiking selected samples and determining TCS from the calibration curve. The CPE/Y2O3@GCN sensor was used to calculate the TSC level in samples of tap water and toothpaste. The real-sample preparation procedure was described in Materials and Methods. Before injecting known TSC concentrations (10 µM, 20 µM, and 40 µM) into the pre-treated samples in the optimized SWV experiment, we first measured the blank current response in the experiment (Figure 8b,c). The results showed that the recovery went back from 94% to 117.5%, and the tested solution matrix had no impact. Therefore, it can be inferred from these measurements and recovery values that the suggested approach is acceptable for determining TSC in the tap water and toothpaste samples. The results for the detection of TSC in different samples before and after spiking at the developed CPE/Y2O3@GCN sensor are summarized in Table 2.

4. Conclusions

The study successfully developed a highly sensitive and selective electrochemical sensor for triclosan detection, leveraging the synergistic effects of Y2O3 and GCN nanoparticles integrated into a carbon paste electrode. This innovative approach resulted in a sensor with a low detection limit of 0.137 µM, a wide linear range of 0.5–100 µM, and excellent stability as well as reproducibility. The sensor’s superior performance was validated through successful application to real-world samples, including tap water and toothpaste. This research holds significant promise for the development of advanced electrochemical sensors, offering potential for on-site monitoring and early detection of various environmental pollutants and other analytes of interest.

Author Contributions

Conceptualization, A.M., M.O., S.Đ., B.B.P. and D.M.S.; methodology, M.O., S.Đ., V.S., T.M. and D.M.S.; validation, T.M. and B.B.P.; formal analysis, A.M., S.Đ., V.S. and D.M.S.; investigation, A.M., M.O., V.S. and T.M.; resources, S.Đ.; writing—original draft preparation, A.M., M.O. and D.M.S.; writing—review and editing, M.O., V.S., B.B.P. and D.M.S.; supervision, M.O., B.B.P. and D.M.S. All authors have read and agreed to the published version of the manuscript.

Funding

Financial support for this study was granted by the Ministry of Science Technological Development and Innovation of the Republic of Serbia Grant Nos. 451-03-65/2024-03/200123, 451-03-66/2024-03/200026 and 451-03-66/2024-03/200168 and the Faculty of Sciences and Mathematics, University of Priština in Kosovska Mitrovica, Project Number IJ-2301. This research was also funded by the European Union, MOBILES (monitoring and detection of biotic and abiotic pollutants by electronic, plants and microorganisms based sensors), Grant Agreement 101135402, https://doi.org/10.3030/101135402.

Institutional Review Board Statement

Not applicable.

Informed Consent Statement

Not applicable.

Data Availability Statement

The original contributions presented in the study are included in the article material, further inquiries can be directed to the corresponding author.

Conflicts of Interest

The authors declare no conflict of interest.

References

  1. Yazdankhah, S.P.; Scheie, A.A.; Høiby, E.A.; Lunestad, B.-T.; Heir, E.; Fotland, T.Ø.; Naterstad, K.; Kruse, H. Triclosan and Antimicrobial Resistance in Bacteria: An Overview. Microb. Drug Resist. 2006, 12, 83–90. [Google Scholar] [CrossRef] [PubMed]
  2. Dann, A.B.; Hontela, A. Triclosan: Environmental Exposure, Toxicity and Mechanisms of Action. J. Appl. Toxicol. 2011, 31, 285–311. [Google Scholar] [CrossRef] [PubMed]
  3. Singer, H.; Müller, S.; Tixier, C.; Pillonel, L. Triclosan: Occurrence and Fate of a Widely Used Biocide in the Aquatic Environment: Field Measurements in Wastewater Treatment Plants, Surface Waters, and Lake Sediments. Environ. Sci. Technol. 2002, 36, 4998–5004. [Google Scholar] [CrossRef] [PubMed]
  4. Fang, J.-L.; Stingley, R.L.; Beland, F.A.; Harrouk, W.; Lumpkins, D.L.; Howard, P. Occurrence, Efficacy, Metabolism, and Toxicity of Triclosan. J. Environ. Sci. Health Part C 2010, 28, 147–171. [Google Scholar] [CrossRef]
  5. Aranami, K.; Readman, J.W. Photolytic Degradation of Triclosan in Freshwater and Seawater. Chemosphere 2007, 66, 1052–1056. [Google Scholar] [CrossRef]
  6. Liu, T.; Wu, D. High-performance Liquid Chromatographic Determination of Triclosan and Triclocarban in Cosmetic Products. Intern. J. Cosmet. Sci 2012, 34, 489–494. [Google Scholar] [CrossRef]
  7. Tohidi, F.; Cai, Z. GC/MS Analysis of Triclosan and Its Degradation by-Products in Wastewater and Sludge Samples from Different Treatments. Environ. Sci. Pollut. Res. 2015, 22, 11387–11400. [Google Scholar] [CrossRef]
  8. Zhu, C.; Yang, G.; Li, H.; Du, D.; Lin, Y. Electrochemical Sensors and Biosensors Based on Nanomaterials and Nanostructures. Anal. Chem. 2015, 87, 230–249. [Google Scholar] [CrossRef]
  9. Cho, I.-H.; Kim, D.H.; Park, S. Electrochemical Biosensors: Perspective on Functional Nanomaterials for on-Site Analysis. Biomater. Res. 2020, 24, 6. [Google Scholar] [CrossRef]
  10. Motia, S.; Tudor, I.A.; Ribeiro, P.A.; Raposo, M.; Bouchikhi, B.; El Bari, N. Electrochemical Sensor Based on Molecularly Imprinted Polymer for Sensitive Triclosan Detection in Wastewater and Mineral Water. Sci. Total Environ. 2019, 664, 647–658. [Google Scholar] [CrossRef]
  11. Theyagarajan, K.; Sruthi, V.P.; Satija, J.; Senthilkumar, S.; Kim, Y.-J. Materials and Design Strategies for the Electrochemical Detection of Antineoplastic Drugs: Progress and Perspectives. Mater. Sci. Eng. R Rep. 2024, 161, 100840. [Google Scholar] [CrossRef]
  12. Hayat, A.; Al-Sehemi, A.G.; El-Nasser, K.S.; Taha, T.A.; Al-Ghamdi, A.A.; Shah Syed, J.A.; Amin, M.A.; Ali, T.; Bashir, T.; Palamanit, A.; et al. Graphitic Carbon Nitride (g–C3N4)–Based Semiconductor as a Beneficial Candidate in Photocatalysis Diversity. Int. J. Hydrogen Energy 2022, 47, 5142–5191. [Google Scholar] [CrossRef]
  13. Wang, Y.; Zhang, M.; Wang, L.; Xing, J. Graphitic Carbon Nitride Emitter: From Structural Modification to Optoelectronics Applications. Adv. Opt. Mater. 2023, 11, 2301547. [Google Scholar] [CrossRef]
  14. Ghalkhani, M.; Khaneghah, M.H.; Sohouli, E. Graphitic Carbon Nitride: Synthesis and Characterization. In Handbook of Carbon-Based Nanomaterials; Elsevier: Amsterdam, The Netherlands, 2021; pp. 573–590. ISBN 978-0-12-821996-6. [Google Scholar]
  15. Muhmood, T.; Ahmad, I.; Haider, Z.; Haider, S.K.; Shahzadi, N.; Aftab, A.; Ahmed, S.; Ahmad, F. Graphene-like Graphitic Carbon Nitride (g-C3N4) as a Semiconductor Photocatalyst: Properties, Classification, and Defects Engineering Approaches. Mater. Today Sustain. 2024, 25, 100633. [Google Scholar] [CrossRef]
  16. Cao, S.-M.; Chen, H.-B.; Dong, B.-X.; Zheng, Q.-H.; Ding, Y.-X.; Liu, M.-J.; Qian, S.-L.; Teng, Y.-L.; Li, Z.-W.; Liu, W.-L. Nitrogen-Rich Metal-Organic Framework Mediated Cu–N–C Composite Catalysts for the Electrochemical Reduction of CO2. J. Energy Chem. 2021, 54, 555–563. [Google Scholar] [CrossRef]
  17. Chen, J.; Huang, B.; Cao, R.; Li, L.; Tang, X.; Wu, B.; Wu, Y.; Hu, T.; Yuan, K.; Chen, Y. Steering Local Electronic Configuration of Fe–N–C-Based Coupling Catalysts via Ligand Engineering for Efficient Oxygen Electroreduction. Adv. Funct. Mater. 2023, 33, 2209315. [Google Scholar] [CrossRef]
  18. Zhang, L.-M.; Wang, Z.-B.; Sui, X.-L.; Li, C.-Z.; Zhao, L.; Gu, D.-M. Nitrogen-Doped Carbon with Mesoporous Structure as High Surface Area Catalyst Support for Methanol Oxidation Reaction. RSC Adv. 2016, 6, 39310–39316. [Google Scholar] [CrossRef]
  19. Mijajlović, A.; Ognjanović, M.; Manojlović, D.; Vlahović, F.; Đurđić, S.; Stanković, V.; Stanković, D. Eu2O3@Cr2O3 Nanoparticles-Modified Carbon Paste Electrode for Efficient Electrochemical Sensing of Neurotransmitters Precursor L-DOPA. Biosensors 2023, 13, 201. [Google Scholar] [CrossRef]
  20. Wen, J.; Xie, J.; Chen, X.; Li, X. A Review on G-C3N4-Based Photocatalysts. Appl. Surf. Sci. 2017, 391, 72–123. [Google Scholar] [CrossRef]
  21. Ognjanović, M.; Nikolić, K.; Bošković, M.; Pastor, F.; Popov, N.; Marciuš, M.; Krehula, S.; Antić, B.; Stanković, D.M. Electrochemical Determination of Morphine in Urine Samples by Tailoring FeWO4/CPE Sensor. Biosensors 2022, 12, 932. [Google Scholar] [CrossRef]
  22. Đurđić, S.; Vlahović, F.; Ognjanović, M.; Gemeiner, P.; Sarakhman, O.; Stanković, V.; Mutić, J.; Stanković, D.; Švorc, Ľ. Nano-Size Cobalt-Doped Cerium Oxide Particles Embedded into Graphitic Carbon Nitride for Enhanced Electrochemical Sensing of Insecticide Fenitrothion in Environmental Samples: An Experimental Study with the Theoretical Elucidation of Redox Events. Sci. Total Environ. 2024, 909, 168483. [Google Scholar] [CrossRef] [PubMed]
  23. Rajakumar, G.; Mao, L.; Bao, T.; Wen, W.; Wang, S.; Gomathi, T.; Gnanasundaram, N.; Rebezov, M.; Shariati, M.A.; Chung, I.-M.; et al. Yttrium Oxide Nanoparticle Synthesis: An Overview of Methods of Preparation and Biomedical Applications. Appl. Sci. 2021, 11, 2172. [Google Scholar] [CrossRef]
  24. Naveed Ur Rehman, M.; Munawar, T.; Nadeem, M.S.; Mukhtar, F.; Akbar, U.A.; Manzoor, S.; Hakeem, A.S.; Ashiq, M.N.; Iqbal, F. Facile Synthesis of Novel PANI Covered Y2O3–ZnO Nanocomposite: A Promising Electrode Material for Supercapacitor. Solid State Sci. 2022, 128, 106883. [Google Scholar] [CrossRef]
  25. Shyam Sunder, G.S.; Rohanifar, A.; Devasurendra, A.M.; Kirchhoff, J.R. Selective Determination of l-DOPA at a Graphene Oxide/Yttrium Oxide Modified Glassy Carbon Electrode. Electrochim. Acta 2019, 301, 192–199. [Google Scholar] [CrossRef]
  26. Dasgupta, S.; Ahmed, A.H.M.T.; Bhattacharjee, I.; Firdoushi, S.; Biswas, D.; Mukherjee, S.; Mondal, B.; Bandyopadhyay, R.; Tudu, B. Electrochemical Detection of Indigo Carmine in Candies Using Y2O3 Nanoparticles Infused Graphite Electrode. J. Food Compos. Anal. 2024, 135, 106626. [Google Scholar] [CrossRef]
  27. Shashikumar, J.; Patil, B.; Swamy, B.E.K.; Nagabhushana, H.; Sharma, S.; Lalitha, P. Effect of RGO-Y2O3 and RGO-Y2O3:Cr3+ Nano Composite Sensor for Dopamine. Sci. Rep. 2021, 11, 9372. [Google Scholar] [CrossRef]
  28. Pathan, A.A.; Desai, K.R.; Bhasin, C.P. Synthesis of La2O3 Nanoparticles Using Glutaric Acid and Propylene Glycol for Future CMOS Applications. Int. J. Nanomater. Chem. 2017, 3, 21–25. [Google Scholar] [CrossRef]
  29. Mirzaei, A.; Janghorban, K.; Hashemi, B.; Bonyani, M.; Leonardi, S.G.; Neri, G. Highly Stable and Selective Ethanol Sensor Based on α-Fe2O3 Nanoparticles Prepared by Pechini Sol–Gel Method. Ceram. Int. 2016, 42, 6136–6144. [Google Scholar] [CrossRef]
  30. Zaki, T.; Kabel, K.I.; Hassan, H. Using Modified Pechini Method to Synthesize α-Al2O3 Nanoparticles of High Surface Area. Ceram. Int. 2012, 38, 4861–4866. [Google Scholar] [CrossRef]
  31. Tian, J.; Liu, Q.; Asiri, A.M.; Al-Youbi, A.O.; Sun, X. Ultrathin Graphitic Carbon Nitride Nanosheet: A Highly Efficient Fluorosensor for Rapid, Ultrasensitive Detection of Cu2+. Anal. Chem. 2013, 85, 5595–5599. [Google Scholar] [CrossRef]
  32. Khan, M.; Farah, H.; Iqbal, N.; Noor, T.; Amjad, M.Z.B.; Ejaz Bukhari, S.S. A TiO2 Composite with Graphitic Carbon Nitride as a Photocatalyst for Biodiesel Production from Waste Cooking Oil. RSC Adv. 2021, 11, 37575–37583. [Google Scholar] [CrossRef] [PubMed]
  33. Li, X.; Liu, X.; Qian, J.; Zhang, T.; Sun, B.; Han, Y. One-Step Synthesis and Characterization of Y2O3 Nanoparticles via Emulsion Detonation Method. Ceram. Int. 2024, 50, 27995–28003. [Google Scholar] [CrossRef]
  34. Mohamed, H.S.H.; Wu, L.; Li, C.-F.; Hu, Z.-Y.; Liu, J.; Deng, Z.; Chen, L.-H.; Li, Y.; Su, B.-L. In-Situ Growing Mesoporous CuO/O-Doped g-C3N4 Nanospheres for Highly Enhanced Lithium Storage. ACS Appl. Mater. Interfaces 2019, 11, 32957–32968. [Google Scholar] [CrossRef] [PubMed]
  35. Mo, Z.; She, X.; Li, Y.; Liu, L.; Huang, L.; Chen, Z.; Zhang, Q.; Xu, H.; Li, H. Synthesis of G-C3N4 at Different Temperatures for Superior Visible/UV Photocatalytic Performance and Photoelectrochemical Sensing of MB Solution. RSC Adv. 2015, 5, 101552–101562. [Google Scholar] [CrossRef]
  36. Dong, F.; Li, Y.; Wang, Z.; Ho, W.-K. Enhanced Visible Light Photocatalytic Activity and Oxidation Ability of Porous Graphene-like g-C3N4 Nanosheets via Thermal Exfoliation. Appl. Surf. Sci. 2015, 358, 393–403. [Google Scholar] [CrossRef]
  37. Milović, M.; Jugović, D.; Vujković, M.; Kuzmanović, M.; Mraković, A.; Mitrić, M. Towards a Green and Cost-Effective Synthesis of Polyanionic Cathodes: Comparative Electrochemical Behaviour of LiFePO4/C, Li2FeP2O7/C and Li2FeSiO4/C Synthesized Using Methylcellulose Matrix. Bull. Mater. Sci. 2021, 44, 144. [Google Scholar] [CrossRef]
  38. Jugović, D.; Mitrić, M.; Milović, M.; Ivanovski, V.N.; Škapin, S.; Dojčinović, B.; Uskoković, D. Structural and Electrochemical Properties of the Li2FeP2O7/C Composite Prepared Using Soluble Methylcellulose. J. Alloys Compd. 2019, 786, 912–919. [Google Scholar] [CrossRef]
  39. Jugović, D.; Milović, M.; Ivanovski, V.N.; Škapin, S.; Barudžija, T.; Mitrić, M. Microsized Fayalite Fe2SiO4 as Anode Material: The Structure, Electrochemical Properties and Working Mechanism. J. Electroceram. 2021, 47, 31–41. [Google Scholar] [CrossRef]
  40. Malode, S.J.; Prabhu, K.; Pollet, B.G.; Kalanur, S.S.; Shetti, N.P. Preparation and Performance of WO3/rGO Modified Carbon Sensor for Enhanced Electrochemical Detection of Triclosan. Electrochim. Acta 2022, 429, 141010. [Google Scholar] [CrossRef]
  41. Sri, V.R.; Shwetharani, R.; Mohammed, J.; Mabkhoot, A.; Balakrishna, R.G.; Harraz, F.A. Review on Electrochemical Sensing of Triclosan Using Nanostructured Semiconductor Materials. ChemElectroChem 2022, 9, e202101664. [Google Scholar] [CrossRef]
  42. Knežević, S.; Ostojić, J.; Ognjanović, M.; Savić, S.; Kovačević, A.; Manojlović, D.; Stanković, V.; Stanković, D. The Environmentally Friendly Approaches Based on the Heterojunction Interface of the LaFeO3/Fe2O3@g-C3N4 Composite for the Disposable and Laboratory Sensing of Triclosan. Sci. Total Environ. 2023, 857, 159250. [Google Scholar] [CrossRef] [PubMed]
  43. Liu, Y.; Song, Q.-J.; Wang, L. Development and Characterization of an Amperometric Sensor for Triclosan Detection Based on Electropolymerized Molecularly Imprinted Polymer. Microchem. J. 2009, 91, 222–226. [Google Scholar] [CrossRef]
  44. Baranowska, I.; Bijak, K. Voltammetric Determination of Disinfectants at Multiwalled Carbon Nanotube Modified Glassy Carbon Electrode. J. Anal. Chem. 2013, 68, 891–895. [Google Scholar] [CrossRef]
  45. Li, B.; Qiu, Z.; Wan, Q.; Liu, Y.; Yang, N. β-Cyclodextrin Functionalized Graphene Nano Platelets for Electrochemical Determination of Triclosan: β-Cyclodextrin Functionalized Graphene Nano Platelets. Phys. Status Solidi A 2014, 211, 2773–2777. [Google Scholar] [CrossRef]
  46. Libansky, M.; Zima, J.; Barek, J.; Dejmkova, H. Construction of an Electrochemical Cell System Based on Carbon Composite Film Electrodes and Its Application for Voltammetric Determination of Triclosan. Electroanalysis 2014, 26, 1920–1927. [Google Scholar] [CrossRef]
  47. Luyen, N.D.; Toan, T.T.T.; Trang, H.T.; Nguyen, V.T.; Son, L.V.T.; Thanh, T.S.; Thanh, N.M.; Quy, P.T.; Khieu, D.Q. Electrochemical Determination of Triclosan Using ZIF-11/Activated Carbon Derived from the Rice Husk Modified Electrode. J. Nanomater 2021, 2021, 8486962. [Google Scholar] [CrossRef]
Scheme 1. Schematic illustration of Y2O3@GCN synthesis and carbon paste preparation.
Chemosensors 12 00272 sch001
Figure 1. (a) Transmission electron microscopy micrograph; (b) Field/emission scanning electron microscopy micrographs; (c) EDS elemental mapping; (d) X-ray powder diffractograms and (e) ATR-FTIR spectra of Y2O3, GCN, and Y2O3@GCN nanocomposite material.
Chemosensors 12 00272 g001
Figure 2. (a) Nyquist plot for pristine CPE, CPE/Y2O3, CPE/GCN, and CPE/Y2O3@GCN; (b) CV + response comparison for pristine CPE, CPE/Y2O3, CPE/GCN, and CPE/Y2O3@GCN. (Scan rate of 50 mV/s). The measurements were recorded in redox probe of 5 mM [Fe(CN)6]3−/4− in 0.1 M KCl solution.
Chemosensors 12 00272 g002
Figure 3. Scan rate (20–200 m Vs−1) studies of (a) pristine CPE; (b) CPE/Y2O3; (c) CPE/GCN; and (d) CPE/Y2O3@GCN in redox probe of 5 mM [Fe(CN)6]3−/4− in 0.1 M KCl solution.
Chemosensors 12 00272 g003
Figure 4. (a) CV response of 100 µM TSC at pristine CPE, CPE/Y2O3, CPE/GCN, and CPE/Y2O3@GCN, in BRBS (pH 7.0) (scan rate of 50 mV s−1), with the corresponding current bar graph; (b) CV response of CPE/Y2O3@GCN at various scan rates (0.05–0.2 V s−1) in BRBS (pH 7.0) with 100 µM of TSC; (c) the corresponding plot for redox peak current values against the square root of scan rates; (d) figure correlating the logarithm of scan rate (log v) and peak current (log Ip).
Chemosensors 12 00272 g004
Figure 5. (a) CV responses of 100 µM TSC at CPE/Y2O3@GCN at various pH (3.0–10.0) BRBS (scan rate 50 mV s−1); (b) the corresponding plot for oxidation peak potentials versus different pH (3.0–11.0); (c) the effect of changing the pH value of the supporting electrolyte on Ip.
Chemosensors 12 00272 g005
Figure 6. (a) The choice of a voltammetric technique for the selective determination of TSC; (b) SWV profiles for the various concentrations of TSC (0.5–100 µM) in BRBS (pH 7.0) at CPE/Y2O3@GCN; (c) the corresponding linear plot for oxidation peak current values vs. concentrations of TSC.
Chemosensors 12 00272 g006
Figure 7. Reproducibility studies for 6 independent measurements of 10 µM TSC, and application of 5 differently prepared sensors for 10 µM TSC determination: (a) repeatability and (b) reproductivity.
Chemosensors 12 00272 g007
Figure 8. (a) SWV response of 100 µM TSC with various potential-interfering species at CPE/Y2O3@GCN, in BRBS (pH 7.0); (b) SWV response for different concentrations of TSC (10.0 μM, 20.0 μM, and 40.0 μM) at CPE/Y2O3@GCN in the BRBS (pH 7.0) containing the tap water sample; (c) SWV response for different concentrations of TSC (10.0 μM, 20.0 μM, and 40.0 μM) at CPE/Y2O3@GCN in the BRBS (pH 7.0) containing the toothpaste sample.
Chemosensors 12 00272 g008
Table 1. Comparative analysis of TSC electrochemical sensors.
ElectrodeLinear Range (µM)LOD (µM)Reference
o-PD-MIP/GCE0.2–30.8[43]
MWCNT/GC0.103–1495.8[44]
b-CNT/GNPs/GC2.0–1000.6[45]
CCF4.2–470.25[46]
LaFeO3/Fe2O3@g-C3N4/SPE0.3–70.09[42]
ZIF-11/activated carbon0.1–80.076[47]
Y2O3/GCN/CPE0.5–1000.14This work
Table 2. Spiked sample analysis of TSC.
SampleFound (µM)Spiked (µM)Found After Spiking (µM)Recovery (%)
-1011.84118.44
Tap water-2021.64108.18
-4042.33105.82
-1011.75117.50
Toothpaste sample-2018.8194.04
-4046.23115.58
Disclaimer/Publisher’s Note: The statements, opinions and data contained in all publications are solely those of the individual author(s) and contributor(s) and not of MDPI and/or the editor(s). MDPI and/or the editor(s) disclaim responsibility for any injury to people or property resulting from any ideas, methods, instructions or products referred to in the content.

