Article

A Simple Green Method for the Determination of Hydrogen Peroxide and Fe(III)/Fe(II) Species Based on Monitoring the Decolorization Process of Polymethine Dye Using an Optical Immersion Probe

1
Department of Analytical Chemistry, Institute of Chemistry, Faculty of Science, Pavol Jozef Šafárik University in Košice, 040 01 Košice, Slovakia
2
Department of Chemistry, University of Nevada, Reno, 1664 N. Virginia Street, Reno, NV 89557-0216, USA
*
Authors to whom correspondence should be addressed.
Chemosensors 2024, 12(12), 270; https://doi.org/10.3390/chemosensors12120270
Submission received: 25 November 2024 / Revised: 16 December 2024 / Accepted: 17 December 2024 / Published: 19 December 2024

Abstract

:
We have found that the dye 1,3,3-trimethyl-2-((1′E,3′E,5′E)-5’-(1″,3″,3″-trimethylindol-(2′E)-ylidene)-penta-1″,3″-dien-1″-yl)-3H-indol-1-ium (DTMI-5) can be successfully used for the simple green determination of H2O2 and Fe(III)/Fe(II) species. The dye is characterized by a successful combination of spectral, protolytic, and redox properties, and the process of its decolorization in the Fenton reaction is monitored using an optical immersion probe. Theoretical calculations of the reactive sites in the DTMI-5 molecule under free radical attack reveal that the methine groups of the penta-1′,3′-dien-1′-yl linker serve as the primary reactive centers in Fe3+ or Fenton-type oxidation conditions. Density functional theory (DFT) calculations indicate that the redox potentials of the examined structures range from 0.34 to 1.65 eV. The experimentally observed broad peak at 340–360 nm, which appears after the interaction of DTMI-5 with the Fenton reagent, is attributed to the formation of aldehyde-type oxidation products, whose theoretical CIS(D) absorption maxima were 358.1 and 337.4 nm. The influence of various factors on the course of the reaction was experimentally investigated. The most important analytical characteristics of the methods, such as linearity intervals of calibration graphs, precision, LOD and LOQ values, selectivity coefficients, etc., were determined. The developed methods were applied to model and real samples (water, oxidation emulsion, and fertilizer).

Graphical Abstract

1. Introduction

The Fenton reaction was first described in 1894. However, it only gained widespread popularity when it began being used for the decomposition and degradation of organic pollutants in the treatment of various water samples. Today, the Fenton reaction is widely used in water treatment technologies, and it can be applied to many types of wastewater, including those from pesticide and chemical production, the textile and petroleum industries, and pharmaceutical and food production. One of the disadvantages of this treatment technology is the need for acidifying or alkalizing agents. Additionally, water disinfection capabilities are somewhat limited [1].
The analytical aspects of this reaction have been studied little, although it is known to be useful for determining hydrogen hydroxide, iron species, and some organic dyes. One potential challenge is the complex kinetic–catalytic nature of this process, which is difficult to control by classical spectrophotometric approaches. A convenient solution may be to use an optical immersion probe, a tool that allows for real-time monitoring of changes in the systems without requiring a sample to be transferred into a cuvette. This approach enables monitoring of process kinetics with high frequency (e.g., every second after the addition of reagents). The optical probe allows for simultaneous stirring of the solution during measurement. In addition, the use of an optical probe creates opportunities to automate analysis procedures, reduce the number of routine manipulations required, and, as a result, improve the analytical performance of the method. It is also much cheaper than classical spectrophotometric equipment. The effectiveness of this approach was previously demonstrated in our work on the kinetic determination of chromium species (VI, III) [2].
Hydrogen peroxide is used as a disinfection agent, oxidant, and bleach in the food, chemistry, and cosmetics industries. On the other hand, it is an unstable compound that is toxic and potentially carcinogenic to living organisms [3]. The application of hydrogen peroxide in various fields leads to excessive environmental pollution. Traditionally, H2O2 is detected by titration or chromatography methods. However, chromatography is costly, and titration is not sensitive enough [4]. Chemiluminescent, fluorometric and electrochemical methods are also quite popular; however, they require quite expensive equipment and may be time-consuming. Therefore, the development of a simple method for monitoring its levels in industrial and pharmacological products, as well as environmental samples, is important.
Iron is an essential bioactive metal element for the environment and living organisms. Both excess and deficiency can lead to serious health problems. The maximum permissible concentration of iron in drinking water is 0.3 ppm, while in groundwater it should range from 0.1 to 10 ppm [5,6]. Environmental pollution with iron can be caused by corrosion, industrial pollution, and other sources. Iron can be determined with atomic absorption spectrometry, optical emission spectrometry, mass spectrometry, voltammetry, chromatography, and fluorescence methods. However, these methods are complex to operate, expensive, require major sample preparation, and are time-consuming. Spectrophotometric methods are cheaper, easier to operate, and provide sufficient sensitivity. Many spectrophotometric methods for the determination of Fe(III) or Fe(II) were represented in the literature. However, only a few methods enable the simultaneous determination of both species. Therefore, the development of a new method for monitoring of Fe(III)/Fe(II) species in environmental and technical samples is relevant and necessary.
Novel procedures for the spectrophotometric determination of hydrogen peroxide and Fe(III)/Fe(II) species with the help of an optical immersion probe are represented in this work. Analytes were determined based on monitoring the decolorization process of polymethine dye 1,3,3-trimethyl-2-((1′E,3′E,5′E)-5’-(1″,3″,3″-trimethylindol-(2″E)-ylidene)-penta-1′,3′-dien-1′-yl)-3H-indol-1-ium (DTMI-5) with H2O2 and iron using an optical immersion probe. This dye was chosen for its unique spectrophotometric and proteolytic properties, primarily the very high color intensity of its cationic form, which is dominant over a wide range of acidities. Moreover, the presence of a conjugated system of double bonds makes this molecule sensitive enough to oxidants to be used as a sensor. Although the Fenton reaction is well known, according to our knowledge, it was not described in the literature for the DTMI-5. Therefore, the reaction mechanism was investigated in detail by interpreting the results obtained experimentally by the spectrophotometric method and with theoretical calculations.

2. Experimental

2.1. Computational Details

The geometrical parameters of all the considered structures were optimized using the M06-2X DFT functional [7] with the def2-SVP basis set [8,9]. Gibbs free energy corrections, radical Fukui function (RFF) [10], and average local ionization energy (ALIE) [11] isosurfaces were also computed at this level of theory. All optimized geometries were confirmed as true minima, with no imaginary frequencies detected in the corresponding Hessians. Total electronic energies were calculated using the larger def2-TZVPP basis set [8,9]. Absorption spectra were computed at the CIS(D)/def2-SVP level of theory [12]. Water solvation effects were incorporated into all calculations using the conductor-like polarizable continuum model (CPCM) [13]. To increase computational efficiency without sacrificing accuracy, the resolution-of-identity (RI) and chain-of-spheres (COSX) approximations were employed throughout the calculations [14]. All DFT calculations were performed with the ORCA 5.0.4 software package [15], while RFF and ALIE were computed using Multiwfn 3.8 [16]. Visualization was carried out using VMD 1.9.4 [17].

2.2. Reagents and Equipment

All reagents used were of analytical grade purity. A 0.2 mM stock solution of DTMI-5 (Sigma Aldrich, Bratislava, Slovakia) was prepared by dissolving 27 mg of dye in 10 mL of ethanol and filling up to the mark with distilled water in a 250 mL flask. Furthermore, 30% hydrogen peroxide was bought from mikroCHEM (mikroCHEM, Bratislava, Slovakia). In addition, 0.01 M Fe(II) stock solution was prepared by dissolving 98 mg of Mohr’s salt (Centralchem, Bratislava, Slovakia) in distilled water and filling up to the mark with distilled water in a 25 mL flask. Then, 0.01 M Fe(III) stock solution was prepared by dissolving 101 mg of Fe(NO3)3·9H2O (Centralchem, Bratislava, Slovakia) in distilled water and filling up to the mark with distilled water in a 25 mL flask. Both solutions were stored in the fridge maximally for a week. Furthermore, 1 M HCl solution was prepared by dilution of the proper volume of concentrated hydrochloric acid (ITES, Vranov nad Topľou, Slovakia). Possible 0.1 M interferent solutions were prepared by dissolving appropriate amounts of substances (Centralchem, Bratislava, Slovakia) in distilled water in 25 mL volumetric flasks. The Kallos 6% flavored oxidizing emulsion and crystalline hydrangea fertilizer were purchased locally (Slovakia).
A 1 cm double-pass optical immersion probe (Expedeon, Cambridge, UK) connected to a USB 4000 fiber optic spectrometer (Ocean Optics, Orlando, FL, USA) and an LS-1 tungsten halogen light source (Ocean Optics) was applied for conducting kinetic spectrophotometric measurements. OceanView 1.6.7 (Lite) spectroscopy software (Ocean Optics) was used to record data. After measurements, the optical immersion probe was washed with ethanol and water. The RH digital heating model magnetic stirrer (IKA-Werke GmbH&Co. KG, Staufen im Breisgau, Germany) was applied to stir the reaction mixture.

2.3. Procedure for H2O2 Determination

A sample solution containing H2O2, 0.7 mL of 1 mM Fe(II), and 0.35 mL of 0.2 mM DTMI-5 was placed in a 25 mL beaker. An optical immersion probe was placed into the solution. The magnetic stirrer was set to 200 rpm. Measurements were started, and immediately after, 0.35 mL of 1 M HCl was added to initiate the reaction, which was continued for a maximum of 200 s. The total volume of the resulting solution was 10 mL. The analytical wavelength was set to 637 nm, and the analytical signal was calculated as the difference between the initial absorbance of the solution and the absorbance at a fixed time. All measurements were performed at room temperature (20–22 °C).

2.4. Procedure for Fe(III)/Fe(II) Determination in the Presence of Hydrogen Peroxide

A sample solution containing Fe(II) or Fe(III) species, 0.1 mL of 0.01 M H2O2, and 0.35 mL of 0.2 mM DTMI-5 was placed in a 25 mL beaker. The optical immersion probe was inserted into the solution, and the magnetic stirrer was set to 200 rpm. Measurements were initiated, and immediately after this, 0.35 mL of 1 M HCl was added to start the reaction, which continued for a maximum of 350 s. The total volume of the resulting solution was 10 mL. The analytical wavelength was set to 637 nm, and the analytical signal was determined as the difference between the initial absorbance of the solution and the absorbance at a fixed time.

2.5. Procedure for Fe(III) Determination

A sample solution containing Fe(III) species and 0.35 mL of 0.2 mM DTMI-5 was placed in a 25 mL beaker. The optical immersion probe was inserted into the solution, and the magnetic stirrer was set to 200 rpm. Measurements were started, and immediately after, 0.35 mL of 1 M HCl was added to initiate the reaction, which continued for a maximum of 350 s. The total volume of the resulting solution was 10 mL. The analytical wavelength was set to 637 nm, and the analytical signal was determined as a difference between the initial absorbance of the solution and the absorbance at a fixed time.

2.6. Joint Determination of Fe(II) and Fe(III) Species

Fe(III) in the presence of Fe(II) was determined using the procedure described in Section 2.5. Then, the signal of both species was measured as described in Section 2.3. The analytical signal corresponding to Fe(III) was calculated from measurements without hydrogen peroxide and subtracted from the total analytical signal of Fe(III) and Fe(II) to determine the concentration of Fe(II). Alternatively, Fe(III) species can be masked using 1 mM NaF. In this case, a calibration curve for Fe(II) determination should be prepared in the presence of 1 mM NaF.

2.7. Real Sample Analysis

Tap water was diluted twofold prior to analysis.
A 100 mg sample of 6% oxidation emulsion, obtained from a local market, was accurately weighed and dissolved in distilled water. The resulting solution was accurately transferred to a 100 mL volumetric flask and diluted to the mark with distilled water. An aliquot of this solution was analyzed following the procedure described above.
A 100 mg sample of fertilizer, obtained from a local market, was boiled for 2–3 min with a small amount of 20% HCl. During this step, Fe species were elaborated from the Fe-EDTA complex. The solution was cooled and transferred to a 100 mL volumetric flask, then diluted to the mark with distilled water. An aliquot of this solution was analyzed using the same procedure.

3. Results and Discussion

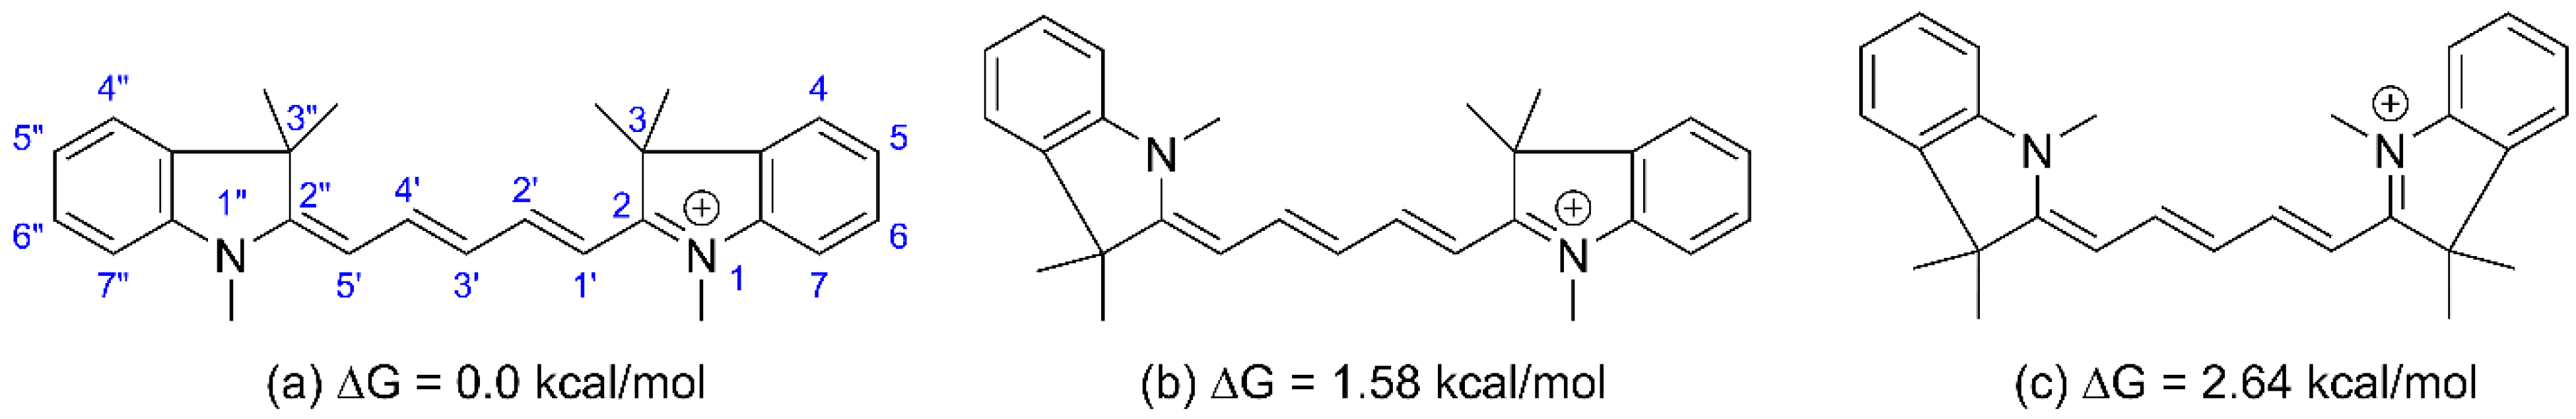
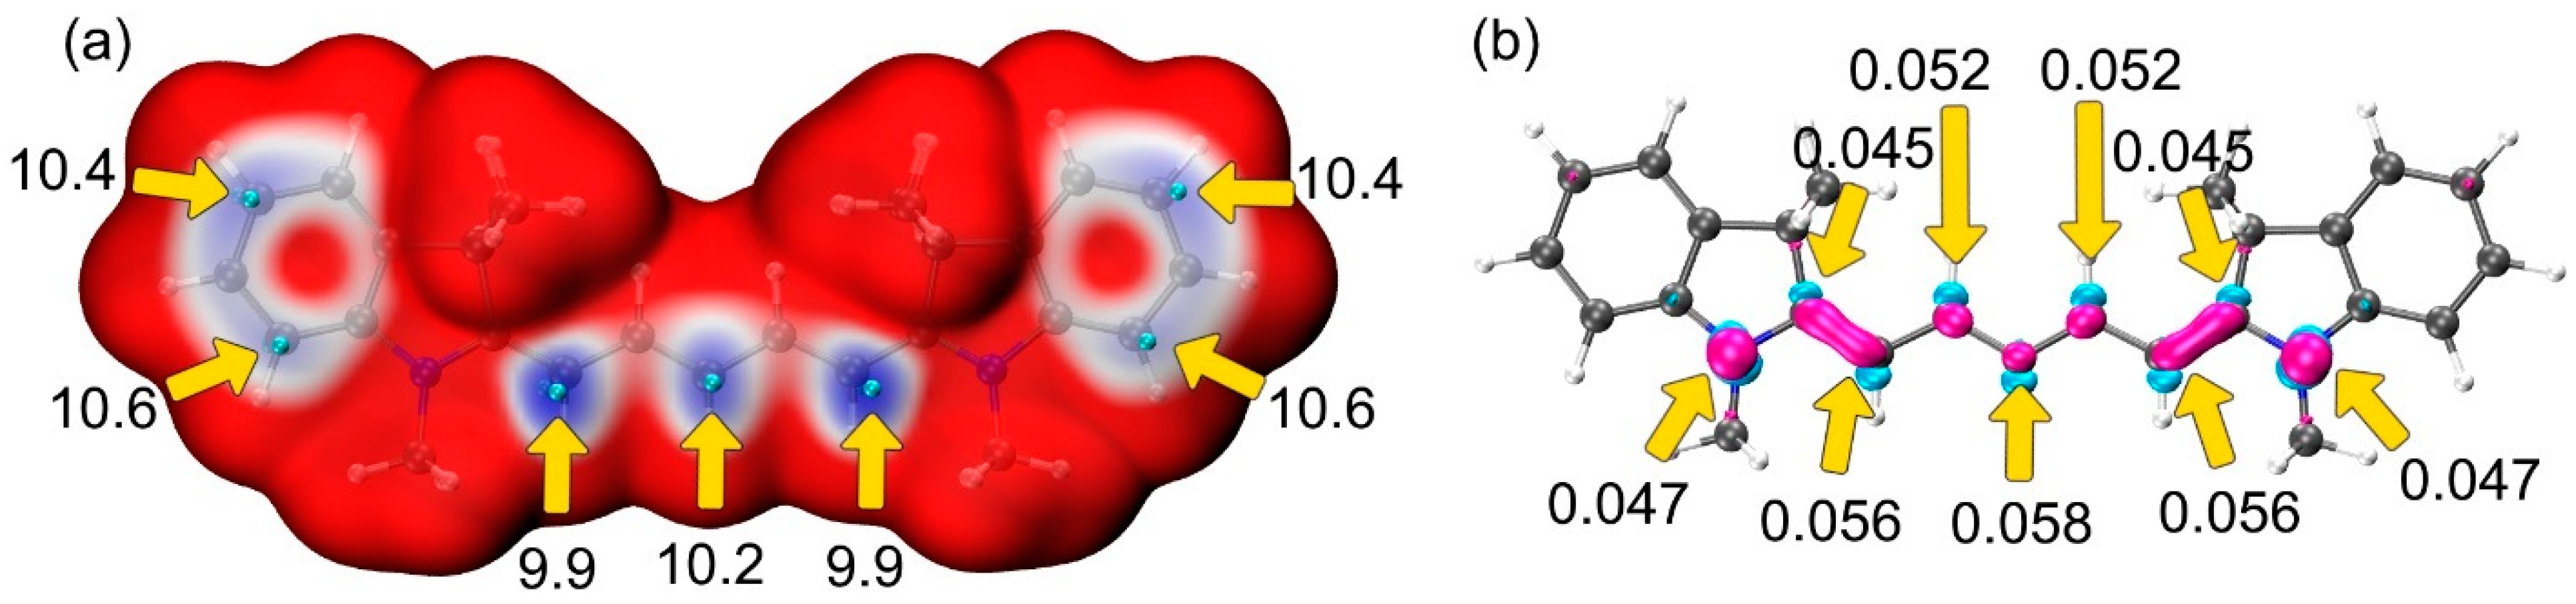
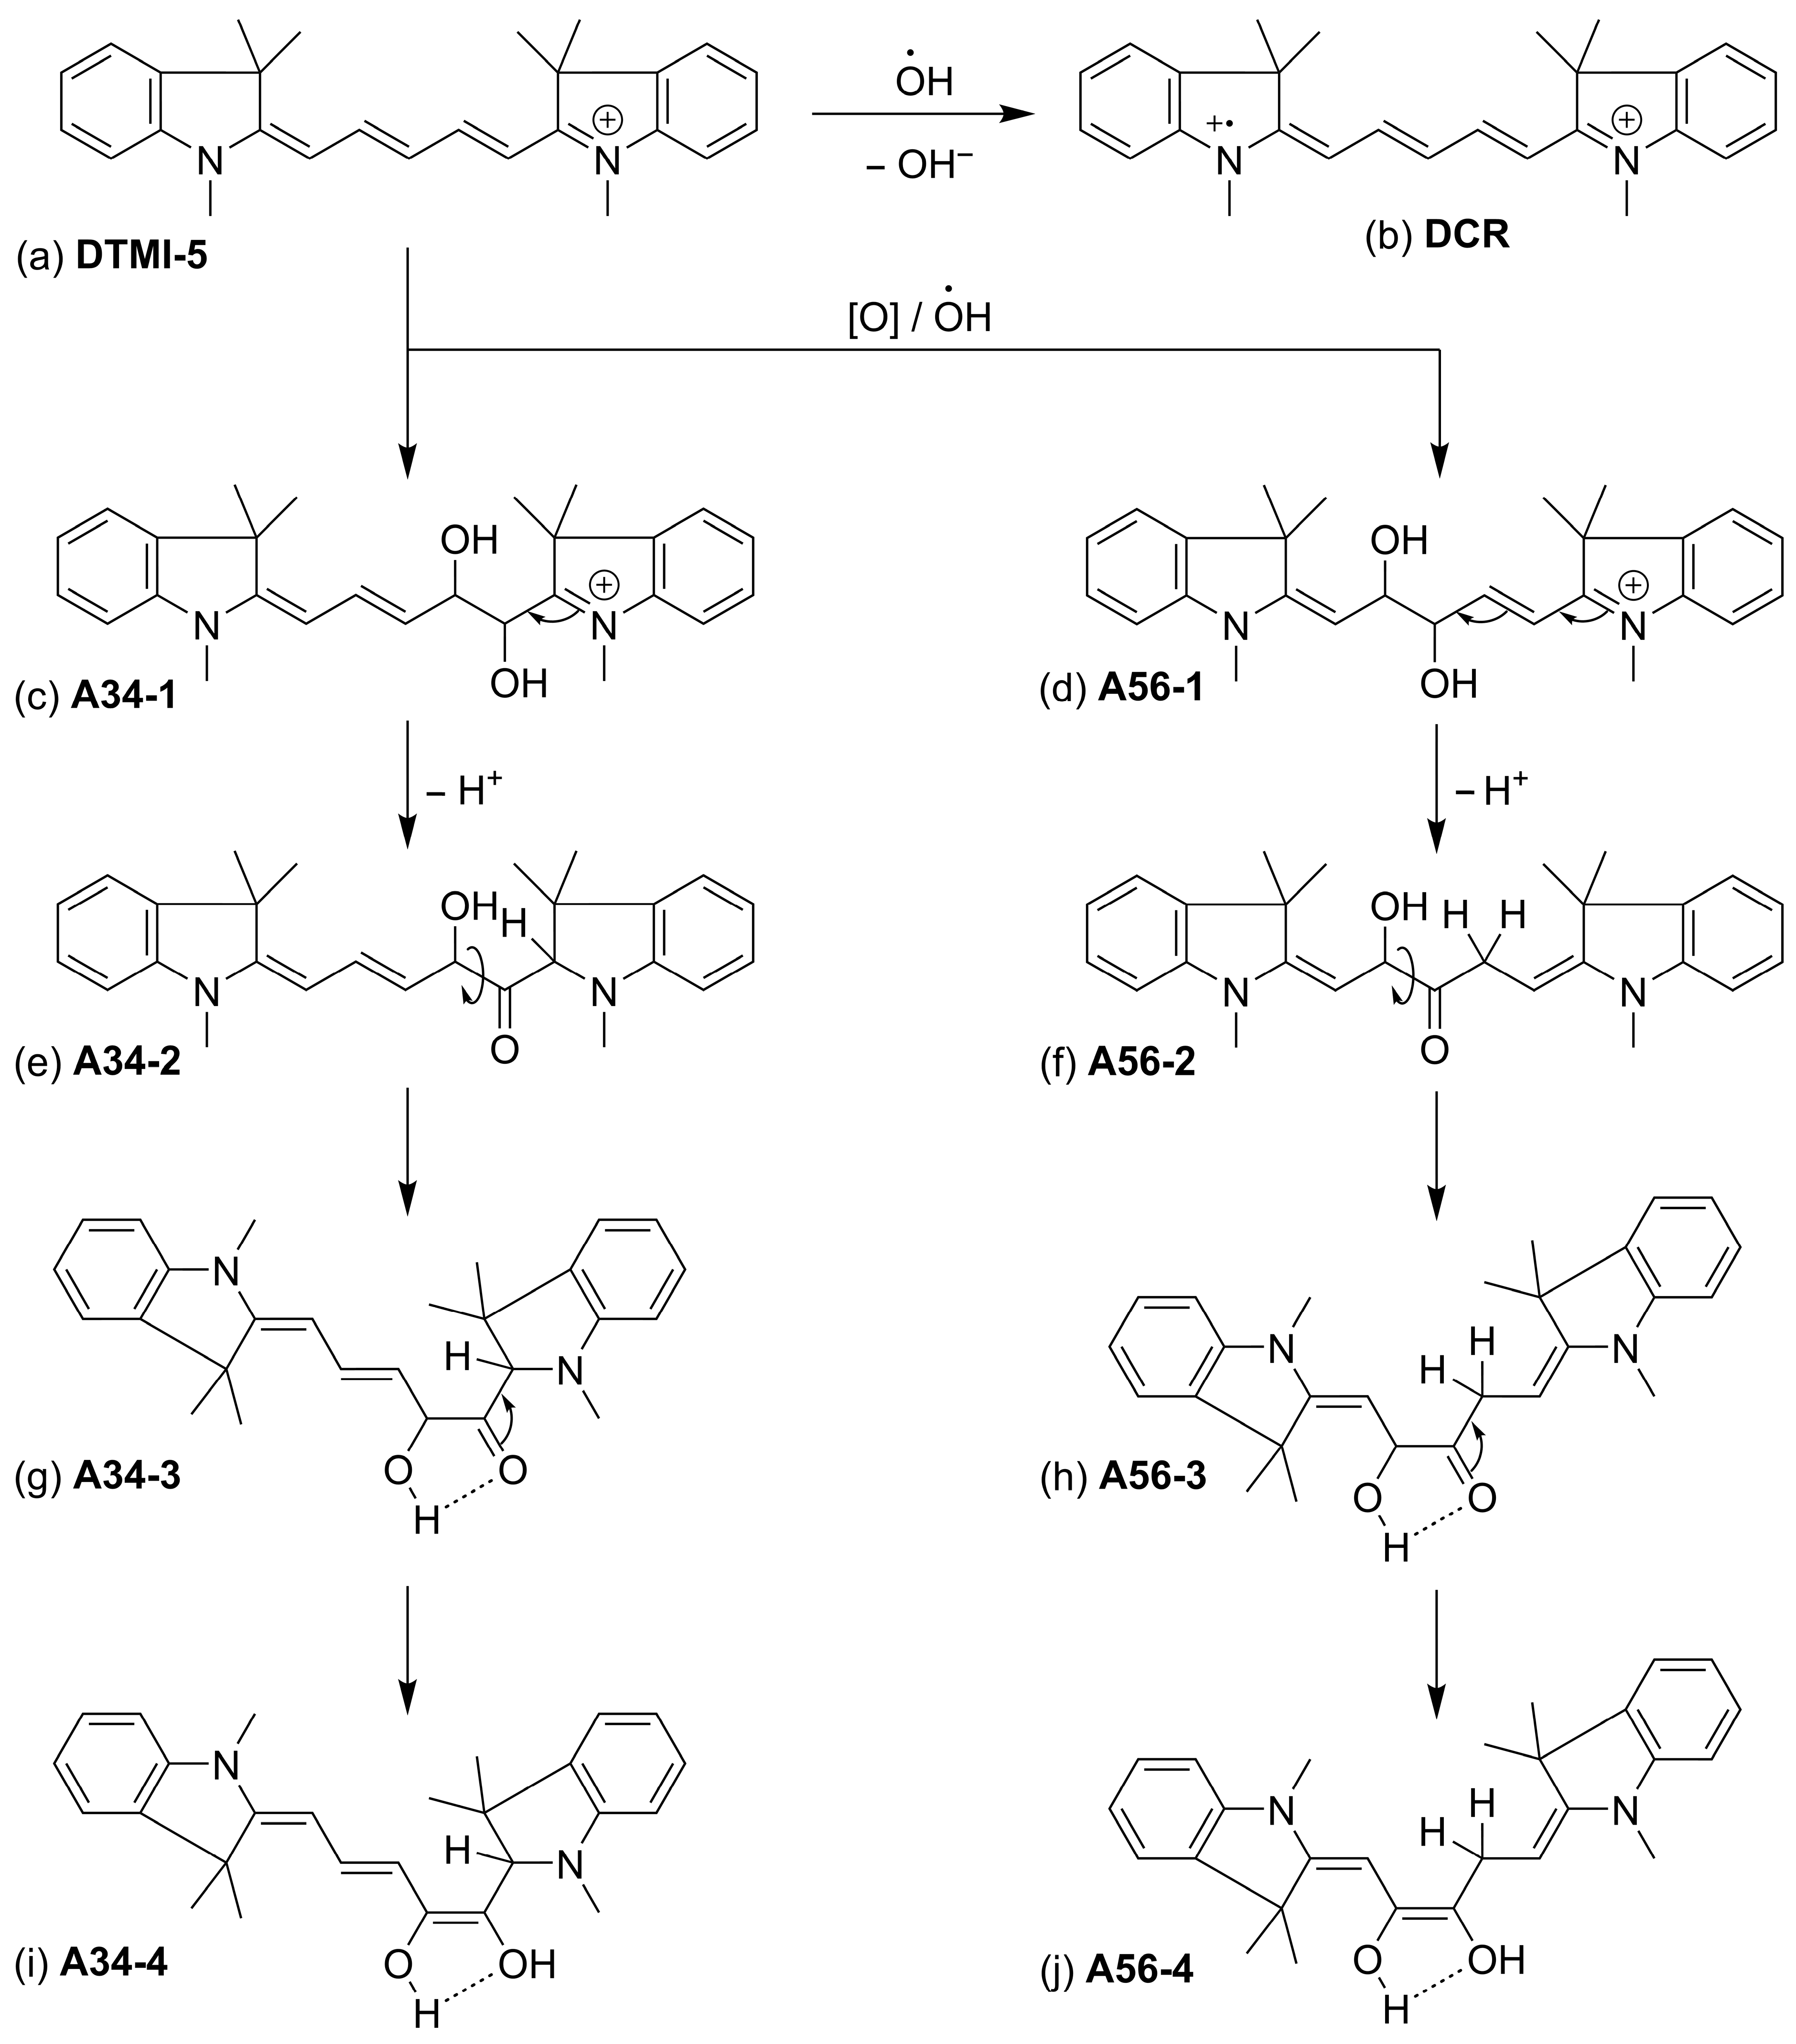
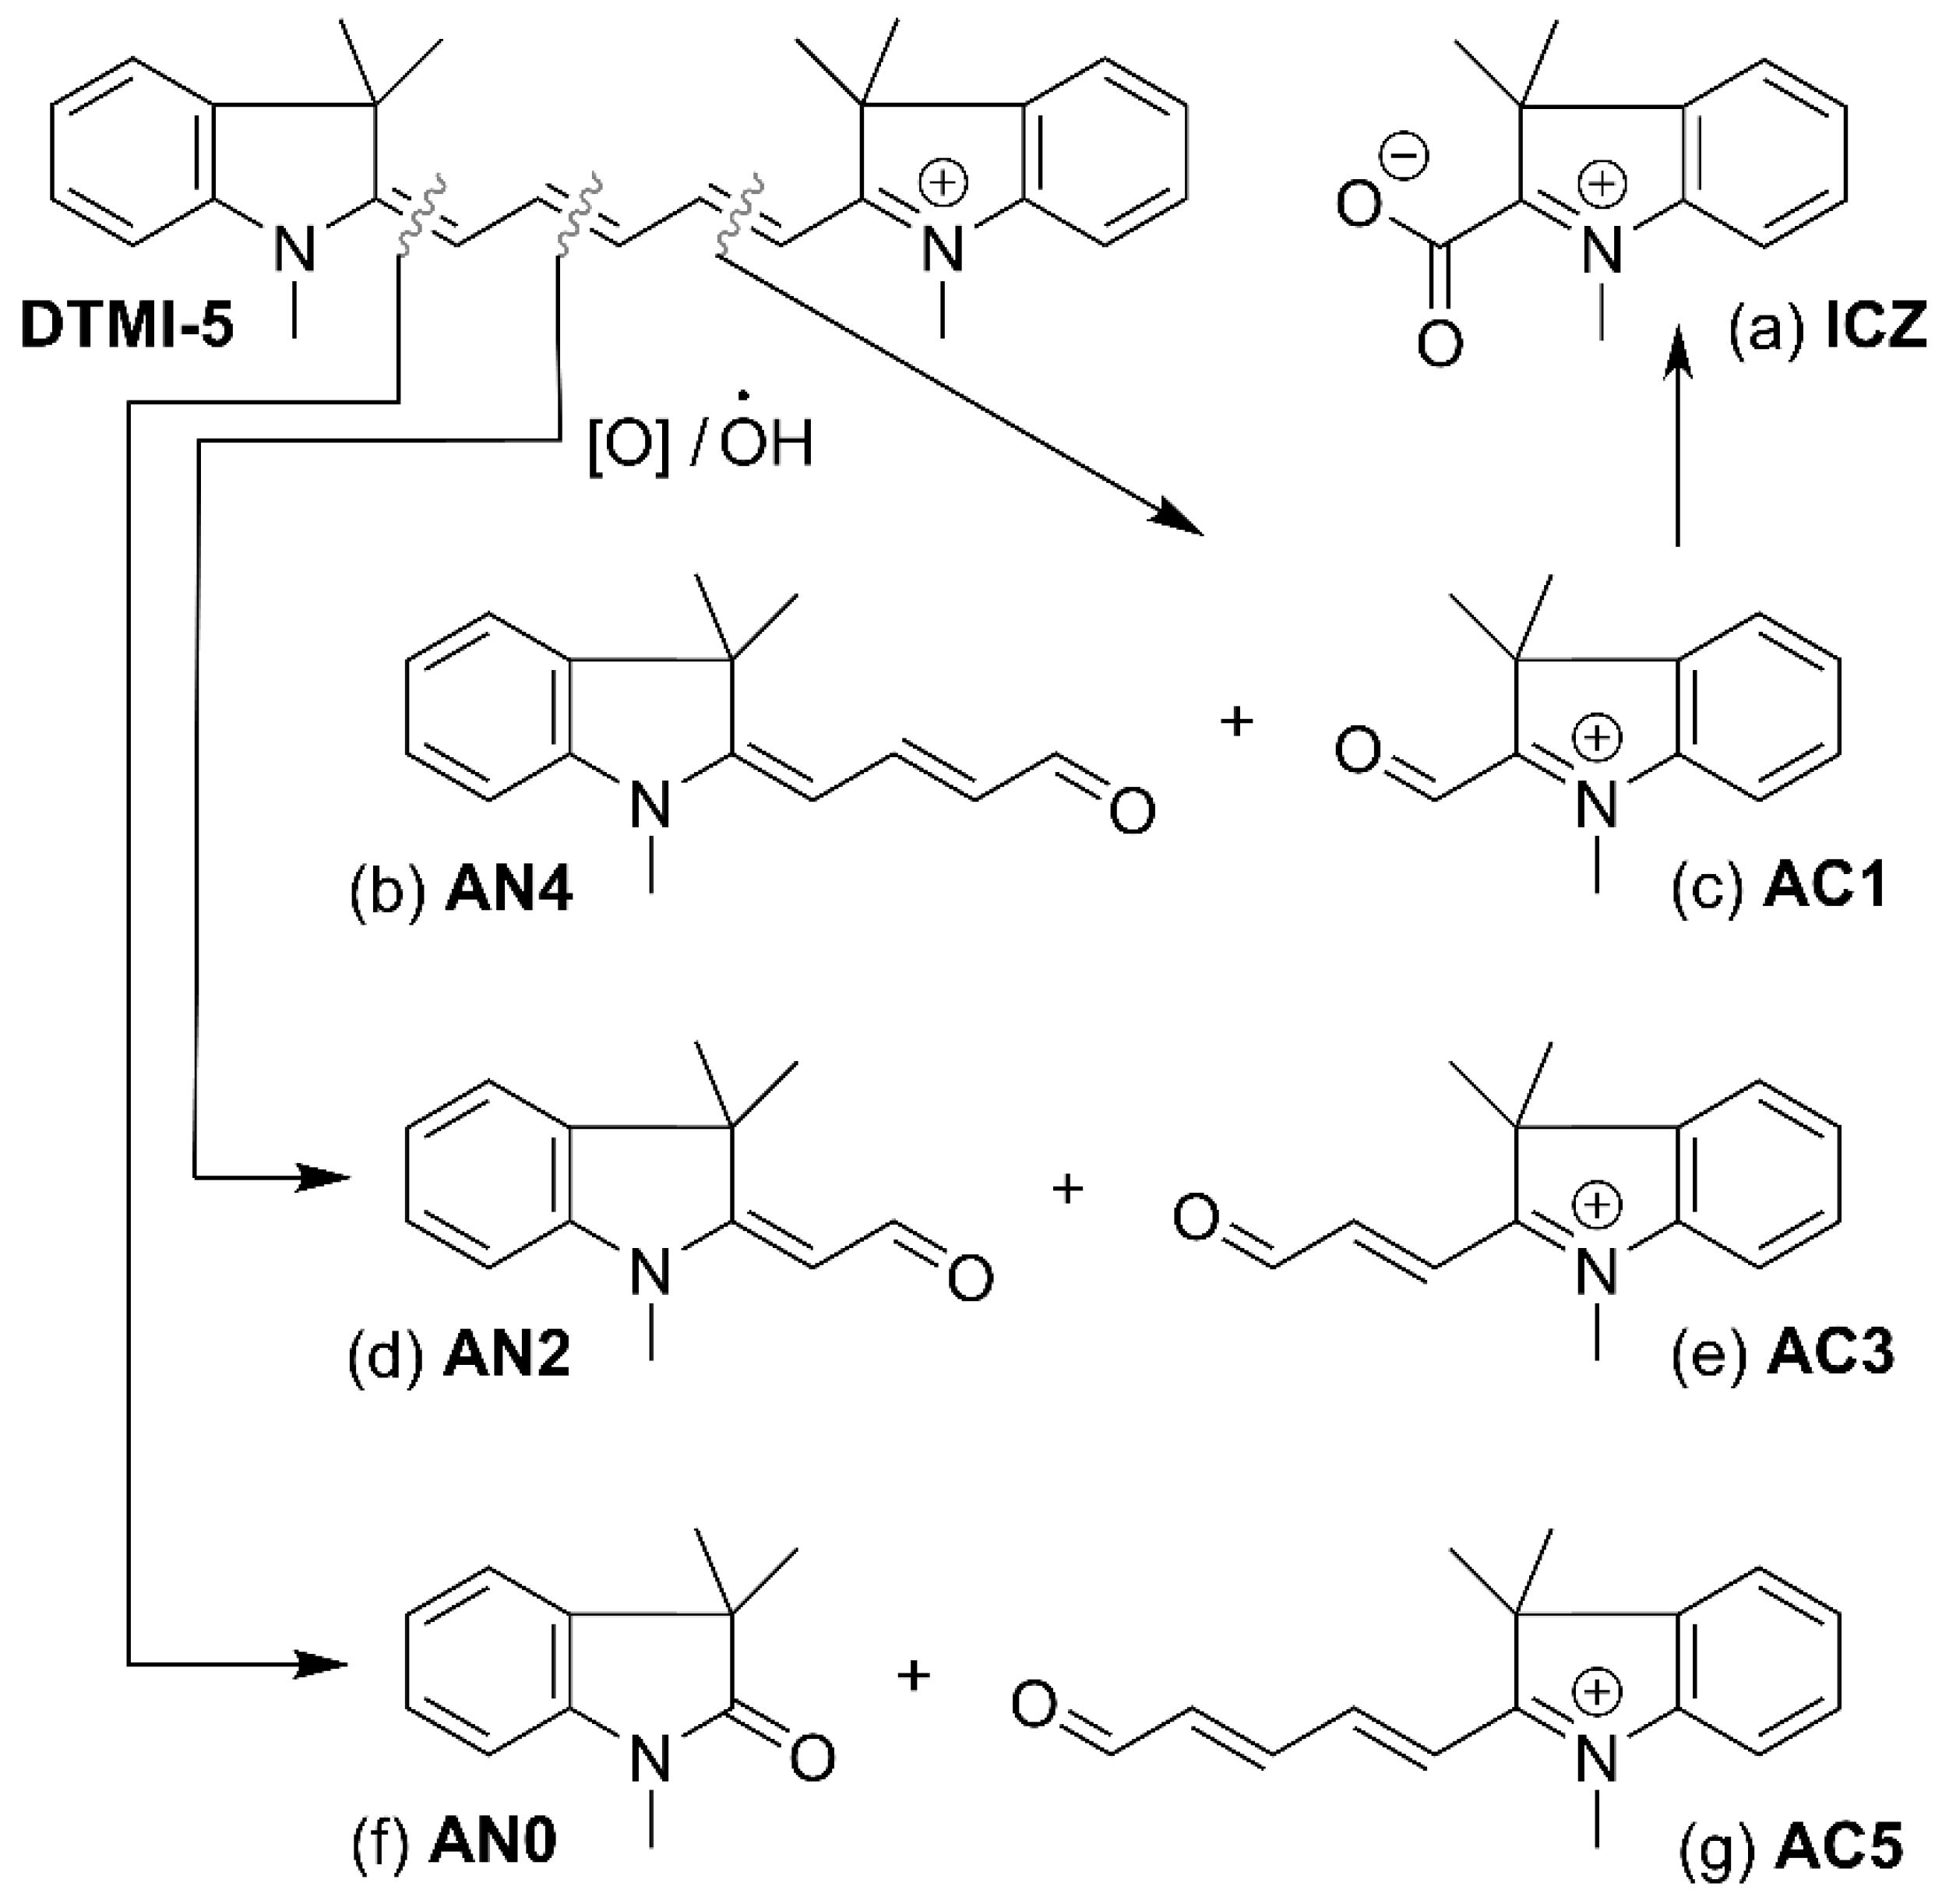
3.1. Computational Interpretation of the Sensing Mechanism

According to available crystallographic data on salts based on the DTMI-5 cation, all double bonds are in the “E-” (trans) configuration [18,19,20]. However, to the best of the authors’ knowledge, no structural studies on the DTMI-5 cation in aqueous solution have been conducted. Therefore, DFT calculations were performed to determine the most stable form of DTMI-5 in water. Figure 1 shows the structures of DTMI-5, DTMI-5-Z (1,3,3-trimethyl-2-((1′E,3′E,5′E)-5′-(1″,3″,3″-trimethylindol-(2″Z)-ylidene)-penta-1,3-dien-1′-yl)-3H-indol-1-ium), and DTMI-5-ZZ (1,3,3-trimethyl-2-((1′Z,3′E,5′E)-5′-(1″,3″,3″-trimethylindol-(2″Z)-ylidene)-penta-1,3-dien-1′-yl)-3H-indol-1-ium), optimized at the CPCM-M06-2X/def2-SVP level of theory, with total Gibbs free energy differences (∆G) calculated at the CPCM-M06-2X/def2-TZVPP level. The ∆G values indicate that the DTMI-5 structure is 1.58 and 2.64 kcal/mol more stable than the alternative DTMI-5-Z and DTMI-5-ZZ forms, respectively. Therefore, subsequent calculations focused on the “all-E-configuration” structure of DTMI-5. A general view of DTMI-5 structure and atoms’ numbering is presented in Figure S1.
The next step in analyzing the mechanism of DTMI-5’s interaction with oxidants was to identify the sites in the DTMI-5 molecule most susceptible to HO• and HOO• radicals, which are commonly considered the active species produced by the Fenton reagent. ALIE and RFF isosurfaces were used as 3D descriptors of reactivity, providing insight into the molecular sites most sensitive to radical attack (see Figure 2). Low ALIE values correspond to positions where electrons are less tightly bound, making them more vulnerable to free radical attack. Regions with low ALIE values are highlighted in blue, and the three methine groups (1′, 3′, 5′) of the penta-1′,3′-dien-1′-yl moiety were identified as the most sensitive to free radical attacks.
Similarly, the RFF isosurface highlights the penta-1′,3′-dien-1′-yl moiety, as well as the carbon and nitrogen atoms connected to the indolyl systems. However, while the RFF indicates the chain most affected by free radical attack, it does not specify which particular atom is more likely to interact with a radical. Therefore, RFF atom indices were calculated using Equation (1), where RFFi represents the index of the i-th atom. In this equation, q is the atomic partial charge of the i-th atom in molecular states with an increased (N + 1) or decreased (N − 1) number of electrons.
R F F i = q i N 1 q i N + 1 2
Considering that various electron density partitioning schemes can lead to different partial charges and RFF indices [21,22,23,24], partial charges were calculated using the Löwdin [25], Hirshfeld [26,27], Mulliken [27], and CHELPG [28] approaches, with the corresponding RFF indices summarized in Table S1. Figure 2 shows the highest RFF indices calculated using Hirshfeld partial charges. These calculated indices support the findings of the ALIE analysis. Specifically, the methine groups at positions 1′, 3′, and 5′ of the penta-1′,3′-dien-1′-yl linker have the highest RFF indices, suggesting that these groups are the most likely centers for the initial attack by free radicals.
Based on the above calculations of DTMI-5 reactivity and previously published data on the oxidation of similar compounds [29,30,31], several mechanisms for DTMI-5 oxidation were considered. Figure 3 illustrates the oxidation of DTMI-5 to the dication-radical state (DCR) (Figure 3b) and further oxidation leading to the introduction of hydroxyl groups into the molecule, followed by subsequent transformations. The possible formation of peroxide-containing structures was not considered, as these forms are expected to be less stable in the presence of Fe2+/3+ ions [32]. However, oxidative hydroxylation of the double bonds in the penta-1′,3′-dien-1′-yl linker results in cationic structures A34-1 (Figure 3c) and A56-1 (Figure 3d). Subsequent tautomerization of the conjugated double-bond system, along with deprotonation, leads to the corresponding ketones A34-2 (Figure 3e) and A56-2 (Figure 3f). Due to the disruption of double-bond conjugation, the hydroxyl group can rotate, forming structures A34-3 (Figure 3g) and A56-3 (Figure 3h), which contain O–H•••O = C intermolecular hydrogen bonds between the alcohol and ketone groups. Finally, through keto-enol tautomerization, structures A34-4 (Figure 3i) and A56-3 (Figure 3j) can be formed. Their stability can be explained by the increase in the number of double bonds involved in conjugation.
Alternatively, the oxidation of cyanine dyes can lead to aldehyde formation via the breaking of one of the linker’s double bonds and the oxidation of methine groups into aldehydes [30]. The oxidation of the first, second, or third double bond in the penta-1′,3′-dien-1′-yl moiety results in the formation of aldehyde pairs AN4 + AC1, AN2 + AC3, and AN0 + AC5, respectively (see Figure 4). It is important to note that further oxidation of the aldehydes into corresponding acids may occur. However, this study only considers the formation of the zwitterionic structure ICZ (see Figure 4a). While the proposed oxidation products do not fully represent the complete oxidation pathway of DTMI-5, they can be used to estimate the oxidation potential of the selected processes and to explain the experimentally observed absorption peaks in the 340–360 nm region.
The next step in our study was to calculate the oxidation potentials (U0) for the reactions that lead to the proposed oxidation products and their UV-Vis absorption maxima. U0 was calculated using Equation (2) and corresponds to general proton-coupled reduction reactions of the form Ox + nee− + npH+ → Red + nwH2O, where ne, np, and nw represent the number of electrons, protons, and water molecules involved in the reaction, respectively. ∆G0sol was calculated according to the reactions summarized in Table S2. The absolute potential of the standard hydrogen electrode (USHE) was set at +4.43 V [33,34], and ∆G0sol(H+), the solvation Gibbs free energy of protons, was taken as –11.38 eV [34,35]. The resulting U0 values are summarized in Table 1. Notably, the formation of hydroxylated forms A34-x and A56-x is associated with U0 values higher than +1.0 V, whereas the formation of DCR, aldehyde-type structures, and the ICZ zwitterion shows U0 values below +0.9 V.
U 0 = G s o l 0 n e U S H E
The obtained U0 values do not allow us to definitively determine which forms are more likely, as all the forms, at least theoretically, can be produced due to the very strong oxidation potential of the Fenton reagent (~2.0–2.8 V) or Fe3+ ions (+0.771 V). For this reason, the absorption spectra of the proposed structures were also considered. Absorption spectra were calculated at the CPCM-CIS(D)/def2-SVP level of theory. Our previous studies on the similar carbocyanine dye Astra Phloxine demonstrated the excellent accuracy of the CIS(D) method [36], which is why the calculated spectra can be considered reliable. The theoretical absorption maxima are summarized in Table 1.
It is worth emphasizing that structure AN4, with calculated λmax and U0 values of 358.1 nm and +0.722 V, respectively, has an absorption maximum closely matching the experimental broad peak observed at 340–360 nm. This is slightly different from the literature value of 410 nm, but the deviation can be attributed to solvent effects, as the experimental spectrum was recorded in DMSO [36]. Similarly, the absorption maximum of AC5max = 337.4 nm, U0 = +0.444 V) aligns well with the experimental broad peak in the 340–360 nm range.
The accuracy of the UV-Vis calculations is noteworthy. For instance, the predicted absorption maximum of AN2max = 295.8 nm) falls between the experimental data recorded in DMSO (λmax = 338 nm) [37], methanol (λmax ~260 nm) [38], and water (λmax ~ 270 nm) [38]. Additionally, the calculated absorption maximum of AN0max = 242.9 nm) is close to experimental values measured in ethanol (λmax = 251 nm) [39] and water (λmax = 250 nm) [40]. These results indicate that the oxidation of DTMI-5 likely proceeds through reaction pathways leading to the formation of carbonyl compound pairs AN4 + AC1, AN2 + AC3, and AN0 + AC5. The possibility of the formation of the AN2 + AC3 pair is supported by its midpoint U0 value of +0.641 V. Additionally, none of the proposed oxidation products interfere with the primary signal of DTMI-5, as the absorption maxima of all structures are significantly blue-shifted. These findings are in line with the previously published work by Zhang et al. [30], where the authors proposed the structures for the photodegradation products of a similar cyanine dye based on the electrospray ionization mass spectrometry.
The UV-Vis absorption maxima of DTMI-5, AN4, and AC5 are attributed to π-π electron transitions within their conjugated π-bond systems. The first excited states of these structures are predominantly composed of HOMO → LUMO transitions. The isosurfaces of the HOMO and LUMO for these structures are presented in Figure S2.

3.2. Optimization of Reaction Conditions

The effect of DTMI-5 concentration was studied in the range from 1 to 7 µM. With the increase of DTMI-5 concentration, the analytical signal also raises, and at the same time, the reaction speed also slightly decreases. At concentrations higher than 7 µM, absorbance could not be measured correctly due to the very high value. Furthermore, 7 µM DTMI-5 concentration was chosen as an optimal one.
DTMI-5 reacts with hydrogen peroxide in the presence of Fe(II) or Fe(III) in an acidic medium. However, the dye itself can undergo transformations when the acidity of the medium changes, which is associated with its protolytic properties. For DTMI-5, the pK value is 0.762. This means that the intensely colored cationic form of the dye (ε637 = 202,700) dominates at pH above 1.50. In a more acidic environment (pH less than 0.5), the already protonated colorless form of the dye prevails, which is characterized by significantly lower light absorption coefficient values (ε485 = 22,200) [41]. Therefore, spectrophotometric determination using DTMI-5 is only possible in a slightly acidic environment, at pH 1.5 or higher. The effect of an acidic medium was studied in the range of HCl concentration from 0.005 to 0.05 M. After 0.03 M HCl concentration, the analytical signal stopped growing, and the time of the reaction end did not change. The same results were obtained for Fe(III) determination without hydrogen peroxide. Furthermore, 0.035 M HCl was used for further experiments.
The influence of stirring speed on absorbance was studied in the range from 0 to 400 rpm. It was found that after 150 rpm, the analytical signal stops to grow, and the time of the reaction end does not change. Therefore, 200 rpm stirring speed was chosen for further experiments to ensure passing the minimum threshold.
Optimization of Fe(II) concentration for hydrogen peroxide determination. The effect of Fe(II) concentration was studied from 10 to 100 µM. At concentrations higher than 70 µM Fe(II), the analytical signal stopped increasing, and the time of the reaction end did not change. Therefore, 70 µM Fe(II) concentration was applied for further experiments.
Optimization of H2O2 concentration for Fe(III)/Fe(II) determination. The effect of hydrogen peroxide concentration was studied in the range from 10 to 150 µM. At concentrations higher than 100 µM H2O2, the analytical signal stopped increasing, and the time of the reaction end did not change. Furthermore, 100 µM H2O2 concentration was applied for further experiments.

3.3. Interference Study

Some metal cations that could affect the speed of the DTMI-5 reaction with H2O2 and oxidants could serve as the main interferents. The interfering effect was considered absent if the change in the analytical signal did not exceed 5% compared to the difference between the solution’s absorbance in the presence of and without the analyte.
Ba2+, Mg2+, Zn2+, Pb2+, Co2+, Cu2+, Cd2+, Ca2+, Mn2+, Na+, K+, NO3, SO42−, Cl, fructose, and saccharose do not interfere at concentrations not exceeding 10 mM in the case of determination of all three species. Al3+ does not interfere at concentrations not exceeding 3 mM. Tolerant concentration for Sr2+ and Ni2+ is 1 mM. Ag+ and Cr3+ do not interfere at 50 µM. Cr2O72−-tolerant concentration is 10 µM.
Fe(III) does not interfere with Fe(II) determination at a concentration of 0.5 µM. Applying 10−3 M NaF as a masking agent increases tolerant concentrations up to 10 µM. However, it should be mentioned that in the case of using the masking agent, the calibration curve for Fe(II) detection should be built considering the influence of NaF. Fe(II) also partially reacts with NaF, which leads to a change in the calibration curve. In the case of Fe(III) determination (as described in Section 2.5), Fe(II) does not interfere up to 50 µM.

3.4. Analytical Parameters

The time of the complete finishing of the Fenton reaction depends on the concentrations of added hydrogen peroxide and Fe(II) or Fe(III). Kinetic curves of the Fenton reaction under different concentrations of hydrogen peroxide and Fe(II) or Fe(III) are shown in Figure 5. Both absorbance at a fixed time and time of the reaction end could be used as analytical signals. The LOD and LOQ values were calculated as the concentration equivalent to three times and ten times the ratio of the standard error of the regression to the slope of the calibration curve, respectively.
The concentration range for hydrogen peroxide determination was from 40 to 980 µM. The dependence of H2O2 concentration on the time of the reaction end had equation t(s) = 0.1145·C(M)−0.686 with r2 = 0.9972. After linearization, this dependence had a regression equation t(s) = 0.004·C(M)−1 + 16.134 with r2 = 0.9826. At 980 µM H2O2 concentration and higher, the Fenton reaction finishes 13 s after the measurements start. This time was chosen as a fixed time for absorbance measurements as an analytical signal. The dependence of absorbance at 13 s from hydrogen peroxide concentration also was not linear. After linearization, the regression equation is A = 0.4024·lnC(M) + 4.1986, with r2 = 0.9631. The linear part of the initial dependence was up to 250 µM and characterized with a regression equation A = 3113.6·C(M) + 0.0338 with r2 = 0.9980. It was used for LOD and LOQ calculations. LOD and LOQ were 12.3 and 40.9 µM, respectively. RSD values calculated for different concentrations ranged from 2.11 to 4.58%.
The concentration range for Fe(II) determination was from 3 to 70 µM. The dependence of Fe(II) concentration on the time of the reaction end had the equation t(s) = 0.0013·C(M)−0.961 with r2 = 0.9965. After linearization, this dependence had a regression equation t(s) = 0.0008·C(M)−1 + 5.462 with r2 = 0.9953. At 70 µM Fe(II) concentration and higher, the Fenton reaction finishes 13 s after the start of measurements. This time was chosen as a fixed time for absorbance measurements as an analytical signal. The dependence of absorbance at 13 s from Fe(II) concentration also was not linear. After linearization, it had regression equation A = 0.4171·lnC(M) + 5.3357 with r2 = 0.946. The linear part of the initial dependence was up to 10 µM. A = 46667·C(M) with r2 = 0.9988. It was used for LOD and LOQ calculations. LOD and LOQ were 0.88 and 2.95 µM, respectively. RSD values calculated for different concentrations were from 6.48 to 7.4%.
The concentration range for Fe(III) determination was from 1.32 to 45 µM. The relationship between Fe(III) concentration and the time of the reaction end was described by the equation t(s) = 0.0116·C(M)−0.789 with r2 = 0.9989. After linearization, the equation became t(s) = 0.0008·C(M)−1 + 15.094 with r2 = 0.9948. At Fe(III) concentrations of 45 µM and higher, the Fenton reaction was completed 25 s after the start of the measurements. This time, along with 13 s, was chosen as fixed times for absorbance measurements, which served as the analytical signal. For both time points, the dependence of absorbance upon Fe(III) concentration was not linear. After linearization, the regression equation for 25 s was A = 0.3767·lnC(M)+5.1863 with r2 = 0.9897. The linear part of the absorbance vs. Fe(III) concentration dependence for 25 s was valid up to 6 µM, with the regression equation A = 111714·C(M) and r2 = 0.9971. For the 13 s fixed time, the equation was A = 63365·C(M). The LOD and LOQ for 25 s were 0.39 and 1.32 µM, respectively. The RSD values calculated for different concentrations ranged from 1.76 to 5.12%.
In contrast to the Fenton reaction, the reaction of DTMI-5 with Fe(III) in the absence of H2O2 does not lead to complete oxidation of DTMI-5 at any concentrations of Fe(III). Although the reaction time varies with different concentrations of Fe(III), the difference in absorbance between the start and the completion of the reaction was chosen as the analytical signal (Figure 6). The linear concentration range for Fe(III) determination was from 0.5 to 6 µM, with a calibration curve given by A = 135930·C(M) and r2 = 0.9996. The LOD and LOQ were 0.16 and 5.27 µM, respectively. The RSD values calculated for different concentrations ranged from 1.36 to 6.37%.
The environmental friendliness of the proposed method for Fe(III)/Fe(II) and H2O2 determination was evaluated with the Analytical GREEnness (AGREE) metric (Figure S3) [42]. The obtained score (0.68) demonstrates the high level of greenness of the proposed procedure. It has a low level of energy consumption, does not require any extraction or the use of toxic compounds, involves minimal sample preparation and a reduced number of operations, and is also semi-automatic. However, the method requires a relatively large volume of samples.

3.5. Analysis of Real Samples

The procedure for hydrogen peroxide determination was tested on Kallos 6% perfumed oxidation emulsion, and the results are presented in Table 2. The manufacturer claims that the emulsion contains 6% H2O2. However, the proposed procedure found 5.92% H2O2. The addition of standards to the sample also showed good recoveries (106.4% and 110.0%).
Model solutions and real samples (tap water and fertilizer) were chosen to test procedures for the joint determination of Fe(II) and Fe(III) species (Table 3). Fe species in fertilizer were in the form of chelate, which required additional sample pretreatment to liberate the iron. Satisfactory recoveries, ranging from 96.0% to 112.8%, were obtained for all samples.

3.6. Comparison with Methods Proposed in the Literature

In recent years, many simple spectrophotometric methods have been proposed for the determination of H2O2, Fe(II), or Fe(III). Some of them are listed in Table 4. The number of methods devoted to Fe(III) determination is significantly greater than those for Fe(II) determination. However, there have been only a few methods dedicated to the joint determination of both Fe(III) and Fe(II) species. It should also be noted that many fluorometric methods for the determination of H2O2, Fe(II), or Fe(III) have been proposed in recent years, including the use of quantum dots. These methods are usually very sensitive but are much more complex than the proposed method, requiring sophisticated and rarely used equipment in routine laboratory practice.
This article proposes a procedure for the joint determination of Fe(III)/Fe(II) species and H2O2. The application of an optical probe for measuring kinetic curves enables fast, reproducible measurements. The interval between recorded spectra was less than one second and could be further reduced for faster reactions. It also allows measurements to be taken from the very beginning of the reaction. The sensitivity of the proposed methods is sufficiently high to enable the analysis of many samples.

4. Conclusions

The Fenton reaction of DTMI-5 with hydrogen peroxide in the presence of iron is first proposed for the determination of H2O2 and Fe(III)/Fe(II) species.
The theoretical calculations of the reactive sites in the DTMI-5 molecule under free radical attack indicate that the methine groups of the penta-1′,3′-dien-1′-yl linker are the predominant reactive centers under oxidation conditions. The DFT-calculated redox potentials of the considered structures range from 0.34 to 1.65 eV, suggesting that all of them can form under the action of the Fenton reagent, a powerful oxidant. Among the proposed aldehyde-type products, the AN4 and AC5 structures are characterized by CIS(D)-calculated absorption maxima of 358.1 and 337.4 nm, respectively, which perfectly match the experimentally observed broad peak at 340–360 nm. The observed UV-Vis absorption maxima of the primary sensor (DTMI-5) and its oxidized forms (AN4 and AC5) result from π-π electron transitions in their conjugated π-bond systems.
The use of the optical immersion probe for spectrophotometric measurements allows for precise kinetic curve generation, eliminating the need to transfer the sample to a cuvette. It also enables proper stirring of the solution while measuring. Optical probes have great potential for application to other reaction systems, both with and without extraction applications. The proposed method is fast, easy to apply, does not require expensive equipment, and is environmentally friendly. LODs for H2O2, Fe(II), and Fe(III) determination were 12.3, 0.88, and 0.16 µM, respectively. The developed procedures were applied to the determination of hydrogen peroxide in oxidation emulsion and Fe(III)/Fe(II) species in model and real samples (tap water and fertilizer). The reaction system could also be further considered as a way of cleaning water from hydrogen peroxide.

Supplementary Materials

The following supporting information can be downloaded at: https://www.mdpi.com/article/10.3390/chemosensors12120270/s1. Figure S1: General view and numbering in DTMI-5; Figure S2: General view and numbering in DTMI-5; Figure S3: The greenness score for the developed procedure for Fe(III)/Fe(II) and H2O2 determination obtained by the AGREE metric [42]. Blue numbers represent the score of each of the categories; Table S1: Radical Fukui function indexes calculated using Hirshfeld (H), Löwdin (L), Mulliken (M), and CHELPG (C) partial charges. Atom numbering matches Figure S1; Table S2: Redox reactions consided for the calculation of U0 for the different redox forms of DTMI-5.

Author Contributions

Formal analysis, M.F.; conceptualization, Y.B.; investigation, A.S.; supervision, Y.B.; writing—original draft, A.S. and M.F.; writing—review and editing, Y.B. and M.F. All authors have read and agreed to the published version of the manuscript.

Funding

Yaroslav Bazel and Arina Skok thank the Scientific Grant Agency VEGA of the Ministry of Education, Science, Research, and Sport of the Slovak Republic and the Slovak Academy of Sciences for their support (Grant No. 1/0177/23).

Institutional Review Board Statement

Not applicable.

Informed Consent Statement

Not applicable.

Data Availability Statement

Data are contained within the article.

Conflicts of Interest

The authors declare that they have no known competing financial interests or personal relationships that could have appeared to influence the work reported in this paper.

References

  1. Ruben Vasquez-Medrano, R.; Prato-Garcia, D.; Vedrenne, M. Chapter 4—Ferrioxalate-Mediated Processes in Advanced Oxidation Processes for Waste Water Treatment Emerging Green Chemical Technology, 1st ed.; Ameta, S.C., Ameta, R., Eds.; Academic Press: Cambridge, MA, USA, 2018; pp. 89–113. [Google Scholar]
  2. Tóth, J.; Bazel, Y. Development of a new kinetic spectrophotometric method for the determination of chromium with an optical probe. Appl. Spectrosc. 2019, 73, 492–502. [Google Scholar] [CrossRef] [PubMed]
  3. Assiri, M.A.; Munir, F.; Waseem, M.T.; Irshad, H.; Rauf, W.; Shahzad, S.A. Restricted intramolecular vibrations assisted enhanced fluorescence emission response of probe: A new experimental and theoretical approach for the detection of hydrogen peroxide. Microchem. J. 2023, 193, 109220. [Google Scholar] [CrossRef]
  4. Shang, L.L.; Song, X.; Niu, C.B.; Lv, Q.Y.; Li, C.L.; Cui, H.F. Red fluorescent nanoprobe based on Ag@Au nanoparticles and graphene quantum dots for H2O2 determination and living cell imaging. Microchim. Acta 2021, 188, 291. [Google Scholar] [CrossRef] [PubMed]
  5. Eze, F.N.; Jayeoye, T.J.; Eze, R.C. Construction, characterization and application of locust bean gum/ Phyllanthus reticulatus anthocyanin—based plasmonic silver nanocomposite for sensitive detection of ferrous ions. Environ. Res. 2023, 228, 115864. [Google Scholar] [CrossRef] [PubMed]
  6. Alraqa, S.Y.; Kaya, E.N.; Taşci, N.; Erbahar, D.; Durmuş, M. Pyrene substituted Phthalonitrile derivative as a fluorescent sensor for detection of Fe3+ ions in solutions. J. Fluoresc. 2022, 32, 1801–1813. [Google Scholar] [CrossRef] [PubMed]
  7. Zhao, Y.; Truhlar, D.G. The M06 suite of density functionals for main group thermochemistry, thermochemical kinetics, noncovalent interactions, excited states, and transition elements: Two new functionals and systematic testing of four M06-class functionals and 12 other functionals. Theor. Chem. Acc. 2008, 120, 215–241. [Google Scholar]
  8. Weigend, F.; Ahlrichs, R. Balanced basis sets of split valence, triple zeta valence and quadruple zeta valence quality for H to Rn: Design and assessment of accuracy. Phys. Chem. Chem. Phys. 2005, 7, 3297–3305. [Google Scholar] [CrossRef] [PubMed]
  9. Weigend, F. Accurate Coulomb-fitting basis sets for H to Rn. Phys. Chem. Chem. Phys. 2006, 8, 1057–1065. [Google Scholar] [CrossRef]
  10. Morgante, P.; Autschbach, J. Strategies to calculate Fukui functions and applications to radicals with SOMO–HOMO inversion. J. Chem. Theory Comput. 2023, 19, 3929–3942. [Google Scholar] [CrossRef]
  11. Politzer, P.; Murray, J.S.; Bulat, F.A. Average local ionization energy: A review. J. Mol. Model. 2010, 16, 1731–1742. [Google Scholar] [CrossRef] [PubMed]
  12. Hanson-Heine, M.W.D.; George, M.W.; Besley, N.A. A scaled CIS(D) based method for the calculation of valence and core electron ionization energies. J. Chem. Phys. 2019, 151, 034104. [Google Scholar] [CrossRef] [PubMed]
  13. Garcia-Ratés, M.; Neese, F. Efficient implementation of the analytical second derivatives of Hartree-Fock and hybrid DFT energies within the framework of the conductor-like polarizable continuum model. J. Comput. Chem. 2019, 40, 1816–1828. [Google Scholar] [CrossRef] [PubMed]
  14. Helmich-Paris, B.; de Souza, B.; Neese, F.; Izsák, R. An improved chain of spheres for exchange algorithm. J. Chem. Phys. 2021, 155, 104109. [Google Scholar] [CrossRef] [PubMed]
  15. Neese, F. Software update: The ORCA program system—Version 5.0, Wiley Interdiscip. Rev. Comput. Mol. Sci. 2022, 12, e1606. [Google Scholar] [CrossRef]
  16. Lu, T. A comprehensive electron wavefunction analysis toolbox for chemists, Multiwfn. J. Chem. Phys. 2024, 161, 082503. [Google Scholar] [CrossRef]
  17. Humphrey, W.; Dalke, A.; Schulten, K. VMD—Visual Molecular Dynamics. J. Molec. Graph. 1996, 14, 33–38. [Google Scholar] [CrossRef] [PubMed]
  18. Gesevicius, D.; Neels, A.; Jenatsch, S.; Hack, E.; Viani, L.; Athanasopoulos, S.; Nüesch, F.; Heier, J. Increasing photovoltaic performance of an organic cationic chromophore by anion exchange. Adv. Sci. 2018, 5, 1700496. [Google Scholar] [CrossRef]
  19. Gesevicius, D.; Neels, A.; Yakunin, S.; Hack, E.; Kovalenko, M.V.; Nuesch, F.; Heier, J. Superweak coordinating anion as superstrong enhancer of cyanine organic semiconductor properties. Chem. Phys. Chem. 2018, 19, 3356–3363. [Google Scholar] [CrossRef]
  20. Xu, W.; Leary, E.; Sangtarash, S.; Jirasek, M.; González, M.T.; Christensen, K.E.; Abellán Vicente, L.; Agraït, N.; Higgins, S.J.; Nichols, R.J.; et al. A Peierls transition in long polymethine molecular wires: Evolution of molecular geometry and single-molecule conductance. J. Am. Chem. Soc. 2021, 143, 48, 20472–20481. [Google Scholar] [CrossRef]
  21. Pucci, R.; Angilella, G.G.N. Density functional theory, chemical reactivity, and the Fukui functions. Found. Chem. 2022, 24, 59–71. [Google Scholar] [CrossRef]
  22. Fizer, M.; Fizer, O. Theoretical study on charge distribution in cetylpyridinium cationic surfactant. J. Mol. Model. 2021, 27, 203. [Google Scholar] [CrossRef] [PubMed]
  23. Fizer, O.; Fizer, M.; Sidey, V.; Studenyak, Y.; Mariychuk, R. Benchmark of different charges for prediction of the partitioning coefficient through the hydrophilic/lipophilic index. J. Mol. Model. 2018, 24, 141. [Google Scholar] [CrossRef]
  24. Fizer, M.; Slivka, M.; Baumer, V.; Slivka, M.; Fizer, O. Alkylation of 2-oxo(thioxo)-thieno[2,3-d]pyrimidine-4-ones: Experimental and theoretical study. J. Mol. Struct. 2019, 1198, 126858. [Google Scholar] [CrossRef]
  25. Bruhn, G.; Davidson, E.R.; Mayer, I.; Clark, A.E. Löwdin population analysis with and without rotational invariance. Int. J. Quantum Chem. 2006, 106, 2065–2072. [Google Scholar] [CrossRef]
  26. De Proft, F.; Van Alsenoy, C.; Peeters, A.; Langenaeker, W.; Geerlings, P. Atomic charges, dipole moments, and Fukui functions using the Hirshfeld partitioning of the electron density. J. Comput. Chem. 2002, 23, 1198–1209. [Google Scholar] [CrossRef]
  27. Saha, S.; Roy, R.K.; Ayers, P.W. Are the Hirshfeld and Mulliken population analysis schemes consistent with chemical intuition? Int. J. Quantum Chem. 2008, 109, 1790–1806. [Google Scholar] [CrossRef]
  28. Breneman, C.M.; Wiberg, K.B. Determining atom-centered monopoles from molecular electrostatic potentials. The need for high sampling density in formamide conformational analysis. J. Comput. Chem. 1990, 11, 361–373. [Google Scholar] [CrossRef]
  29. Lenhard, J.R.; Cameron, A.D. Electrochemistry and electronic spectra of cyanine dye radicals in acetonitrile. J. Phys. Chem. 1993, 97, 4916–4925. [Google Scholar] [CrossRef]
  30. Zhang, H.; Masui, Y.; Masai, H.; Terao, J. Post-synthetic modification of near-infrared absorbing cyclodextrin-encapsulated cyanine dyes for controlling absorption wavelength, stability, and singlet oxygen generation. Bull. Chem. Soc. Jpn. 2024, 97, uoae055. [Google Scholar] [CrossRef]
  31. Lisovskaya, A.; Carmichael, I.; Harriman, A. Pulse radiolysis investigation of radicals derived from water-soluble cyanine dyes: Implications for super-resolution microscopy. J. Phys. Chem. A 2021, 125, 5779–5793. [Google Scholar] [CrossRef]
  32. Olson, A.S.; Jameson, A.J.; Kyasa, S.K.; Evans, B.W.; Dussault, P.H. Reductive cleavage of organic peroxides by iron salts and thiols. ACS Omega 2018, 3, 14054–14063. [Google Scholar] [CrossRef] [PubMed]
  33. Reiss, H.; Heller, A. The absolute potential of the standard hydrogen electrode: A new estimate. J. Phys. Chem. 1985, 89, 4207–4213. [Google Scholar] [CrossRef]
  34. Fornari, R.P.; de Silva, P. A computational protocol combining DFT and cheminformatics for prediction of pH-dependent redox potentials. Molecules 2021, 26, 3978. [Google Scholar] [CrossRef] [PubMed]
  35. Zhan, C.G.; Dixon, D.A. Absolute hydration free energy of the proton from first-principles electronic structure calculations. J. Phys. Chem. A 2001, 105, 11534–11540. [Google Scholar] [CrossRef]
  36. Kakalejčikova, S.; Bazel, Y.; Fizer, M. Extraction-less green spectrofluorimetric method for determination of mercury using an Astra Phloxine fluorophore: Comprehensive experimental and theoretical studies. Spectrochim. Acta A Mol. Biomol. Spectrosc. 2024, 310, 123946. [Google Scholar] [CrossRef]
  37. Meguellati, K.; Spichty, M.; Ladame, S. Reversible synthesis and characterization of dynamic imino analogues of trimethine and pentamethine cyanine dyes. Org. Lett. 2009, 11, 1123–1126. [Google Scholar] [CrossRef] [PubMed]
  38. Fritz, H. Über α.β-ungesättigte β-Anilino-carbonyl-Verbindungen als Modellsubstanzen für den Chromophor von C-Curarin-III (C-Fluorocurarin). Chem. Ber. 1959, 92, 1809–1817. [Google Scholar] [CrossRef]
  39. Pfoertner, K.; Bernauer, K. Über die sensibilisierte Photooxydation einiger cyclischer N-Aryl-enamine. 3. Mitteilung über Indole, Indolenine und Indoline. Helv. Chim. Acta 1968, 51, 1787–1794. [Google Scholar] [CrossRef]
  40. Tomita, M.; Ageo, S.; Yamamoto, R. On the absorption spectra of some indole compounds. Spectrochemical studies on alkaloids and related compounds. J. Pharm. Soc. Jpn. 1944, 64, 164–167. [Google Scholar]
  41. Toth, J.; Bazel, Y.; Balogh, I. A fully automated system with an optical immersion probe (OIP) for high-precision spectrophotometric measurements. Talanta 2021, 226, 122185. [Google Scholar] [CrossRef]
  42. Pena-Pereira, F.; Wojnowski, W.; Tobiszewski, M. AGREE–Analytical GREEnness metric approach and software. Anal. Chem. 2020, 92, 10076–10082. [Google Scholar] [CrossRef]
  43. Gul, U.; Kanwal, S.; Tabassum, S.; Gilani, M.A.; Rahim, A. Microwave-assisted synthesis of carbon dots as reductant and stabilizer for silver nanoparticles with enhanced-peroxidase like activity for colorimetric determination of hydrogen peroxide and glucose. Microchim. Acta 2020, 187, 135. [Google Scholar] [CrossRef]
  44. Zou, J.; Cai, H.; Wang, D.; Xiao, J.; Zhou, Z.; Yuan, B. Spectrophotometric determination of trace hydrogen peroxide via the oxidative coloration of DPD using a Fenton system. Chemosphere 2019, 224, 646–652. [Google Scholar] [CrossRef] [PubMed]
  45. Wang, M.; Wang, D.; Qiu, S.; Xiao, J.; Cai, H.; Zou, J. Multi-wavelength spectrophotometric determination of hydrogen peroxide in water byoxidative coloration of ABTS via Fenton reaction. Environ. Sci. Pollut. Res. 2019, 26, 27063–27072. [Google Scholar] [CrossRef]
  46. Zhang, W.; Li, X.; Cui, T.; Li, S.; Qian, Y.; Yue, Y.; Zhong, W.; Xu, B.; Yue, W. PtS2 nanosheets as a peroxidase-mimicking nanozyme for colorimetric determination of hydrogen peroxide and glucose. Microchim. Acta 2021, 188, 174. [Google Scholar] [CrossRef]
  47. Yavuz, T.; Pelit, L. Sensitive determination of hydrogen peroxide in real water samples by high spin peroxo complex. Turk. J. Chem. 2020, 44, 435–447. [Google Scholar] [CrossRef]
  48. Lua, C.; Wang, Y.; Xu, B.; Zhang, W.; Xie, Y.; Chen, Y.; Wang, L.; Wang, X. A colorimetric and fluorescence dual-signal determination for iron (II) and H2O2 in food based on sulfur quantum dots. Food Chem. 2022, 366, 130613. [Google Scholar] [CrossRef]
  49. Khani, S.; Mohajer, F.; Ziarani, G.M.; Badiei, A.; Ghasemi, J.B. Using the extract of pomegranate peel as a natural indicator for colorimetric detection and simultaneous determination of Fe3+ and Fe2+ by partial least squares–artificial neural network. J. Chemom. 2023, 37, e3390. [Google Scholar] [CrossRef]
  50. Cheng, F.; Zhang, T.; Yang, C.; Zhu, H.; Li, Y.; Sun, T.; Zhou, C. A direct and rapid method for determination of total iron in environmental samples and hydrometallurgy using UV–Vis spectrophotometry. Microchem. J. 2022, 179, 107478. [Google Scholar] [CrossRef]
  51. Cheng, F.; Zhang, T.; Sun, T.; Wang, Y.; Zhou, C.; Zhu, H.; Li, Y. A simple, sensitive and selective spectrophotometric method for determining iron in water samples. Microchem. J. 2021, 165, 106154. [Google Scholar] [CrossRef]
  52. Zhou, X.; Zhao, G.; Tan, X.; Qian, X.; Zhang, T.; Gui, J.; Yang, L.; Xie, X. Nitrogen-doped carbon dots with high quantum yield for colorimetric and fluorometric detection of ferric ions and in a fluorescent ink. Microchim. Acta 2019, 186, 67. [Google Scholar] [CrossRef] [PubMed]
  53. Filipe João, A.; Squissato, A.L.; Fernandes, G.M.; Cardoso, R.M.; Batista, A.D.; Muñoz, R.A.A. Iron (III) determination in bioethanol fuel using a smartphone-based device. Microchem. J. 2019, 146, 1134–1139. [Google Scholar] [CrossRef]
  54. Lapanantnoppakhun, S.; Tengjaroensakul, U.; Mungkornasawakul, P.; Puangpila, C.; Kittiwachana, S.; Saengtempiam, J.; Hartwell, S.K. Green analytical chemistry experiment: Quantitative analysis of iron in supplement tablets with Vis spectrophotometry using tea extract as a chromogenic agent. J. Chem. Educ. 2019, 97, 207–214. [Google Scholar] [CrossRef]
Figure 1. The alternative structures of DTMI-5 expected in water solution: (a) 1,3,3-trimethyl-2-((1′E,3′E,5′E)-5′-(1″,3″,3″-trimethylindol-(2″E)-ylidene)-penta-1′,3′-dien-1′-yl)-3H-indol-1-ium (DTMI-5); (b) 1,3,3-trimethyl-2-((1′E,3′E,5′E)-5′-(1″,3″,3″-trimethylindol-(2″Z)-ylidene)-penta-1′,3′-dien-1′-yl)-3H-indol-1-ium (DTMI-5-Z); (c) 1,3,3-trimethyl-2-((1′Z,3′E,5′E)-5′-(1″,3″,3″-trimethylindol-(2″Z)-ylidene)-penta-1′,3′-dien-1′-yl)-3H-indol-1-ium (DTMI-5-ZZ).
Chemosensors 12 00270 g001
Figure 2. ALIE (a) and RFF (b) isosurfaces. Red/pink colors indicate high values, whereas blue/cyan areas indicate minima. The values of ALIE (in eV) and Hirshfeld population-based RFF indexes (in elementary charge units) are shown.
Chemosensors 12 00270 g002
Figure 3. Proposed mechanisms of oxidation of DTMI-5 (a). Considered products are: dication radical DCR (b); products of oxidative hydroxylation of double bonds between carbons 3 and 4 A34-1 (c), and between carbons 5 and 6 A56-1 (d); corresponding α-hydroxy ketones A34-2 (e) and A56-2 (f); consequent rotamer structures A34-3 (g) and A56-3 (h); finally, tautomeric α-hydroxy enol structures A34-4 (i) and A56-4 (j).
Chemosensors 12 00270 g003
Figure 4. Proposed mechanisms of oxidation of DTMI-5 to shorter-chain aldehydes: AN4 (b), AC1 (c), AN2 (d), AC3 (e), AN0 (f), AC5 (g), and zwitterion ICZ (a).
Chemosensors 12 00270 g004
Figure 5. Kinetic curves of the Fenton reaction under different concentrations of hydrogen peroxide (a) and Fe(II) (b) or Fe(III) (c). Furthermore, 7 µM DTMI-5, 0.035 M HCl, 200 rpm, 70 µM Fe(II) (a) and 0.1 mM H2O2 (b,c).
Chemosensors 12 00270 g005
Figure 6. Kinetic curves of the DTMI-5 reaction with Fe(III) (a) and calibration curve for Fe(III) determination (b); 7 µM DTMI-5, 0.035 M HCl, 200 rpm.
Chemosensors 12 00270 g006
Table 1. Redox potentials (U0, in V) of the reactions that lead to the considered oxidation products and UV-VIS absorption maxima (λmax, in nm) of these products. Entries with the best match between the calculated absorption maxima and the experimental band at approximately 340–360 nm are highlighted in bold.
StructureU0, Vλmax, nm
A56-1+1.098304.0
A34-1+1.186302.1
A56-2+1.236270.1
A34-2+1.327286.4
A56-3+1.157270.6
A34-3+1.313282.0
A56-4+1.359281.0
A34-3+1.651318.3
DCR+0.827424.9
ICZ+0.335237.0
AN4+0.722358.1
AC1+0.722302.9
AN2+0.641295.8
AC3+0.641316.4
AN0+0.444242.9
AC5+0.444337.4
Table 2. Determination of hydrogen peroxide in Kallos 6% perfumed oxidation emulsion. P = 0.95, n = 5.
Added H2O2, %Found H2O2, %Recovery, %
5.92 ± 1.15
9.0715.9 ± 0.9110.0
17.324.3 ± 2.5106.4
Table 3. Determination of Fe(III)/Fe(II) in real and model samples. p = 0.95, n = 5.
SampleAdded Fe(II), µMAdded Fe(III), µMFound Fe(II), µMRecovery, %Found Fe(III), µMRecovery, %
Model solution 15.11 ± 1.18102.22.43 ± 0.32101.2
Model solution 216.8 ± 2.9112.014.8 ± 0.798.7
Model solution 314.4 ± 2.796.05.89 ± 0.55103.3
Tap water˂LOD0.592 ± 0.144
3.22˂LOD3.93 ± 0.38103.5
8.919.46 ± 0.58106.20.576 ± 0.097
Fertilizer 40.024 ± 0.003%0.017 ± 0.001%
0.028%0.049 ± 0.002%112.8
0.032%0.055 ± 0.00796.90.018 ± 0.001%
1 Model solution: 2.4 µM Fe(III), 5.0 µM Fe(II). Fe(II) was determined by masking Fe(III) with 1 mM NaF. 2 Model solution: 15 µM Fe(III), 15 µM Fe(II). Fe(II) was determined by masking Fe(III) with 1 mM NaF. 3 Model solution: 5.7 µM Fe(III), 15 µM Fe(II). 4 The crystalline fertilizer contains 0.029% Fe in the form of EDTA chelate.
Table 4. Comparison of proposed methods with the spectrophotometry and colorimetry methods proposed in the literature.
ReagentSampleLOD, µMDetermination Range, µMRef.
H2O2
carbon silver nano-assembly-0.0090.1–100[43]
N,N-diethyl-p-phenylenediamine, Fe(II)water0.050–12[44]
2,2′-azino-bis(3-ethylbenzothiazoline-6 sulfonate, Fe(II)water0.10–40[45]
PtS2 nanosheets, 3,3′,5,5′-tetramethylbenzidine-0.331–100[46]
peroxo-Fe(III)-EDTA complexwater2.58.3–4080[47]
DTMI-5, Fe(II)oxidation emulsion12.3 40–980 This
work
Fe(II)
plasmonic Ag nanocomposite based on locust bean gum and Phyllanthus reticulatus anthocyanin juice, ferrous fumarate, water0.380.1–100[5]
sulfur quantum dotsmilk, honey, water0.541.25–500[48]
pomegranate peel extractwater140 µg/L1000–10,000 µg/L[49]
DTMI-5, H2O2water, fertilizer0.88 3–70This work
Fe(III)
nitroso R salt, NaI, cetyl trimethyl ammonium chloridewater, CRM, electrolyte, purification liquid0.045 (total iron)0.15–64[50]
1-nitroso-2-naphthol-3,6-disulphonic acid disodium salt, hexadecyl trimethyl ammonium bromidewater0.0670.2–95[51]
N-carbon dotswater0.281–21 [52]
KSCNbioethanol fuel6.18 mg/L0.5–10 mg/L[53]
pomegranate peel extractwater530 µg/L1000–12,000 µg/L[49]
tea extractiron supplement samples2000 µg/L˂40,000 µg/L[54]
DTMI-5water, fertilizer0.16 0.5–6This work
DTMI-5, H2O2water, fertilizer0.39 1.32–45This work
Disclaimer/Publisher’s Note: The statements, opinions and data contained in all publications are solely those of the individual author(s) and contributor(s) and not of MDPI and/or the editor(s). MDPI and/or the editor(s) disclaim responsibility for any injury to people or property resulting from any ideas, methods, instructions or products referred to in the content.

