Review

Photoacoustic Imaging of pH-Sensitive Optical Sensors in Biological Tissues

1
Departments of Cogno-Mechatronics Engineering and Optics & Mechatronics Engineering, Pusan National University, Busan 46241, Republic of Korea
2
School of Biomedical Convergence Engineering, Pusan National University, Yangsan 50612, Republic of Korea
3
Departments of Electrical Engineering, Convergence IT Engineering, Medical Science and Engineering, Mechanical Engineering, and Medical Device Innovation Center, Pohang University of Science and Technology (POSTECH), Pohang 37673, Republic of Korea
*
Author to whom correspondence should be addressed.
These authors contributed equally to this work.
Chemosensors 2024, 12(12), 257; https://doi.org/10.3390/chemosensors12120257
Submission received: 28 October 2024 / Revised: 4 December 2024 / Accepted: 7 December 2024 / Published: 9 December 2024
(This article belongs to the Collection pH Sensors, Biosensors and Systems)

Abstract

:
Photoacoustic imaging is an emerging biomedical imaging technique that enables non-invasive visualization of the optical absorption properties of biological tissues in vivo. Although numerous studies have used contrast agents to achieve high-contrast imaging in deep tissues, targeting specific areas remains a challenge when using agents that are continuously activated. Recent research has focused on developing triggered contrast agents that are selectively activated in target areas. This review delves into the use of pH-triggered contrast agents in photoacoustic imaging, which take advantage of the lower pH of the tumor microenvironment compared to normal tissues. The paper discusses the mechanisms of pH-triggered contrast agents that contribute to improving depth and contrast in photoacoustic tumor imaging. In addition, the integration of functionalities, such as photothermal therapy and drug delivery monitoring, into these agents demonstrates significant potential for biomedical applications.

1. Introduction

Photoacoustic imaging (PAI) is an advanced, non-invasive, and non-ionizing technique that uses the photoacoustic (PA) effect, wherein ultrasound (US) waves are generated through light absorption and subsequent heat release [1]. One of the most significant advantages of PAI is its molecular functional imaging capability, which is achieved by analyzing multispectral responses of biological tissues in vivo [2]. Recently, PAI has been used extensively in biomedical imaging, particularly focusing on cancer diagnosis [3,4,5,6], theragnosis [7,8,9,10], and drug delivery tracking [11].
PAI is increasingly being applied in biomedical studies owing to its compact and cost-effective implementation compared to conventional biomedical imaging modalities such as X-ray computed tomography and magnetic resonance imaging. Its non-ionizing characteristics ensure a safer and more straightforward experimental setup. Compared with other non-ionizing imaging techniques, PAI has several distinct advantages. While US imaging is limited to visualizing structural anatomy using acoustic impedance differences, PAI provides functional information by detecting variations in optical absorption within tissues. Similarly, although optical imaging techniques such as fluorescence imaging and two-photon microscopy offer molecular functional analysis, they are often constrained by shallow imaging depths owing to significant optical scattering in tissues. In contrast, PAI achieves signals through acoustic wave propagation, which has much less scattering, thus providing a much deeper imaging depth than pure optical imaging methods.
PAI can also obtain label-free images from endogenous chromophores by selecting the appropriate laser wavelengths. For example, oxyhemoglobin and deoxyhemoglobin serve as primary contrast agents in vascular imaging because of their strong absorption in the visible to near-infrared (NIR) range. Multi-wavelength analysis of these hemoglobins enables the assessment of oxygen saturation (sO2) levels in biological tissues, which is important for numerous applications [12,13,14,15]. Melanin, another intrinsic contrast agent, is commonly used to image melanomas because of its broad absorption spectrum, ranging from ultraviolet to NIR [16,17,18,19]. Lipids can also be used as endogenous markers because of their remarkable absorption capacity in the NIR region [20,21,22].
Despite the ability of PAI to perform label-free imaging, the use of exogenous contrast agents is widespread, primarily to enhance signal-to-noise ratios in biological tissues [23,24]. Contrast-enhanced PAI enables the visualization of biological structures with low optical absorption, such as lymphatic networks [25,26,27,28,29], the liver [30], and the bladder [31], which are difficult to image with label-free PAI. In addition, various contrast agents have been used for deep-tissue imaging, particularly for longer wavelengths in the NIR region [32,33,34].
Contrast-enhanced PAI is critical for the diagnosis and monitoring of diseases with targeted agents [35,36,37]. For this purpose, contrast agents activated under specific conditions have been developed to improve target detection efficiency [38,39]. For instance, Chen et al. demonstrated that heat-sensitive capsules released internal agents upon laser-induced heating, thereby generating PA signals [40]. Lin et al. synthesized a highly volatile agent that produced amplified PA signals when vaporized under laser irradiation [41].
In the context of tumor detection, contrast agents that selectively alter their optical absorption characteristics in response to the unique properties of the tumor microenvironment have attracted significant interest. The tumor microenvironment, which is characterized by increased cellular proliferation and metabolic activity, has a significant impact on tumor initiation and progression. This review focuses on pH levels within the tumor microenvironment, which are typically lower (pH 6.5–6.8) than those in normal tissues (approximately pH 7.4) [42,43]. By using this acidic tumor environment to induce changes in their absorption spectra, pH-sensitive contrast agents offer a non-invasive and highly selective approach to tumor detection without additional external stimulation.
Herein, we provide an overview of contrast agents designed to achieve high contrast in PAI, particularly for tumor identification. We focus on the nanoparticles that remain “inactivated” in normal tissue but become “activated” in the acidic environment by altering their optical absorption characteristics in response to pH variations. Mechanisms such as nanoparticle aggregation or morphological changes in acidic conditions are discussed, as well as the release of light-absorbing chromophores caused by the destruction of pH-sensitive capsules. This review highlights the potential of PAI for detecting tumor regions and monitoring treatment progress using pH-triggered contrast agents, thereby expanding its application in biomedical research.

2. Principles of Photoacoustic Imaging

PAI operates based on the fundamental principle of energy transduction from light to acoustic waves through the PA effect (Figure 1) [1]. When short pulses of light illuminate a target tissue, chromophores within it absorb energy. This absorption excites the electrons in the chromophores from their ground state; as they return to their original state, a portion of the absorbed energy is released as heat. This rapid heating induces thermoelastic expansion in the tissue, owing to the extremely short duration of the light pulses (typically less than 10 ns). After a brief period of illumination, the expanded tissue rapidly contracts back to its original volume, generating wideband acoustic waves that propagate through the tissue. The initial pressure ( P ) of the generated acoustic wave, known as the PA wave, is directly proportional to the following four parameters:
P Γ T × σ × μ a × F ,
where Γ   denotes the Grüneisen parameter that is related to the local temperature ( T ), σ denotes the thermal conversion efficiency, μ a denotes the optical absorption coefficient, and F denotes the fluence of light reaching the local region. The pH-sensitive agents discussed in this paper modify the thermal conversion efficiency or optical absorption in tumor areas, where the pH levels are lower than those in normal tissues. Because these parameters are directly proportional to the initial pressure of the PA waves, contrast-enhanced PA images can be obtained when these agents interact with the tumor microenvironment.
In addition, pH-sensitive agents alter their optical absorption peaks, and their distribution can be effectively detected using multi-wavelength PA responses. An efficient technique for this purpose is ratiometric PA analysis, which calculates the ratio of PA signals at different wavelengths [44]. This method provides a robust and calibration-free measurement, delivering quantitative information about the agents. Although ratiometric PA analysis does not quantify the molecular concentration of agents, as can be achieved through spectral unmixing techniques [45], it provides the straightforward and effective detection of target agents with minimal computational complexity.
For deep tissue imaging, PA agents are often designed to absorb light in the second NIR (NIR-II: 1000–1700 nm) region, where photon scattering is significantly reduced. In addition, the increased fluence of optical illumination, which can generate stronger PA signals, is available due to a higher maximum permissible exposure of light compared to the other wavelength regions [46]. Consequently, optical probes absorbing in the NIR-II region have been demonstrated to enhance imaging depth [47].
Figure 1. Schematic illustration for the principles of photoacoustic imaging. PA, photoacoustic; TR, ultrasound transducer; OR-PAM, optical resolution photoacoustic microscopy; AR-PAM, acoustic resolution photoacoustic microscopy; PACT, photoacoustic computed tomography. The images are reproduced with permission from [48,49,50].
Chemosensors 12 00257 g001
One unique characteristic of PAI compared with other biomedical imaging techniques is its ability to provide multiscale resolution and imaging depth. The generated PA waves have a wide frequency range of several to tens of MHz, allowing for an adjustable resolution and imaging depth based on the selected frequency range of the transducer [51]. In general, high-frequency transducers are used for high-resolution imaging, while low-frequency transducers are used for deeper imaging.
Beyond the transducer selection, the resolution of the PAI system can be further tuned through the configuration of the optical and acoustic foci. PAI systems are classified into three types: optical-resolution photoacoustic microscopy (OR-PAM), acoustic-resolution photoacoustic microscopy (AR-PAM), and photoacoustic computed tomography (PACT). OR-PAM achieves high resolution by focusing light on a spot smaller than the acoustic focus of the transducer [52]. This method enables a very high lateral resolution, particularly when using an objective lens with a large numerical aperture, although it is limited by a shallow imaging depth of approximately 1 mm from the surface. AR-PAM operates by illuminating a broad area with light and detecting PA signals within the focal zone of the transducer. Although AR-PAM offers a lower lateral resolution than OR-PAM, it allows greater imaging depth owing to its extended depth of focus. In contrast to AR-PAM and OR-PAM, PACT uses multi-element array transducers, enabling the acquisition of multiple data points using a single laser pulse [53]. Although this method requires complex mathematical calculations for image reconstruction, it provides a significantly greater imaging depth and can be performed in real time. These configurations of PAI systems have been used effectively in various biomedical applications to visualize pH-sensitive agents.

3. Mechanisms of pH-Sensitive Sensors for Photoacoustic Imaging

We categorized and summarized the pH-sensitive sensors based on their mechanisms and responsiveness to pH changes, particularly in mildly acidic tumor microenvironments (Figure 2). These sensors typically undergo dynamic protonation, which is driven by their chemical structures. Consequently, they may experience structural changes such as aggregation, hydrolysis, or the formation of zwitterionic surfaces [54,55]. These changes often cause shifts in the absorption spectrum or the release of active agents, altering the PA amplitude at specific excitation wavelengths. This enables selective imaging of tumors with enhanced contrast. This section focuses on the mechanisms that trigger PA signal generation in response to pH changes, which can be categorized into three phenomena: (1) aggregation driven by interparticle attraction, (2) separation involving the release of encapsulated agents, and (3) protonation-induced changes within the agents.
Aggregation occurs when attractive interparticle forces are activated, resulting in the formation of larger clusters [56]. Under acidic conditions, pH-sensitive sensors often exhibit either positive or negative surface charges owing to the hydrolysis of pH-sensitive side chains or interactions between mixed side chains. This creates an electrostatic attraction between oppositely charged sensors, causing them to aggregate and increase in size. Such aggregation shifts the absorption spectrum to longer wavelengths, thereby enhancing the PA signals at specific excitation wavelengths. Nanoparticle-based pH-sensitive sensors are particularly effective at accumulating in tumor tissues, facilitating both imaging and phototherapy [57].
The separation mechanism involves the release of substances that generate or enhance PA signals [58]. Under acidic conditions, structural changes in pH-sensitive materials result in the release of ions and molecules. These substances can trigger reactions such as gas formation that amplify the PA signal. In some cases, an altered pH environment lowers the stability or melting point of micelle-like structures, releasing encapsulated agents with strong optical absorption and further enhancing the PA signals. This release process can also be induced by external stimulation, enabling the controlled delivery of signal-enhancing compounds [59].
Protonation refers to the intrinsic changes in absorption that occur because of structural transformations [60]. In acidic environments, some pH-sensitive sensors undergo protonation and electron transfer within their heterocyclic structures, resulting in a spectral shift in the absorption peak. For example, in polymers with functional groups such as carboxyl and imine, protonation can convert the base form to the salt form [61]. This conversion contributes to a redshift in the absorption spectrum, further enhancing the PA response.

4. Contrast-Enhanced Photoacoustic Imaging of pH-Sensitive Sensors
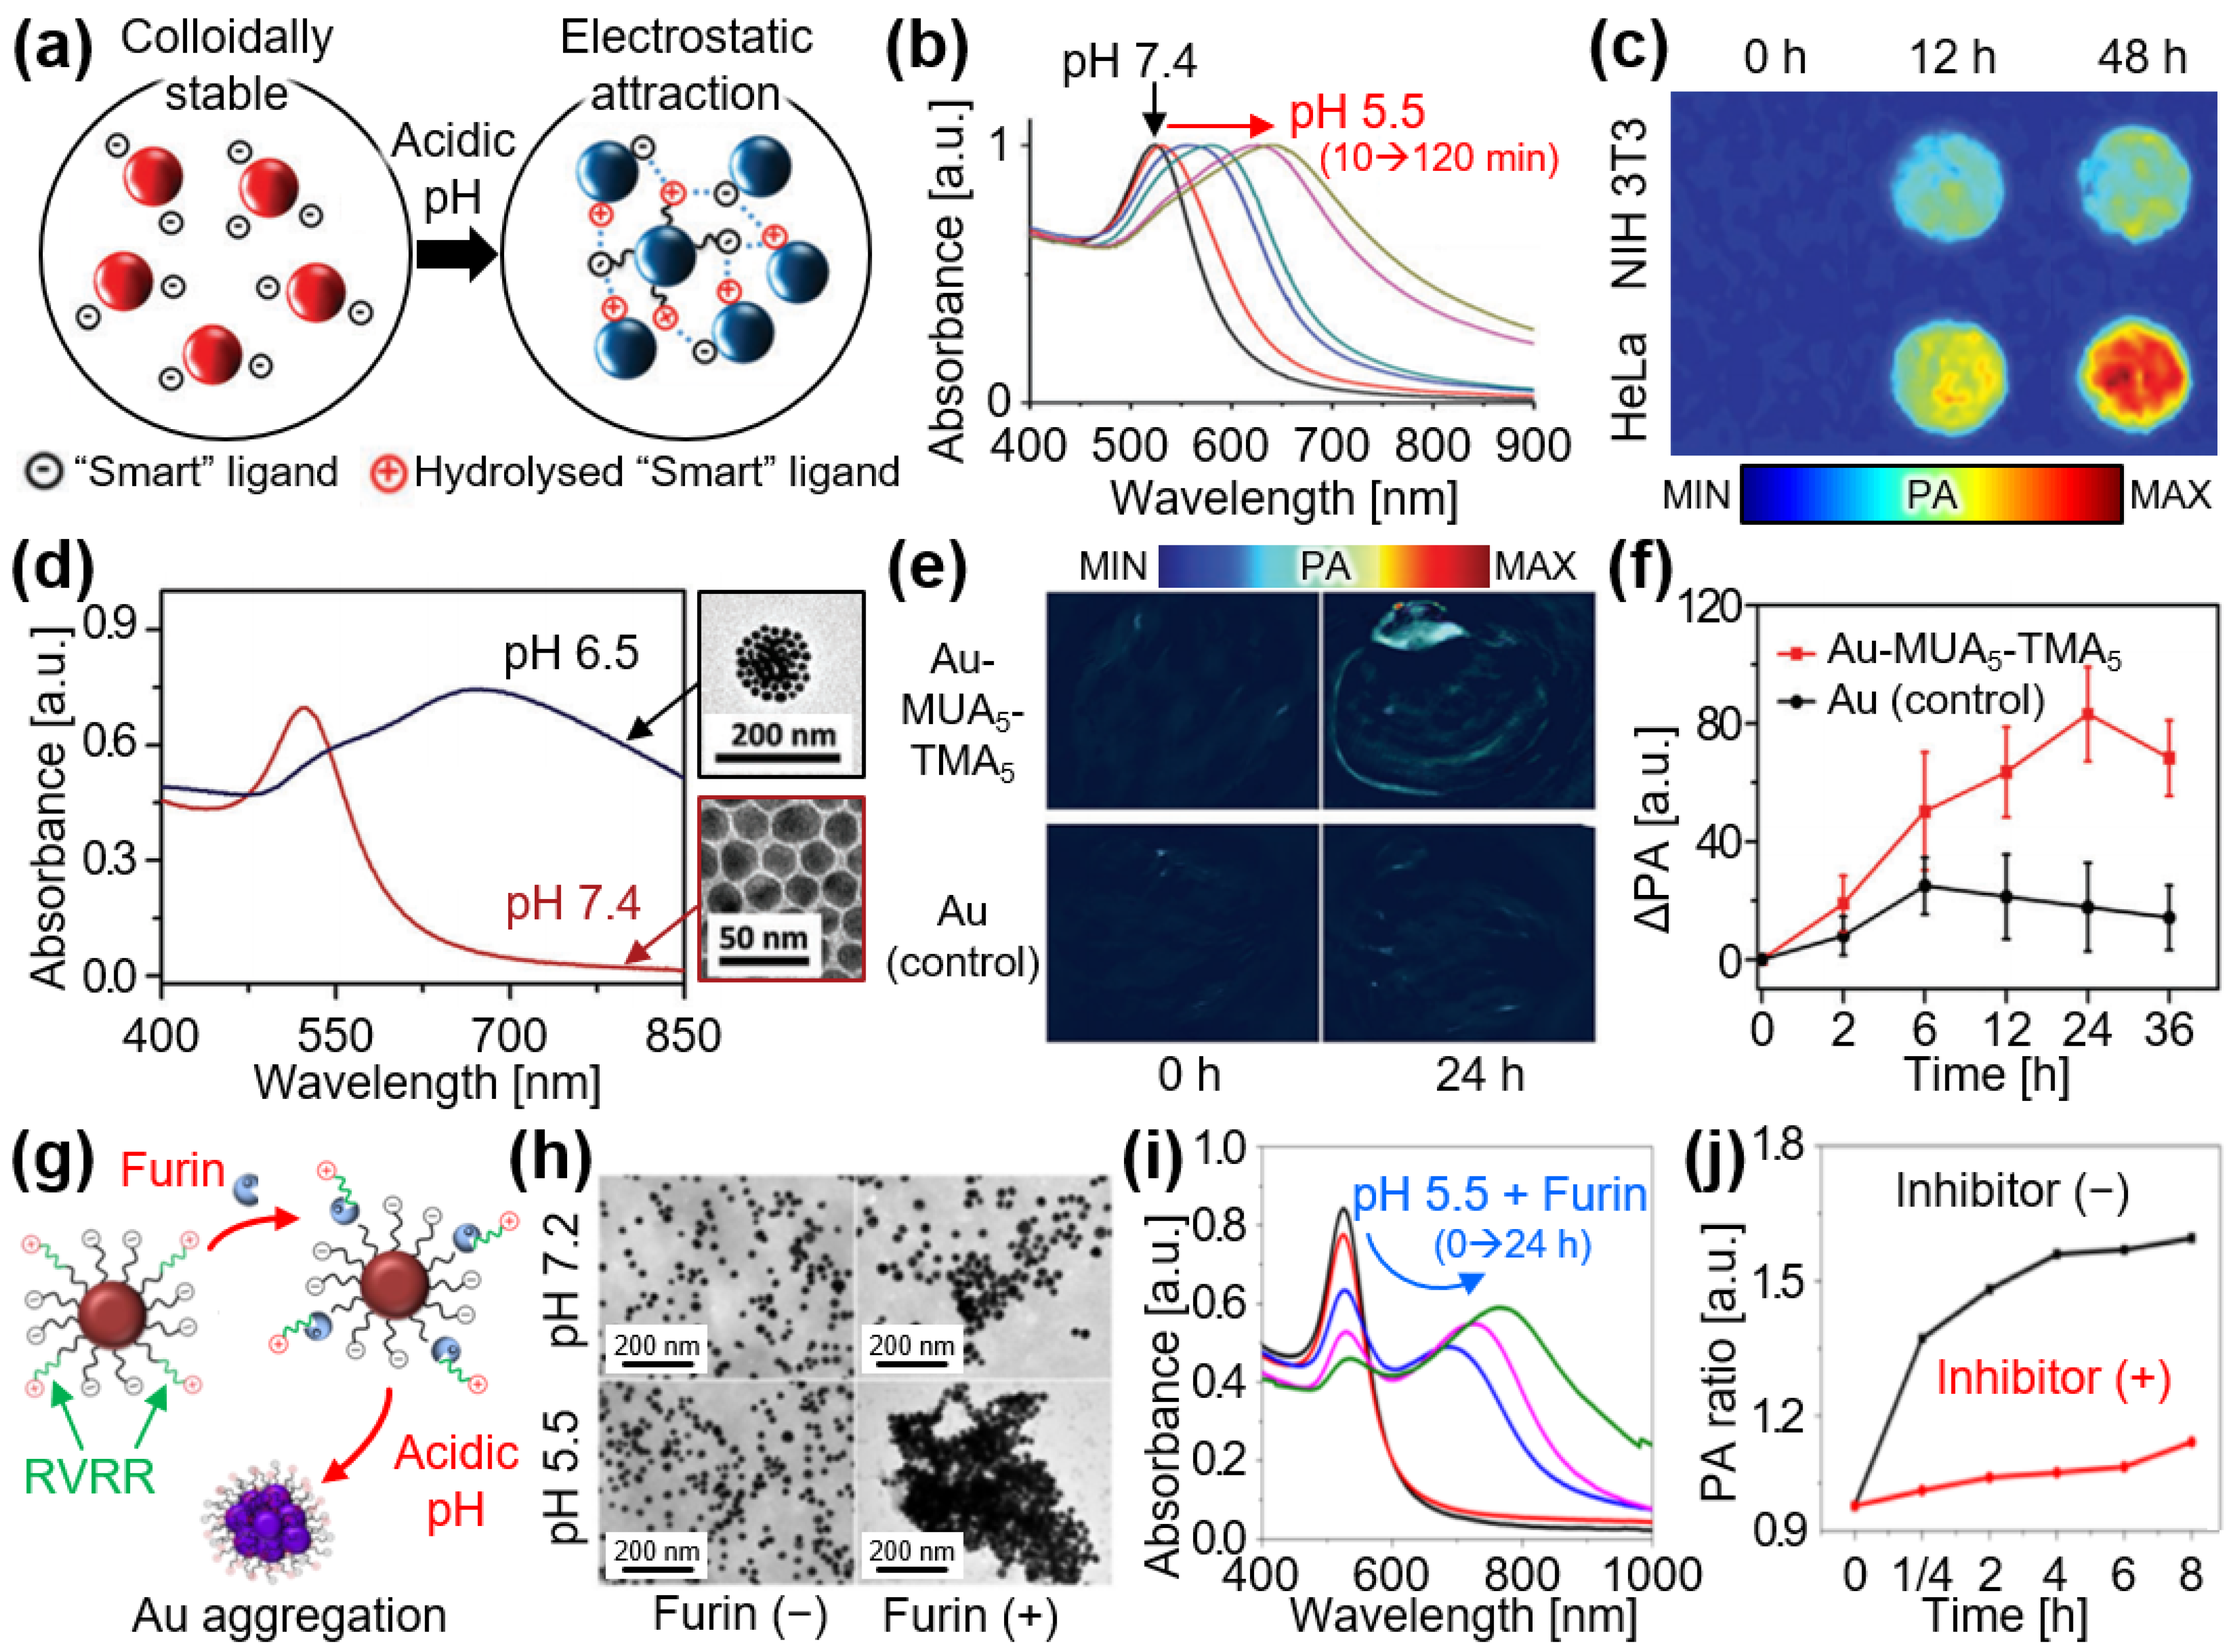
4.1. Aggregation

Gold nanoparticles (AuNPs) have been extensively studied for biological and medical applications because of their well-established synthesis protocols. The size- and shape-dependent optical properties of AuNPs allow for the alteration of PA signals upon aggregation. Song et al. synthesized pH-sensitive AuNPs by conjugating ligands composed of dithiol and citraconic amide [62]. In mildly acidic environments, citraconic amide is hydrolyzed, converting the carboxylic acid into a primary amine, which promotes AuNP aggregation owing to electrostatic attraction (Figure 3a). While the AuNPs exhibited an absorption peak at 520 nm at pH 7.4, a red-shifted optical absorption was observed at pH 5.5 (Figure 3b). The potential for tumor-specific detection using these conjugated AuNPs was validated using the PAI of the phantoms (Figure 3c). HeLa breast cancer cells and NIH 3T3 fibroblasts were co-incubated with AuNP conjugates and fixed in agar solutions for PAI. The results showed that the PA signal of cancerous HeLa cells was 1.7 times stronger than that of normal NIH 3T3 cells, indicating the aggregation of AuNPs in the acidic tumor microenvironment.
Zhang et al. [63] developed pH-sensitive agents by conjugating AuNPs with mercaptoundecanoic acid (MUA) and (10-mercaptodecyl)trimethylammonium bromide (TMA). The conjugates showed pH-dependent aggregation, with sensitivities varying based on the ratio of MUA to TMA. At a 5:5 ratio, sharp changes in the absorption spectrum were observed as the pH decreased from 6.7 to 5.0, with a noticeable shift in the absorption peak from 524 nm to the NIR region (approximately 650 to 700 nm) (Figure 3d). At pH 7.4, the conjugates remained approximately 15 nm in size but aggregated to approximately 180 nm at pH 6.5. At an excitation wavelength of 808 nm, contrast-enhanced PA images were obtained from subcutaneously transplanted U87MG glioblastoma tumors in mice following tail vein injection of conjugates (Figure 3e). The results showed an approximately 4-fold greater signal enhancement in tumors treated with the conjugates than in the control group (Figure 3f). In addition, after 10 min of 808 nm laser illumination at a fluence of 1.0 W/cm2, the tumor was successfully ablated, demonstrating the potential of the developed conjugates for potential photothermal therapy (PTT).
Cheng et al. developed Arg-Val-Arg-Arg (RVRR) peptide-conjugated AuNPs that are selectively aggregated under the synergistic influence of the furin enzyme and acidic conditions of the tumor microenvironment [64]. The furin enzyme efficiently cleaved the RVRR peptides from the conjugates, promoting AuNP aggregation in the mildly acidic tumor environment (Figure 3g). In the presence of furin, the conjugates maintained their original size of approximately 63 nm at pH 7.2; however, they aggregated to approximately 327 nm after 24 h at pH 5.5 (Figure 3h). This aggregation caused a shift in the absorption peak from 520 nm to approximately 800 nm, enabling detection by multispectral PAI (Figure 3i). The potential of these conjugates was further validated by measuring the temperature increase in HCT-116 colon tumor-bearing mice in vivo. HCT-116 tumors were subcutaneously xenografted onto the dorsal region of mice, and pH-sensitive conjugates were administered via tail vein injection. After 8 h, the PA signal showed a 1.6-fold increase compared to that of the control group (Figure 3j), demonstrating the signal-switching ability of the conjugates through aggregation triggered by the combined effects of the furin enzyme and the acidic tumor microenvironment. In addition, the local tumor temperature increased by approximately 26.9 °C after 6 min of 808 nm laser illumination with a fluence of 0.75 W/cm2, confirming the potential for PTT.
Li et al. designed surface-modified AuNPs to improve tumor detection accuracy [65]. In the tumor microenvironment, the carboxylate anions of the AuNPs are protonated into amines and subsequently hydrolyzed, leading to nanoparticle aggregation (Figure 4a). This aggregation intensified at lower pH levels, resulting in a redshift in the absorption wavelengths (Figure 4b). At pH 7.4, the AuNPs maintained a size of approximately 16 nm with an absorption peak between 550 and 600 nm. However, at pH 5.8, the particle size increased to over 500 nm, and the absorption shifted above 600 nm, resulting in a 3.6-fold increase in PA amplitude at a wavelength of 680 nm (Figure 4c). In a subsequent study, they demonstrated a pH-sensitive nanoparticle that showed a clear absorption shift in a mildly acidic tumor microenvironment [66]. They synthesized poly(ethylene glycol)-poly(lactic acid/glycolic acid) copolymeric nanoparticles encapsulating croconazole dyes. As the pH decreased, the absorption of nanoparticles at 815 nm increased. The PA signals also increased, showing a 4-fold increase in the signal at pH 5.8 compared to that at pH 7.4. After tail vein injection of the nanoparticles into MDA-MB-231 breast cancer xenografted mice, in vivo PA images showed a 2.8-fold signal increase compared with the control group. Moreover, when the accumulated nanoparticles in the tumor were irradiated with an 808 nm laser at a fluence of 1.5 W/cm2, the local tumor temperature rose to approximately 49 °C, leading to significant tumor volume reduction, indicating the potential of this nanoparticle for PTT.
Wu et al. demonstrated another copolymer nanoparticle that absorbs light in the second NIR (NIR-II: 1000–1700 nm) region, which is particularly promising for deep-tissue PAI owing to reduced photon scattering in this range [67]. The nanoparticles aggregated upon oxygen doping, causing a redshift in the absorption peak from the visible (~600 nm) to the NIR-II (~1000 nm) region (Figure 4d). At an excitation wavelength of 1064 nm, PA signals were significantly enhanced, showing 3.1-fold and 5.0-fold increases at pH 6.5 and 5.5, respectively, compared to pH 7.4 (Figure 4e). To confirm nanoparticle aggregation in the tumor microenvironment in vivo, the nanoparticles were intratumorally injected into subcutaneously implanted PC-3 prostate tumors in mice. The PA signals from the tumor were compared with those from muscles in which the nanoparticles were intramuscularly injected (Figure 4f). The results showed a 3.4-fold higher PA signal in the tumor, indicating successful nanoparticle aggregation in an acidic tumor environment.
In this section, the aggregation mechanism of the pH-sensitive nanoparticles is explored (Table 1). These nanoparticles exhibited red shifts in their absorption spectra when aggregated in mildly acidic tumor microenvironments, resulting in enhanced PA signals in the NIR region. Various strategies, such as ligand conjugation, surface modification, and copolymer encapsulation, have been employed to design nanoparticles that aggregate under acidic conditions, leading to improved tumor detection and potential for PTT. Further advancements in nanoparticle design could focus on enhancing both the sensitivity and specificity of aggregation mechanisms, enabling more precise and effective tumor imaging and therapy while ensuring biocompatibility and minimizing off-target effects in clinical applications.

4.2. Separation

In acidic tumor environments, the protonation of pH-sensitive sensors causes the disassembly of micelle structures or surface-bound functional groups, resulting in the release of encapsulated agents. This process induces or enhances PA signaling in the tumor region. In addition, this mechanism facilitates drug delivery to the tumor site. Zhong et al. demonstrated pH-responsive nanoparticles designed to release encapsulated inhibitors of heat shock proteins at acidic pH levels, thereby reducing tumor thermoresistance and enhancing PTT efficiency [68]. They synthesized self-assembled silver sulfide (Ag2S) nanoparticles loaded with the inhibitor quercetin (QE) and a pH-responsive polymer (Poly(ethylene glycol)5k-poly(β-aminoesters)10k), denoted as QE-PEG-Ag2S (Figure 5a). The release of QE exhibited significantly higher efficiency at lower pH levels, with release rates of 50% and 72% at pH 6.5 and 5.5, respectively (Figure 5b). To validate the PA signal enhancement in tumors, QE-PEG-Ag2S nanoparticles were intravenously injected into HepG2 liver tumor-bearing mice through the tail vein. The tumor accumulation of nanoparticles was monitored by acquiring cross-sectional PA and US images at various time points after injection (Figure 5c). The PA amplitude in the tumor region reached a maximum value 24 h after injection, showing a 3.8-fold increase compared to the pre-injection values. Furthermore, the enhanced PTT efficiency was evaluated by monitoring the tumor size after the injection of different nanoparticles. These results confirm that the inhibitor-loaded nanoparticles efficiently ablated tumors without recurrence, demonstrating their potential for cancer treatment (Figure 5d).
To improve the controllability of drug release, researchers have explored nanoparticles that can be activated by both external triggers and the internal pH environment. Yang et al. reported a micellar system that responded to both pH levels and external heat generated by NIR laser irradiation [69]. They synthesized an amphiphilic poly(ethylene glycol)-b-poly(acrylamide-co-acrylonitrile-co-vinylimidazole) copolymer (mPEG-PAAV) with an upper critical solution temperature (UCST) that decreased under acidic conditions. The mPEG-PAAV copolymer was used to form a micellar system, encapsulating both doxorubicin (DOX) and IR780 dye (Figure 5e). Upon tail vein injection into mice bearing 4T1 breast tumors, the micellar system demonstrated a 1.5-fold enhancement in the PA signal compared to free IR780 dye, indicating efficient accumulation at the tumor site (Figure 5f). In addition to enhancing the PA contrast, the IR780 dye converts the absorbed light energy into heat. Once the temperature exceeds the UCST, the micelles disassemble, resulting in the rapid release of DOX. After 5 min illumination of an 808 nm laser at 1.0 W/cm2, the tumors were successfully eradicated within 9 days (Figure 5g). The results presented an effective combined treatment for tumors.
Recently, Xu et al. demonstrated an innovative tumor treatment strategy that combined synergistic PTT and US therapy [70]. They synthesized two types of nanoparticles (Figure 6a): gold nanorods modified with polyethylene glycol (PEG) and polyethyleneimine (PEI), denoted as mPEG-PEI-AuNRs, and carbonate nanoparticles conjugated with PEG and PEI via electrostatic interactions (mPEG-PEI/CaNPs). The latter released carbon dioxide (CO2) bubbles in acidic environments. The phantom experiment showed that CO2 bubbles significantly enhanced the PA signal of the mPEG-PEI-AuNRs (Figure 6b). For in vivo validation, both types of nanoparticles were intravenously injected into MCF-7 breast tumor-xenografted mice, and cross-sectional PA images were acquired at various time intervals (Figure 6c). The results showed 3-fold enhanced PA signals in the tumor 24 h after injection. Under the irradiation of an 808 nm laser with a fluence of 1.0 W/cm2, the local temperature of the tumor rapidly increased to 51 °C within 2 min, confirming the potential of the nanoparticles for effective PTT. Moreover, the CO2 bubbles released from mPEF-PEI/CaNPs were used for US therapy, causing tumor cell necrosis through a bubble explosion triggered by US irradiation. When therapeutic US waves with a frequency of 1 Hz and fluence of 1.5 W/cm2 were applied to the PTT-treated tumor, the combined approach achieved successful tumor eradication, highlighting the potential for synergistic PTT and US treatment strategies.
In addition, to enhance therapeutic efficacy, efforts have been directed toward achieving deeper drug penetration through extracellular release mechanisms. Lee et al. synthesized a charge-convertible nanomedicine for penetrating solid tumors through transcytosis [71]. This albumin-based calcium phosphate nanomedicine, denoted as mAlb-820@CaP, was loaded with IR820 dye and used as both a contrast agent for PAI and an optical absorber for PTT (Figure 6d). Following extravasation through the enhanced permeability and retention effect of the tumor vasculature, the nanoparticles decomposed into cationic albumins and released calcium ions (Ca2+). This decomposition was triggered by low pH levels that transformed the modified albumins into cationic albumins. The released Ca2+ ions in the lysosomes induced lysosomal exocytosis, further enabling the delivery of cationic albumins to the surrounding cells. To verify the deep penetration of the nanoparticles, PA images of 4T1 breast tumor-xenografted mice were acquired after tail vein injection of the nanoparticles (Figure 6e). The PA signal in the tumor region gradually increased, reaching a 2.3-fold enhancement 24 h after the mAlb-820@CaP nanoparticle injection (Figure 6f). In contrast, the PA signals from the free IR820 dye increased 1.6-fold at 4 h post-injection; however, they declined after 24 h, indicating less efficient accumulation. These results confirmed the enhanced accumulation of nanoparticles in the tumor tissue. Subsequent PTT with 5 min of 808 nm laser illumination at 1.0 W/cm2 demonstrated tumor regression, highlighting the potential of mAlb-820@CaP nanoparticles for PA imaging-guided tumor therapy.
This section explores pH-sensitive nanoparticles that release drugs and PA contrast agents through separation mechanisms, particularly in acidic tumor environments (Table 2). These nanoparticles disassemble their micelle structures or surface-bound functional groups, releasing encapsulated agents and enhancing PA signals in the tumor region. The strategies described in this section collectively highlight the potential of pH-sensitive nanoparticles for tumor-specific drug release, contrast-enhanced PAI, and effective PTT. Optimizing the balance among nanoparticle stability, drug release control, and therapeutic efficiency is crucial for advancing the application of these systems for precise cancer treatment.

4.3. Protonation

Protonation and deprotonation are chemical reactions in which hydrogen ions are exchanged in response to changes in pH. In the previous sections, the aggregation and separation mechanisms involved protonation and deprotonation. The previous sections focused on how these processes lead to the generation of PA signals. In this section, we discuss the protonation mechanisms that change the energy absorption spectrum by altering the electron density within a molecule.
Tian et al. demonstrated pH-responsive polyaniline assemblies for efficient PTT and tumor accumulation monitoring using contrast-enhanced PAI (Figure 7a) [72]. They conjugated bovine serum albumin with polyaniline (BSA-PANI), which exhibited a shift in absorption spectrum over a range of pH 3.0–8.0. Under acidic conditions, the emeraldine base in polyaniline was converted to an emeraldine salt state. Although this conversion typically occurred under strongly acidic conditions (i.e., pH < 4.0), the developed BSA-PANI assemblies achieved this transformation at pH < 7.0, which represents a mildly acidic tumor microenvironment. This conversion resulted in a red shift in the absorption and an enhanced PA signal in the NIR region (Figure 7b). To evaluate contrast enhancement, PA images of xenografted 4T1 breast tumors in mice were acquired after intravenous injection of BSA-PANI nanoparticles (Figure 7c). The PA amplitude reached a maximum of 12 h after injection, with approximately a 3.6-fold increase compared to the pre-injection level. In subsequent PTT experiments, the local temperature of the tumor increased to approximately 56 °C under a 5 min irradiation of an 808 nm laser at 1.0 W/cm2. The treatment resulted in complete tumor eradication within 16 days (Figure 7d), demonstrating the promising potential of BSA-PANI assemblies for PA-guided PTT.
To enhance the imaging depth, ongoing studies have focused on developing PA agents that absorb light in the NIR-II region, which is advantageous for deep tissue imaging because of its reduced optical scattering compared to the visible or NIR-I regions. Chen et al. developed NIR-II-absorbing nanoparticles that exhibited enhanced PA signals under acidic conditions (Figure 7e) [73]. They synthesized nanoparticles, denoted as OctaNPs, that encapsulated octaphyrin (4) within 1,2-distearoyl-sn-glycero-3-phosphoethanolamine-poly(ethylene glycol) (DSPE-PEG). DSPE-PEG exhibits pH-responsive properties with proton-coupled electron transfer, converting octaphyrin (4) into its form (6) in acidic environments, thereby generating strong PA signals at an excitation wavelength of 1200 nm (Figure 7f). PA images acquired after the intragastric injection of OctaNPs confirmed enhanced contrast in the low-pH environment of the stomach (Figure 7g). To target the mildly acidic tumor microenvironment, OctaNPs were modified with high concentrations of glutathione to enhance optical absorption and then delivered to subcutaneously implanted HepG2 liver tumors. The resulting PA images demonstrated contrast enhancement in the tumor region, indicating the potential of OctaNPs for tumor imaging in vivo.
While single-wavelength PAI has shown promising feasibility for monitoring drug delivery in tumors, ratiometric PA analysis using multi-wavelength PA responses can more efficiently delineate drug distribution. When the absorption peak of nanoparticles shifts under the acidic conditions of the tumor, the ratio of PA signals varies significantly compared to that in normal tissue. Chen et al. demonstrated this approach by synthesizing self-assembled albumin-based nanoparticles that responded to two wavelengths of light [74]. They conjugated human serum albumin (HSA) with two NIR-absorbing dyes: pH-active benzo[a]phenoxazine (BPOx), which exhibits a red shift in its absorption spectrum owing to protonation under acidic conditions, and pH-inert IR825, which absorbs 825 nm light and remains unaffected by pH changes (Figure 8a). Glutaraldehyde was used to induce covalent cross-linking of HSA, thereby enhancing the stability of the nanoparticles. In acidic environments, the self-assembled C-HSA-BPOx-IR825 nanoparticles showed increased absorption in the 600–700 nm range, whereas no significant change was observed at 825 nm (Figure 8b). For ratiometric PA analysis, PA signals were measured from subcutaneously implanted 4T1 breast tumors in mice after the intravenous injection of C-HSA-BPOx-IR825 nanoparticles (Figure 8c). The PA signal at 680 nm increased significantly, whereas only marginal changes were observed at 825 nm (Figure 8d), resulting in a significant increase in the PA ratio (Figure 8e). These results highlight the potential of ratiometric PA analysis for high-sensitivity tumor detection in vivo.
Yang et al. also performed ratiometric PA analysis using a perylene diimide (PDI)-based theranostic platform (Figure 8f) [75]. They synthesized THPDINs by encapsulating IR825 dye and doxorubicin (DOX) using pH-sensitive PDIs. In this system, the pH-inert IR825 served as a reference, producing stable PA amplitudes in the NIR region regardless of pH changes, whereas the pH-sensitive PDI exhibited a blue shift to below 600 nm. Consequently, the absorption of the THPDIN nanoparticles decreased significantly at 680 nm while showing minimal changes at 825 nm (Figure 8g). After the intravenous injection of THPDINs into U87MG glioblastoma tumor-bearing mice, PA images were acquired at wavelengths of 680 and 825 nm (Figure 8h). The PA amplitudes in the tumor region confirmed the pH-responsive characteristics of the THPDINs, with the PA signal ratio peaking at 24 h post-injection and reaching approximately 1.74-fold higher than that of the control group (Figure 8i). At 24 h post-injection, the ratio of PA signals reached a maximum, which was approximately 1.74-fold higher than that in the control group (Figure 8j). In addition, THPDINs suppressed tumor growth, with 100% survival observed 45 days after treatment, highlighting the therapeutic potential of this platform.
Recently, Liu et al. synthesized nanoparticles based on a heptamethine cyanine dye and indoline for ratiometric PA analysis [76]. Nanoparticles use the pH sensitivity of nitrogen atoms within the dye, which undergo protonation and deprotonation. These nanoparticles displayed stable PA signals at 680 nm across varying pH levels, but a notable increase was observed in the PA signal at 760 nm as the pH decreased, enabling ratiometric PA analysis. Following intravenous injection, the PA signals of the nanoparticles were monitored in xenografted MCF-7 breast tumors in mice. The highest PA signal at 760 nm was observed at 18 h post-injection, demonstrating a clear distinction from the control group. In addition to PA imaging, the fluorescence signals of nanoparticles exhibited similar trends, confirming the feasibility of multimodal imaging. Furthermore, 10 min of 808 nm laser illumination at a fluence of 0.8 W/cm2 elevated the local temperature to 62 °C, effectively eradicating the tumor. These results highlight the potential of the nanoparticles for image-guided PTT.
This section explores pH-sensitive agents that use protonation mechanisms to alter their energy absorption spectra, enhancing both PA contrast and therapeutic efficacy (Table 3). This section also highlights ratiometric PAI, in which multi-wavelength responses in acidic conditions enable precise tumor detection by analyzing PA signal ratios. These approaches show great potential for improving tumor imaging and treatment. Future efforts should focus on optimizing the biocompatibility and stability of these agents and refining ratiometric PAI for highly sensitive diagnostics and effective cancer therapies.

5. Conclusions

This review explores the recent advancements in the design and application of pH-sensitive PA sensors, highlighting their potential to improve the sensitivity, specificity, and depth of tumor imaging and therapy. Various pH-responsive agents have been synthesized to enhance the precision of PAI-guided diagnoses and therapies. Using protonation and deprotonation mechanisms, these agents provide measurable changes in optical absorption and, consequently, stronger PA signals. This enables targeted imaging, particularly in acidic tumor microenvironments. The integration of multi-wavelength lasers further enhances their versatility, allowing for more precise ratiometric analyses and multimodal detection.
Several key strategies for designing pH-sensitive agents have emerged and are highlighted in this review. For instance, polyaniline-based assemblies and BSA-conjugated nanoparticles efficiently shift absorption spectra in response to the pH levels of the tumor microenvironment, enhancing PA signals in the NIR region for deeper imaging. Similarly, the use of NIR-II-absorbing agents such as OctaNPs demonstrated the potential for deeper tissue penetration and improved imaging contrast. Notably, ratiometric PAI analysis using multi-wavelength responses offered a more straightforward understanding of drug distribution and tumor targeting. These multi-wavelength approaches, particularly in the NIR region, provided a more accurate delineation of tumor boundaries, allowing for enhanced specificity in both diagnosis and therapy monitoring.
Compared to other activation methods, pH-triggering offers exceptional selectivity for tumor detection. While lasers can precisely activate agents at specific locations and time points, their effectiveness is limited by penetration depth, restricting their applicability for deeply posed tumors. Similarly, enzyme-triggered agents respond to specific enzymes present in tumors, but their contrast enhancement may be limited in tumors with low expression levels of these enzymes, reducing their diagnostic efficacy.
Despite the promising results obtained with pH-sensitive agents, several challenges remain to be addressed for their successful translation from preclinical models to clinical practice. Key concerns include ensuring biocompatibility, minimizing toxicity, and achieving reproducibility in nanoparticle synthesis. In addition, the optimization of the excitation wavelengths to maximize both the imaging depth and signal-to-noise ratio should be further refined for clinical applications.
Currently, the clinical trials of PAI are mainly based on label-free approaches, such as sO2 level analysis in cancerous regions [77,78,79]. While these studies have shown potential for enhancing diagnostic accuracy, the use of tumor-responsive contrast agents could significantly improve the specificity and sensitivity in identifying cancerous tissues, once approved for human use. Therefore, with continued research on nanoparticle engineering, pH-sensitive photoacoustic agents can be used in cancer diagnostics and image-guided therapies in clinical applications.
From a systems perspective, although multi-element array transducers in PAI have enabled the capture of depth images in real-time, 3D volumetric imaging still relies heavily on mechanical scanning operations, which presents challenges for clinical applications. Human trials, in particular, face limitations owing to the high costs and operational complexity associated with mechanical scanning. Recent efforts have been aimed at overcoming these obstacles through the development of more efficient and portable handheld PAI systems, which could significantly enhance accessibility and reduce scanning time [80,81]. The use of volumetric array transducers also enables real-time, high-quality PAI to monitor the distribution of agents in vivo [82].
To generate strong PA signals capable of achieving deep imaging depth, delivering maximum laser power is crucial. However, the laser power must remain within the maximum permissible exposure limits guided by the safety standard [46] to prevent tissue damage. Notably, the current laser power used in most systems is much below the safety thresholds, indicating a margin for potential optimization to enhance imaging performance while ensuring safety.
From the perspective of image generation, tissue motion during acquisition can degrade PA image quality. This challenge can be addressed by incorporating US imaging. Structural information from US images can be used to correct motion-induced distortions in corresponding PA images [49]. Additionally, US images can be also used for laser power compensation, enabling more accurate spectral analysis and enhancing the reliability of quantitative imaging [83].
The accuracy of PAI reconstruction is based on the speed of sound across different biological tissues, and current systems often use predefined constants. However, this can result in image distortion, particularly in heterogeneous soft tissues. To address this issue, advanced computational techniques, such as GPU-accelerated processing and artificial intelligence-driven algorithms, are being explored to correct these distortions [84]. These innovations have the potential to enhance image accuracy and reliability, thereby enabling more precise diagnostic capabilities for PAI.

Author Contributions

Conceptualization, J.K., C.K. and S.J.; investigation, H.K. and D.J.; resources, H.K., D.J. and S.J.; writing—original draft preparation, H.K. and D.J.; writing—review and editing, J.K., C.K. and S.J. All authors have read and agreed to the published version of the manuscript.

Funding

This work was supported by the National Research Foundation (NRF) grants (2021R1A5A1032937; 2023R1A2C3004880; 2021M3C1C3097624; 2020R1A6A1A03047902) and the Korea Health Technology R&D Project (HR20C0026) funded by the Korean government (Ministry of Science and ICT; Ministry of Education; Ministry of Health & Welfare). This work was also supported by BK21 FOUR program and Glocal 30 University Projects (Pohang University of Science and Technology).

Institutional Review Board Statement

Not applicable.

Informed Consent Statement

Not applicable.

Data Availability Statement

Not applicable.

Conflicts of Interest

C.K. has financial interests in OPTICHO, which did not support this work.

References

  1. Bell, A.G. The Photophone. Science 1880, 1, 130–134. [Google Scholar] [CrossRef] [PubMed]
  2. Liu, C.; Wang, L. Functional Photoacoustic Microscopy of Hemodynamics: A Review. Biomed. Eng. Lett. 2022, 12, 97–124. [Google Scholar] [CrossRef] [PubMed]
  3. Mallidi, S.; Luke, G.P.; Emelianov, S. Photoacoustic Imaging in Cancer Detection, Diagnosis, and Treatment Guidance. Trends Biotechnol. 2011, 29, 213–221. [Google Scholar] [CrossRef]
  4. Zhao, Z.; Swartchick, C.B.; Chan, J. Targeted Contrast Agents and Activatable Probes for Photoacoustic Imaging of Cancer. Chem. Soc. Rev. 2022, 51, 829–868. [Google Scholar] [CrossRef]
  5. Jokerst, J.V.; Cole, A.J.; Van de Sompel, D.; Gambhir, S.S. Gold Nanorods for Ovarian Cancer Detection with Photoacoustic Imaging and Resection Guidance via Raman Imaging in Living Mice. ACS Nano 2012, 6, 10366–10377. [Google Scholar] [CrossRef]
  6. Agarwal, A.; Huang, S.; O’Donnell, M.; Day, K.; Day, M.; Kotov, N.; Ashkenazi, S. Targeted gold nanorod contrast agent for prostate cancer detection by photoacoustic imaging. J. Appl. Phys. 2007, 102, 064701. [Google Scholar] [CrossRef]
  7. Liu, S.; Pan, X.; Liu, H. Two-Dimensional Nanomaterials for Photothermal Therapy. Angew. Chem. 2020, 132, 5943–5953. [Google Scholar] [CrossRef]
  8. Guo, T.; Tang, Q.; Guo, Y.; Qiu, H.; Dai, J.; Xing, C.; Zhuang, S.; Huang, G. Boron Quantum Dots for Photoacoustic Imaging-Guided Photothermal Therapy. ACS Appl. Mater. Interfaces 2020, 13, 306–311. [Google Scholar] [CrossRef]
  9. Xu, M.; Wang, L.V. Photoacoustic Imaging in Biomedicine. Rev. Sci. Instrum. 2006, 77, 041101. [Google Scholar] [CrossRef]
  10. Apriyanto, D.K.; Setiawan, A.; Widyaningrum, R. Therapeutic and Contrast Agents for Photoacoustic Imaging-Guided Photothermal Therapy: A Narrative Review. Nanotheranostics 2024, 8, 506. [Google Scholar] [CrossRef]
  11. Das, S.S.; Bharadwaj, P.; Bilal, M.; Barani, M.; Rahdar, A.; Taboada, P.; Bungau, S.; Kyzas, G.Z. Stimuli-Responsive Polymeric Nanocarriers for Drug Delivery, Imaging, and Theragnosis. Polymers 2020, 12, 1397. [Google Scholar] [CrossRef] [PubMed]
  12. Xavierselvan, M.; Cook, J.; Duong, J.; Diaz, N.; Homan, K.; Mallidi, S. Photoacoustic Nanodroplets for Oxygen Enhanced Photodynamic Therapy of Cancer. Photoacoustics 2022, 25, 100306. [Google Scholar] [CrossRef] [PubMed]
  13. Li, M.; Tang, Y.; Yao, J. Photoacoustic Tomography of Blood Oxygenation: A Mini Review. Photoacoustics 2018, 10, 65–73. [Google Scholar] [CrossRef] [PubMed]
  14. Ning, B.; Kennedy, M.J.; Dixon, A.J.; Sun, N.; Cao, R.; Soetikno, B.T.; Chen, R.; Zhou, Q.; Shung, K.K.; Hossack, J.A. Simultaneous Photoacoustic Microscopy of Microvascular Anatomy, Oxygen Saturation, and Blood Flow. Opt. Lett. 2015, 40, 910–913. [Google Scholar] [CrossRef] [PubMed]
  15. Zhang, H.F.; Maslov, K.; Sivaramakrishnan, M.; Stoica, G.; Wang, L.V. Imaging of Hemoglobin Oxygen Saturation Variations in Single Vessels In Vivo using Photoacoustic Microscopy. Appl. Phys. Lett. 2007, 90, 053901. [Google Scholar] [CrossRef]
  16. Kim, J.; Kim, Y.H.; Park, B.; Seo, H.M.; Bang, C.H.; Park, G.S.; Park, Y.M.; Rhie, J.W.; Lee, J.H.; Kim, C. Multispectral Ex Vivo Photoacoustic Imaging of Cutaneous Melanoma for Better Selection of the Excision Margin. Br. J. Dermatol. 2018, 179, 780–782. [Google Scholar] [CrossRef]
  17. Attia, A.B.E.; Chuah, S.Y.; Razansky, D.; Ho, C.J.H.; Malempati, P.; Dinish, U.; Bi, R.; Fu, C.Y.; Ford, S.J.; Lee, J.S.-S. Noninvasive Real-Time Characterization of Non-Melanoma Skin Cancers with Handheld Optoacoustic Probes. Photoacoustics 2017, 7, 20–26. [Google Scholar] [CrossRef]
  18. Wang, Y.; Xu, D.; Yang, S.; Xing, D. Toward In Vivo Biopsy of Melanoma Based on Photoacoustic and Ultrasound Dual Imaging with an Integrated Detector. Biomed. Opt. Express 2016, 7, 279–286. [Google Scholar] [CrossRef]
  19. Langhout, G.C.; Grootendorst, D.J.; Nieweg, O.E.; Wouters, M.W.J.M.; van der Hage, J.A.; Jose, J.; van Boven, H.; Steenbergen, W.; Manohar, S.; Ruers, T.J.M. Detection of Melanoma Metastases in Resected Human Lymph Nodes by Noninvasive Multispectral Photoacoustic Imaging. Int. J. Biomed. Imaging 2014, 2014, 163652. [Google Scholar] [CrossRef]
  20. Karlas, A.; Kallmayer, M.; Bariotakis, M.; Fasoula, N.-A.; Liapis, E.; Hyafil, F.; Pelisek, J.; Wildgruber, M.; Eckstein, H.-H.; Ntziachristos, V. Multispectral Optoacoustic Tomography of Lipid and Hemoglobin Contrast in Human Carotid Atherosclerosis. Photoacoustics 2021, 23, 100283. [Google Scholar] [CrossRef]
  21. Cao, Y.; Kole, A.; Hui, J.; Zhang, Y.; Mai, J.; Alloosh, M.; Sturek, M.; Cheng, J.-X. Fast Assessment of Lipid Content in Arteries In Vivo by Intravascular Photoacoustic Tomography. Sci. Rep. 2018, 8, 2400. [Google Scholar] [CrossRef] [PubMed]
  22. Buma, T.; Conley, N.C.; Choi, S.W. Multispectral Photoacoustic Microscopy of Lipids using a Pulsed Supercontinuum Laser. Biomed. Opt. Express 2018, 9, 276–288. [Google Scholar] [CrossRef]
  23. Weber, J.; Beard, P.C.; Bohndiek, S.E. Contrast Agents for Molecular Photoacoustic Imaging. Nat. Methods 2016, 13, 639–650. [Google Scholar] [CrossRef]
  24. Kilian, H.I.; Ma, C.; Zhang, H.; Chen, M.; Nilam, A.; Quinn, B.; Tang, Y.; Xia, J.; Yao, J.; Lovell, J.F. Intraperitoneal Administration for Sustained Photoacoustic Contrast Agent Imaging. Photoacoustics 2022, 28, 100406. [Google Scholar] [CrossRef] [PubMed]
  25. Lee, C.; Kim, J.; Zhang, Y.; Jeon, M.; Liu, C.; Song, L.; Lovell, J.F.; Kim, C. Dual-Color Photoacoustic Lymph Node Imaging using Nanoformulated Naphthalocyanines. Biomaterials 2015, 73, 142–148. [Google Scholar] [CrossRef] [PubMed]
  26. Vonk, J.; Kukačka, J.; Steinkamp, P.; de Wit, J.; Voskuil, F.; Hooghiemstra, W.; Bader, M.; Jüstel, D.; Ntziachristos, V.; van Dam, G. Multispectral Optoacoustic Tomography for In Vivo Detection of Lymph Node Metastases in Oral Cancer Patients using an EGFR-Targeted Contrast Agent and Intrinsic Tissue Contrast: A Proof-of-Concept Study. Photoacoustics 2022, 26, 100362. [Google Scholar] [CrossRef]
  27. Liu, C.; Chen, J.; Zhang, Y.; Zhu, J.; Wang, L. Five-Wavelength Optical-Resolution Photoacoustic Microscopy of Blood and Lymphatic Vessels. Adv. Photonics 2021, 3, 016002. [Google Scholar] [CrossRef]
  28. Forbrich, A.; Heinmiller, A.; Zemp, R.J. Photoacoustic Imaging of Lymphatic Pumping. J. Biomed. Opt. 2017, 22, 106003. [Google Scholar] [CrossRef]
  29. Nagaoka, R.; Tabata, T.; Yoshizawa, S.; Umemura, S.-i.; Saijo, Y. Visualization of Murine Lymph Vessels using Photoacoustic Imaging with Contrast Agents. Photoacoustics 2018, 9, 39–48. [Google Scholar] [CrossRef]
  30. Lee, D.; Beack, S.; Yoo, J.; Kim, S.K.; Lee, C.; Kwon, W.; Hahn, S.K.; Kim, C. In Vivo Photoacoustic Imaging of Livers Using Biodegradable Hyaluronic Acid-Conjugated Silica Nanoparticles. Adv. Funct. Mater. 2018, 28, 1800941. [Google Scholar] [CrossRef]
  31. Wang, Z.; Lee, C.S.; Waltzer, W.C.; Liu, J.; Xie, H.; Yuan, Z.; Pan, Y. In vivo Bladder Imaging with Microelectromechanical-Systems-Based Endoscopic Spectral Domain Optical Coherence Tomography. J. Biomed. Opt. 2007, 12, 034009. [Google Scholar] [CrossRef] [PubMed]
  32. Ding, Y.; Park, B.; Ye, J.; Wang, X.; Liu, G.; Yang, X.; Jiang, Z.; Han, M.; Fan, Y.; Song, J. Surfactant-Stripped Semiconducting Polymer Micelles for Tumor Theranostics and Deep Tissue Imaging in the NIR-II Window. Small 2022, 18, 2104132. [Google Scholar] [CrossRef] [PubMed]
  33. Wang, S.; Lin, J.; Wang, T.; Chen, X.; Huang, P. Recent Advances in Photoacoustic Imaging for Deep-Tissue Biomedical Applications. Theranostics 2016, 6, 2394. [Google Scholar] [CrossRef] [PubMed]
  34. Chitgupi, U.; Nyayapathi, N.; Kim, J.; Wang, D.; Sun, B.; Li, C.; Carter, K.; Huang, W.C.; Kim, C.; Xia, J. Surfactant-Stripped Micelles for NIR-II Photoacoustic Imaging through 12 cm of Breast Tissue and Whole Human Breasts. Adv. Mater. 2019, 31, 1902279. [Google Scholar] [CrossRef] [PubMed]
  35. Singh, S.; Giammanco, G.; Hu, C.-H.; Bush, J.; Cordova, L.S.; Lawrence, D.J.; Moran, J.L.; Chitnis, P.V.; Veneziano, R. Size-Tunable ICG-based Contrast Agent Platform for Targeted Near-Infrared Photoacoustic Imaging. Photoacoustics 2022, 29, 100437. [Google Scholar] [CrossRef]
  36. Wei, W.; Zhang, X.; Zhang, S.; Wei, G.; Su, Z. Biomedical and Bioactive Engineered Nanomaterials for Targeted Tumor Photothermal Therapy: A Review. Mater. Sci. Eng. C 2019, 104, 109891. [Google Scholar] [CrossRef]
  37. Beztsinna, N.; Tsvetkova, Y.; Jose, J.; Rhourri-Frih, B. Photoacoustic Imaging of Tumor Targeting with Riboflavin-Functionalized Theranostic Nanocarriers. Int. J. Nanomed. 2017, 12, 3813. [Google Scholar] [CrossRef]
  38. He, L.; Nie, T.; Xia, X.; Liu, T.; Huang, Y.; Wang, X.; Chen, T. Designing Bioinspired 2D MoSe2 Nanosheet for Efficient Photothermal-Triggered Cancer Immunotherapy with Reprogramming Tumor-Associated Macrophages. Adv. Funct. Mater. 2019, 29, 1901240. [Google Scholar] [CrossRef]
  39. Lin, L.-S.; Yang, X.; Niu, G.; Song, J.; Yang, H.-H.; Chen, X. Dual-Enhanced Photothermal Conversion Properties of Reduced Graphene Oxide-Coated Gold Superparticles for Light-Triggered Acoustic and Thermal Theranostics. Nanoscale 2016, 8, 2116–2122. [Google Scholar] [CrossRef]
  40. Chen, Z.; Tu, Y.; Zhang, D.; Liu, C.; Zhou, Y.; Li, X.; Wu, X.; Liu, R. A Thermosensitive Nanoplatform for Photoacoustic Imaging and NIR Light Triggered Chemo-Photothermal Therapy. Biomater. Sci. 2020, 8, 4299–4307. [Google Scholar] [CrossRef]
  41. Lin, S.; Shah, A.; Hernández-Gil, J.; Stanziola, A.; Harriss, B.I.; Matsunaga, T.O.; Long, N.; Bamber, J.; Tang, M.-X. Optically and Acoustically Triggerable Sub-Micron Phase-Change Contrast Agents for Enhanced Photoacoustic and Ultrasound Imaging. Photoacoustics 2017, 6, 26–36. [Google Scholar] [CrossRef] [PubMed]
  42. Arneth, B. Tumor Microenvironment. Medicina 2019, 56, 15. [Google Scholar] [CrossRef] [PubMed]
  43. Webb, B.A.; Chimenti, M.; Jacobson, M.P.; Barber, D.L. Dysregulated pH: A Perfect Storm for Cancer Progression. Nat. Rev. Cancer 2011, 11, 671–677. [Google Scholar] [CrossRef] [PubMed]
  44. Yin, L.; Sun, H.; Zhang, H.; He, L.; Qiu, L.; Lin, J.; Xia, H.; Zhang, Y.; Ji, S.; Shi, H. Quantitatively Visualizing Tumor-Related Protease Activity In Vivo using a Ratiometric Photoacoustic Probe. J. Am. Chem. Soc. 2019, 141, 3265–3273. [Google Scholar] [CrossRef]
  45. Olefir, I.; Tzoumas, S.; Restivo, C.; Mohajerani, P.; Xing, L.; Ntziachristos, V. Deep Learning-Based Spectral Unmixing for Optoacoustic Imaging of Tissue Oxygen Saturation. IEEE Trans. Med. Imaging 2020, 39, 3643–3654. [Google Scholar] [CrossRef]
  46. ANSI Z136.1; American National Standard for the Safe Use of Lasers. American National Standards Institute: Washington, DC, USA, 2022.
  47. Zhang, W.; Sun, X.; Huang, T.; Pan, X.; Sun, P.; Li, J.; Zhang, H.; Lu, X.; Fan, Q.; Huang, W. 1300 nm Absorption Two-Acceptor Semiconducting Polymer Nanoparticles for NIR-II Photoacoustic Imaging System Guided NIR-II Photothermal Therapy. Chem. Commun. 2019, 55, 9487–9490. [Google Scholar] [CrossRef]
  48. Lee, H.; Park, S.M.; Park, J.; Cho, S.-W.; Han, S.; Ahn, J.; Cho, S.; Kim, C.; Kim, C.-S.; Kim, J. Transportable Multispectral Optical-Resolution Photoacoustic Microscopy using Stimulated Raman Scattering Spectrum. IEEE Trans. Instrum. Meas. 2024, 73, 4502309. [Google Scholar] [CrossRef]
  49. Lee, H.; Han, S.; Park, S.; Cho, S.; Yoo, J.; Kim, C.; Kim, J. Ultrasound-Guided Breath-Compensation in Single-Element Photoacoustic Imaging for Three-Dimensional Whole-Body Images of Mice. Front. Phys. 2022, 10, 457. [Google Scholar] [CrossRef]
  50. Choi, S.; Yang, J.; Lee, S.Y.; Kim, J.; Lee, J.; Kim, W.J.; Lee, S.; Kim, C. Deep Learning Enhances Multiparametric Dynamic Volumetric Photoacoustic Computed Tomography In Vivo (DL-PACT). Adv. Sci. 2023, 10, 2202089. [Google Scholar] [CrossRef]
  51. Cho, S.; Kim, M.; Ahn, J.; Kim, Y.; Lim, J.; Park, J.; Kim, H.H.; Kim, W.J.; Kim, C. An Ultrasensitive and Broadband Transparent Ultrasound Transducer for Ultrasound and Photoacoustic Imaging In-Vivo. Nat. Commun. 2024, 15, 1444. [Google Scholar] [CrossRef]
  52. Yao, J.; Wang, L.V. Photoacoustic Microscopy. Laser Photonics Rev. 2013, 7, 758–778. [Google Scholar] [CrossRef] [PubMed]
  53. Park, J.; Choi, S.; Knieling, F.; Clingman, B.; Bohndiek, S.; Wang, L.V.; Kim, C. Clinical Translation of Photoacoustic Imaging. Nat. Rev. Bioeng. 2024. [Google Scholar] [CrossRef]
  54. Kim, J.; Anthony, M.Y.; Kubelick, K.P.; Emelianov, S.Y. Gold Nanoparticles Conjugated with DNA Aptamer for Photoacoustic Detection of Human Matrix Metalloproteinase-9. Photoacoustics 2022, 25, 100307. [Google Scholar] [CrossRef]
  55. Yuan, Y.Y.; Mao, C.Q.; Du, X.J.; Du, J.Z.; Wang, F.; Wang, J. Surface Charge Switchable Nanoparticles based on Zwitterionic Polymer for Enhanced Drug Delivery to Tumor. Adv. Mater. 2012, 24, 5476–5480. [Google Scholar] [CrossRef] [PubMed]
  56. Nam, J.; Won, N.; Jin, H.; Chung, H.; Kim, S. pH-Induced Aggregation of Gold Nanoparticles for Photothermal Cancer Therapy. J. Am. Chem. Soc. 2009, 131, 13639–13645. [Google Scholar] [CrossRef]
  57. Chen, Y.; Xu, C.; Cheng, Y.; Cheng, Q. Photostability Enhancement of Silica-Coated Gold Nanostars for Photoacoustic Imaging Guided Photothermal Therapy. Photoacoustics 2021, 23, 100284. [Google Scholar] [CrossRef]
  58. Torchilin, V.P. Multifunctional, Stimuli-Sensitive Nanoparticulate Systems for Drug Delivery. Nat. Rev. Drug Discov. 2014, 13, 813–827. [Google Scholar] [CrossRef]
  59. Cao, Y.; Dumani, D.S.; Hallam, K.A.; Emelianov, S.Y.; Ran, H. Real-Time Monitoring of NIR-Triggered Drug Release from Phase-Changeable Nanodroplets by Photoacoustic/Ultrasound Imaging. Photoacoustics 2023, 30, 100474. [Google Scholar] [CrossRef]
  60. Yang, Y.; Fan, Z.; Zheng, K.; Shi, D.; Su, G.; Ge, D.; Zhao, Q.; Fu, X.; Hou, Z. A Novel Self-Targeting Theranostic Nanoplatform for Photoacoustic Imaging-Monitored and Enhanced Chemo-Sonodynamic Therapy. J. Mater. Chem. B 2021, 9, 5547–5559. [Google Scholar] [CrossRef]
  61. Sarma, T.; Kim, G.; Sen, S.; Cha, W.-Y.; Duan, Z.; Moore, M.D.; Lynch, V.M.; Zhang, Z.; Kim, D.; Sessler, J.L. Proton-Coupled Redox Switching in an Annulated π-Extended Core-Modified Octaphyrin. J. Am. Chem. Soc. 2018, 140, 12111–12119. [Google Scholar] [CrossRef]
  62. Song, J.; Kim, J.; Hwang, S.; Jeon, M.; Jeong, S.; Kim, C.; Kim, S. “Smart” Gold Nanoparticles for Photoacoustic Imaging: An Imaging Contrast Agent Responsive to the Cancer Microenvironment and Signal Amplification via pH-Induced Aggregation. Chem. Commun. 2016, 52, 8287–8290. [Google Scholar] [CrossRef] [PubMed]
  63. Zhang, R.; Wang, L.; Wang, X.; Jia, Q.; Chen, Z.; Yang, Z.; Ji, R.; Tian, J.; Wang, Z. Acid-Induced In Vivo Assembly of Gold Nanoparticles for Enhanced Photoacoustic Imaging-Guided Photothermal Therapy of Tumors. Adv. Healthc. Mater. 2020, 9, 2000394. [Google Scholar] [CrossRef]
  64. Cheng, X.; Zhou, X.; Xu, J.; Sun, R.; Xia, H.; Ding, J.; Chin, Y.E.; Chai, Z.; Shi, H.; Gao, M. Furin Enzyme and pH Synergistically Triggered Aggregation of Gold Nanoparticles for Activated Photoacoustic Imaging and Photothermal Therapy of Tumors. Anal. Chem. 2021, 93, 9277–9285. [Google Scholar] [CrossRef]
  65. Li, S.; Lui, K.-H.; Tsoi, T.-H.; Lo, W.-S.; Li, X.; Hu, X.; Tai, W.C.-S.; Hung, C.H.-L.; Gu, Y.-J.; Wong, W.-T. pH-Responsive Targeted Gold Nanoparticles for In Vivo Photoacoustic Imaging of Tumor Microenvironments. Nanoscale Adv. 2019, 1, 554–564. [Google Scholar] [CrossRef] [PubMed]
  66. Li, S.; Lui, K.-H.; Li, X.; Fang, X.; Lo, W.-S.; Gu, Y.-J.; Wong, W.-T. pH-Triggered poly (ethylene glycol)–poly (lactic acid/glycolic acid)/croconaine Nanoparticles-Assisted Multiplexed Photoacoustic Imaging and Enhanced Photothermal Cancer Therapy. ACS Appl. Bio Mater. 2021, 4, 4152–4164. [Google Scholar] [CrossRef]
  67. Wu, J.; You, L.; Chaudhry, S.T.; He, J.; Cheng, J.-X.; Mei, J. Ambient Oxygen-Doped Conjugated Polymer for pH-Activatable Aggregation-Enhanced Photoacoustic Imaging in the Second Near-Infrared Window. Anal. Chem. 2021, 93, 3189–3195. [Google Scholar] [CrossRef] [PubMed]
  68. Zhong, Y.; Zou, Y.; Liu, L.; Li, R.; Xue, F.; Yi, T. pH-Responsive Ag2S Nanodots Loaded with Heat Shock Protein 70 Inhibitor for Photoacoustic Imaging-Guided Photothermal Cancer Therapy. Acta Biomater. 2020, 115, 358–370. [Google Scholar] [CrossRef]
  69. Yang, Z.; Cheng, R.; Zhao, C.; Sun, N.; Luo, H.; Chen, Y.; Liu, Z.; Li, X.; Liu, J.; Tian, Z. Thermo-and pH-Dual Responsive Polymeric Micelles with Upper Critical Solution Temperature Behavior for Photoacoustic Imaging-Guided Synergistic Chemo-Photothermal Therapy Against Subcutaneous and Metastatic Breast Tumors. Theranostics 2018, 8, 4097. [Google Scholar] [CrossRef]
  70. Xu, C.; Wang, Y.; Wang, E.; Yan, N.; Sheng, S.; Chen, J.; Lin, L.; Guo, Z.; Tian, H.; Chen, X. Effective Eradication of Tumors by Enhancing Photoacoustic-Imaging-Guided Combined Photothermal Therapy and Ultrasonic Therapy. Adv. Funct. Mater. 2021, 31, 2009314. [Google Scholar] [CrossRef]
  71. Lee, H.; Park, B.; Lee, J.; Kang, Y.; Han, M.; Lee, J.; Kim, C.; Kim, W.J. Transcytosis-Inducing Multifunctional Albumin Nanomedicines with Deep Penetration Ability for Image-Guided Solid Tumor Treatment. Small 2023, 19, 2303668. [Google Scholar] [CrossRef]
  72. Tian, Q.; Li, Y.; Jiang, S.; An, L.; Lin, J.; Wu, H.; Huang, P.; Yang, S. Tumor pH-Responsive Albumin/Polyaniline Assemblies for Amplified Photoacoustic Imaging and Augmented Photothermal Therapy. Small 2019, 15, 1902926. [Google Scholar] [CrossRef] [PubMed]
  73. Chen, J.; Sedgwick, A.C.; Sen, S.; Ren, Y.; Sun, Q.; Chau, C.; Arambula, J.F.; Sarma, T.; Song, L.; Sessler, J.L. Expanded Porphyrins: Functional Photoacoustic Imaging Agents that Operate in the NIR-II Region. Chem. Sci. 2021, 12, 9916–9921. [Google Scholar] [CrossRef] [PubMed]
  74. Chen, Q.; Liu, X.; Chen, J.; Zeng, J.; Cheng, Z.; Liu, Z. A Self-Assembled Albumin-Based Nanoprobe for In Vivo Ratiometric Photoacoustic pH Imaging. Adv. Mater. 2015, 27, 6820–6827. [Google Scholar] [CrossRef]
  75. Yang, Z.; Song, J.; Tang, W.; Fan, W.; Dai, Y.; Shen, Z.; Lin, L.; Cheng, S.; Liu, Y.; Niu, G. Stimuli-Responsive Nanotheranostics for Real-Time Monitoring Drug Release by Photoacoustic Imaging. Theranostics 2019, 9, 526. [Google Scholar] [CrossRef]
  76. Liu, X.; Xiang, C.; Lv, Y.; Xiang, J.; Ma, G.; Li, C.; Hu, Y.; Guo, C.; Sun, H.; Cai, L. Preparation of Near-Infrared Photoacoustic Imaging and Photothermal Treatment Agent for Cancer using a Modifiable Acid-Triggered Molecular Platform. Analyst 2024, 149, 3064–3072. [Google Scholar] [CrossRef]
  77. Kim, J.; Park, B.; Ha, J.; Steinberg, I.; Hooper, S.M.; Jeong, C.; Park, E.-Y.; Choi, W.; Liang, T.; Bae, J.-S.; et al. Multiparametric Photoacoustic Analysis of Human Thyroid Cancers In Vivo. Cancer Res. 2021, 81, 4849–4860. [Google Scholar] [CrossRef]
  78. Noltes, M.E.; Bader, M.; Metman, M.J.; Vonk, J.; Steinkamp, P.J.; Kukačka, J.; Westerlaan, H.E.; Dierckx, R.A.; van Hemel, B.M.; Brouwers, A.H. Towards In Vivo Characterization of Thyroid Nodules Suspicious for Malignancy using Multispectral Optoacoustic Tomography. Eur. J. Nucl. Med. Mol. Imaging 2023, 50, 2736–2750. [Google Scholar] [CrossRef] [PubMed]
  79. Horiguchi, A.; Shinchi, M.; Nakamura, A.; Wada, T.; Ito, K.; Asano, T.; Shinmoto, H.; Tsuda, H.; Ishihara, M. Pilot Study of Prostate Cancer Angiogenesis Imaging using a Photoacoustic Imaging System. Urology 2017, 108, 212–219. [Google Scholar] [CrossRef]
  80. Kukačka, J.; Metz, S.; Dehner, C.; Muckenhuber, A.; Paul-Yuan, K.; Karlas, A.; Fallenberg, E.M.; Rummeny, E.; Jüstel, D.; Ntziachristos, V. Image Processing Improvements Afford Second-Generation Handheld Optoacoustic Imaging of Breast Cancer Patients. Photoacoustics 2022, 26, 100343. [Google Scholar] [CrossRef]
  81. Ivankovic, I.; Merčep, E.; Schmedt, C.-G.; Deán-Ben, X.L.; Razansky, D. Real-Time Volumetric Assessment of the Human Carotid Artery: Handheld Multispectral Optoacoustic Tomography. Radiology 2019, 291, 45–50. [Google Scholar] [CrossRef]
  82. Lin, L.; Hu, P.; Shi, J.; Appleton, C.M.; Maslov, K.; Li, L.; Zhang, R.; Wang, L.V. Single-Breath-Hold Photoacoustic Computed Tomography of the Breast. Nat. Commun. 2018, 9, 2352. [Google Scholar] [CrossRef] [PubMed]
  83. Jeng, G.-S.; Li, M.-L.; Kim, M.; Yoon, S.J.; Pitre Jr, J.J.; Li, D.S.; Pelivanov, I.; O’Donnell, M. Real-Time Interleaved Spectroscopic Photoacoustic and Ultrasound (PAUS) Scanning with Simultaneous Fluence Compensation and Motion Correction. Nat. Commun. 2021, 12, 716. [Google Scholar] [CrossRef] [PubMed]
  84. Shi, M.; Vercauteren, T.; Xia, W. Learning-based Sound Speed Estimation and Aberration Correction for Linear-Array Photoacoustic Imaging. Photoacoustics 2024, 38, 100621. [Google Scholar] [CrossRef]
Figure 2. Schematic illustration for the PA signal-enhancing mechanisms of the pH-sensitive sensors in the tumor microenvironment. PA, photoacoustic.
Chemosensors 12 00257 g002
Figure 3. Representative pH-sensitive sensors that aggregate in an acidic tumor microenvironment. (a) Schematic illustration of a pH-sensitive AuNP that aggregates in acidic pH by electrostatic attraction. (b) Optical absorption spectra of AuNP conjugates along exposure time at pH 5.5. (c) PA images of AuNP conjugates, which were co-incubated with HeLa breast cancer cells and NIH 3T3 fibroblast cells. (d) Optical absorption of AuNP-based MUA-TMA conjugates at pH 6.5 (black) and 7.4 (red). Insets are TEM images of AuNP conjugates. (e) PA images of AuNP conjugates after injection into tumors. (f) PA signal enhancement in tumors with AuNP conjugates and control AuNPs. (g) Schematic illustration of AuNPs that synergistically aggregate by the furin enzyme and the acidic conditions. (h) TEM images of AuNP conjugates with and without the furin enzyme. (i) Optical absorption spectra of AuNP conjugates after triggering furin and acidic conditions. (j) PA ratio at tumor after injection of AuNP conjugates. PA, photoacoustic; TEM, transmission electron microscopy; AuNP, gold nanoparticle; MUA, mercaptoundecanoic acid; TMA, (10-mercaptodecyl)trimethylammonium bromide; Au-MUA5-TMA5, Au conjugates with 5:5 ratio of MUA to TMA; RVRR, Arg-Val-Arg-Arg peptide. The images are reproduced with permission from [62,63,64].
Chemosensors 12 00257 g003
Figure 4. PA signal-enhancing nanoparticles that aggregate in response to low pH levels. (a) TEM images of the surface-modified gold nanoparticles at different pH levels of phosphate buffer solutions. (b) Normalized optical absorption spectra of the nanoparticles after 1 h incubation. (c) PA images of the nanoparticles contained in polyethylene tubes. (d) Schematic illustration for acid-induced aggregation mechanism of copolymer nanoparticle that absorbs light in the NIR-II region. (e) PA amplitudes of the doped copolymer nanoparticle at different pH levels. (f) Contrast-enhanced PA images of mice after local injection of the doped copolymer nanoparticle into muscle and tumor area. Dashed circles indicate enhanced PA signals from the doped copolymer nanoparticle. PA, photoacoustic; US, ultrasound; TEM, transmission electron microscopy; NIR-II, second near-infrared. The images are reproduced with permission from [65,67].
Chemosensors 12 00257 g004
Figure 5. Drug-release nanoparticles triggered by an acidic tumor microenvironment. (a) Schematic illustration for the synthesis of pH-responsive nanoparticles designed to release encapsulated inhibitors of heat shock proteins. (b) Quercetin release ratio of QE-PEG-Ag2S nanoparticles at different pH levels. (c) Overlaid PA and US images of the tumor region before and after injection of QE-PEG-Ag2S nanoparticles. White dashed circles indicate the tumor region. (d) Photographs of HepG2 liver tumor-bearing mice after different treatment conditions. An 808 nm laser with a fluence of 1.5 W/cm2 was irradiated for 10 min. (e) Schematic illustration for the synthesis of the pH-responsive micellar system that responds to both pH levels and external heat generated by NIR laser irradiation. (f) PA images of tumor 24 h after injection of different drug formulations. (g) Photographs of excised 4T1 breast tumors at the end point of treatment. Phototherapy was performed with an 808 nm laser at 1.0 W/cm2 for 5 min. PA, photoacoustic; US, ultrasound; AG2S, silver sulfide; NaCl, sodium chloride; PEG-PAE, poly(ethylene glycol)5k-poly(β-aminoesters)10k; mPEG-PAAV, amphiphilic poly(ethylene glycol)-b-poly(acrylamide-co-acrylonitrile-co-vinylimidazole); DOX, doxorubicin; T, temperature; L, laser illumination; NIR, near-infrared; UCST, upper critical solution temperature. The images are reproduced with permission from [68,69].
Chemosensors 12 00257 g005
Figure 6. Drug-release nanoparticles for effective phototherapy. (a) Schematic illustration for tumor treatment strategy combining synergistic PTT and UST using two nanoparticles: AuNRs for PA contrast and CaNPs for releasing CO2 bubbles. (b) PA amplitude of the mixture of the nanoparticles at different pH conditions. (c) Contrast-enhanced PA images of tumor region after injection of the two nanoparticles. (d) Schematic illustration for the mechanism of the deep penetrating nanoparticles for effective tumor treatment. (e) PA images of the whole body of mice after injection of the mAlb-820@CaP nanoparticles and free IR820 dyes. White dashed areas indicate tumor regions delineated by corresponding ultrasound images. (f) Normalized PA amplitudes of tumor region, measured before, 4 h after, and 24 h after injection. PA, photoacoustic; PTT, photothermal therapy; UST, ultrasound therapy; AuNR, gold nanorod; CaNP, carbonate nanoparticle; CO2, carbon dioxide; PEI, polyethyleneimine; mPEG-CHO, aldehyde-modified polyethylene glycol; mPEG-PEI, polyethylene glycol- and polyethyleneimine modification; SDS, sodium dodecyl sulfate; CaCl2∙2H2O, calcium chloride dihydrate; NH4HCO3, ammonium bicarbonate; mAlb-820, modified albumin-IR820 complex; cAlb-820, cationic albumin-IR820 complex; CaP, calcium phosphate; Ca2+, calcium ion. The images are reproduced with permission from [70,71].
Chemosensors 12 00257 g006
Figure 7. pH-responsive nanoparticles that exhibit redshift of absorption spectrum under acidic conditions. (a) Schematic illustration of pH-responsive BSA-PANI assemblies, which show enhanced PA contrast and PTT efficiency. (b) Absorption spectra of BSA-PANI assemblies dispersed in buffer solutions with different pH values. (c) PA images achieved before and after injection of BSA-PANI assemblies into tumor-bearing mice. (d) Relative tumor volume of different treatment groups. (e) Schematic illustration of the preparation of OctaNPs, which generate strong PA signals at 1200 nm. (f) Quantified PA amplitudes at varying pH values in tetrahydrofuran. (g) PA images of stomach and tumor region before and after injection of OctaNPs. PA, photoacoustic; US, ultrasound; PTT, photothermal therapy; BSA, bovine serum albumin; PANI, polyaniline; PBS, phosphate-buffered saline; L, laser illumination; OctaNP, nanoparticles synthesized from octaphyrin 4; DSPE-PEG, 1,2-distearoyl-sn-glycero-3-phosphoethanolamine-poly(ethylene glycol); H+, hydrogen ion. The images are reproduced with permission from [72,73].
Chemosensors 12 00257 g007
Figure 8. Representative ratiometric PA analysis of pH-sensitive nanoparticles in tumor acidic condition. (a) Schematic illustration for the synthesis of C-HSA-BPOx-IR825 nanoparticles and its response in a tumor acidic environment. (b) Optical absorption spectra of C-HSA-BPOx-IR825 nanoparticles measured in buffers with different pH values. (c) PA images, (d) PA amplitudes, and (e) PA ratio of 4T1 breast tumors in mice after intravenous injection of C-HSA-BPOx-IR825 nanoparticles. (f) Schematic illustration for PA response of THPDINs in a tumor acidic environment. (g) Optical absorption spectra of the THPDINs with different pH values. Red dashed lines indicate representative wavelengths: (1) 500, (2) 680, and (3) 825 nm. (h) PA images, (i) PA amplitude increase, and (j) PA ratio of U87MG glioblastoma in a tumor acidic environment after injection of THPDINs. PA, photoacoustic; PA680, PA signal at 680 nm; PA825 PA signal at 825 nm; HSA, human serum albumin; BPOx, benzo[a]phenoxazine; C-HSA-BPOx-IR825, covalent cross-link induced albumin-based nanoparticles; THPDIN, perylene diimide-based theranostic platform. The images are reproduced with permission from [74,75].
Chemosensors 12 00257 g008
Table 1. Summary of pH-sensitive PA agents that exhibit absorption shift by aggregation in tumor acidic microenvironment. PA, photoacoustic; λ a , peak absorption wavelength; λ e x , excitation wavelength for PA imaging; AR-PAM, acoustic resolution PA microscopy; PACT, PA computed tomography; MUA, mercaptoundecanoic acid; TMA, trimethylammonium bromide; RVRR, Arg-Val-Arg-Arg; PPE, polyphenylene Ether.
BasepH-Sensitive MaterialSize [nm] (pH) λ a [nm] (pH)PA ImagingRef.
NormalTumorNormalTumorConfiguration λ e x [nm]Application
AuCitraconic amide10
(7.4)
-520
(7.4)
-AR-PAM680HeLa
breast tumor
[62]
AuMUA-TMA15
(7.4)
180
(6.5)
524
(7.4)
650–700
(6.5)
PACT808U87MG
glioblastoma
[63]
AuRVRR63
(7.2)
327
(5.5)
520
(7.2)
700–900
(5.5)
PACT750HCT-116
colon tumor
[64]
AuCitraconic amide16.4
(7.4)
≥500
(5.8)
550–600
(7.4)
650
(5.8)
PACT680, 800U87MG
glioblastoma
[65]
CroconaineCroconaine185
(7.4)
190
(6.5)
630
(7.4)
815
(6.5)
PACT770MDA-MB-231
breast tumor
[66]
PPEDoped PPE-4000
(6)
1150
(7.4)
1100
(6)
PACT1064PC-3
prostate tumor
[67]
Table 2. Summary of pH-sensitive nanoparticles that release PA contrast and drugs in tumor acidic microenvironment. PA, photoacoustic; λ t h , wavelength of therapeutic laser illumination; λ e x , excitation wavelength for PA imaging; AR-PAM, acoustic-resolution PA microscopy; PACT, PA computed tomography; Ag2S, silver sulfide; DOX, doxorubicin; Au, gold; mAlb, modified albumin; PEG, polyethylene glycol; mPEG-PAVV, amphiphilic poly(ethylene glycol)-b-poly(acrylamide-co-acrylonitirle-co-vinylimidazole); DMMA, dimethyl maleic amide.
pH-Sensitive NanoparticlesTherapyPA ImagingRef.
BasepH-Sensitive Material λ t h
[nm]
Power
[W/cm2]
Time
[min]
Configuration λ e x
[nm]
Application
Ag2SPEG8081.510PACT680HepG2
liver tumor
[68]
DOX + IR780mPEG-PAAV8081.05PACT7204T1
breast tumor
[69]
AuPEG8081.06PACT830MCF-7
breast tumor
[70]
mAlbDMMA8081.05AR-PAM8304T1
breast tumor
[71]
Table 3. Summary of pH-sensitive PA agents that exhibit absorption shift by protonation in tumor acidic microenvironment. PA, photoacoustic; λ a , peak absorption wavelength; λ e x , exciation wavelength for PA imaging; PANI, polyaniline; PACT, PA computed tomography; BPOx, benzo[a]phenoxazine; PDI, perylene diimide.
Base λ a [nm] (pH)PA ImagingRef.
NormalTumorConfiguration λ e x Application
PANI570
(8)
800
(3)
PACT-4T1
breast tumor
[72]
Octaphyrin1200
(7.4)
1200
(5)
PACT1200HepG2
liver tumor
[73]
BPOx, IR825580
(7)
620
(5.5)
PACT680, 8254T1
breast tumor
[74]
PDI450
(7.4)
500
(5)
PACT680, 825U87MG
glioblastoma
[75]
Heptamethine cyanine dye680
(10)
760
(4)
PACT680, 760MCF-7
breast tumor
[76]
Disclaimer/Publisher’s Note: The statements, opinions and data contained in all publications are solely those of the individual author(s) and contributor(s) and not of MDPI and/or the editor(s). MDPI and/or the editor(s) disclaim responsibility for any injury to people or property resulting from any ideas, methods, instructions or products referred to in the content.

